Abstract
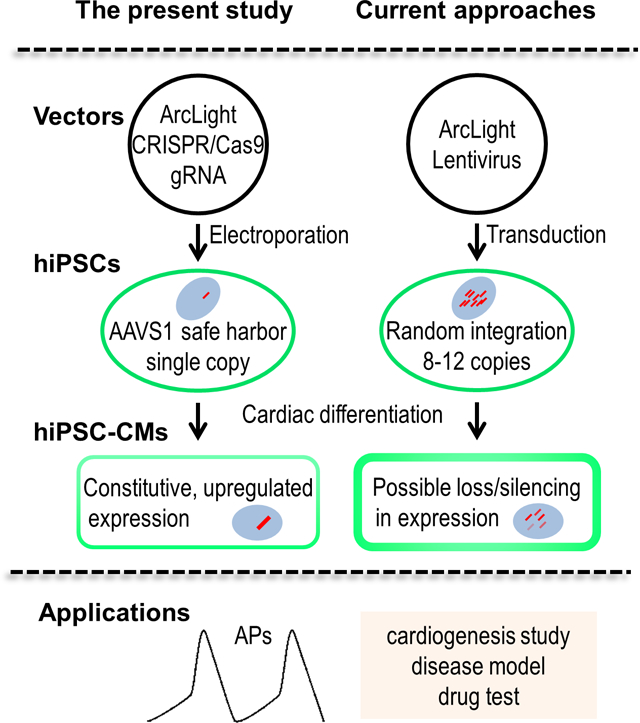
Genetically encoded fluorescent voltage indicators (GEVIs), such as ArcLight, have been used to faithfully report action potentials (APs) in human induced pluripotent stem cell-derived cardiomyocytes (hiPSC-CMs). However, the ArcLight expression, in all cases, relied on high number of lentiviral vector-mediated random genome integrations (8–12 copy/cell), raising concerns such as gene disruption and alteration of global and local gene expression, as well as loss or silencing of reporter genes after differentiation. Here, we report the use of CRISPR/Cas9 nuclease technique to develop a hiPSC line stably expressing ArcLight from the AAVS1 safe harbor locus. The hiPSC line retained proliferative ability with a growth rate similar to its parental strain. Optical recording with conventional epifluorescence microscopy allowed the detection of APs as early as 21 days post-differentiation, and could be repeatedly monitored for at least 5 months. Moreover, quantification and analysis of the APs of ArcLight-CMs identified two distinctive subtypes: a group with high frequency of spontaneous APs of small amplitudes that were pacemaker-like CMs and a group with low frequency of automaticity and large amplitudes that resembled the working CMs. Compared to FluoVolt voltage sensitive dye, although dimmer, the ArcLight reporter exhibited better optical performance in terms of phototoxicity and photostability with comparable sensitivities and signal-to-noise ratios (SNR). The hiPSC line with targeted ArcLight engineering design represents a useful tool for studying cardiac development or hiPSC-derived cardiac disease models, and drug testing.
Keywords: Human induced pluripotent stem cells, CRISPR/Cas9, Genetically encoded voltage indicators, HiPSC-derived cardiomyocytes, Action potential, Optical recording
Graphical Abstract
INTRODUCTION
The advent of human induced pluripotent stem cell (hiPSC) technology has had a profound impact on the study of stem cell biology, driving regenerative medicine to a new frontier [1]. HiPSCs are reprogrammed from somatic cells and capable of differentiating into any cell type of the human body [2, 3]. Over the years, significant progress has been made to generate relatively pure cardiomyocytes from a cultured monolayer of hiPSCs through stage-specific manipulation of the Wnt/β-catenin signaling pathway under defined conditions [4, 5]. HiPSC-derived cardiomyocytes (hiPSC-CMs) generated using these small molecule-based protocols hold great potential for heart disease modeling [6–8], drug screening [9–11], and cell-based therapies [12–15]. Ease of functional assessment of electrophysiology of these cells would facilitate characterization and studies of these cells for the applications aforementioned.
Traditionally cardiac electrophysiology is assessed using patch-clamps or electrodes that allow direct, high-fidelity measurement of ionic currents or action potentials (APs) [16, 17]. While patch-clamp technique is still regarded as the gold standard for cellular electrophysiology, it is not suitable for high throughput and longitudinal monitoring of APs of hiPSC-CMs due to its labor intensive and invasive nature. Non-invasive optical mapping with voltage-sensitive dyes, such as FluoVolt [18, 19], may generate toxic metabolites that cause phototoxicity and limit repeated long-term recordings [20, 21].The burgeoning field of genetically encoded voltage indicators (GEVIs), on the other hand, offers an alternative strategy for cardiac AP assessment, with the possibility of subcellular optical mapping [22]. ArcLight, currently one of the most advanced GEVIs, originally developed by fusing a voltage-sensing domain from Ciona intestinalis (Ci-VSP) and a super ecliptic pHluorin with a point mutation A227D [23], has been used in several studies to faithfully report transmembrane potentials in human pluripotent stem cell (hPSC)-derived CMs [24–27]; however, in all cases the ArcLight expression depended on successful lentiviral transductions. While lentivirus provides ease of delivery and high expression under viral promoter [28], it contains transgenes that can randomly integrate into the host genome, potentially disrupting the genome or causing unpredictable results. Notably, lentiviral vector-mediated ArcLight transfer in hiPSCs could become silenced during and/or after differentiation [24, 25, 29]; hence, the transgene expression can have unpredictable variation during the differentiation process. In addition, random integrations into the genome may also impact endogenous gene expression that could adversely affect normal cellular functions. Therefore, a hiPSC line stably expressing a GEVI, such as ArcLight, generated by site-directed insertion would be ideal for electrophysiological studies on hiPSC-CMs.
Genome engineering is a rapidly evolving field that allows targeted, user-defined genomic modifications. This technology has evolved from zinc finger nucleases (ZFNs) [30] to transcription activator-like effector nucleases (TALENs) [31], and in recent years, the exciting discovery of the clustered, regularly interspaced short palindromic repeats (CRISPR)/Cas9 with its high efficiency and relative ease in implementation [32]. In the human genome, adeno-associated virus integration site 1 (AAVS1)—a hotspot for adeno-associated virus integration in intron 1 of the protein phosphatase 1, regulatory subunit 12C (PPP1R12C) gene on chromosome 19—is considered one of the safest locus for robust expression of transgenic constructs with no or minimal effect on global and local gene expression [33]. CRISPR/Cas9 has been used to integrate genes, selective markers, or fluorescent reporters into this “safe harbor” site in embryonic and induced pluripotent stem cells [29, 34, 35]. Tools are now available from shared resources (e.g. Addgene) and commercial sources (e.g. Invitrogen), making cloning and gene transfer relatively cheaper, easier, and faster.
In the present study, we utilized CRISPR/Cas9 gene editing technique to generate a hiPSC line stably expressing ArcLight that was inserted in the AAVS1 locus. We confirmed our hypotheses that knockin of ArcLight in the AAVS1 site will not affect proliferation and pluripotency of the hiPSCs, thus, retaining differentiation capacity of the cells. We further demonstrated that the constitutive expression of this ultrasensitive voltage indicator was carried over and further upregulated after differentiation into cardiomyocytes, which allowed direct monitoring of the dynamic APs in both acute and long-term studies. Single-cell APs were recorded following differentiation of the ArcLight-expressing hiPSCs (ArcLight-hiPSCs) into CMs and enabled classification of CMs into pacemaker-like or contractile working subtypes. Finally, we demonstrated that ArcLight was more stable and less phototoxic compared to FluoVolt in hiPSC-CMs [18, 36]. Hence, CRISPR-generated ArcLight-hiPSC line with site-directed insertion of GEVI ensures ArcLight expression after differentiation into CMs without off-target effects on proliferation and differentiation, which may prove to be a valuable tool for high throughput electrophysiological assessment of hiPSC-CMs for studying cardiac development or cardiac disease models, and drug testing.
MATERIALS AND METHODS
Culture and maintenance of hiPSCs
A human iPSC line, DF6-9-9T.B, was purchased from WiCell (WiCell, Madison, MI) under contract of material transfer agreements. Cells were cultured on hESC-qualified Matrigel (Corning Inc., Corning, NY) coated plates in StemMACS iPS-Brew XF (Miltenyi Biotec, Germany) with daily medium change and passaged every 3–4 days using ReLeSR (STEMCELL Technologies, Canada) [37].
Vector construction
Primers and plasmids used in our study were listed in Table S1 and Table S2, respectively. A242-ArcLight cDNA (Addgene plasmid 36857) [23] was PCR amplified with the primers of ArcLight-F and ArcLight-R flanked with attB1 and attB2. The resulting product was subcloned into pDONR221 with BP Clonase (Invitrogen, Carlsbad, CA) to create pArcLight-DONR. A242-ArcLight within pArcLight-DONR was then inserted with LR Clonase (Invitrogen) into AAVS1 donor vector pAAVS1-P-CAG-DEST (Addgene plasmid 80490) [35] to create the destination vector pArcLight-DEST (Fig. S1). A242-ArcLight within pArcLight-DONR was also recombined with LR Clonase (Invitrogen) into lentiviral vector pLenti-CMV-Puro-DEST (Addgene plasmid 17452) [38] to generate pLV-ArcLight. All plasmids constructed were purified using miniprep or maxiprep plasmid DNA purification kits (Qiagen) and confirmed by sequencing (UCDNA Sequencing Facility, UC Davis).
Electroporation and clonal isolation and verification
To deliver plasmid DNA, we used GenePulser2 (BioRad, Hercules, CA) to transfect the hiPSCs. In brief, hiPSCs were sub-cultured in StemFlex medium (Invitrogen) to 70% confluence. Single cell solutions were obtained by Accutase (Innovative Cell Technologies, Inc, San Diego, CA) digestion and adjusted to 5×10⁶ per ml of StemFlex medium. A total of 2×10⁶ hiPSCs were electroporated with 3.0 μg pArcLight-DEST and 1.0 μg pXAT2 (the AAVS1 sgRNA and CRISPR/Cas9 nuclease co-expression vector, Addgene plasmid 80494) [35] in a chilled 0.4 cm cuvette, using an exponential decay waveform of 250 V and 750 μF capacitance (Fig. 1B). Cells were immediately seeded onto a Matrigel-coated 6-well plate after electroporation.
Figure 1. CRISPR/Cas9-Mediated targeting of ArcLight into AAVS1 in hiPSCs.
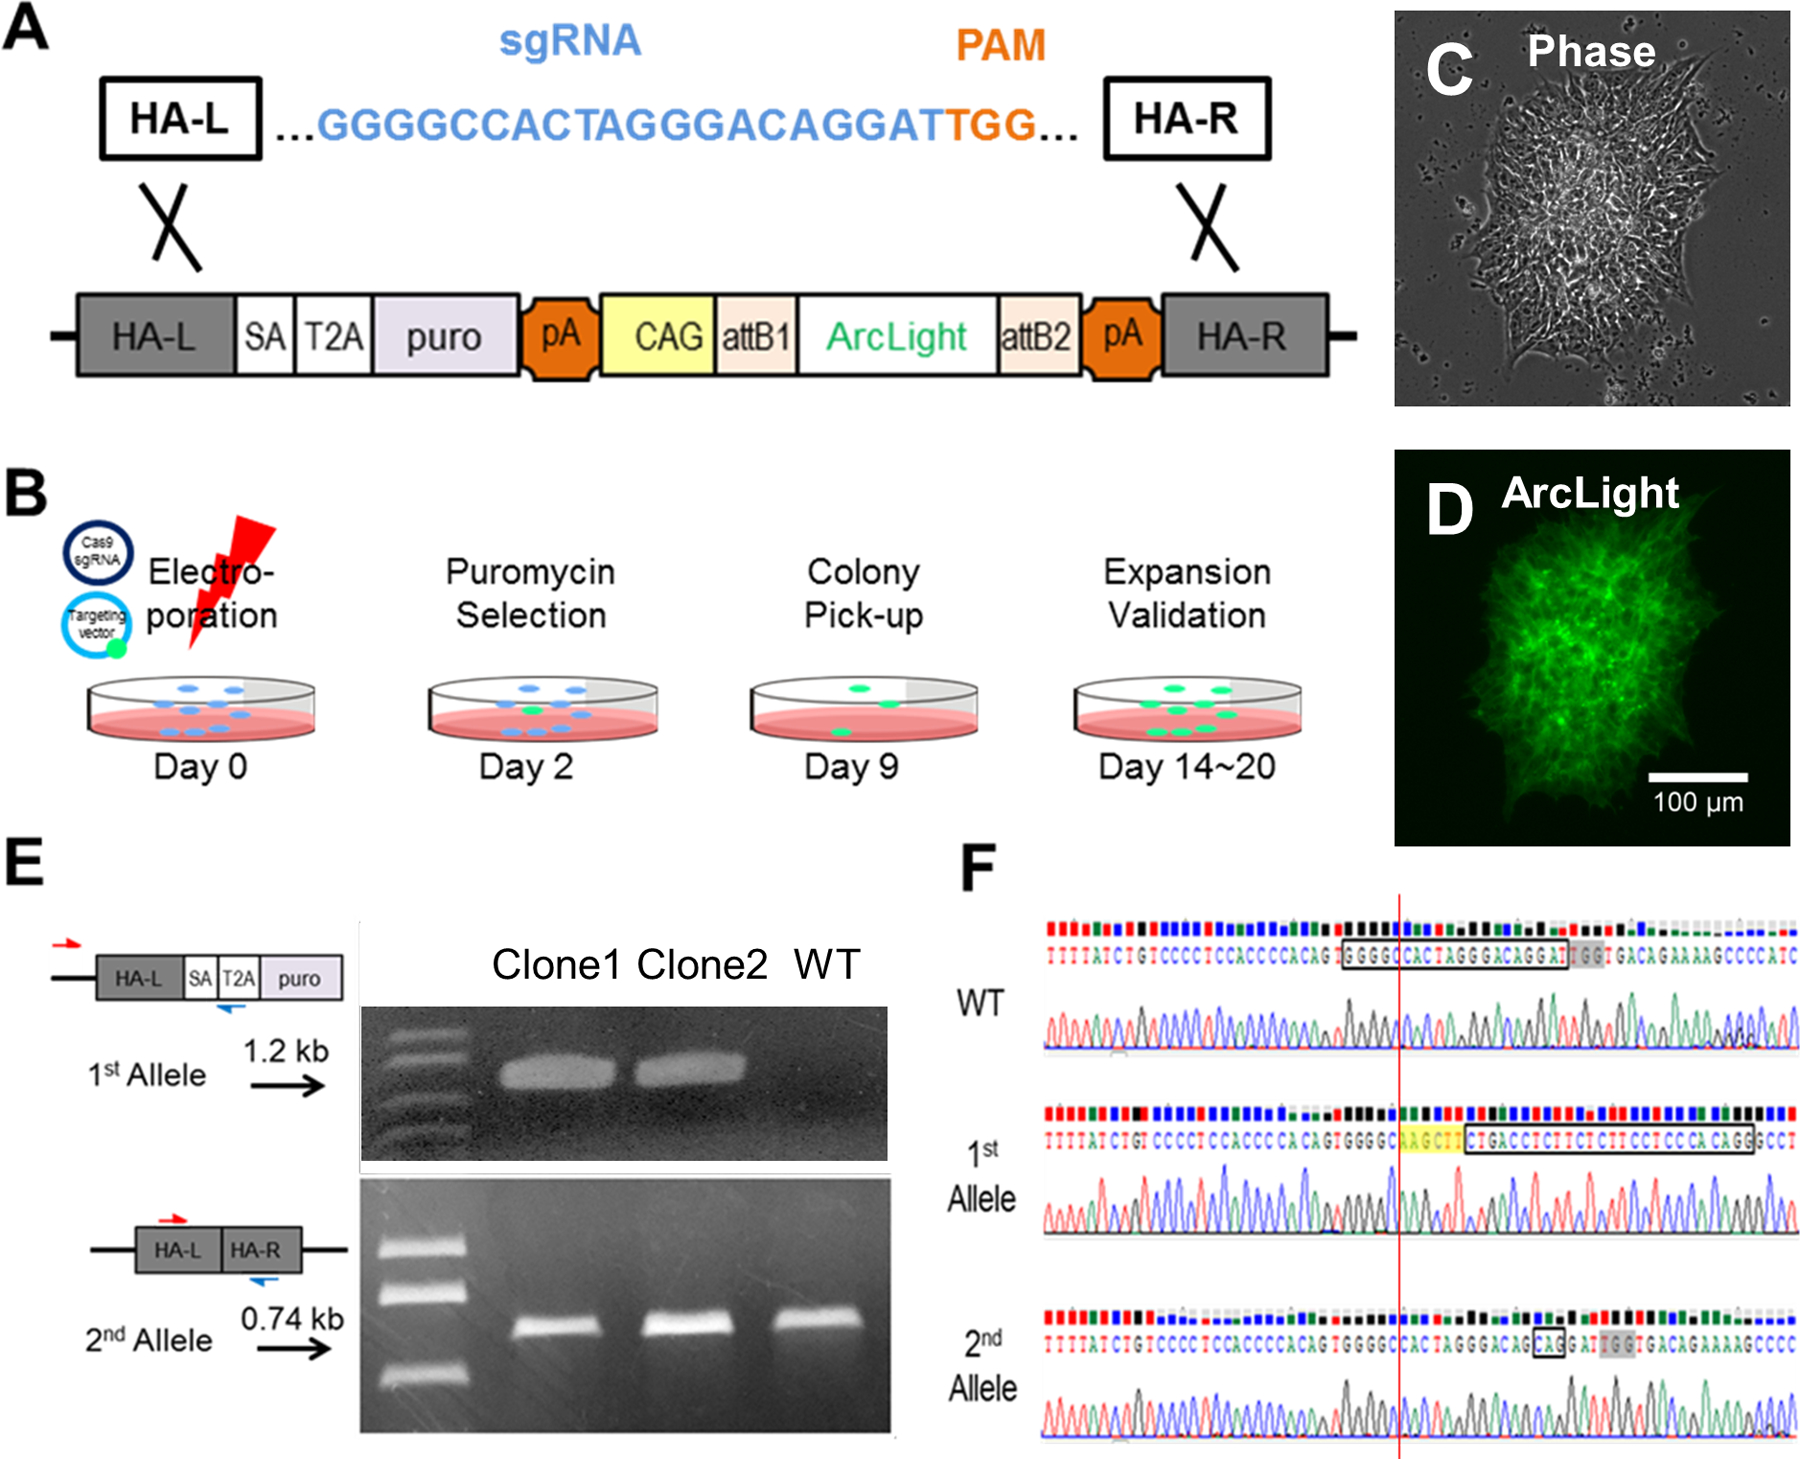
(A) sgRNA (blue) directing Cas9 to the AAVS1 target site in the first intron of the PPP1R12C gene in human chromosome 19 (not shown) to create a double-stranded break at 3 bp upstream of the PAM (orange). (B) Schematic showing timeline of ArcLight hiPSC line generation from electroporation to colony validation. (C) Phase contrast image of a representative, positively transfected colony after 9 days of puromycin selection. (D) A representative ArcLight fluorescence image of the hiPSC colony shown in panel C. (E) PCR screen demonstrating positive clones are heterozygous (as is the case for clones 1 and 2) for ArcLight knockin. (F) Sanger sequencing showing WT sequence with a target sequence (box) immediately upstream of the PAM (grey highlight) in the AAVS1 locus (top), an edited allele 1 with a HindIII site (yellow highlight) and a splice acceptor (boxed) for ArcLight reporter engineering (middle), and an edited allele 2 with ‘CAG’ inserted three base pairs upstream of the PAM (bottom).
The positively transfected hiPSCs were selected with 0.5 μg/ml Puromycin (Sigma-Aldrich) in StemFlex medium starting at 48h after electroporation for 7–9 days. Under these selection conditions the typical yield was 200 to 400 colonies for the plated cells per each electroporation. Twelve antibiotic-resistant hiPSC colonies were checked under a fluorescence microscope. Green fluorescent protein (GFP) expressing colonies were manually picked between day 9 to 12 after electroporation (Fig. 1D), then expanded in iPS-Brew with or without further drug selection. Genomic DNAs from two GFP-expressing colonies were purified using genomic DNA Mini kit (Invitrogen) for PCRs to identify targeted clones. Primer pairs of 803/804 and WT-F/183 were used to amplify targeted AAVS1 allele (1.2 kb) and normal or mutated AAVS1 allele (0.74 kb), respectively (Fig. 1E). All PCR products were purified using gel purification kit (Qiagen) and sequenced by UCDNA Sequencing Facility (UC Davis).
Differentiation of ArcLight-hiPSCs to CMs
We differentiated ArcLight-hiPSCs using a modified small molecule-based protocol [5]. Briefly, hiPSCs of up to 95% confluence were treated with 6 μM glycogen synthase kinase (GSK)3 inhibitor, CHIR99021 (Tocris Biosceince, Bristol, UK) in day 0 to 2, followed by 5 μM Wnt inhibitor, IWR-1 (Tocris Bioscience) and 5 μM TGF-β inhibitor, SB431542 (Tocris Bioscience), in day 3 to 5 in RPMI 1640 + B27 without insulin (Invitrogen). After day 7, ArcLight-hiPSC-derived CMs were maintained in RPMI 1640 + B27 with insulin. Differentiated CMs were dissociated with TrypLE (Life Technologies, Carlsbad, CA) and re-plated for further studies.
Flow cytometry
To compare proliferative and growth rate, wild-type (WT) hiPSCs, ArcLight-hiPSCs, or 1:1 mixture of the two were dissociated with Accutase and filtered through 40 μm cell strainer (Corning). To measure ArcLight fluorescence intensity and compare ArcLight expression level between hiPSCs and hiPSC-derived CMs, single cells were prepared per procedures above (for hiPSCs) or using Trypsin/EDTA (for the derived-CMs) and suspended in either Tyrode’s solution (140 mM NaCl, 5 mM KCl, 1 mM CaCl2, 1 mM MgCl2, 10 mM glucose, 10 mM HEPES, pH 7.4) or high K+ solution (145 mM KCl, 1 mM CaCl2, 1 mM MgCl2, 10 mM glucose, 10 mM HEPES, pH 7.4). Both solutions are well-characterized and the latter used to depolarize cells and clamp the membrane potential [39, 40]. To access cardiogenesis efficacy, single cells differentiated from either WT or ArcLight-hiPSCs were fixed in 4% paraformaldehyde and labeled with mouse anti-human cardiac troponin T (cTnT) (Developmental Studies Hybridoma Bank) to determine CM yield. Subsequent analytical flow cytometry of live or fixed cells was performed using the LSR Fortessa II flow cytometer (BD Biosciences, San Jose, CA), and data analysis was performed with FlowJo (Tree Star) Software.
Immunofluorescence
For immunostaining, cultured cells were fixed with 4% paraformaldehyde for 10 minutes at room temperature and then washed with PBS. Cells were then permeabilized with 0.05% Triton X-100 and blocked with 1% BSA and 5% goat serum. The following antibodies were used for immunofluorescence: mouse anti-OCT3/4 (Santa Cruz Biotechnology, 1:200); mouse anti-cTnT (Developmental Studies Hybridoma Bank, IgG2a, 1:50). Cell nuclei were counterstained with Hoechst 33342 (Invitrogen, 1:10000). Images were taken using DeltaVision Deconvolution Microscope (Applied Precision) or a laser scanning confocal microscope LSM 700 (Carl-Zeiss). Conditions and optical settings were always controlled or kept the same to facilitate group comparisons.
Live cell imaging and optical recording
All imaging and recordings were done under an epifluorescence microscope Observer Z1 (Carl-Zeiss, Oberkochen, Germany) with an X-Cite 120 illuminator (Excelitas Technologies, Fremont, CA) and equipped with an incubation chamber (37°C and 5% CO2). For live cell imaging, phase contrast and green fluorescent (using GFP filter) images were taken directly from original cultures of ArcLight-hiPSCs or ArcLight-hiPSCs-derived cardiomyocytes (ArcLight-CMs) using a Retiga R6 scientific CCD camera and Ocular software (QImaging). For optical recording of APs, ArcLight-hiPSCs-CMs were plated on Matrigel-coated gridded glass bottom dishes (Ibidi) and allowed to recover for at least three days before experiments. A 20x, 0.8 NA objective (Zeiss PlanApo) and an EMCCD camera (Photometrics, QuantEM:512SC) were used to acquire images at ~100 fps using Ocular software. ArcLight-CMs were imaged in CM culture medium without phenol. For optical recording of WT hiPSC-derived-CMs, cells differentiated by using the same protocol were incubated with 5 μM FluoVolt (Invitrogen) in media plus 0.04% Pluronic F-127 and 2 mM probenecid for 15 min at 37°C. Cells were then washed with the media and recorded using above equipment similarly as we described previously [36]. Both WT-CMs and ArcLight-CMs presented in this work were generated from three independent batches of differentiation with at least 55% cardiomyocyte differentiation efficiency.
Image processing and data analysis
Time-lapse images were imported and processed in ImageJ. Intensities of ArcLight were measured using region of interest (ROI) tool. Raw data and traces were then analyzed using our previously described R scripts [36] implemented as web application using R package “shiny” [41]. Amplitude of APs was defined by the relative fluorescence intensity change to baseline (ΔF/F0). Maximum upstroke velocity (Vmax) was calculated as ΔF/Δtmax in % change per second. AP duration (APD)50 and APD90 were measured as the interval between the time at 50% maximal upstroke amplitude to the time at 50% or 90% of repolarization respectively. The peak-to-peak interval was used to determine beating frequency. Signal-to-noise ratio (SNR), expressed in decibel units (dB), was calculated in the frequency domain as the ratio of power of a signal in the frequency range of 0.3 to 4 Hz to power of noise outside this range. This program is available online on the website https://amlab.shinyapps.io/spikemap/.
Statistical analysis
Data presented as Mean ± standard error (SE) unless otherwise specified. Comparisons were conducted via paired or unpaired Student’s t-test or Two-way ANOVA with significant differences defined by p < 0.05.
RESULTS
Generation of a hiPSC ArcLight reporter line by CRISPR/Cas9-mediated AAVS1 targeting
To generate a pluripotent stem cell line with a GEVI [42], we inserted an ArcLight reporter gene [23] into intron 1 of the PPP1R12C gene (AAVS1 locus) in hiPSCs using CRISPR/Cas9-mediated genome editing (See overall strategy in Fig. S1). To do so, first, we cloned the ArcLight reporter gene [23] into an AAVS1 destination vector [35] using the Gateway system (Invitrogen). A previously reported T2 sgRNA [43] was designed to guide double-stranded breaks at the AAVS1 locus (Fig. 1A). We then transfected hiPSCs by electroporation with the ArcLight reporter targeting vector and a Cas9 vector [44] expressing T2 sgRNA (Fig. 1B). After puromycin selection, colonies showing green fluorescence signal were individually selected (Fig. 1C and D) and propagated. Correctly targeted clones that expressed a 1.2 kb product were verified by PCR and by Sanger sequencing of the PCR products (Fig. 1E and F). An additional PCR screen was performed to determine whether ArcLight was inserted into one or both AAVS1 alleles. The expected 0.74 kb PCR products of the allele without ArcLight insertion were also sequenced to determine if any mutations had occurred (Fig. 1E and F). Following sequencing, we found that none of the resulting ArcLight knockin clones tested were homozygous. In the two ArcLight monoallelic-targeted clones sequenced, the allele without ArcLight insertion had either no change or an “CAG” duplication in the AAVS1 coding sequence (Fig. 1F).
Pluripotency and growth rate of ArcLight-hiPSCs
To characterize the ArcLight-hiPSC lines, we randomly chose one clone in which one AAVS1 allele has the ArcLight knockin and the other allele has a duplicated ‘CAG’ insertion, both confirmed by PCR (Fig. 1E) and sequencing (Fig. 1F). ArcLight expression was assessed by detection of green fluorescent signal that was mainly localized on the plasma membrane, as revealed by confocal microscopy of fixed hiPSCs (See the inset of Fig. 2A). Relatively uniform expression of ArcLight in hiPSCs was also confirmed by live cell imaging (Fig. 1D) or by flow cytometry (Fig. 2B). As shown by the gates, we were able to distinctly separate ArcLight-expressing hiPSCs from mixed WT populations without any overlap. This ArcLight-hiPSC line maintained pluripotency as demonstrated by positive nuclear staining of pluripotent marker, Oct4 (Fig. 2A). Importantly, the ArcLight-hiPSCs maintained self-renewal capacity at a rate similar to that of their parental WT hiPSCs. This was assessed and monitored by flow cytometry of a competitive growth assay with a 1:1 mixture of WT and ArcLight-hiPSC co-culture over 4 days (Fig. 2C). The ratio of the WT:ArcLight hiPSC mixture remained at 1 for the typical duration until subculture, suggesting that the growth rate of the ArcLight-hiPSCs is the same as the WT cells.
Figure 2. Characterization of the ArcLight reporter hiPSC line.
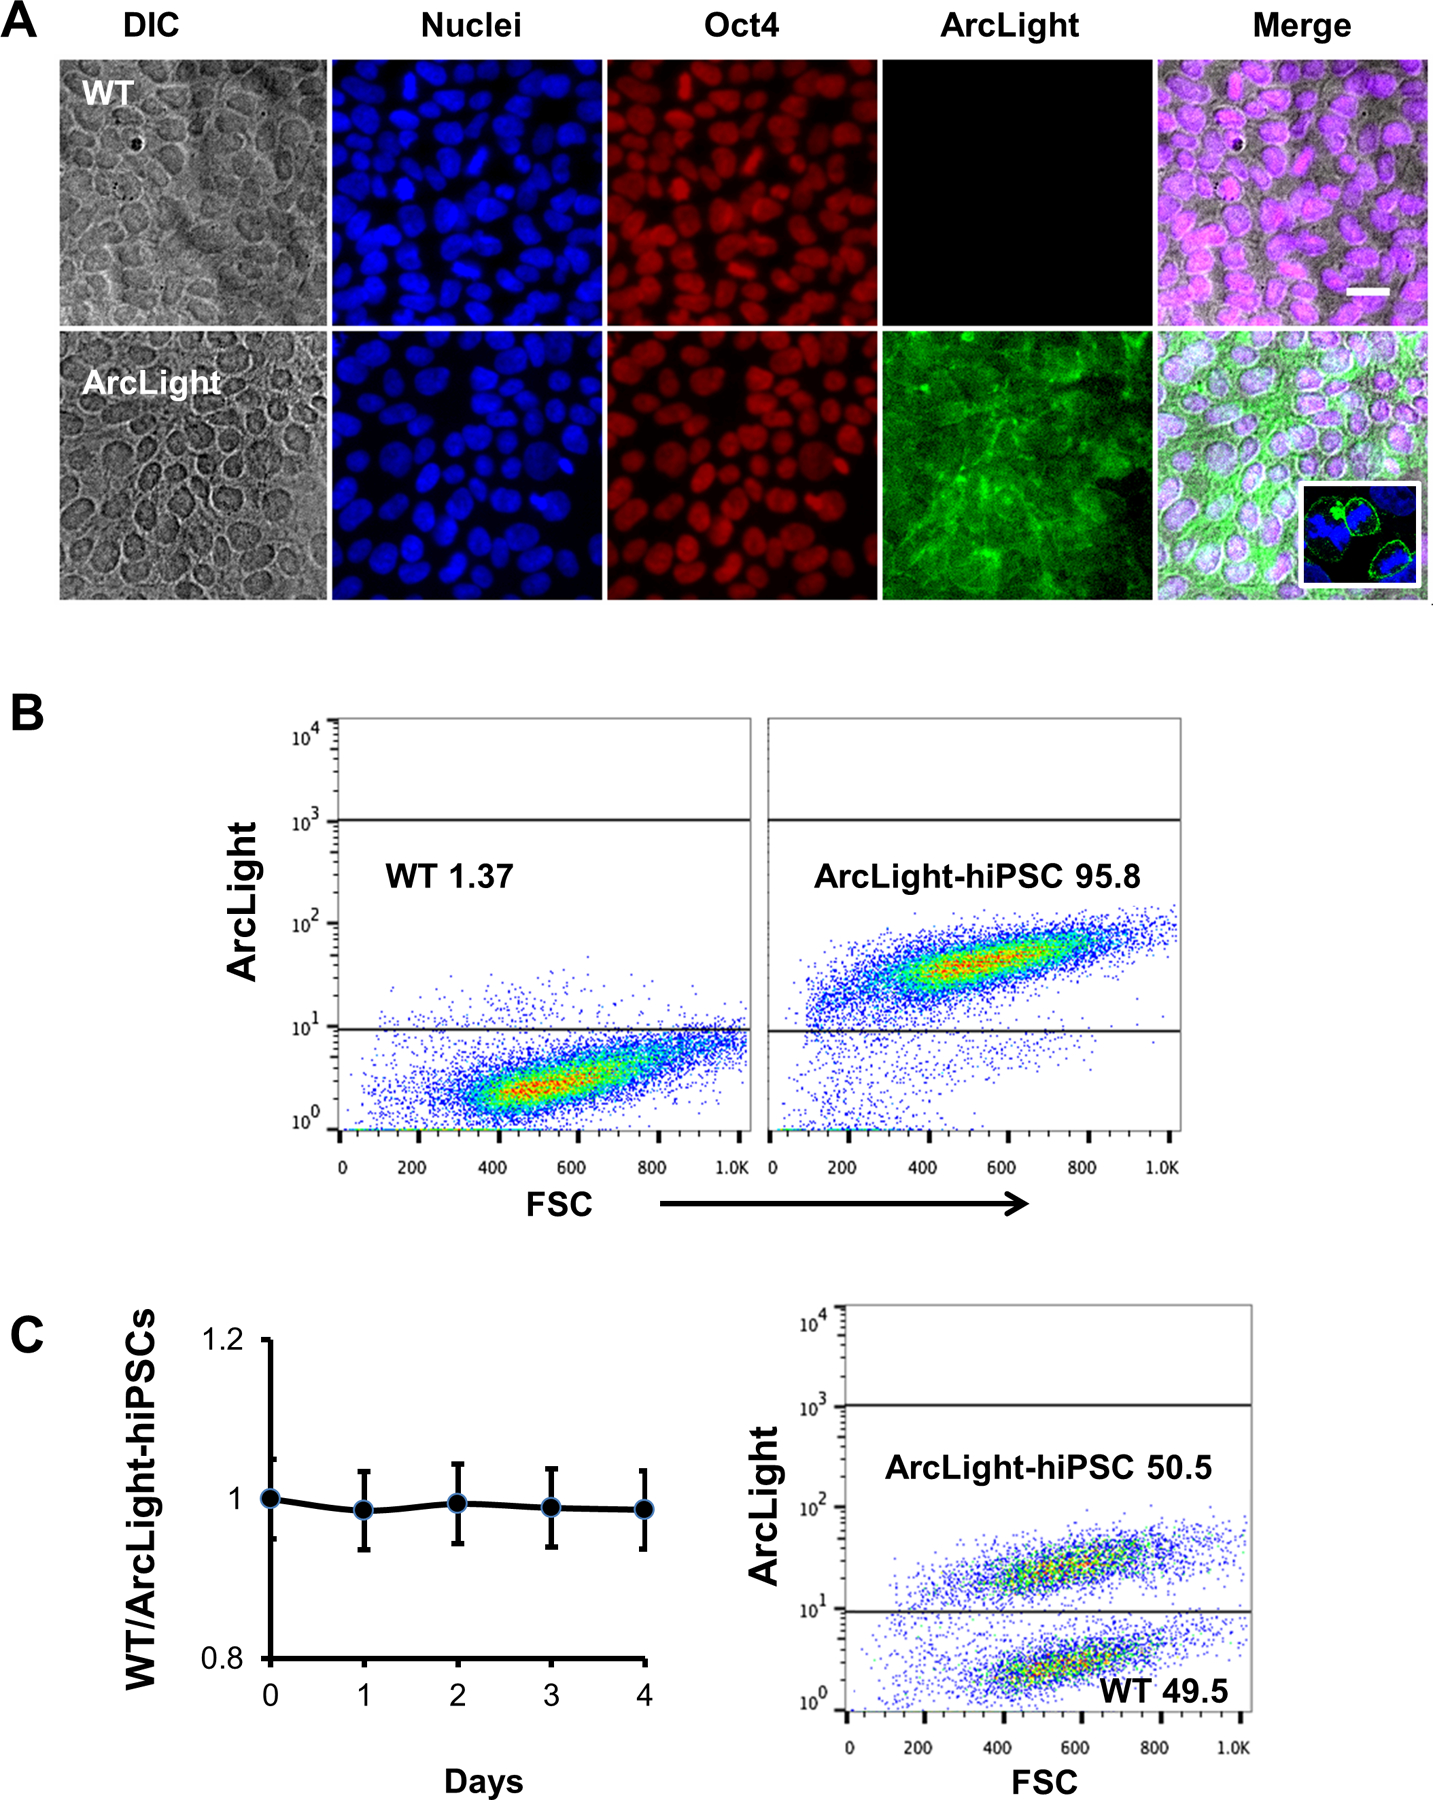
(A) HiPSCs expressing ArcLight on plasma membrane retained pluripotent marker Oct4 similar to wild-type (WT) control. Scale bar, 20 μm. Enlarged insert inside merged image highlighting the ArcLight is mainly localized in the cytoplasmic membrane. (B) Representative flow cytograms showing nearly 100% hiPSCs were stably expressing ArcLight. The ArcLight-hiPSCs can be distinguished from WT hiPSCs in the same gate. (C) Co-culture of WT and ArcLight-hiPSCs, equally mixed and cultured for 4 days demonstrated comparable proliferative capability of ArcLight-hiPSCs to WT hiPSCs. Cells were analyzed by FACS using same gating strategy in B.
Long-term stable expression of ArcLight of the ArcLight-hiPSC line
To test the stability of ArcLight expression, we monitored the fluorescence intensity in live ArcLight-hiPSCs over 140 days and did not observe any significant decrease in fluorescence intensity, as supported by the live fluorescence imaging (Fig. S2A and B). Quantification of ArcLight fluorescence was maintained at a similar level in the majority of the hiPSCs for at least 47 passages, without selective pressure from antibiotics (Fig. S2C). This data highlights the robustness and stability of CAG-driven ArcLight expression in our hiPSC line generated using the CRISPR/Cas9 nuclease.
Cardiac differentiation of ArcLight-hiPSCs and quantification of ArcLight signal intensity in derived CMs
ArcLight-hiPSCs were directly differentiated as monolayers into CMs using a modified small molecules-based differentiation protocol [5] (Fig. 3A). ArcLight-CMs were immunostained for pluripotent marker Oct4 and cTnT with ArcLight-hiPSCs as control (Fig. 3B). ArcLight-CMs exhibited robust ArcLight fluorescence, filamentous pattern for cTnT staining, and absence of Oct4, indicating ArcLight expression was retained after cardiogenic differentiation. The cardiogenesis efficiency ranged between 55–82% as determined by FACS analysis of CM-specific cTnT-positive cells around differentiation day 20 (Fig. 3C). Live cell imaging of the differentiated ArcLight-CMs revealed two distinct populations in which the beating CMs were significantly brighter (p < 0.001) than the non-contracting and more spread out fibroblasts and other non-CM cells (Fig. S3) [45]. Further quantification and comparison of live cell images under identical optical conditions revealed that the ArcLight-CMs were significantly brighter than ArcLight-hiPSCs with at least one order difference of mean fluorescent intensity (MFI) (Fig. 4A), suggesting that ArcLight expression might be upregulated after cardiac differentiation of ArcLight-hiPSCs. We then performed a detailed morphological analysis using image processing techniques and found that the differentiated cardiomyocytes expressing marked cTnT were significantly larger than the ArcLight-hiPSCs (Fig. S4).
Figure 3. ArcLight reporter was retained after myocardial differentiation.
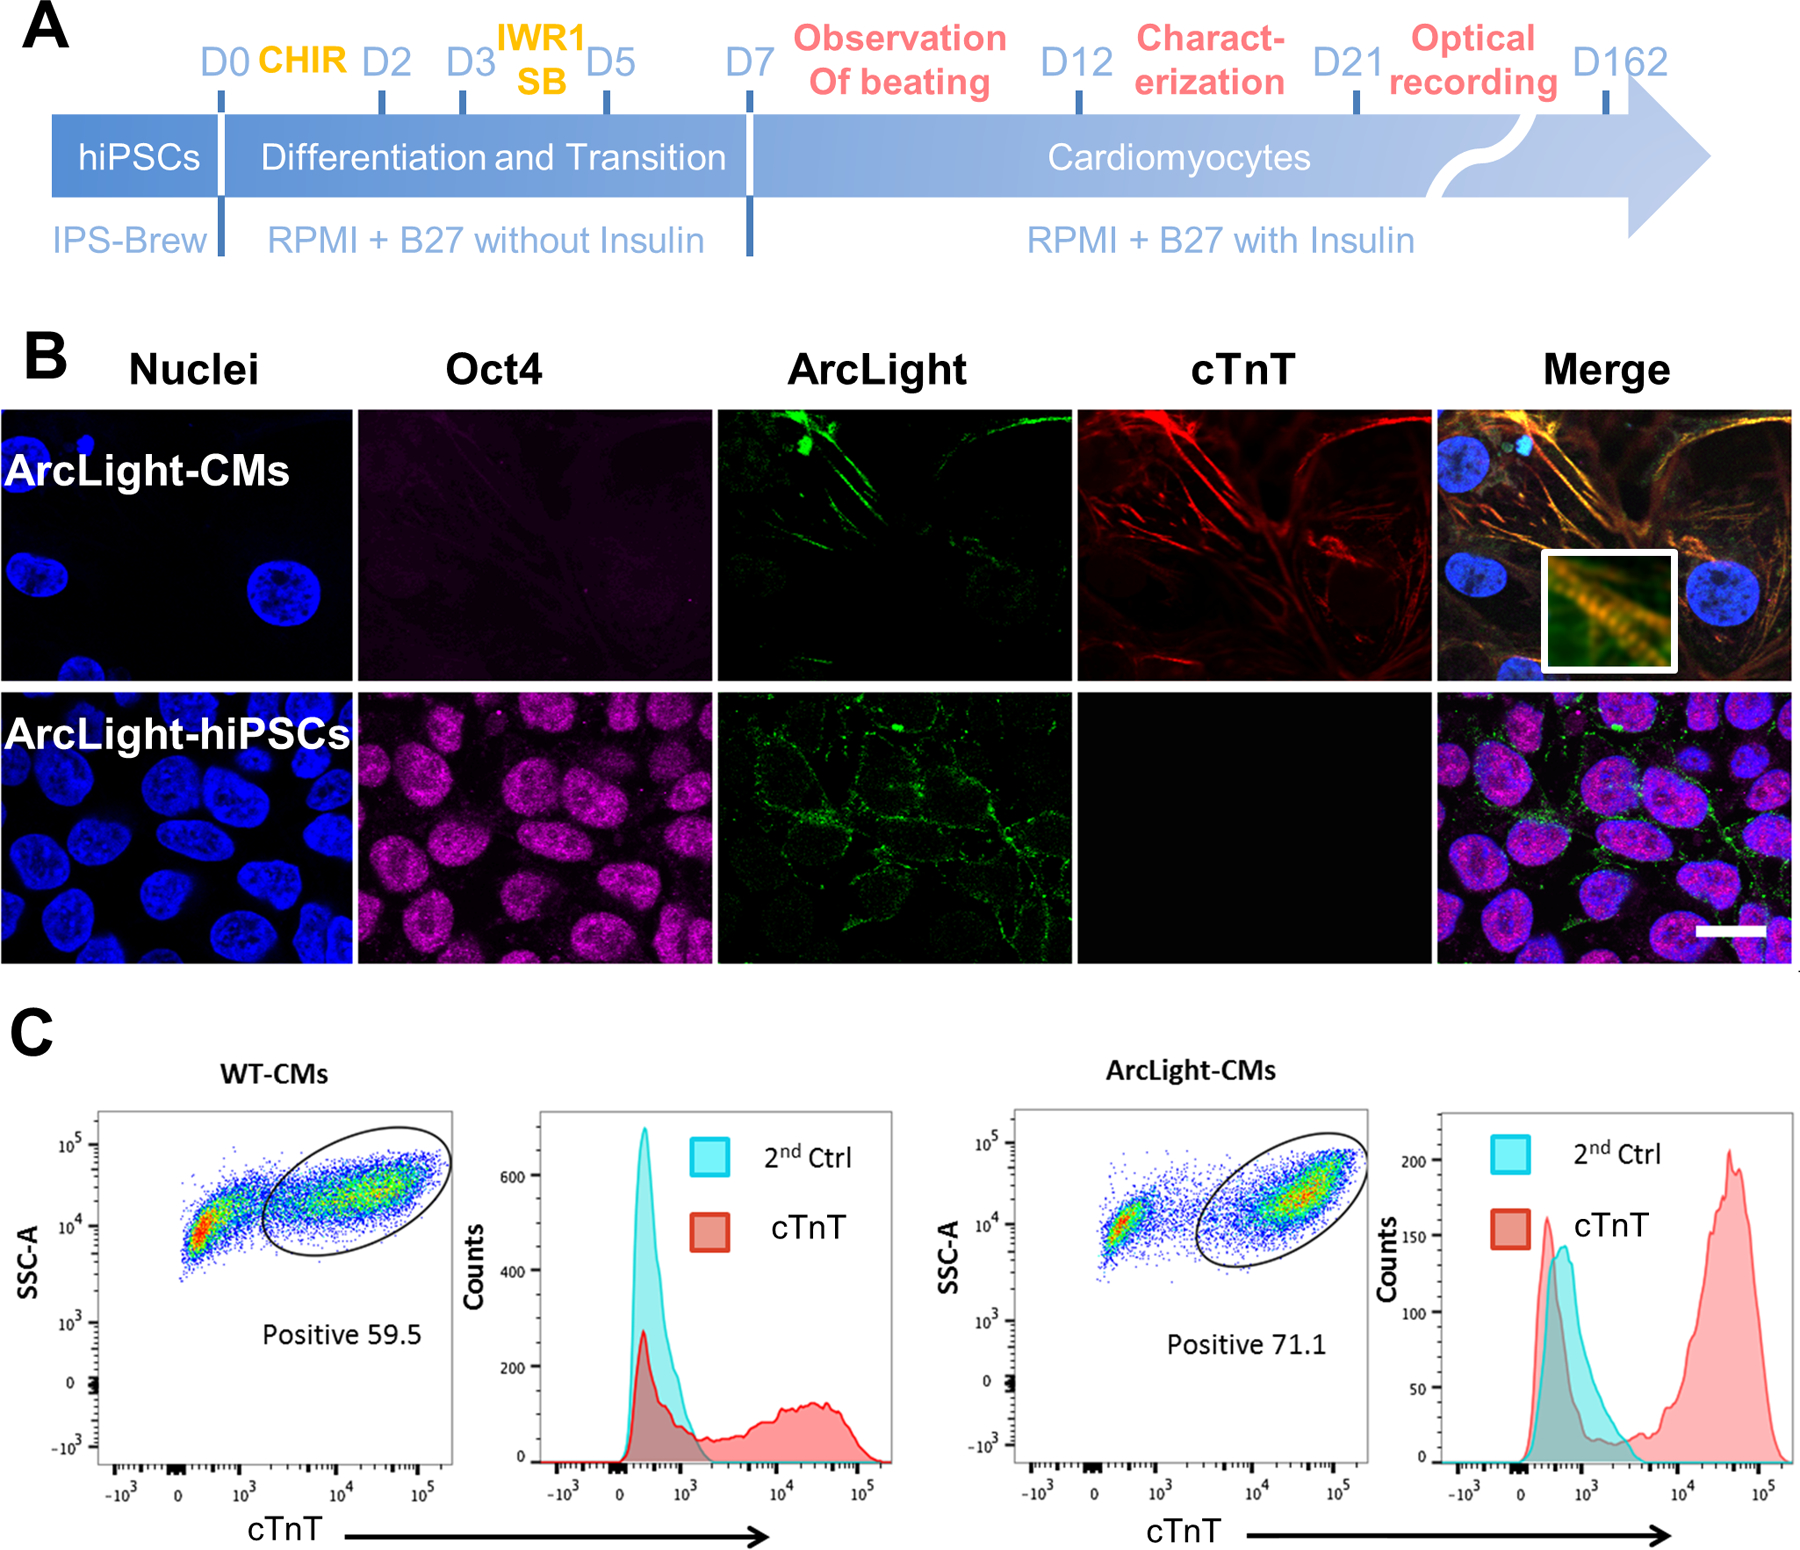
(A) A schematic depicts the cardiogenic differentiation protocol and the timeline for cardiac characterization and optical recording. (B) Representative images showing ArcLight expression (green) in either ArcLight-hiPSCs or ArcLight-CMs. Note the loss of pluripotent Oct4 (magenta) and expression of cTnT (red) after differentiation to CMs. Magnified insert showing clear sarcomere structures. Scale bar, 20 μm. (C) Representative flow cytograms showing cardiogenesis efficacy of WT and ArcLight-hiPSCs. In this specific experiment the percentage of cTnT positive CMs differentiated from ArcLight-hiPSCs is higher than that of CMs differentiated from WT hiPSCs. Cells labeled with secondary antibodies only served as negative controls.
Figure 4. Effects of direct membrane potential change on ArcLight fluorescence intensity in ArcLight-CMs.
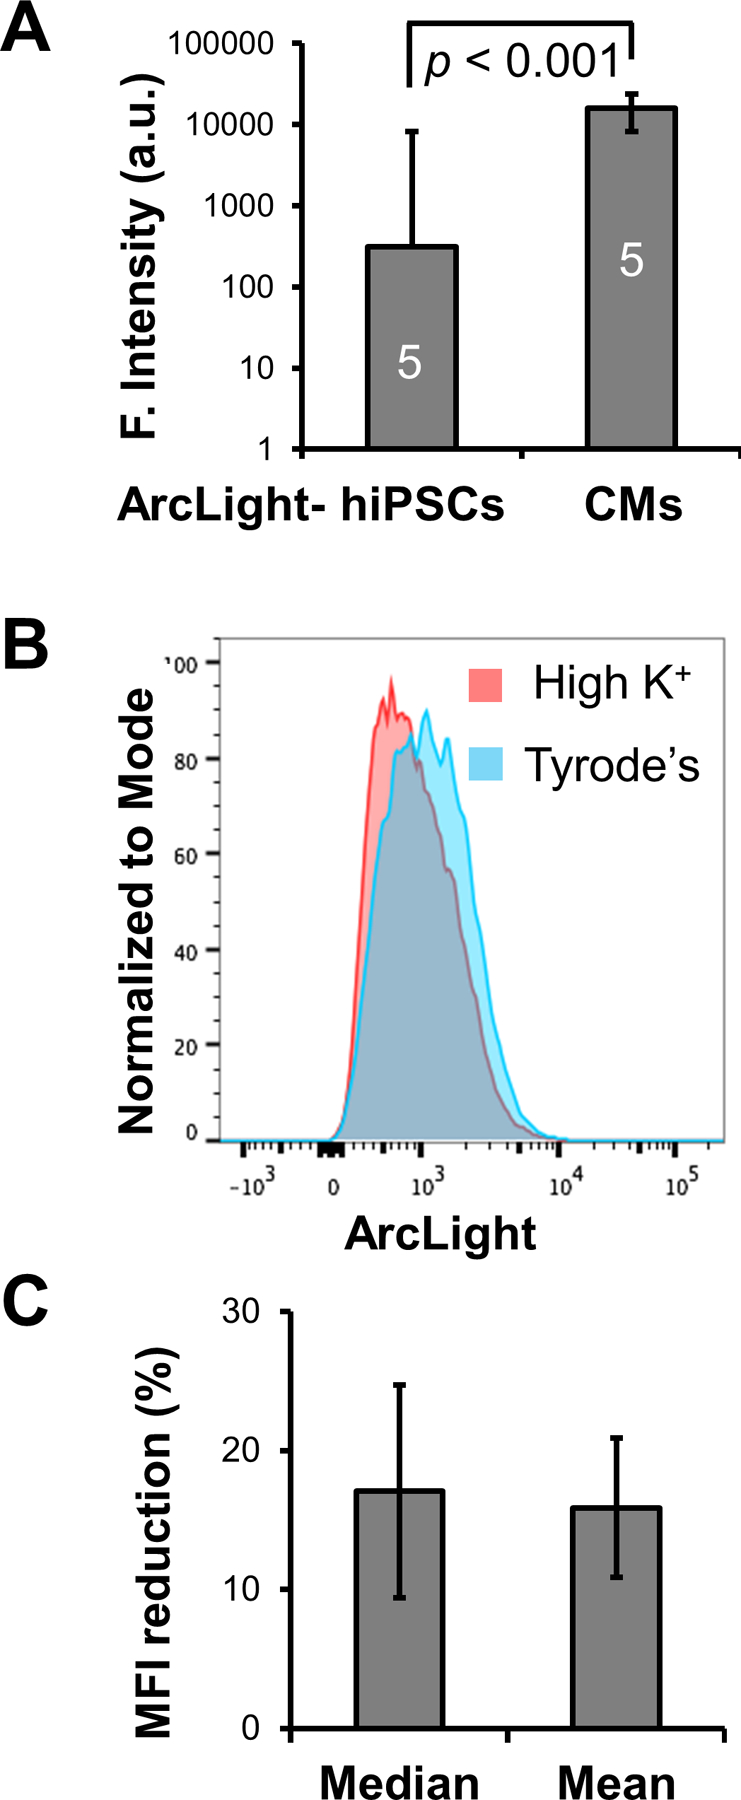
(A) ArcLight-CMs are significantly brighter in ArcLight fluorescence than ArcLight-hiPSCs. Five fields of confluent ArcLight-hiPSCs or ArcLight-hiPSC-CMs of D40 after differentiation were imaged under identical optical settings. ArcLight intensity are quantified in arbitrary units (a.u.) and presented as Mean ± SE. Statistic difference was analyzed by unpaired two-tail Student’s t-test. (B) A representative histogram of fluorescence intensity of live ArcLight-CMs in Tyrode’s or high K+ solution. Note the significant reduction in the median ArcLight fluorescence intensity due to depolarization of the membrane potential induced by concentrated K+. (C) Quantification of median or mean fluorescence intensity (MFI) reduction after treatment of high K+ solution relative to Tyrode’s solution. Date is presented as geometric Mean ± SE from 3 independent FACS experiments.
To assess ArcLight expression and the effects of resting membrane potential on fluorescence intensities, we performed FACS analysis with live ArcLight-CMs that were buffered in either Tyrode’s solution or high K+ solution [39, 40]. The CMs in Tyrode’s solution with reported maximum diastolic potential (MDP) of −65 mV [46, 47] exhibited a significant reduction in fluorescence intensity when buffered in high K+ solution that clamped the membrane potential close to 0 mV, with MFI decreased from 1190 to 912 A.U. (Fig. 4B), suggesting this fluorescence intensity change of 15% was due to the membrane potential change in the population (Fig. 4C).
Optical recording of APs in ArcLight-CMs
We next sought to resolve APs using this ultrasensitive and upregulated ArcLight reporter in single hiPSC-CMs. ArcLight-CMs were dissociated and seeded in Matrigel-coated glass bottom dishes and recorded at ~100 fps using epifluorescence microscope with a high-speed EMCCD camera at 37°C. Periodic changes of ArcLight fluorescent levels were observed in individual hiPSC-CMs during the cycle of APs, such that the fluorescence intensity of ArcLight was reduced in the depolarization phase, followed by an increase of fluorescence intensity during membrane repolarization and the diastolic resting phase (Fig. 5A), which is consistent with the reported properties of ArcLight [23–25] (Movie S1). Motion artifacts as demonstrated by intensity changes of differential interference contrast (DIC) recording were demonstrated to have minimal effects on membrane potential changes by carefully choosing a relatively uniform ROI without inclusion of high contrast cell border (Fig. S5) (Movie S2). We had been able to record APs from ArcLight-CMs as early as 21 days post-differentiation (Movie S3). The optical signals taken from ArcLight-CMs were relatively stable, allowing continuous recordings of the same ArcLight-CM for at least 10 minutes (Movie S4) or repeated recordings of the same CM for days (Movie S5). APs could be recorded from ArcLight-CMs that had been in culture for at least 162 days post-differentiation (Fig. 3A).
Figure 5. Optical recordings of APs in ArcLight-CMs.
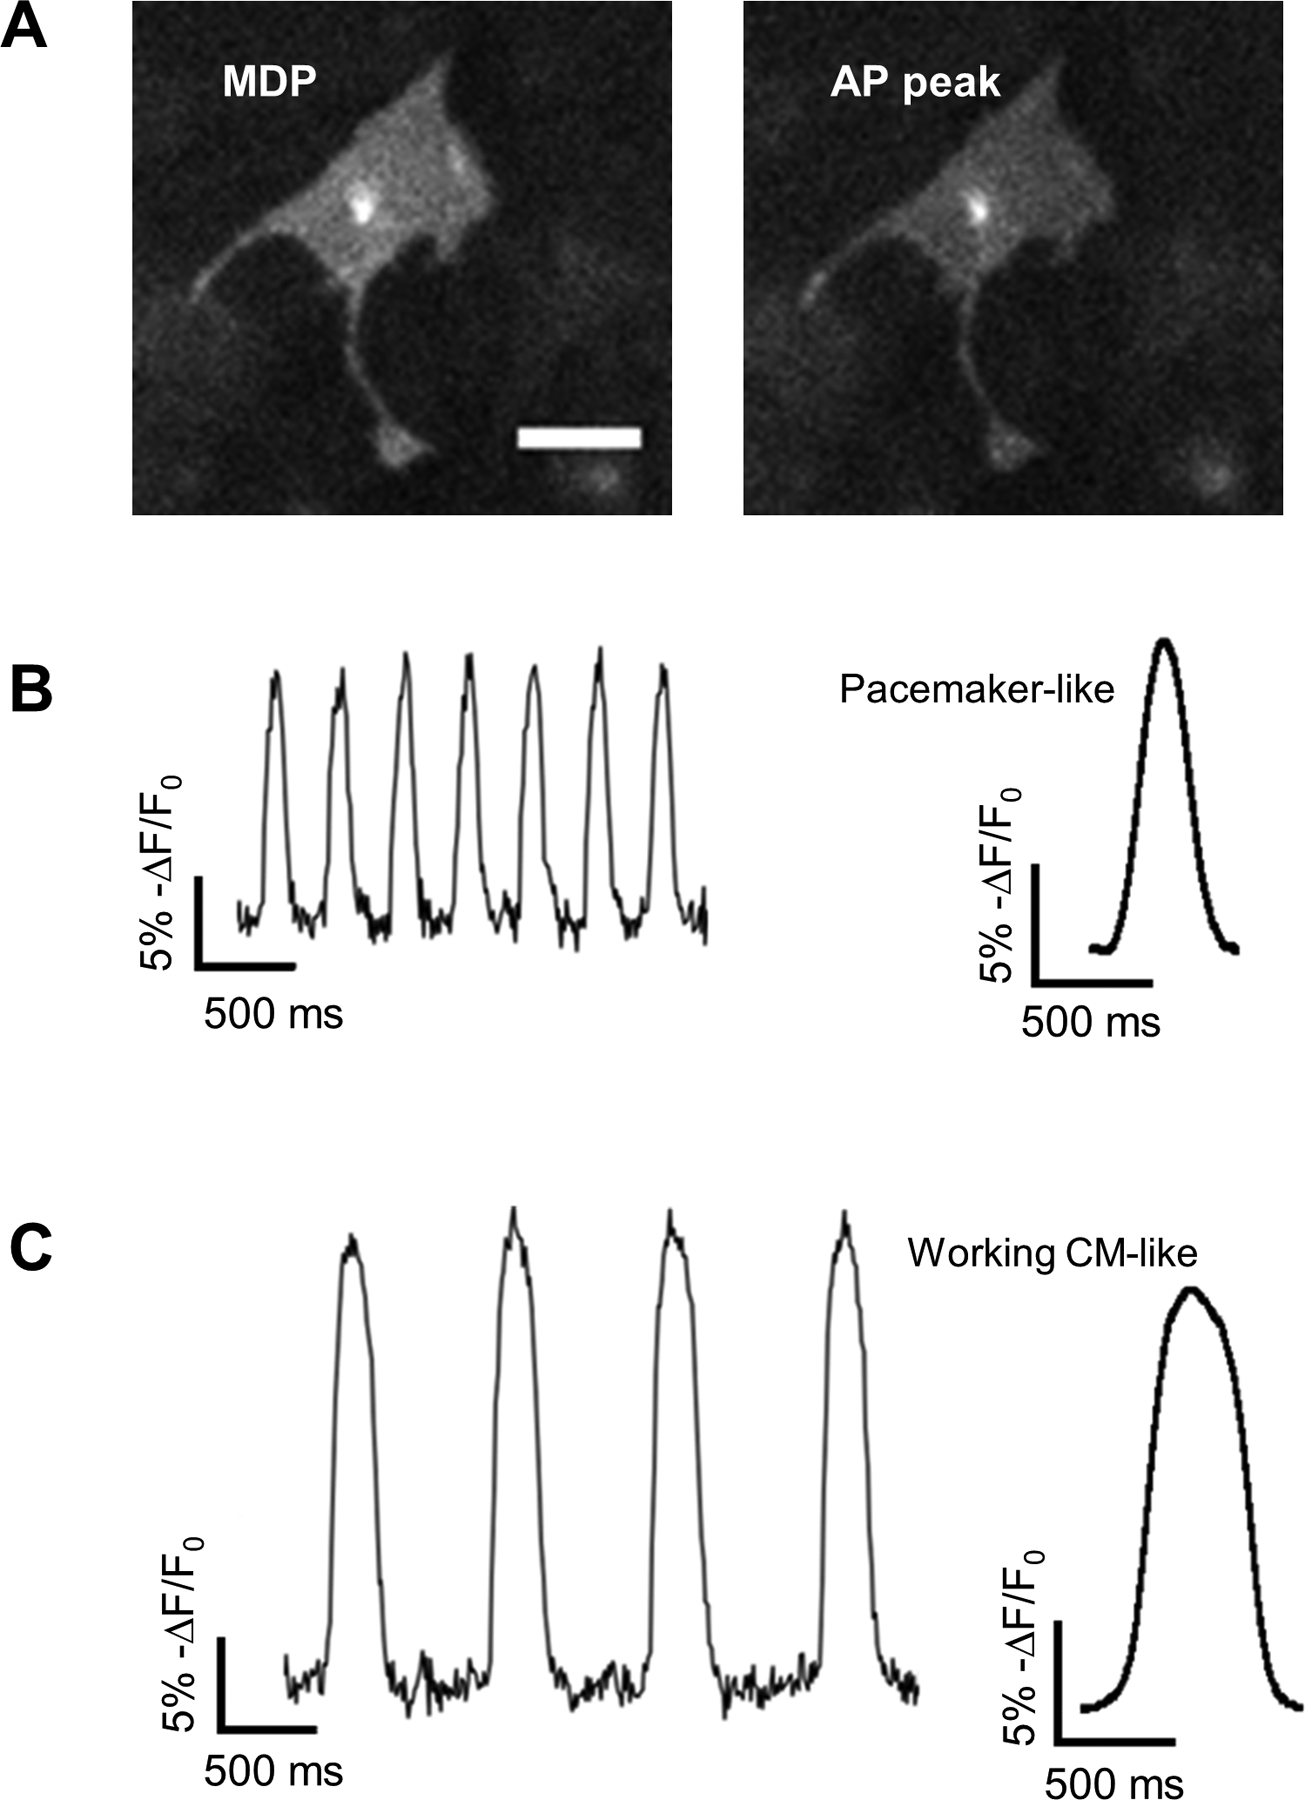
(A) Representative images of ArcLight-CMs with maximum diastolic potential (MDP) or AP peak show reduction of ArcLight fluorescence intensity with depolarization. Scale bar, 50 μm. (B) Traces recorded from a typical pacemaker-like APs (left) and averaged AP profile from the traces (right). (C) Traces recorded from a typical working CM-like APs (left) and averaged AP profile from the traces (right).
To characterize the APs optically recorded from ArcLight-CMs, we developed a software (https://amlab.shinyapps.io/spikemap/) that automatically recognizes AP peaks and calculates mean AP parameters for each sample. Heterogeneity in APs of hiPSC-CMs was observed. Analysis of frequency of spontaneous generation of APs identified two distinctive subgroups: pacemaker-like with high frequency of automaticity (Movie S6) and contractile working CM-like with low frequency of automaticity (Movie S7) (Fig. 5B). The pacemaker-like APs have faster automaticity frequency of 110 ± 3.13 bpm (Mean ± SE), smaller AP amplitude of 14 (% change in fluorescence intensity), shorter APD50/APD90 of 0.579 ± 0.01, and Vmax of 115 ± 6.65 %/s; while the contractile working CM-like APs have frequency of automaticity of 46 ± 3.97 bpm, larger amplitude of 20, longer APD50/APD90 of 0.620 ± 0.01, and Vmax of 137 ± 12.25 %/s. All of the parameter differences were statistically significant (Fig. 6 and Table S3).
Figure 6. AP parameters from two distinct AP types of ArcLight-CMs.
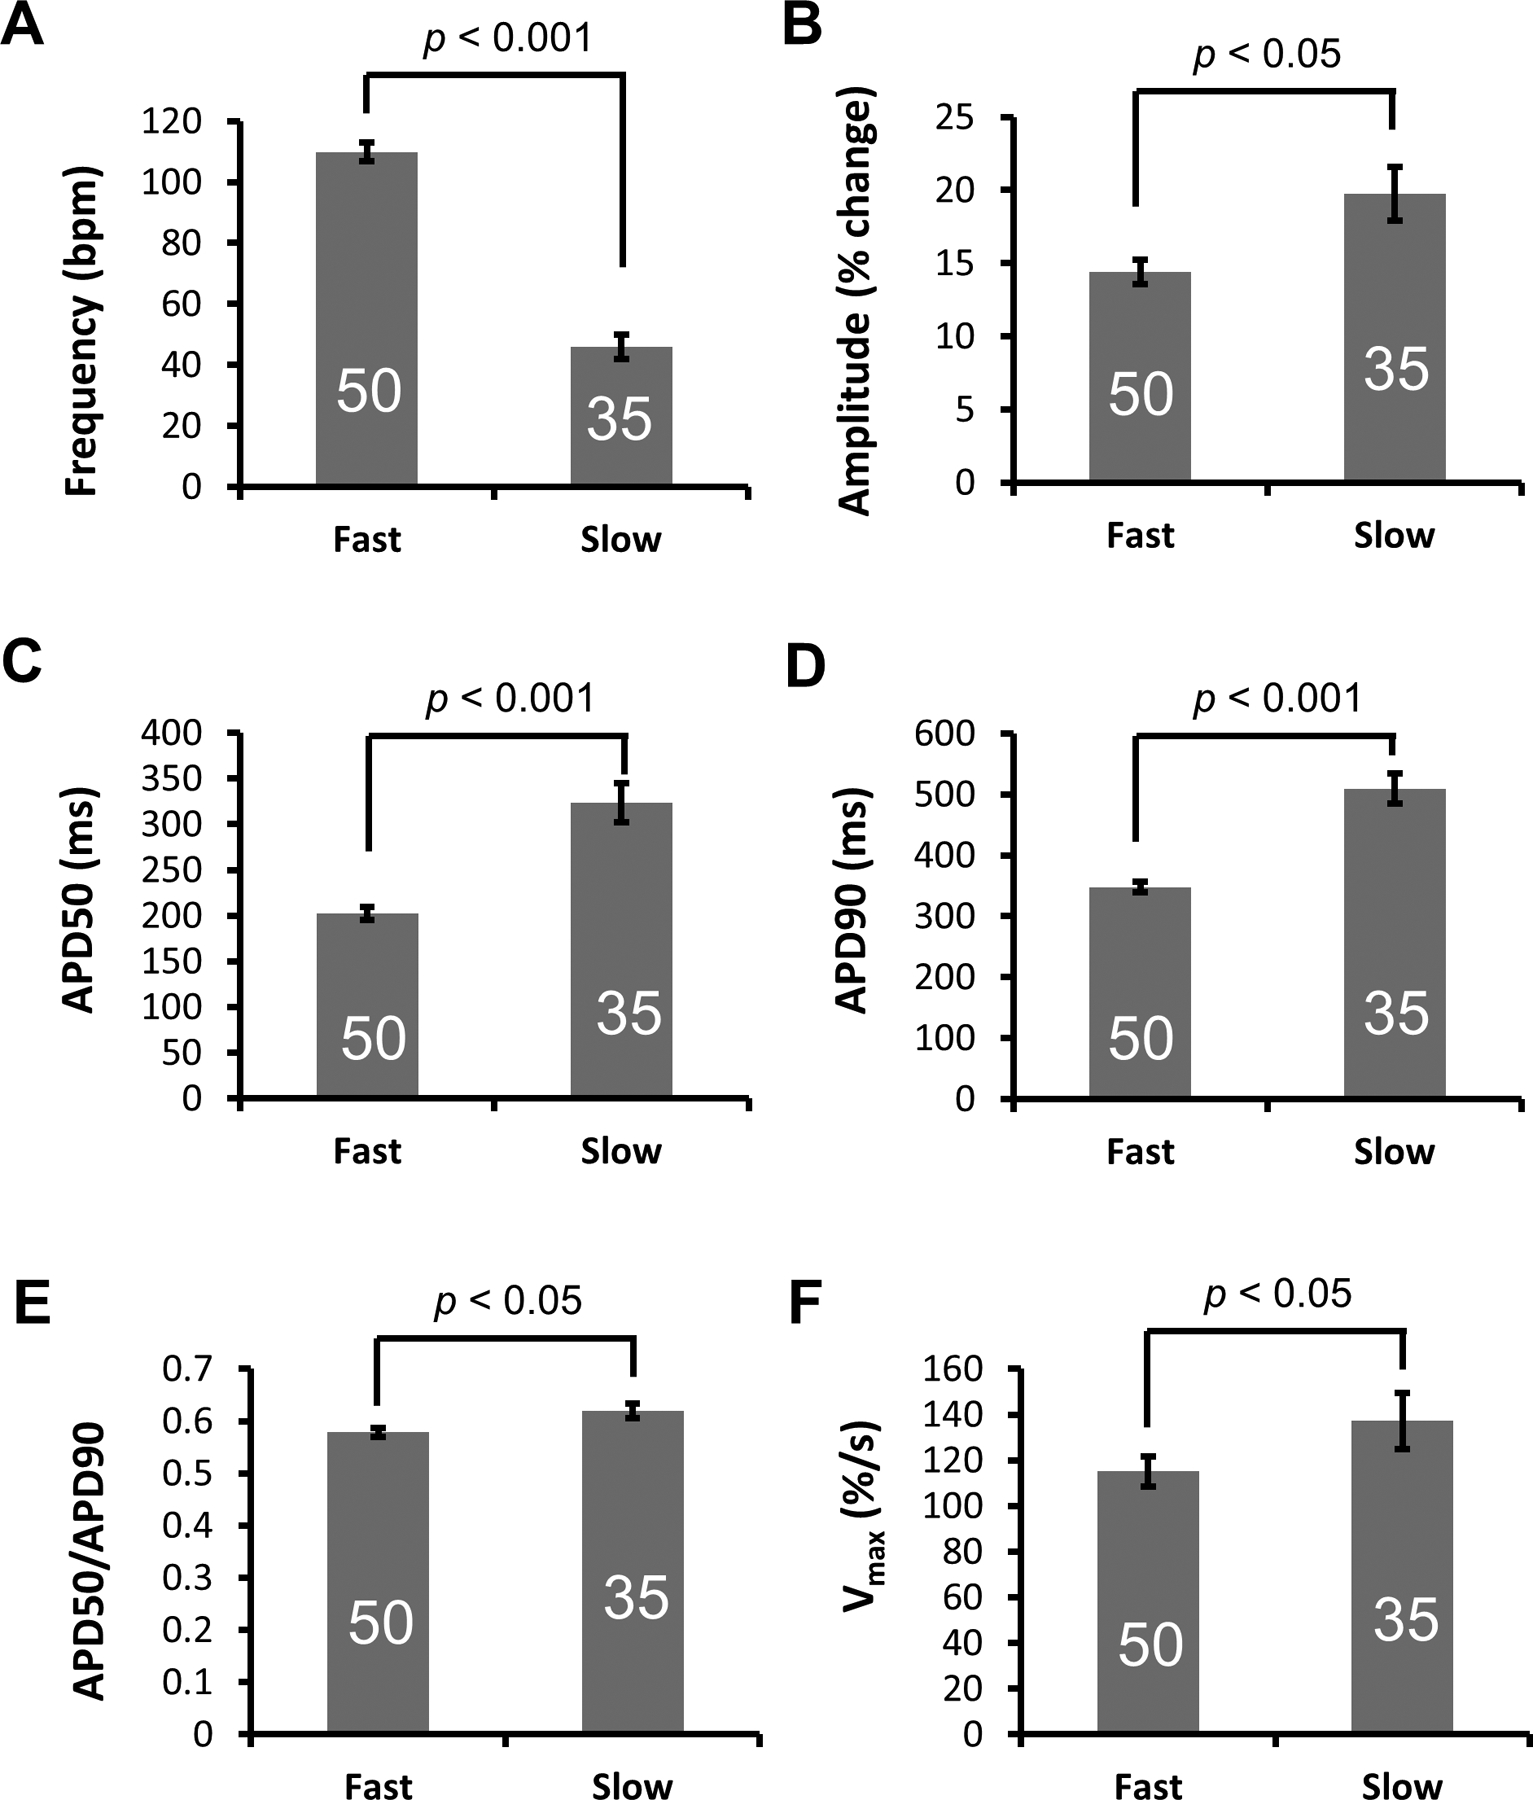
(A) Frequency, (B) Amplitude, (C) APD50, (D) APD90, (E) Ratio of APD50/APD90 and (F) Vmax (ΔF/Δtmax) of fast and slow APs recorded from ArcLight-CMs. Data is presented as Mean ± SE. The number of CMs sampled is indicated inside each bar. Statistical differences were analyzed by unpaired two-tail Student’s t-test.
Comparison between ArcLight reporter and FluoVolt voltage-sensitive dye
For comparison of optical performance, we performed optical recordings in differentiated WT hiPSC-CMs loaded with FluoVolt voltage-sensitive dye [36] (Movie S8). While both recordings were able to faithfully detect membrane potential changes of hiPSC-CMs with similar sensitivities (Fig. 7A), APD50/APD90 ratios (Fig. 7B), Vmax (Fig. 7C), and SNRs (Fig. 7D), ArcLight performed better in terms of photostability of the optical signal (Fig. 7E) (Movie S9), allowing continuous and repeated recordings of APs in ArcLight-CMs. Interestingly, the frequency of automaticity of hiPSC-CMs recorded with FluoVolt was significantly slower than that of ArcLight-CMs (Fig. 7F). Such reduction in single cell automaticity, as well as contractility in the presence of FluoVolt has been reported recently [48]. In addition, after prolonged exposure to excitation light, we observed typical phototoxicity of hiPSC-CMs loaded with FluoVolt, characterized by cell retraction and blebbing of the cell membrane that eventually led to cell deaths (Fig. S6). Such photoxicity as well as photobleaching were also observed in hiPSC-CMs loaded with di-8-ANEPPS (data not shown). Detailed comparisons of signal, AP parameters, and statistical analyses between ArcLight and FluoVolt are summarized in Table S4.
Figure 7. Comparison of APs recorded with ArcLight reporter or FluoVolt voltage-sensitive dye.
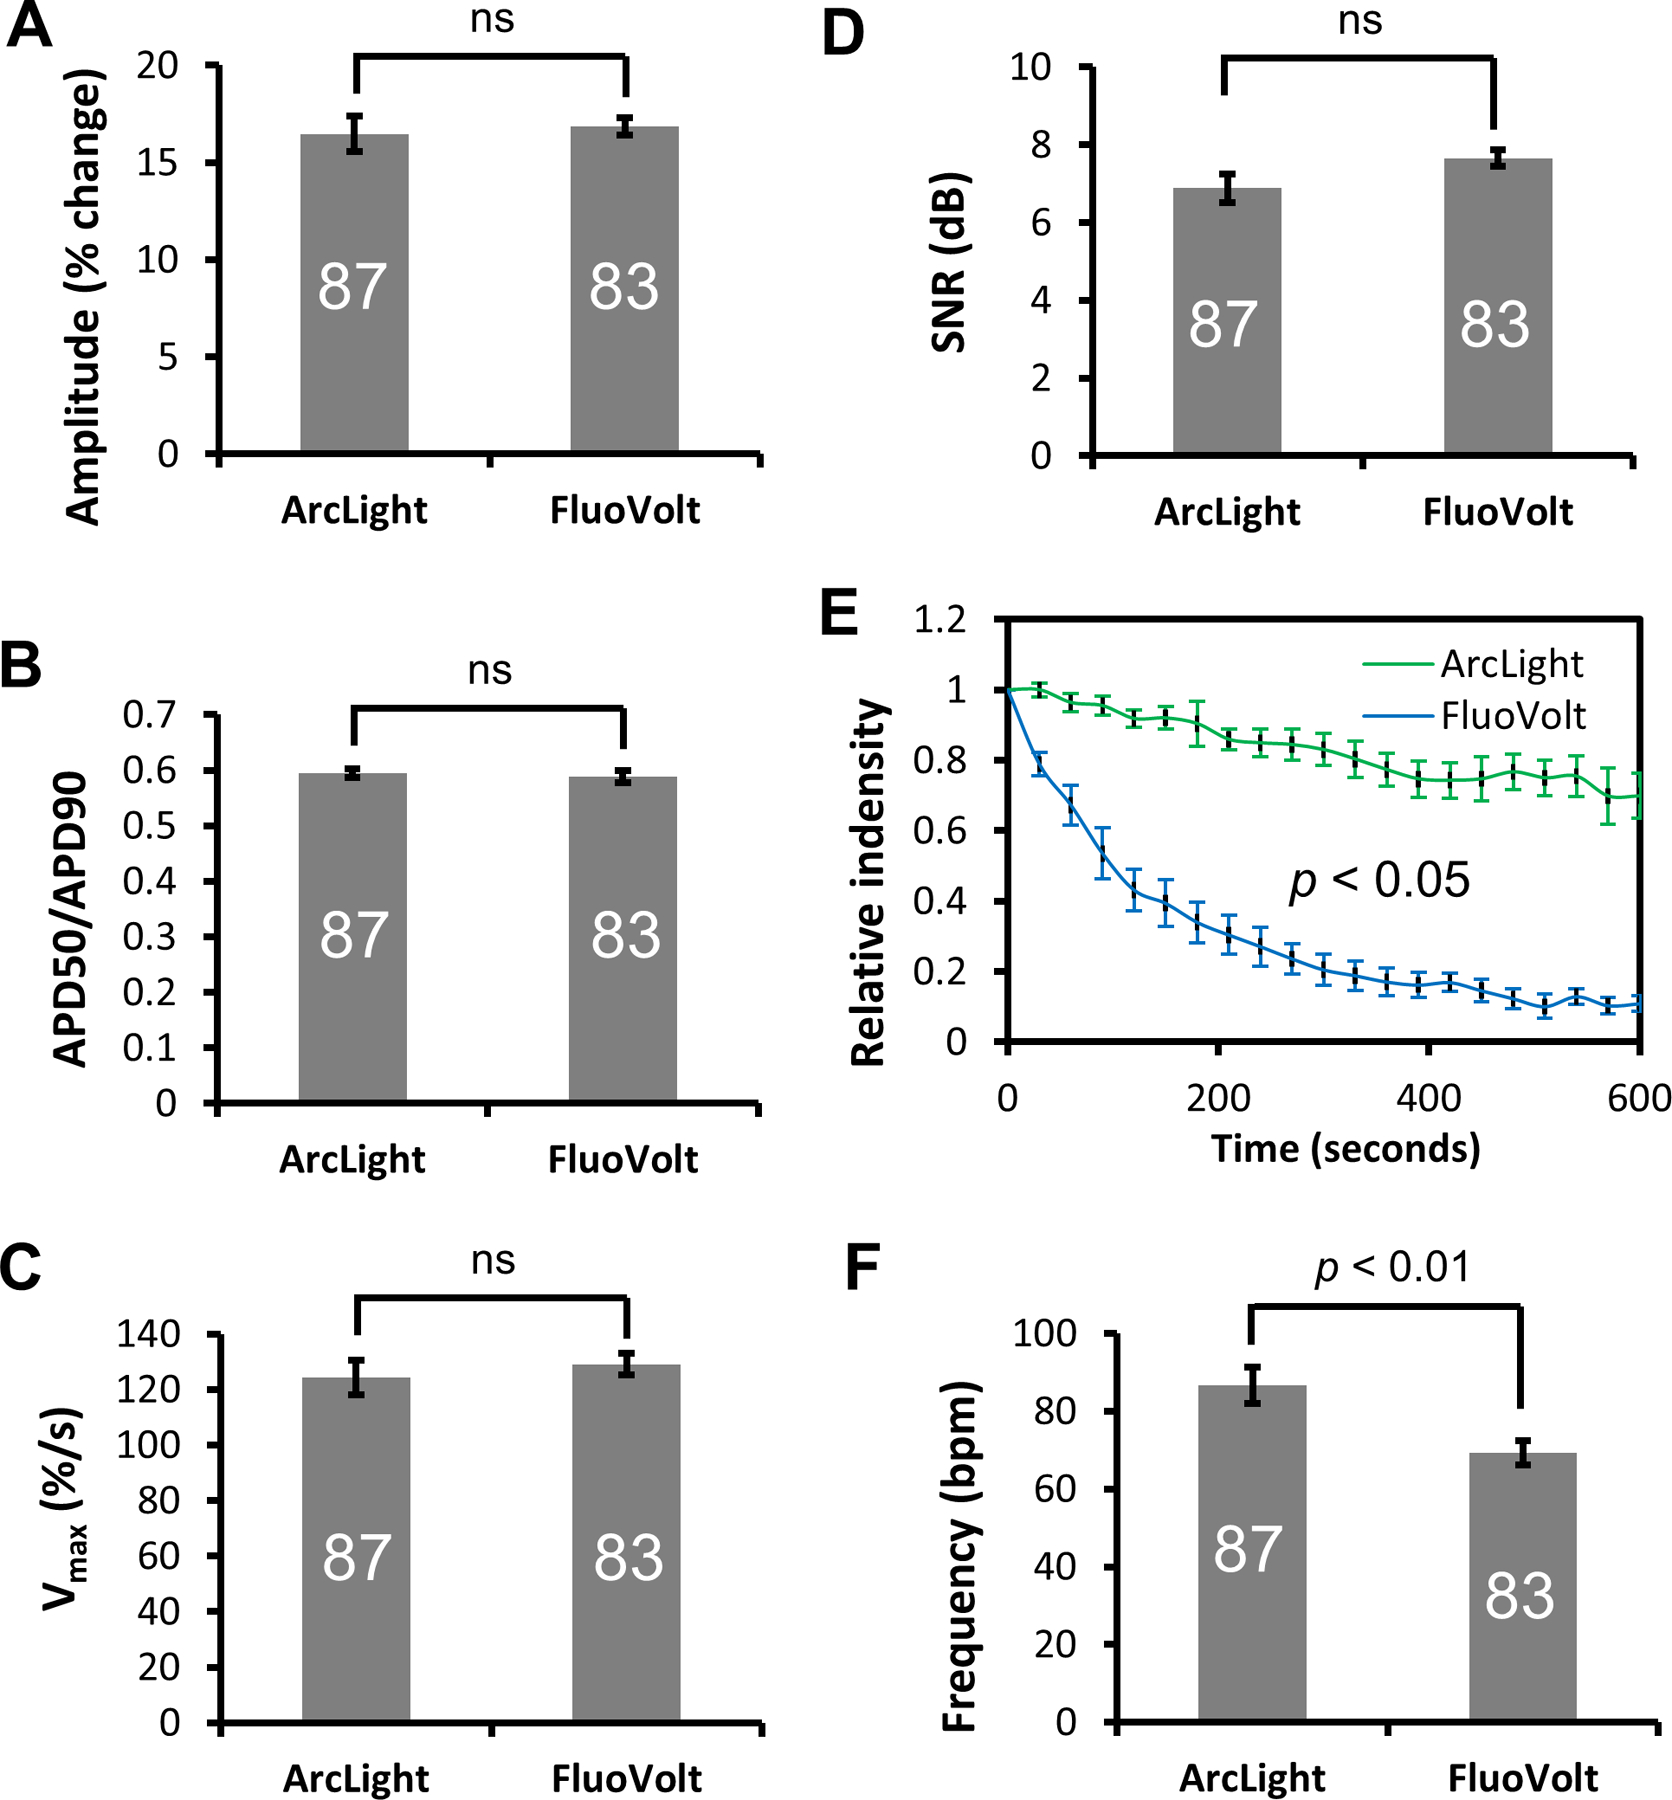
(A) Amplitude, (B) Ratio of APD50/APD90, (C) Vmax, and (D) Signal-to-noise ratio (SNR) of APs recorded with ArcLight reporter or FluoVolt are similar. (E) Head-to-head comparison of photo bleaching between ArcLight-CMs and FluoVolt-stained CMs under identical conditions. Experiments were done in full power of the illuminator. Data is presented as Mean ± SE of normalized relative fluorescence intensities as a function of time. (F) Automaticity frequency of hiPSC-CMs recorded with FuoVolt were significantly slower than those recorded with ArcLight. Data is presented as Mean ± SE. The number of CMs sampled is indicated inside each bar, except for the photobleaching experiments in E with n of 5. Statistical differences were analyzed by unpaired two-tail Student’s t-test, except for E, which was analyzed by Two-Way ANOVA. ns, not significant.
DISCUSSION
The rapid advancement in human induced stem cell research offers great opportunities for cardiac regenerative medicine, disease modeling, and drug screening. Functional electrophysiological assessment of hiPSC-CMs is vital to determine the state of these cells for cardiac development, disease modeling, or drug screening. ArcLight, an advanced GEVI, was initially developed to capture single APs and excitatory potentials in individual neurons and dendrites [23], and recently adopted to detect and long-term monitor dynamic membrane potentials in either human embryonic stem cell (hESC)-CMs or hiPSC-CMs [24–26]. To date, induced ArcLight expression in derived CMs had relied on generating hESC or hiPSC lines by lentiviral transductions followed by differentiation to CMs or by direct lentiviral transduction of hESC/hiPSC-CMs [24–26]. In all cases, there were random and high number of provirus integrations in the genome of lentiviral transduced hPSCs or derived CMs. While random integration may disrupt or mutate gene(s) and impair both global and local gene expression, the integrated ArcLight reporter element may also become silenced during and/or after differentiation as the genomic DNA methylation profile changes with cell type. To avoid these unpredictable consequences, we utilized CRISPR/Cas9 technology to generate a hiPSC line stably expressing ArcLight for AP assessment. The ArcLight-hiPSCs with the site-directed GEVI insertion into the AAVS1 safe harbor locus ensured that the selected positive Arclight-hiPSC clones continue to express the transgene regardless of the resulting differentiated cell type. Indeed, Arclight-hiPSCs were capable of differentiating into beating CMs and retained ArcLight expression enabling long-term monitoring of AP kinetics. Off-target effects were not investigated. Effects of ArcLight expression on electrophysiology of CMs were not tested, but observed action potentials were comparable to publication reporting ArcLight hiPSC line generated via Lentivirus [24]. However, no differences in proliferation and differentiation efficiency were observed between the WT and targeted clones.
Although our transmembrane reporter was expressed from a single copy of ArcLight, unlike the ArcLight reporter expressed from a high copy number of integrated provirus through lentivirus-mediated transduction [24, 25], the expression was sufficient for detection. Notably, by quantification of the live cell images, we show that the ArcLight-CMs are significantly brighter than ArcLight-hiPSCs, suggesting that ArcLight expression was upregulated by cardiac differentiation. We speculate this increase could be due to 1) a higher transcription possibly from enhanced regional transcription activities around the AAVS1 locus where the ArcLight construct was inserted, 2) an increase in plasma membrane of differentiated CMs relative to the hiPSCs as supported by our cell size quantification data (Fig. S4), which may accommodate more transmembrane ArcLight fusion proteins containing a Ci-VSP membrane-targeting leader sequence [23], and 3) “terminally” differentiated nature of CMs may increase the half-life of the fusion proteins or decrease the turnover rate and result in more ArcLight proteins in the membrane [49]. Flow cytometric analysis of ArcLight-CMs in high K+ solution exhibited a roughly 15% lower MFI when the membrane potential was clamped at 0 mV compared to those in Tyrode’s solution with MDP of ~ 65 mV [46, 47], supporting the ability of Arclight to respond to changes within physiologically relevant membrane voltages. This magnitude of fluorescence intensity change caused by the membrane potential change is in accordance with those reported previously [23–25]. Hence, constitutive and possibly enhanced expression of ArcLight from the AAVS1-targeted locus enabled recordings of APs in hiPSC-CMs.
An ArcLight-hiPSC reporter cell line has several advantageous features compared to the previously reported techniques for hPSC-derived CM phenotyping. First, optical recordings of APs compared to traditional patch-clamp recording is simpler and more straightforward, requiring less sophisticated equipment or special training to perform the assessment. Its noninvasive nature, with no mechanical disruption or disturbance to the cells, allows hiPSC-CMs to be repeatedly recorded for long-term studies such as electrophysiological maturation process in hiPSC-CMs. Second, unlike the voltage-sensitive dyes, such as FluoVolt, which need to be loaded each time prior to imaging, the ArcLight voltage-sensitive fusion protein expressed from the AAVS1 locus allows consistent membrane potential assessments with nearly no processing time and no phototoxicity. Phototoxicity had been observed in FluoVolt-loaded hiPSC-CMs, which may be due to the toxic metabolites of Pluronic F127, a hydrophilic non-ionic surfactant, required for successful loading of FluoVolt [21]. In addition, reduction in single cell contractility and automaticity in the presence of FluoVolt were also reported recently [48]. Although FluoVolt has reportedly faster kinetics [21] than ArcLight, we did not detect such difference in the Vmax. This may be due to the limitation of the sampling rate of our imaging system to detect such difference. Comparison of ArcLight to FluoVolt recordings in hiPSC-CMs indicated better optical performance of ArcLight with less photobleaching, with similar voltage sensitivity and SNR.
The ArcLight-hiPSC line does still have some limitations. First, the ArcLight fluorescence signal is not ratiometric, therefore, it only reports relative membrane potential changes [23, 24]. Measurements of actual membrane voltage can provide information on the resting membrane potential or MDP of the hiPSC-CMs. Second, as reported by the original developers and others, the relatively slower kinetics of ArcLight (temporal response limit of 9 ms) could cause a small delay of the recorded fluorescence response relative to the actual membrane potential change in the fast upstroke of phase 0 [22, 23, 50]. In addition, the fluorescence intensity is lower for the ArcLight-CMs compared to the FluoVolt-loaded cells. This may be due to low expression of ArcLight with a single allele integration of ArcLight in our hiPSC line. Furthermore, unlike the FluoVolt that has a positive voltage-fluorescence intensity relationship, ArcLight has an inverse relationship between the voltage and fluorescence intensity. Two possible approaches may improve the ArcLight brightness in the future. One is to use a tandem GEVI design (two copies of ArcLight linked by a T2A or P2A cleavage peptide) [51] or select for homozygous targeted clones [35]. Another strategy is to switch to an indicator with fluorescence intensity that is proportional to the voltage [52] or a brighter red-shifted GEVI [53]. Finally, possible effect of ArcLight expression on the electrophysiology of the ArcLight-CMs remains to be elucidated [24]. Nevertheless, the current ArcLight-hiPSC line allows repeated optical measurements of APs with minimal manipulation, facilitating electrophysiological assessment of hiPSC-CMs for studies such as cardiac development and drug screening.
CONCLUSION
In summary, we have developed a viral vector-free hiPSC line, stably expressing ArcLight through targeted genome editing to the AAVS1 locus. The ArcLight-hiPSC line retained proliferative and pluripotent capacities to be differentiated into functionally contracting CMs. The sustained expression of ArcLight in hiPSC-CMs enabled early detection, long-term and repeated assessment of APs, providing a convenient, yet robust means to noninvasively characterize and quantify changes in cellular electrophysiology. Moreover, phenotyping CMs differentiated from ArcLight-hiPSCs identified two distinctive subtypes: a fast beating group with small amplitude and APD50/APD90 ratio representing pacemaker-like CMs and a slow contracting group with large amplitude representing the working CMs. Our hiPSC line with targeted site-insertion of ArcLight, with a similar sensitivity but less phototoxicity and photobleaching than the commonly used FluoVolt sensitive dye, may prove to be a useful tool for studying cardiac development and drug testing.
Supplementary Material
Significance Statement.
ArcLight, a genetically encoded fluorescent voltage sensor, has been expressed in human pluripotent stem cell-derived cardiomyocytes through lentiviral transduction for reporting action potentials, but the resulting random genome integrations raise unpredictable consequences, including gene disruption and transgene silencing post-differentiation. Here, we report a human induced pluripotent stem cell (hiPSC) line stably expressing ArcLight from the AAVS1 safe harbor locus generated by CRISPR/Cas9. ArcLight expression in this hiPSC line persisted following myocardial differentiation. The long-term expression allowed repeated assessment of action potentials in hiPSC-derived cardiomyocytes. The CRISPR-generated ArcLight-hiPSC line is potentially useful for studying cardiac development, disease model, and drug testing.
ACKNOWLEDGMENTS
This work has been funded by a Discovery Quest Award (DISC2-10120) from the California Institute for Regenerative Medicine (CIRM) to DKL, NIH R01 HL085727, NIH R01 HL085844, and NIH R01 HL137228 to NC, VA Merit Review Grant I01 BX000576 and I01 CX001490 to NC. The contents do not represent the views of the U.S. Department of Veterans Affairs or the United States Government. NC is the holder of the Roger Tatarian Endowed Professorship in Cardiovascular Medicine and a part-time staff physician at VA Northern California Health Care System, Mather, CA.
Footnotes
DISCLOSURE OF POTENTIAL CONFLICTS OF INTEREST
DKL is a consultant for Novoheart, Ltd. All of the other authors declared no potential conflict of interest.
Data Availability Statement
The software developed in this project is available in this website (https://amlab.shinyapps.io/spikemap/).
References
- 1.Shi Y, et al. , Induced pluripotent stem cell technology: a decade of progress. Nat Rev Drug Discov, 2017. 16(2): p. 115–130. [DOI] [PMC free article] [PubMed] [Google Scholar]
- 2.Yu J, et al. , Induced pluripotent stem cell lines derived from human somatic cells. Science, 2007. 318(5858): p. 1917–20. [DOI] [PubMed] [Google Scholar]
- 3.Takahashi K, et al. , Induction of pluripotent stem cells from adult human fibroblasts by defined factors. Cell, 2007. 131(5): p. 861–72. [DOI] [PubMed] [Google Scholar]
- 4.Burridge PW, et al. , Chemically defined generation of human cardiomyocytes. Nat Methods, 2014. 11(8): p. 855–60. [DOI] [PMC free article] [PubMed] [Google Scholar]
- 5.Lian X, et al. , Robust cardiomyocyte differentiation from human pluripotent stem cells via temporal modulation of canonical Wnt signaling. Proc Natl Acad Sci U S A, 2012. 109(27): p. E1848–57. [DOI] [PMC free article] [PubMed] [Google Scholar]
- 6.Matsa E, Ahrens JH, and Wu JC, Human Induced Pluripotent Stem Cells as a Platform for Personalized and Precision Cardiovascular Medicine. Physiological Reviews, 2016. 96(3): p. 1093–1126. [DOI] [PMC free article] [PubMed] [Google Scholar]
- 7.Itzhaki I, et al. , Modelling the long QT syndrome with induced pluripotent stem cells. Nature, 2011. 471(7337): p. 225–9. [DOI] [PubMed] [Google Scholar]
- 8.Shaheen N, Shiti A, and Gepstein L, Pluripotent Stem Cell-Based Platforms in Cardiac Disease Modeling and Drug Testing. Clin Pharmacol Ther, 2017. 102(2): p. 203–208. [DOI] [PubMed] [Google Scholar]
- 9.Navarrete EG, et al. , Screening drug-induced arrhythmia [corrected] using human induced pluripotent stem cell-derived cardiomyocytes and low-impedance microelectrode arrays. Circulation, 2013. 128(11 Suppl 1): p. S3–13. [DOI] [PMC free article] [PubMed] [Google Scholar]
- 10.Matsa E, et al. , Transcriptome Profiling of Patient-Specific Human iPSC-Cardiomyocytes Predicts Individual Drug Safety and Efficacy Responses In Vitro. Cell Stem Cell, 2016. [DOI] [PMC free article] [PubMed] [Google Scholar]
- 11.Magdy T, et al. , Human Induced Pluripotent Stem Cell (hiPSC)-Derived Cells to Assess Drug Cardiotoxicity: Opportunities and Problems. Annu Rev Pharmacol Toxicol, 2018. 58: p. 83–103. [DOI] [PMC free article] [PubMed] [Google Scholar]
- 12.Chong JJ, et al. , Human embryonic-stem-cell-derived cardiomyocytes regenerate non-human primate hearts. Nature, 2014. 510(7504): p. 273–7. [DOI] [PMC free article] [PubMed] [Google Scholar]
- 13.Liu YW, et al. , Human embryonic stem cell-derived cardiomyocytes restore function in infarcted hearts of non-human primates. Nat Biotechnol, 2018. 36(7): p. 597–605. [DOI] [PMC free article] [PubMed] [Google Scholar]
- 14.Protze SI, et al. , Sinoatrial node cardiomyocytes derived from human pluripotent cells function as a biological pacemaker. Nat Biotechnol, 2017. 35(1): p. 56–68. [DOI] [PubMed] [Google Scholar]
- 15.Chauveau S, et al. , Induced Pluripotent Stem Cell-Derived Cardiomyocytes Provide In Vivo Biological Pacemaker Function. Circ Arrhythm Electrophysiol, 2017. 10(5): p. e004508. [DOI] [PMC free article] [PubMed] [Google Scholar]
- 16.Hamill OP, et al. , Improved Patch-Clamp Techniques for High-Resolution Current Recording from Cells and Cell-Free Membrane Patches. Pflugers Archiv-European Journal of Physiology, 1981. 391(2): p. 85–100. [DOI] [PubMed] [Google Scholar]
- 17.Spira ME and Hai A, Multi-electrode array technologies for neuroscience and cardiology. Nat Nanotechnol, 2013. 8(2): p. 83–94. [DOI] [PubMed] [Google Scholar]
- 18.Asakura K, et al. , Improvement of acquisition and analysis methods in multi-electrode array experiments with iPS cell-derived cardiomyocytes. J Pharmacol Toxicol Methods, 2015. 75: p. 17–26. [DOI] [PubMed] [Google Scholar]
- 19.Miller EW, et al. , Optically monitoring voltage in neurons by photo-induced electron transfer through molecular wires. Proc Natl Acad Sci U S A, 2012. 109(6): p. 2114–9. [DOI] [PMC free article] [PubMed] [Google Scholar]
- 20.Besser RR, et al. , Engineered Microenvironments for Maturation of Stem Cell Derived Cardiac Myocytes. Theranostics, 2018. 8(1): p. 124–140. [DOI] [PMC free article] [PubMed] [Google Scholar]
- 21.Broyles CN, Robinson P, and Daniels MJ, Fluorescent, Bioluminescent, and Optogenetic Approaches to Study Excitable Physiology in the Single Cardiomyocyte. Cells, 2018. 7(6). [DOI] [PMC free article] [PubMed] [Google Scholar]
- 22.Platisa J and Pieribone VA, Genetically encoded fluorescent voltage indicators: are we there yet? Current Opinion in Neurobiology, 2018. 50: p. 146–153. [DOI] [PMC free article] [PubMed] [Google Scholar]
- 23.Jin L, et al. , Single action potentials and subthreshold electrical events imaged in neurons with a fluorescent protein voltage probe. Neuron, 2012. 75(5): p. 779–85. [DOI] [PMC free article] [PubMed] [Google Scholar]
- 24.Leyton-Mange JS, et al. , Rapid cellular phenotyping of human pluripotent stem cell-derived cardiomyocytes using a genetically encoded fluorescent voltage sensor. Stem Cell Reports, 2014. 2(2): p. 163–70. [DOI] [PMC free article] [PubMed] [Google Scholar]
- 25.Shinnawi R, et al. , Monitoring Human-Induced Pluripotent Stem Cell-Derived Cardiomyocytes with Genetically Encoded Calcium and Voltage Fluorescent Reporters. Stem Cell Reports, 2015. 5(4): p. 582–96. [DOI] [PMC free article] [PubMed] [Google Scholar]
- 26.Song LJ, et al. , Dual Optical Recordings for Action Potentials and Calcium Handling in Induced Pluripotent Stem Cell Models of Cardiac Arrhythmias Using Genetically Encoded Fluorescent Indicators. Stem Cells Translational Medicine, 2015. 4(5): p. 468–475. [DOI] [PMC free article] [PubMed] [Google Scholar]
- 27.Shaheen N, et al. , Human Induced Pluripotent Stem Cell-Derived Cardiac Cell Sheets Expressing Genetically Encoded Voltage Indicator for Pharmacological and Arrhythmia Studies. Stem Cell Reports, 2018. [DOI] [PMC free article] [PubMed] [Google Scholar]
- 28.Cockrell AS and Kafri T, Gene delivery by lentivirus vectors. Molecular Biotechnology, 2007. 36(3): p. 184–204. [DOI] [PubMed] [Google Scholar]
- 29.Smith JR, et al. , Robust, persistent transgene expression in human embryonic stem cells is achieved with AAVS1-targeted integration. Stem Cells, 2008. 26(2): p. 496–504. [DOI] [PubMed] [Google Scholar]
- 30.Urnov FD, et al. , Genome editing with engineered zinc finger nucleases. Nat Rev Genet, 2010. 11(9): p. 636–46. [DOI] [PubMed] [Google Scholar]
- 31.Joung JK and Sander JD, TALENs: a widely applicable technology for targeted genome editing. Nat Rev Mol Cell Biol, 2013. 14(1): p. 49–55. [DOI] [PMC free article] [PubMed] [Google Scholar]
- 32.Ben Jehuda R, Shemer Y, and Binah O, Genome Editing in Induced Pluripotent Stem Cells using CRISPR/Cas9. Stem Cell Reviews and Reports, 2018. 14(3): p. 323–336. [DOI] [PubMed] [Google Scholar]
- 33.Kotin RM, Linden RM, and Berns KI, Characterization of a preferred site on human chromosome 19q for integration of adeno-associated virus DNA by non-homologous recombination. EMBO J, 1992. 11(13): p. 5071–8. [DOI] [PMC free article] [PubMed] [Google Scholar]
- 34.Carlson-Stevermer J and Saha K, Genome Editing in Human Pluripotent Stem Cells. Methods Mol Biol, 2017. 1590: p. 165–174. [DOI] [PMC free article] [PubMed] [Google Scholar]
- 35.Oceguera-Yanez F, et al. , Engineering the AAVS1 locus for consistent and scalable transgene expression in human iPSCs and their differentiated derivatives. Methods, 2016. 101: p. 43–55. [DOI] [PubMed] [Google Scholar]
- 36.Yechikov S, et al. , Same-Single-Cell Analysis of Pacemaker-Specific Markers in Human Induced Pluripotent Stem Cell-Derived Cardiomyocyte Subtypes Classified by Electrophysiology. Stem Cells, 2016. 34(11): p. 2670–2680. [DOI] [PMC free article] [PubMed] [Google Scholar]
- 37.Chen G, et al. , Chemically defined conditions for human iPSC derivation and culture. Nat Methods, 2011. 8(5): p. 424–9. [DOI] [PMC free article] [PubMed] [Google Scholar]
- 38.Campeau E, et al. , A versatile viral system for expression and depletion of proteins in mammalian cells. PLoS One, 2009. 4(8): p. e6529. [DOI] [PMC free article] [PubMed] [Google Scholar]
- 39.Lan JY, et al. , Depolarization of Cellular Resting Membrane Potential Promotes Neonatal Cardiomyocyte Proliferation In Vitro. Cell Mol Bioeng, 2014. 7(3): p. 432–445. [DOI] [PMC free article] [PubMed] [Google Scholar]
- 40.Cone CD Jr. and Cone CM, Induction of mitosis in mature neurons in central nervous system by sustained depolarization. Science, 1976. 192(4235): p. 155–8. [DOI] [PubMed] [Google Scholar]
- 41.Winston Chang JC, Allaire JJ, Xie Yihui and McPherson Jonathan, Shiny: Web Application Framework for R. R Package, 2018. [Google Scholar]
- 42.Kaestner L, et al. , Genetically Encoded Voltage Indicators in Circulation Research. Int J Mol Sci, 2015. 16(9): p. 21626–42. [DOI] [PMC free article] [PubMed] [Google Scholar]
- 43.Mali P, et al. , RNA-guided human genome engineering via Cas9. Science, 2013. 339(6121): p. 823–6. [DOI] [PMC free article] [PubMed] [Google Scholar]
- 44.Ran FA, et al. , Genome engineering using the CRISPR-Cas9 system. Nature Protocols, 2013. 8(11): p. 2281–2308. [DOI] [PMC free article] [PubMed] [Google Scholar]
- 45.Paik DT, et al. , Large-Scale Single-Cell RNA-Seq Reveals Molecular Signatures of Heterogeneous Populations of Human Induced Pluripotent Stem Cell-Derived Endothelial Cells. Circ Res, 2018. 123(4): p. 443–450. [DOI] [PMC free article] [PubMed] [Google Scholar]
- 46.Lieu DK, et al. , Mechanism-based facilitated maturation of human pluripotent stem cell-derived cardiomyocytes. Circ Arrhythm Electrophysiol, 2013. 6(1): p. 191–201. [DOI] [PMC free article] [PubMed] [Google Scholar]
- 47.Yechikov S, et al. , Same-Single-Cell Analysis of Pacemaker-Specific Markers in Human Induced Pluripotent Stem Cell-Derived Cardiomyocyte Subtypes Classified by Electrophysiology. Stem Cells, 2016. [DOI] [PMC free article] [PubMed] [Google Scholar]
- 48.Paul Robinson AJS, Broyles Connor N, Sievert Kolja, Chang Yu-Fen, Brook Frances A, Zhang Xiaoyu, Watkins Hugh, Abassi Yama A, Geeves Michael A, Redwood Charles, Daniels Matthew J, Measurement of myofilament calcium in living cardiomyocytes using a targeted genetically encoded indicator. bioRxiv, 2018. [Google Scholar]
- 49.Noormohammadi A, et al. , Mechanisms of protein homeostasis (proteostasis) maintain stem cell identity in mammalian pluripotent stem cells. Cell Mol Life Sci, 2018. 75(2): p. 275–290. [DOI] [PMC free article] [PubMed] [Google Scholar]
- 50.Xu Y, Zou P, and Cohen AE, Voltage imaging with genetically encoded indicators. Curr Opin Chem Biol, 2017. 39: p. 1–10. [DOI] [PMC free article] [PubMed] [Google Scholar]
- 51.Loehlin DW and Carroll SB, Expression of tandem gene duplicates is often greater than twofold. Proceedings of the National Academy of Sciences of the United States of America, 2016. 113(21): p. 5988–5992. [DOI] [PMC free article] [PubMed] [Google Scholar]
- 52.Platisa J, et al. , Directed Evolution of Key Residues in Fluorescent Protein Inverses the Polarity of Voltage Sensitivity in the Genetically Encoded Indicator ArcLight. ACS Chem Neurosci, 2017. 8(3): p. 513–523. [DOI] [PMC free article] [PubMed] [Google Scholar]
- 53.Abdelfattah AS, et al. , A Bright and Fast Red Fluorescent Protein Voltage Indicator That Reports Neuronal Activity in Organotypic Brain Slices. Journal of Neuroscience, 2016. 36(8): p. 2458–2472. [DOI] [PMC free article] [PubMed] [Google Scholar]
Associated Data
This section collects any data citations, data availability statements, or supplementary materials included in this article.


