

Abstract
Sea urchin harvesting has rapidly expanded in the last decades. Since many sea urchin species play important ecological role, large-scale commercial sea urchin fisheries can have complex effects on benthic communities. In many temperate regions, overharvesting has compromised marine ecosystems to such an extent that reintroduction of sea urchins raised in captivity may be a valid solution for the enhancement of depleted marine wild populations. In some regions of the Mediterranean Sea, improving the growth efficiency of captive sea urchin Paracentrotus lividus to be reintroduced has become a widespread practice. However, no study has yet considered the potential behavioural effects of raising sea urchins in captivity when they are introduced in the natural environment. This study provides information about the behavioural effects of captivity on P. lividus in terms of locomotion performance, a trait that can be fundamental for responding to predators and for relocation after environmental disturbances such as currents and waves. Movements of captive-born and wild sea urchins were video-recorded and compared in (i) total exposure to external cues, (ii) partial exposure to external cues and (iii) absence of external cues. Latency of locomotion, average speed and average velocity of sea urchins showed significant differences with respect to the level of exposure and their origin (i.e. wild vs. captive-born). Our results demonstrate that captive-born sea urchins in the wild showed long latency and slower locomotor performance when compared to wild sea urchins. Conversely, the straightness-of-path and locomotion direction of captive-born and wild sea urchins were similar in natural settings. Our results therefore suggest that captive-born sea urchins suffer the negative effects of captivity when introduced in a natural environment. Understanding the factors that decrease the performance of sea urchin will be important for developing procedures aimed at minimizing the negative effect of captivity before release into the wild.
Keywords: animal behaviour, captivity, locomotion, repopulation, rewilding, sea urchins
Introduction
The overexploitation of species involved in the typical tri-trophic interaction ‘fish-sea urchins-macrophyte’ is one of the clearest examples reported for coastal ecosystems of temperate regions (Sala et al., 1998; Loi et al., 2017). Overfishing is known to have led to the uncontrolled proliferation of herbivore sea urchins, such as the functional key species Paracentrotus lividus in Mediterranean Sea, with dramatic consequences on benthic communities (McClanahan and Sala, 1997; Sala et al., 1998; Steneck et al., 2002; Steneck et al., 2004; Guidetti and Sala, 2007; Prado et al., 2007; Sala et al., 2012). The decline of the natural fish stocks caused invertebrate to be part of the global fishery (Conand and Byrne 1993; Anderson et al., 2011), for example the sea urchin harvesting of P. lividus in the South of France and Italy (Andrew et al., 2002; Pais et al., 2012).
In general, the consequence of the systematic removal of sea urchin is that community structures have largely changed in several temperate macrophyte ecosystems (e.g. McShane et al., 1994; Villouta, 2000; Villouta et al., 2001). In temperate reefs, large-scale harvesting of sea urchins can determine a rapid development of stands of large brown algae and consequent changes in community composition (Andrew et al., 2002). Thus, along with climate change, overfishing in general has compromised marine ecosystems to such an extent that many traditional conservation targets are now out of reach like the case of the Bay of Biscay anchovy (Barange et al., 2010; Rosenberg and Fong, 2013).
In the context of resource over exploitation, like in many terrestrial ecosystems (Ripple and Beschta, 2012), the reintroduction of organisms raised in captivity is considered as a potential solution for the enhancement of depleted marine wild populations (Juinio-Meñez et al. 2008; Cárcamo, 2015; Couvray et al., 2015). For example, a number of reintroductions have been obtained on threatened populations of commercial fish species (Hutchison et al., 2012). However, it is well known that captivity can cause significant alterations in behavioural traits (Brooker et al., 2016). Captive-born fish may be less responsive to natural predators (Alvarez and Nicieza, 2003), may fail to recognize natural or wild foods or may behave differently than wild fish. Specifically, they may not use available shelter, they may bury less and may form less cohesive shoals than wild conspecifics (Hutchison et al., 2012).
Captive breeding has also been used to produce and reintroduce sea urchins in the wild when populations are locally threatened by intense harvesting (Brady and Scheilbling, 2005; Meñez, 2016; Hannon, 2018). Many studies have been carried out to improve the efficiency of breeding in terms of growth of organisms and their successive reintroduction into the wild, but no significant results have been reached so far (Le Gall and Bucaille, 1989; Le Gall, 1990; Grosjean, et al., 1998; Kelly et al., 1998; Robinson and Colborne, 1998; Cook and Kelly, 2007). Reintroduction of captive P. lividus was found to return the stock abundance back to the original density, to restore the reproductive capacity of depleted populations (Juinio-Meñez et al., 2008; Loi et al., 2017), and it is supposed to be a restoration action that returns the ecosystem back to the way it was (e.g. Corlett, 2016).
Until now, however, no study has considered the potential behavioural effects of raising of sea urchins in captivity, once they are released into the wild. Maladaptive behaviours may be fatal for the success of sea urchin reintroduction, as they are largely preyed upon by fish through the top-down control mechanism in marine benthic ecosystems (McClanahan and Sala, 1997; Guidetti et al., 2004; Hereu et al., 2008). Survival strongly depends on the ability of sea urchins to migrate among exposed feeding areas and available shelters provided by the habitat structure such as rocky crevices, holes or seagrass coverage (e.g. Hereu et al., 2005; Farina et al., 2009; Farina et al., 2014). Thus, the prowess to feed, their locomotor performance and their anti-predator behaviours become crucial points for the long-term success of the reintroduction.
In general, sea urchin breeding does not include a prior acclimation before the reintroduction into the wild (Shier, 2016). Captive-born specimens are bred in confined spaces at high-density conditions which makes their movements difficult. Individuals are fed several times a week and in absence of predatory threats, in order to speed up the growth until a suitable size for reintroduction is reached (see methods). Thus, in order to correct for potential behavioural malfunctions due to captivity, we need to increase our understanding of how captive-born sea urchins behave in the wild environment. It is known that many factors such as grazing availability, predation risk (Mattisson et al., 1977; Shepherds and Boudouresque, 1979; Jones and Andrew, 1990; Alvarez and Nicieza, 2003), currents and waves (Lissner, 1980; James, 2000; Hutchison et al., 2012; Cohen-Rengifo et al., 2018), substrate (Laur et al., 1986) and topography (Rodriguez and Ojeda, 1998) can affect sea urchin behaviour. For instance, Dumont et al. (2007) reported that sea urchins move in random directions most of the time until they detect the food source. Numerous studies report a direct effect of hydrodynamics on the locomotion of sea urchins and other echinoderm species. The movement rate of Strongylocentrotus droebachiensis (Dumont et al., 2006) decreases with increasing current speed. Echinometra oblonga and Echinometra mathaei generally move along the water flow and rarely across the current (Pan et al., 2015). In addition, environmental cues, such as sunlight, food sources, shelters and water circulation, strongly influence sea urchin movements (e.g. Yoshida, 1966; Dance, 1987; Domenici et al., 2003).
The aim of the current study is to evaluate potential behavioural malfunctions and locomotor performance in captive-born P. lividus as a first step towards evaluating their suitability for reintroduction into the wild. In order to test different levels of environmental exposure, observations are carried out in the field (open and closed exposures) and in the laboratory (indoor exposure).
Materials and methods
Origin of the animals
Captive-born juveniles of P. lividus (hereafter Captive) were originated from 10 mixed-broodstock adult sea urchins (diameter > 4.5 cm), consisting of five male and five female. Broodstock were collected from 5-m depth at Su Pallosu, Sardinia, Italy (40°03′205″ N, 8°24′794″ E). Methods for reproduction and larval and post-larval rearing followed those used by Brundu et al. (2016, 2017).
Both larvae and juveniles were reared in the International Marine Centre—IMC laboratories (Oristano, Sardinia, Italy) under controlled conditions in filtered (1 μm) natural seawater at 36.5 ± 1 ppt, temperature of 20 ± 2°C, and exposed to a 12 h L/12 h D photoperiod. Juvenile individuals were maintained in a recirculating aquaculture system (flow rate of 5 L min−1) consisting of a 600-L rectangular tank and supplied with biological and mechanical filtration (10 μm). Individuals were fed ad libitum with fresh thalli of Ulva lactuca for about 16 months, in order to optimize their growth until they reached the suitable size to be reintroduced (about 1.5 cm of a test diameter without spines; Tegner, 1989). Moreover, wild juveniles (hereafter Wild) in the same range of size were collected randomly by scuba diving from a population located on a bedrock in Su Pallosu bay between 1 and 2 m depth (Western Sardinia; 40°03′103″ N, 8°24′241″ E).
Before starting the observations, both in the field and in laboratory, captive-born and wild sea urchins were acclimated for 24 h in standard conditions of no food and at 20°C temperature to the environment of the experiment. Acclimation indoor was carried out in circular tanks of white resin of 50-L capacity, while in the sea, urchins were placed in nylon nets and left on the bottom in the area where the experiments were going to take place.
Locomotor performance
Conditions of exposure to external cues
Locomotor performance of captive and wild sea urchins was evaluated under three different treatment conditions of exposure to external cues: (i) total exposure to external cues (Open), (ii) partial exposure to external cues (Closed) that were verified in the field and (iii) absence of external cues (Indoor).
For each treatment, sea urchins were placed one by one in the middle of the field of recording that consisted in a circular platform of flat granite rock (46 cm diameter and 4 cm thickness).
Observations were carried out in the summer time, when the temperature and salinity of the seawater were similar to the laboratory tank (see below).
For the Open exposure, the open field condition of Su Pallosu bay at 1-m depth, characterized by rocky seabed with erect and turf coverage, primarily Cystoseira spp., Dictyota spp., Padina pavonica and Jania rubens were used (Loi et al., 2017; Fig. 1a).
Figure 1.

Experimental set-up of three treatments with different levels of environmental exposure: Open (a); Closed (b); Indoor (c)
The Closed exposure was set up at the same field site, covering the seabed with a circular surface of white-plastic cloth of 80 cm diameter. A white plastic ring of 15-cm height was positioned along the perimeter of the cloth, standardizing the horizontal view of the sea urchin (see Fig. 1b).
The Indoor treatment was set up indoor in a cylindrical tank (157 L volume, 80 cm diameter, 31 cm depth) coated on the inner side with a white plastic cloth to a height of 15 cm. Seawater was at a salinity of 37.5 ppt and temperature at 20 ± 2°C in static conditions, with no aeration and no direct light sources (Fig. 1c).
Video recording
Video trials to record locomotion performance were conducted over a 3-day period between 09:30 and 11:00 am. The study was carried out during typical summer time condition characterized by high atmospheric pressure, absence of wind and calm water (Farina et al., 2018).
Prior to the experiments, both Captive and Wild were acclimated and maintained without food for 24 h. For each treatment, from 10 to 16 individuals from each group (Captive and Wild) were measured. Before each video recording, the platform was carefully cleaned and overturned to avoid possible influences of the previous test.
Sea urchin movements were recorded with high-definition action cameras (GoPro Hero®) with time-lapse set using a framing rate of 12 frames per minute. The camera was positioned 50 cm above the circular platform (see Fig. 1). For each trial, recording started as soon as the individual was positioned on the bottom and ended when the individual reached the edge of the circular platform, or for a maximum period of 15 min if individuals had not reached the edge of the platform within this time period.
Variables describing locomotion performance
Performance of sea urchin locomotion was assessed by estimating the following variables: (i) latency of locomotion, (ii) average speed, (iii) average velocity, (iv) straightness-of-path and (v) locomotion direction (Table 1). The video images representing the successive positions occupied by the individual every 5 s were analysed with WINanalyze 1.5 software (Mikromak®).
Table 1.
Summary of variables describing locomotion performance
| Type | Expo | N° obs. | Latency (s) | SE | Average speed (cm/min) | SE | Average velocity (cm/min) | SE | Straight | SE |
|---|---|---|---|---|---|---|---|---|---|---|
| Wild | Open | 10 | 0.5 | 0.5 | 6.0 | 1.8 | 5.4 | 5.1 | 0.9 | 0.1 |
| Captive | Open | 13 | 3.5 | 1.6 | 4.6 | 1.0 | 3.8 | 3.4 | 0.8 | 0.2 |
| Wild | Closed | 16 | 12.8 | 3.4 | 6.3 | 1.2 | 4.8 | 2.4 | 0.8 | 0.2 |
| Captive | Closed | 12 | 22.1 | 4.4 | 5.5 | 0.7 | 4.3 | 3.3 | 0.8 | 0.2 |
| Wild | Indoor | 15 | 45.3 | 5.5 | 2.3 | 0.5 | 1.2 | 1.8 | 0.6 | 0.3 |
| Captive | Indoor | 15 | 6.0 | 1.7 | 4.2 | 1.5 | 2.6 | 4.5 | 0.6 | 0.2 |
Number of observations and mean values with standard error of latency, average speed, average velocity and straightness-of-path in relation of the Origin of the animals and level of the exposure to the environmental cues.
(i) Latency of locomotion was measured as the time (seconds) between the beginning of the trial (i.e. Frame 0, when the sea urchin was positioned at the centre of the circular platform) and the first movement of the sea urchin which corresponded to distancing at least 3 mm from the starting point. This variable therefore measures the readiness to move after repositioning which can be an important trait, for example when sea urchins are dislocated.
(ii) Average speed was measured from the first frame in which an individual moved (cm/min), i.e. after the time corresponding to latency of locomotion until the individual reached the edge of the circular platform, or for a maximum period of 15 min if individuals had not reached the edge of the platform within this time period. Spatial positions (x and y coordinates) were determined from successive frames over the duration of the recording period (i.e. until the sea urchin reached the edge of the circular platform) (Fig. 2). Spatial coordinates were converted to distance travelled (cm) to calculate individual average speed (i.e. independent of direction) throughout each trial. Average speed is therefore a measure of the mobility with which a sea urchin can displace itself through crawling in any direction.
Figure 2.

An example of a track of a Captive-born sea urchin. The red dotted line represents the position of the individual in each frame while the white dotted line is the linear distance between the position of the individual in the first and the last frame.
(iii) Average velocity (i.e. in the direction of travel) was calculated as Ld/t, where Ld represents the straight segment between the position of the individual in the first (Frame 0) and the last frame (Fig. 2), and t is the time taken to cover this distance (cm/min). Average velocity is therefore related to the combination of the ability of the sea urchins to move in a straight direction and at a fast speed of locomotion, and it includes the delay due to latency of locomotion. For a given average speed, average velocity is higher when the path of locomotion is straight rather than convoluted (see Fig. 2).
(iv) Straightness-of-path (I) is a dimensionless index, calculated as I = D/L (Batschelet, 1981), where D corresponds to the distance between the positions of an individual in the first and last frame, and L is the sum of all segments based on the positions in successive frames (length of path). The I index ranges from 0, corresponding to maximum tortuosity, to 1, corresponding to maximum linearity. This variable is therefore related to the ability of sea urchins to move in a straight path.
(v) Locomotion direction (0° to 360°) was determined as the line connecting the first and last frame positions of the trial, with 0° being North, 180° South, 90° East and 270° West. This is a circular variable (Batschelet, 1981), related to the direction undertaken by the sea urchin.
Data analysis
We carried out the analysis of variance for latency, average speed, average velocity and straightness-of-path. The analysis was set with ‘Origin’ (Captive and Wild) and ‘Exposure’ (Indoor, Open and Closed) as fixed factors, while ‘Size’ of specimens as random factor. Least-squares means were conducted as multiple comparisons among interactions of factors (Russell, 2016). Assumptions of normal distribution and homogeneity of variance of the response variables were analysed using D’Agostino-Pearson and Cochran’s tests. Average speed and average velocity that follow normal distribution but whose replicates are unbalanced were analysed with the linear mixed-effects model for repeated-measures ANOVA two-ways and random factor. In contrast, given the non-normal distribution followed by latency and straightness-of-path, analysis of variance was performed after an alignment and ranking step with the analysis of Aligned Rank Transform with random factor (Art; Wobbrock et al., 2011). All the analyses were performed using R Studio (R v. 3.1.0, Development Core Team, 2014).
Locomotion direction was treated as a circular variable and was analysed for randomness using Rayleigh’s test (Batschelet, 1981). Two-way ANOVA for circular data (based on Harrison and Kanji, 1988; Berens, 2009) and post hoc multiple comparisons based on a circular statistics (Mardia–Watson–Wheeler test; Batschelet, 1981) were run to test the effect of ‘Origin’, ‘Exposure’ and the interaction ‘Origin’*‘Exposure’.
Results
Locomotor performance in general was affected by the Origin of the sea urchins, by their Exposure to the environmental cues and by the interactions of these two factors. Captive had on average a significantly different latency than Wild (Fig. 3a, Table 2a and Supplementary Fig. 1a). Specifically, latency of Captive was seven times longer than that of Wild in the Open exposure (3.5 ± 1.6 s versus 0.5 ± 0.5 s respectively) but 7.5 times shorter in the Indoor exposure (6.0 ± 1.7 s versus 45.3 ± 5.5 s respectively). Latency in the Closed exposure resulted also significantly different between the Origins (22.1 ± 4.4 s for Captive and 12.8 ± 3.4 s for Wild).
Figure 3.
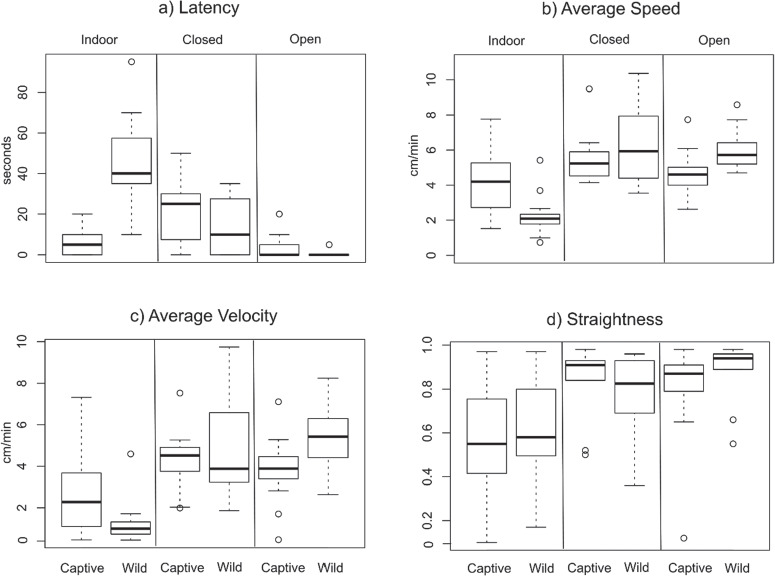
Box plots represent (a) latency of locomotion (sec), (b) average speed (cm/min), (c) average velocity (cm/min) and (d) straightness-of-path, for Captive and Wild juveniles in Indoor, Closed and Open treatments. Values are expressed as mean ± SE (see Table 1). Significant differences are reported in Table 2 and Appendix 1.
Table 2.
Two-way ANOVA for locomotion performance variables
| a. Latency | |||
|---|---|---|---|
| Source | Numerator df | F value | P value |
| Origin | 1 | 19.058 | <0.001 |
| Exposure | 2 | 29.889 | <0.001 |
| Origin*Exposure | 2 | 32.685 | <0.001 |
| b. Average speed | |||
| Source | Numerator df | F value | P value |
| Origin | 1 | 7.31179 | 0.0086 |
| Exposure | 2 | 5.55492 | 0.0058 |
| Origin*Exposure | 2 | 5.33711 | 0.007 |
| c. Average velocity | |||
| Source | Numerator df | F value | P value |
| Origin | 1 | 0.781 | 0.0015 |
| Exposure | 2 | 22.425 | 0.119 |
| Origin*Exposure | 2 | 8.130 | 0.0006 |
| d. Straightness-of-path | |||
| Source | Numerator df | F value | P value |
| Origin | 1 | 0.006 | 0.93836 |
| Exposure | 2 | 11.209 | <0.001 |
| Origin*Exposure | 2 | 0.667 | 0.51599 |
Two-way analysis of variance (ANOVA) for (a) latency, (b) average speed, (c) average velocity and (d) straightness-of-path in relation to the Origin of the animals (two levels), the Exposure (three levels) and their interaction as fixed factors. Degree of freedom (df), F value (F) and significance level (P value) are provided for fixed effects. Significant effects are given in bold.
Average speed was significantly affected by Origin, Exposure and their interaction (Table 2b). While the average speed of Wild was significantly different between Indoor (2.3 ± 0.5 cm/min) and Open exposures (6.0 ± 1.8 cm/min), the average speed of Captive did not differ among exposures (4.2 ± 1.5 cm/min and 4.6 ± 1 cm/min Indoor and in the Open exposure respectively). In Open exposure, average speed was 23% lower in Captive than Wild (Fig. 3b, Table 2b and Supplementary Fig. 1b).
Average velocity was affected by Origin and by the interaction between Origin and Exposure. Wild had a significantly higher average velocity in Open and Closed exposures than Indoor, while in Captive was not significantly different among the three exposures (Fig. 3c, Table 2c and Supplementary Fig. 1c). In Open exposure, the average velocity was 30% lower in Captive (3.8 ± 3.4 cm/min) than Wild (5.4 ± 5.1 cm/min).
Straightness-of-path was significantly affected by the Exposure. Straightness-of-path for both wild and captive sea urchins was lowest in Indoor (0.6 ± 0.3 and 0.6 ± 0.2 respectively) and highest in the Open exposure (0.9 ± 0.1 and 0.8 ± 0.1 respectively, Fig. 3d and Table 2d).
Locomotion direction was significantly different from a random pattern for both Captive (312.7 ± 64.8 degrees) and Wild (295.6 ± 52.2 degrees) in Open exposure, indicating a tendency for moving towards the North-West direction, while it resulted random in all other cases (see Fig. 4 and Table 3). Exposure was the only Factor that resulted to significantly influence the locomotion direction in the two-way ANOVA for circular data (Table 4). Significant differences were found between Open exposure and Indoor within Captive (see Supplementary Fig. 2).
Figure 4.
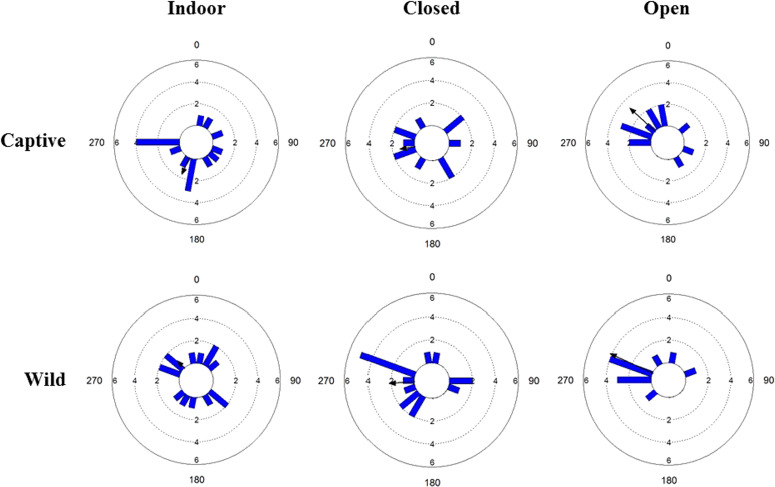
Circular histograms representing frequency of the orientation of crawling trajectories for the two types of sea urchins, Captive and Wild, in the different exposure treatments, Indoor, Closed and Open. 0°, 90°, 180°, 270° represent North, East, South and West, respectively. The black arrow lines indicate the mean orientation, and its length is the mean vector (r, from 0 to 1; r = 1 is represented by an arrow that reaches the edge of the outer circle). Concentric circles represent the frequency of observations. Bin width is set at 20°.
Table 3.
Summary results of Rayleigh’s test for locomotion direction
| Origin | Exposure | N° obs. | Mean direction | Circular standard deviation | Length of mean vector (r) | Rayleigh test (Z) | Rayleigh test (P) |
|---|---|---|---|---|---|---|---|
| Wild | Closed | 16 | 266.7° | 80.8° | 0.4 | 2.2 | 0.111 |
| Captive | Closed | 12 | 259.6° | 99.5° | 0.2 | 0.6 | 0.565 |
| Wild | Open | 10 | 295.6° | 52.2° | 0.7 | 4.4 | 0.009 |
| Captive | Open | 13 | 312.7° | 64.8° | 0.5 | 3.6 | 0.024 |
| Wild | Indoor | 14 | 295.7° | 118.9° | 0.1 | 0.2 | 0.833 |
| Captive | Indoor | 15 | 205.1° | 92° | 0.3 | 1.1 | 0.325 |
Tables representing number of observations, mean direction, circular standard deviation, length of mean vector (r), Rayleigh test (Z) and Rayleigh test (P) in relation to the Origin of the animals and level of the exposure to the environmental cues (Exposure).
Table 4.
Two-way ANOVA for circular data of locomotion direction
| Locomotion direction | |||
|---|---|---|---|
| Source | Numerator df | Chi2 | P value |
| Origin | 2 | 0.4304 | 0.8064 |
| Exposure | 4 | 10.2398 | 0.0366 |
| Origin*Exposure | 2 | 2.2269 | 0.8358 |
Two-way analysis of variance (ANOVA) for locomotion direction data, in relation to the Origin of the animals, the level of the exposure to the environmental cues (Exposure) and their interaction. Degree of freedom (numerator df), chi2 and significance level (P value) are provided for fixed effects.
Discussion
Our results show that most performance traits of Wild and Captive tended to be opposite in the different environmental exposures. Accordingly, sea urchins kept in captivity for 16 months showed some critical deficits in locomotion performance compared to wild sea urchins when observed in the Open exposure. Specifically, the average velocity was on average 30% lower in Captive than Wild. This was in part due to the longer latency of the Captive, since a slow start (as is the cases for Captive) has a negative effect on the calculated average velocity. The other factor that contributes to a lower average velocity in captive urchin is their lower average speed, because the straightness of path was not different between wild and captive sea urchins.
Although from the perspective of potential repopulation the main aspect of interest is the effect of captivity on sea urchins when introduced in the wild, it is worthwhile noting that wild sea urchins tended to perform better in their habitat of origin. Conversely, the locomotor performance of captive sea urchins did not decrease significantly when they were tested in nature compared to indoor, although it was significantly lower than that of wild sea urchins. Therefore, from a fitness perspective, it can be hypothesized that captive sea urchins would have a selective disadvantage compared to wild ones in natural conditions.
One of the main variables that were affected by captivity was latency of locomotion. The captive-born sea urchins released ‘into the wild’ were seven times slower than wild sea urchins to initiate locomotion (i.e. latency). Ecologically, latency of locomotion could be seen as an indicator of readiness to move after a disturbance. If the readiness to move is low, a captive-born sea urchin could reach a shelter or escape from dangerous situations later than a wild one, and this could potentially have fitness consequences (such as a higher predation rate). This principle may apply to all other variables and particularly to average speed and velocity, since if captive sea urchins are slower than wild ones, they may take more time to reach a shelter and slower to escape from a threat. Recent investigations showed that short-term captivity (i.e. up to 4 days) of red sea urchin Mesocentrotus franciscanus affects antipredator behaviours such as self-righting and predator escape responses (Bose et al., 2019). Given that wild sea urchins that experienced short captivity showed lower antipredator response after release (Bose et al., 2019), a much longer period (such as being raised in captivity) may also result in negative effects in terms of antipredator performance. Similarly, when predation rate was estimated on a pool of captive-born sea urchins in a Marine Protected Area, where predation pressure is supposed to be maximal (Guidetti and Sala, 2007), it was on average 16% higher than for wild sea urchins (Farina and Brundu’s unpublished data). This suggests that chances to survive into the wild of captive-born sea urchins may be lower than of wild sea urchins. However, if one was to assess behaviour a few days after reintroduction, it is possible that the behavioural differences would have decreased. Similarly, a longer period of acclimation may have limited the deficit in performance.
It is widely reported that sea urchins are able to sense external stimuli (e.g. presence of food and predators, environmental cues such as light and shelters) and move in response to them (Garnick, 1978; Scheibling and Hamm, 1991; Domenici et al., 2003; Lauzon-Guay et al., 2006; Dumont et al., 2007). Our results are in line with these findings, since the trajectories of locomotion in the Open exposure (in both Captive and Wild) were non-random, while in indoor conditions where the surrounding environment was homogeneous, trajectories were in random directions, in accordance to the results reported by previous studies (Domenici et al., 2003). Interestingly, the directions of sea urchin in closed conditions (i.e. in natural conditions with sunlight but with the horizontal view blocked by a panel) were also random. This suggests that the non-random directions found in both wild and captive sea urchins in open exposure are likely related to some habitat features of the horizon, potentially to visual ones such as shadows, or orientation of the beach (which was in a western direction). Current is unlikely to be a relevant factor because in the days when the experiments were carried out, the current was negligible. Interestingly, previous work shows that visual habitat features can cause non-random direction not only in wild but also in captive individuals, suggesting that the response of sea urchin to these features is innate and not acquired in nature (Pagès, 2013). Echinoderms, including sea urchins, are known to orient themselves relative to the visual surroundings and were found to crawl away or towards specific visual cues (Yerramilli and Johnsen, 2010; Sigl et al., 2016). Therefore, the presence of a homogeneous white horizon (Closed exposure and Indoor) compared to a natural horizon with potential shelter areas, may have inhibited both their readiness to move (long latency) and their directional motion.
Although some sea urchin species have been reared for many years (Andrew et al., 2002), no studies have addressed potential differences in locomotor performance and motor behaviour between wild and captive-born sea urchins. In this study, sea urchins were reared in controlled conditions without predators, protected from diseases, fed ad libitum with fresh macroalgae, aiming to improve their growth and survival of the animals. Captive sea urchins had never been exposed to wild conditions and environmental cues prior to the experiment, and this may explain why they displayed deficits in their locomotor behaviour when tested in natural conditions, compared to wild individuals.
In some regions of the Mediterranean Sea, reintroduction of captive-born juveniles into the wild could be consider an option for species conservation in response to the rapid loss of sea urchin abundance and the threat of populations’ collapse as a consequence of the commercial harvesting (Couvray et al., 2015). It is likely that some of the effects found in this study may attributable to a change in habitat and the stress related to the handling. In addition, here a 24-h acclimation was used. It is possible that a longer acclimation to the new environment (e.g. in enclosures to protect sea urchins from predators and other potential threats) may increase the performance of captives in natural conditions.
The release in nature of captive-born sea urchins after a relatively short-time of raising (approximately 1.5 years) can provide considerable economic savings and allows to activate a fast repopulation programme when necessary. However, the evidence of lower locomotion performance of Captive-born compared to Wild individuals as found here suggests that protocols aimed at minimizing the negative effect of captivity are needed before effective repopulation can be applied.
Some studies have found that reintroduction, translocation or even the release of raised individuals (as done here) of threatened species for conservation purposes have a low average success rate (e.g. Griffin et al., 2001; Teixeira et al., 2007). These practices as conservation tools need to be further investigated and improved upon in order to ensure that they are viable options (Jule et al., 2008). In this sense, while the variables we tested are likely to have some indirect fitness consequences, additional variables, such as the response to predation risk, should be tested in the future to assess specific antipredator behaviour and the spatial distribution of reintroduced sea urchins (e.g. Pessarrodona et al., 2019).
The findings of our study aim at improving our understanding of the feasibility of sea urchin breeding for localized reintroduction in areas where populations collapsed as a consequence of the harvesting. However, due to the pivotal role played by Paracentrotus lividus in Mediterranean macrophyte ecosystems (see introduction), the success of reintroduction should be evaluated not only from the point of view of depletion of marine resources but also in a long-time scale to estimate the recovery of density and size classes of populations and their trophic interactions within communities. Accordingly, the estimation of the deficit of the performance of raised sea urchin and the consequently minimization of the negative effect of captivity before release into the wild can potentiate the positive effects of repopulation at local scale both for fishery management and the conservation of the functionality of the ecosystems.
Supplementary Material
Acknowledgements
Authors want to thank Alessio Pinna for the help in the field, Dr Karen Middlemiss for first critical suggestions and Carlo Usai for logistic help.
Funding
This work was supported by the Sardinia Research plan activity (Art. 26 of LR 37/98). The funders had no role in study design, data collection and analysis, decision to publish or preparation of the manuscript.
References
- Alvarez D, Nicieza AG (2003) Predator avoidance behaviour in wild and hatchery-reared brown trout: the role of experience and domestication. J Fish Biol 63: 1565–1577. [Google Scholar]
- Anderson SC, Mills Flemming J, Watson R, Lotze HK (2011) Rapid global expansion of invertebrate fisheries: trends, drivers, and ecosystem effects. PLoS ONE 6(3), e14735. doi: 10.1371/journal.pone.0014735. [DOI] [PMC free article] [PubMed] [Google Scholar]
- Andrew NL, et al. (2002) Status and management of world sea urchin fisheries. Oceanogr Mar Biol 40: 343–425. [Google Scholar]
- Barange M, O'Boyle R, Cochrane KL, Fogarty MJ, Jarre A, Kell LT, Koster FW, Moor CL King JR. (2010) Marine resources management in the face of change: From ecosystem science to ecosystem based management In: Barange M, Field JG, Harris RP, Hofmann EE, Perry RI, Werner FE eds. Marine Ecosystems and Global Change. Oxford University Press, doi: 10.1093/acprof:oso/9780199558025.003.0009. [DOI] [Google Scholar]
- Batschelet E. (1981) Circular Statistics in Biology. Academic Press, London, UK. [Google Scholar]
- Berens P. (2009) CircStat: a MATLAB toolbox for circular statistics. J Stat Softw . doi: 10.18637/jss.v031.i10. [DOI] [Google Scholar]
- Bose APH, et al. (2019) Effects of handling and short-term captivity: a multi-behaviour approach using red sea urchins, Mesocentrotus franciscanus. PeerJ 7: e6556. doi: 10.7717/peerj.6556. [DOI] [PMC free article] [PubMed] [Google Scholar]
- Brady SM, Scheilbling RE (2005) Repopulation of the shallow subtidal zone by green sea urchins (Strongylocentrotus droebachiensis) following mass mortality in Nova Scotia, Canada. J Mar Biol Assoc UK 85(6): 1511–1517. [Google Scholar]
- Brooker RM, Feeney WE, White JR, Manassa RP, Johansen JL, Dixson DL (2016) Using insights from animal behaviour and behavioural ecology to inform marine conservation initiatives. Anim Behav 120: 211–221. [DOI] [PMC free article] [PubMed] [Google Scholar]
- Brundu G, Vallainc D, Baroli M, Figus AM, Pinna A, Carboni S (2017) Effects of on-demand feeding on sea urchin larvae (Paracentrotus lividus; Lamarck, 1816), development, survival and microalgae utilization. Aquac Res 48: 1550–1560. doi: 10.1111/are.12990. [DOI] [Google Scholar]
- Brundu G, Vian Monleón L, Vallainc D, Carboni S (2016) Effects of larval diet and metamorphosis cue on survival and growth of sea urchin post-larvae (Paracentrotuslividus; Lamarck, 1816). Aquaculture 465: 265–270. [Google Scholar]
- Cárcamo PF. (2015) Effects of food type and feeding frequency on the performance of early juveniles of the sea urchin Loxechinusalbus (Echinodermata: Echinoidea): implications for aquaculture and restocking. Aquaculture 436: 172–178. [Google Scholar]
- Cohen-Rengifo M, Agüera A, Detrain C, Bouma TJ, Dubois P, Flammang P (2018) Biomechanics and behaviour in the sea urchin Paracentrotus lividus (Lamarck, 1816) when facing gradually increasing water flows. J Exp Mar Biol Ecol 506: 61–71. doi: 10.1016/j.jembe.2018.05.010. [DOI] [Google Scholar]
- Conand C, Byrne M (1993) A review of recent developments in the world sea cucumber fisheries. Mar Fish Rev 55(4): 1–13. [Google Scholar]
- Cook EJ, Kelly MS (2007) Enhanced production of the sea urchin Paracentrotus lividus in integrated open water cultivation with Atlantic Salmon Salmo salar. Aquaculture 273: 573–585. [Google Scholar]
- Corlett RT. (2016) Restoration, reintroduction, and rewilding in a changing world. Trends Ecol Evol 31(6): 453–462. [DOI] [PubMed] [Google Scholar]
- Couvray S, Miard T, Bunet R, Martin Y, Grillasca J-P, Bonnefont J-L, Coupé S (2015) Experimental release of Paracentrotus lividus sea urchin juveniles inexploited sites along the French Mediterranean coast. J Shellfish Res 34(2): 1–9. [Google Scholar]
- Dance C. (1987) Patterns of activity of the sea urchin Paracentrotus lividus in the Bay of Port-Cros (Var, France, Mediterranean). Mar Ecol 8: 131–142. [Google Scholar]
- Domenici P, González-Calderón D, Ferrari RS (2003) Locomotion performance in the sea urchin Paracentrotus lividus. J Mar Biol Assoc UK 82: 1–8. [Google Scholar]
- Dumont CP, Himmelman JH, Robinson SMC (2007) Random movement pattern of the sea urchin Strongylocentrotus droebachiensis. J Exp Mar Biol Ecol 340: 80–89. [Google Scholar]
- Dumont CP, Himmelman JH, Russell MP (2006) Daily movement of the sea urchin Strongylocentrotus droebachiensis in different subtidal habitats in eastern Canada. Mar Ecol Prog Ser 317: 87–99. [Google Scholar]
- Farina S, Quattrocchi G, Guala I, Cucco A, (2018) Hydrodynamic patterns favouring sea urchin recruitment in coastal areas: A Mediterranean study case. Mar Environ Res 139: 182–192. doi: 10.1016/j.marenvres.2018.05.013. [DOI] [PubMed] [Google Scholar]
- Farina S, Arthur R, Pagès JF, Prado P, Romero J, Vergés A, Hyndes G, Heck KL, SJr G, Alcoverro T (2014) Differences in predator composition alter the direction of structure-mediated predation risk in macrophyte communities. Oikos 000: 001–012. doi: 10.1111/oik.01382. [DOI] [Google Scholar]
- Farina S, Tomas F, Prado P, Romero J, Alcoverro T (2009) Seagrass meadow structure alters interactions between the sea urchin Paracentrotus lividus and its predators. Mar Ecol Prog Ser 377: 131–137. [Google Scholar]
- Garnick E. (1978) Behavioral ecology of Strongylocentrotus droebachiensis (Müller) (Echinodermata: Echinoidea). Aggregating behaviour and chemotaxis. Oecologia 37: 77–84. [DOI] [PubMed] [Google Scholar]
- Griffin AS, Blumstein DT, Evans CS (2001) Training captive-bred or translocated animals to avoid predators. Conserv Biol. 14(5): 1317–1326 . doi: 10.1046/j.1523-1739.2000.99326.x. [DOI] [Google Scholar]
- Grosjean P, Spirlet C, Gosselin P, Vaïtilingon D, Jangoux M (1998) Land-based closed-cycle echiniculture of Paracentrotus lividus Lamarck (Echinodermata: Echinoidea): a long-term experiment at a pilot scale. J Shellfish Res 17: 1523–1531. [Google Scholar]
- Guidetti P, Bianchi CN, Chiantore M, Schiaparelli S, Morri C, Cattaneo-Vietti R (2004) Living on the rocks: substrate mineralogy and the structure of subtidal rocky substrate communities in the Mediterranean Sea. Mar Ecol Prog Ser 274: 57–68. doi: 10.3354/meps274057. [DOI] [Google Scholar]
- Guidetti P, Sala E (2007) Community-wide effects of marine reserves in the Mediterranean Sea. Mar Ecol Prog Ser 335: 43–56. doi: 10.3354/meps335043. [DOI] [Google Scholar]
- Hannon C. (2018) Restocking and ranching of the purple sea urchin Paracentrotus lividus on the west coast of Ireland. Scientific report 20 https://urchinproject.com/wp-content/uploads/sites/3/2018/05/Restocking_of_the_purple_sea_urchin_CH.pdf. [Google Scholar]
- Harrison D, Kanji GK (1988) The development of analysis of variance for circular data. J Appl Stat 15(2): 197. [Google Scholar]
- Hereu B, Zabala M, Linares C, Sala E (2005) The effects of predator abundance and habitat structural complexity on survival of juvenile sea urchins. Mar Biol 146: 293–299. doi: 10.1007/s00227-004-1439-y. [DOI] [Google Scholar]
- Hereu B, Zabala M, Sala E (2008) Multiple controls of community structure and dynamics in a sublittoral marine environment. Ecology 89: 3423–3435. [DOI] [PubMed] [Google Scholar]
- Hutchison M, Butcher A, Norris A, Kirkwood J, Chilcott K (2012) A review of domestication effects on stocked fishes, strategies to improve post stocking survival of fishes and their potential application to threatened fish species recovery programs in the Murray–Darling Basin. Queensland Department of Agriculture, Fisheries and Forestry. Murray–Darling Basin Authority, 34 pp.
- James DW. (2000) Diet, locomotion, and covering behaviour of the sea urchin Toxopneustes roseus in rhodolith beds in the Gulf of California, Mexico. Mar Biol 137: 913–923. [Google Scholar]
- Jones GP, Andrew NL (1990) Herbivory and patch dynamics on rocky reefs in temperate Australasia: the roles of fishand sea urchins. Aust J Ecol 15: 505–520. [Google Scholar]
- Juinio-Meňez MA, Bangi HG, Malay MC, Pastor D (2008) Enhancing the recovery of depleted Tripneustes gratilla stocks through grow-out culture and restocking. Rev Fish Sci 16(1–3): 35–43. [Google Scholar]
- Jule KR, Leaver LA, Lea SEG (2008) The effects of captive experience on reintroduction survival in carnivores: a review and analysis. Conserv Biol 141: 355–363. [Google Scholar]
- Kelly MS, Brodie CC, McKenzie JD (1998) Somatic and gonadal growth of the sea urchin Psammechinus miliaris (Gmelin) maintained in polyculture with the Atlantic salmon. J Shellfish Res 17: 1557–1562. [Google Scholar]
- Laur DR, Ebeling AW, Reed DC (1986) Experimental evaluations of substrate types as barriers to sea urchin (Strongylocentrotus spp.) locomotion. J Exp Biol 30: 575–583. [Google Scholar]
- Lauzon-Guay J-S, Scheibling RE, Barbeau MA (2006) Movement patterns in the green sea urchin, Strongylocentrotus droebachiensis. J Mar Biol Assoc UK 86: 167–174. [Google Scholar]
- Le Gall P. (1990) Culture of echinoderms In Barnabé G, ed, Aquaculture Vol 1 Ellis Horwood, New York. [Google Scholar]
- Le Gall P, Bucaille D (1989) Sea urchins production by inland farming In Jaspers E, Ackerfors H, Wilkins N, eds, De Pauw N. Aquaculture - a biotechnology in progress. European Aquaculture Society, Breden, Belgium, pp. 53–59. [Google Scholar]
- Lissner AL. (1980) Some effects of tuburlence on the activity of the sea urchin Centrostephanus coronatus Verrill. Mar Biol 48: 185–193. [Google Scholar]
- Loi B, Guala I, Silva RP, Brundu G, Baroli M, Farina S (2017) Hard time to be parents? Sea urchin fishery shifts potential reproductive contribution of population onto the shoulders of the young adults. PeerJ 5: e3067. doi: 10.7717/peerj.3067. [DOI] [PMC free article] [PubMed] [Google Scholar]
- Mattisson JE, Trent JD, Shanks AL, Akin TB, Pearse JS (1977) Movement and feeding activity of red sea urchins (Strongylocentrotus franciscanus) adjacent to a kelp forest. Mar Biol 39: 25–30. [Google Scholar]
- McClanahan TR, Sala E (1997) A Mediterranean rocky-bottom ecosystem fisheries model. Ecol Model 104: 145–164. [Google Scholar]
- McShane PE, Stewart R, Anderson O, Gerring P (1994) Failure of kina fishery leaves bitter taste. Seafood New Zealand 2: 35–36. [Google Scholar]
- Meñez MAJ. (2016) Approaches in rebuilding sea urchin and sea cucumber populations in the Philippines In Kawamura H, Iwata T, Theparoonrat Y, Manajit N, Sulit VT, eds, Consolidating the Strategies for Fishery Resources Enhancement in Southeast Asia. Proceedings of the Symposium on Strategy for Fisheries Resources Enhancement in the Southeast Asian Region, Pattaya, Thailand. Training Department, Southeast Asian Fisheries Development Center, Samutprakan, Thailand, pp. 161–164. [Google Scholar]
- Pagès JF. (2013) A behavioural seascape ecology approach to macrophyte herbivory In PhD Thesis. Universitat de Barcelona, Spain. [Google Scholar]
- Pais A, Serra S, Meloni G, Saba S, Ceccherelli G (2012) Harvesting effects on Paracentrotus lividus population structure: a case study from north western Sardinia, Italy, before and after the fishing season. J Coastal Res 28(3): 570–575. [Google Scholar]
- Pan Y, Zhang L, Lin C, Sun J, Kan R, Yang H (2015) Influence of flow velocity on motor behavior of sea cucumber Apostichopus japonicas. Physiol Behav 144: 52–59. [DOI] [PubMed] [Google Scholar]
- Pessarrodona A, Boada J, Pagès Jordi F, Arthur R, Alcoverro T (2019) Consumptive and non-consumptive effects of predators vary with the ontogeny of their prey. Ecology 100 (5), e02649. [DOI] [PubMed] [Google Scholar]
- Prado P, Tomas F, Alcoverro T, Romero J (2007) Extensive direct measurements of Posidoniao ceanica defoliation confirm the importance of herbivory in temperate seagrass meadows. Mar Ecol Prog Ser 340: 63–71. [Google Scholar]
- R Core Team (2014) R: A language and environment for statistical computing. R Foundation for Statistical Computing. Available at: http://www.r-project.org/. [Google Scholar]
- Ripple WJ, Beschta RL (2012) Trophic cascades in Yellowstone: the first 15 years after wolf reintroduction. Biol Conser 145: 205–213. [Google Scholar]
- Robinson SMC, Colborne L (1998) Roe enhancement trials of the green sea urchin using an artificial food source In Mooi R, Telford M, eds, Echinoderms. Balkema, Rotterdam, San Francisco, p. 803. [Google Scholar]
- Rodriguez SR, Ojeda FP (1998) Behaviour responses of the sea urchin Tetrapygus niger to predators and food. Mar Freshw Behav Phy 31: 21–37. [Google Scholar]
- Rosenberg AA, Fong LP (2013) International fisheries and climate change. Climate Vulnerability 2: 69–72. [Google Scholar]
- Russell VL. (2016) Least-squares means: the R package lsmeans. J Stat Softw 69(1): 1–33. doi: 10.18637/jss.v069.i01 [DOI] [Google Scholar]
- Sala E, Ballesteros E, Dendrinos P, Di Franco A, Ferretti F, Foley D, Fraschetti S, Friedlander A, Garrabou J, Güçlüsoy H et al. (2012) The structure of Mediterranean rocky reef ecosystems across environmental and human gradients, and conservation implications. PLoS ONE 7(2), e32742. [DOI] [PMC free article] [PubMed] [Google Scholar]
- Sala E, Boudouresque CF, Harmelin-Vivien M (1998) Fishing, trophic cascades, and the structure of algal assemblages: evaluation of an old but untested paradigm. Oikos 82: 425–439. [Google Scholar]
- Scheibling RE, Hamm J (1991) Interactions between sea urchins (Strongylocentrotus droebachiensis) and their predators in field and laboratory experiments. Mar Biol 110: 105–116. [Google Scholar]
- Shepherds A, Boudouresque CF (1979) A preliminary note on the locomotion of the sea urchin Paracentrotus lividus. Traveux Scientifiques du Parc National de Port-Cros, France 5: 155–158. [Google Scholar]
- Shier D. (2016) Manipulating animal behavior to ensure reintroduction success In Berger-Tal O, Saltz D, eds, Conservation Behavior: Applying Behavioral Ecology to Wildlife Conservation and Management. Cambridge University Press, Cambridge, pp.275–304. [Google Scholar]
- Sigl R, Steibl S, Laforsch C (2016) The role of vision for navigation in the crown-of-thorns seastar, Acanthaster planci. Sci Rep 6: 30834. doi: 10.1038/srep30834. [DOI] [PMC free article] [PubMed] [Google Scholar]
- Steneck RS, Graham MH, Bourque BJ, Corbett D, Erlandson JM, Estes JA, Tegner MJ (2002) Kelp forest ecosystem: biodiversity, stability, resilience and their future. Environ Conser 29: 436–459. [Google Scholar]
- Steneck RS, Vavrinec J, Leland AV (2004) Accelerating trophic level dysfunction in kelp forest ecosystems of the Western North Atlantic. Ecosystems 7: 323–332. doi: 10.1007/s11252-005-6833-9 [DOI] [Google Scholar]
- Tegner MJ. (1989) The feasibility of enhancing red sea urchin Strongylocentrotus franciscanus stocks in California; an analysis of the options. Mar Fish Rev 51: 1–22. [Google Scholar]
- Villouta E. (2000) Potential Ecological Impacts of Harvesting Kina (Evechinus chloroticus) in Fiordland. Conservation Advisory Science Notes 286. Department of Conservation, Wellington, New Zealand. [Google Scholar]
- Teixeira CP, Schetini de Azevedo C, Mendl M, Cipreste CF, Young RJ (2007) Revisiting traslocation and reintroduction programmes: the importance of considering stress. Anim Behav 73(1): 1–13. doi: 10.1016/j.anbehav.2006.06.002. [DOI] [Google Scholar]
- Villouta E, Chadderton WL, Pugsley CW, Hay CH (2001) Effects of sea urchin (Evechinus chloroticus) grazing in Dusky Sound, Fiordland, NewZealand. New Zeal J Mar Fresh 35(5): 1007–1024. doi: 10.1080/00288330.2001.9517060. [DOI] [Google Scholar]
- Wobbrock J, Findlater L, Gergle D, Higgins J (2011) The Aligned Rank Transform for Nonparametric Factorial Analyses Using Only ANOVA Procedures In Proceedings of the ACM Conference on Human Factors in Computing Systems (CHI ‘11), Vancouver, British Columbia (May 7–12, 2011). ACM Press, New York, pp. 143–146. [Google Scholar]
- Yerramilli D, Johnsen S (2010) Spatial vision in the purple sea urchin Strongylocentrotus purpuratus (Echinoidea). J Exp Biol 213: 249–255. doi: 10.1242/jeb.033159. [DOI] [PubMed] [Google Scholar]
- Yoshida M. (1966) Photosensitivity In Boolootian RA, ed, Physiology of Echinodermata. Interscience Publishers, New York, USA, pp.435–464. [Google Scholar]
Associated Data
This section collects any data citations, data availability statements, or supplementary materials included in this article.