Abstract
Liquid extraction surface analysis (LESA) is an ambient surface sampling technique that allows the analysis of intact proteins directly from tissue samples via mass spectrometry. Integration of ion mobility separation to LESA mass spectrometry workflows has shown significant improvements in the signal-to-noise ratios of the resulting protein mass spectra and hence the number of proteins detected. Here, we report the use of a quadrupole–cyclic ion mobility–time-of-flight mass spectrometer (Q-cIM-ToF) for the analysis of proteins from mouse brain and rat kidney tissues sampled via LESA. Among other features, the instrument allows multiple pass cyclic ion mobility separation, with concomitant increase in resolving power. Single-pass experiments enabled the detection of 30 proteins from mouse brain tissue, rising to 44 when quadrupole isolation was employed. In the absence of ion mobility separation, 21 proteins were detected in rat kidney tissue including the abundant α- and β-globin chains from hemoglobin. Single-pass cyclic ion mobility mass spectrometry enabled the detection of 60 additional proteins. Multipass experiments of a narrow m/z range (m/z 870–920) resulted in the detection of 24 proteins (one pass), 37 proteins (two passes) and 54 proteins (three passes), thus demonstrating the benefits of improved mobility resolving power.
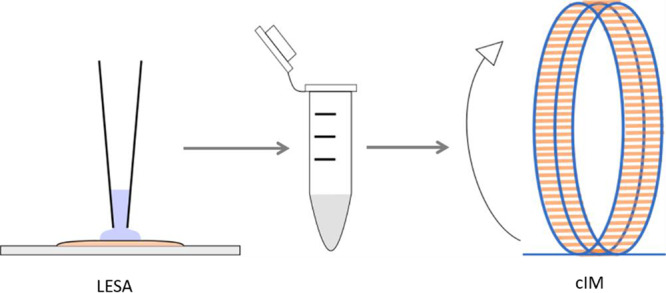
Liquid extraction surface analysis (LESA)1 is an ambient surface sampling technique that is capable of extracting analytes from solid substrates prior to analysis by mass spectrometry (MS). LESA uses a robotic pipet to dispense and hold a small volume of solvent on the substrate. Analytes diffuse into the solvent which is reaspirated by the pipet and introduced to the mass spectrometer by nanoelectrospray ionization. By tailoring the LESA extraction solvent, it is possible to extract different classes of molecules including lipids,2 metabolites,3−5 proteolytic peptides,6−8 and proteins9−11 from a range of different substrates including thin tissue sections,2,5,11 dried blood spots,9 and bacteria.10,12
For protein analysis, LESA may either be integrated with on-tissue digestion and subsequent separation by liquid chromatography (the “bottom-up” approach) or used directly for the analysis of intact proteins (the “top-down” approach). The former enables a greater depth of proteome coverage,6,7 albeit at significant time cost, whereas the latter has the capability to provide comprehensive information on single nucleotide polymorphisms and post-translational modifications,11 and connectivity, on a time scale more compatible with mass spectrometry imaging.13 The analysis of intact proteins directly from tissue is challenging due to the complex nature of the substrate. To address this challenge, separation techniques are often implemented such as liquid chromatography (LC) or ion mobility spectrometry (IMS). LC methods for proteins are typically slow, with gradients of minutes to hours, whereas IMS methods are much faster (millisecond time scales) and therefore compatible with ambient MS methods such as LESA and desorption electrospray ionization (DESI). IMS separates ions based on their gas phase mobility14 which is dependent on the gas pressure, temperature, masses of ion and gas molecules, and their rotationally averaged collision cross-section (CCS). To date, two types of IMS have been used in conjunction with in situ ambient sampling of intact proteins: high field asymmetric waveform ion mobility spectrometry (FAIMS)13,15−19 and traveling wave ion mobility spectrometry (TWIMS).20,21 TWIMS utilizes a stacked ring ion guide to confine and transmit ions.22,23 A series of voltage pulses is applied along the electrodes, resulting in a “travelling wave” which propels the ions through the cell. Ions undergo “roll over” events on the waves with ions of lower mobility undergoing more roll over events than those of higher mobility, effectively leading to temporal separation. Ions are introduced into the TWIMS device in the form of packets, and their transit times across the device are recorded, resulting in arrival time distributions (ATDs).24,25 The resolving power of a TWIMS (and classical drift tube ion mobility spectrometry) device depends on the square root of its length. To enable separations at substantially long path lengths, without significant increase in instrument length, Giles et al. introduced a multipass cyclic ion mobility (cIM) separator26 with a path length for a single pass of 98 cm. Subsequent refinements enabled the authors to demonstrate an ion mobility resolving power R of 750 with 100 passes (i.e., a path length of 98 m) of two isomeric pentapeptides with a corresponding separation time of ∼1.5 s (∼15 ms per pass).27 In a recent study, Eldrid et al. investigated multipass cIM separations of several common proteins, showing that minimal structural changes were induced in the small monomeric protein cytochrome C, and no structural changes were induced in tetrameric concanavalin A (102 kDa) after subjecting ions to separations lasting for hundreds of milliseconds.28
Here, we investigate the use of cIM-MS for the analysis of complex mixtures of intact proteins that have been extracted from thin tissue sections of mouse brain and rat kidney by use of LESA. For the mouse brain sample, 30 proteins were detected following single-pass cIM-MS analysis, a 2-fold increase over the number detected when ion mobility separation was not considered. The mass spectrum obtained for mouse brain tissue was dominated by singly charged species in the m/z 300–600 region. By adjusting the quadrupole transmission profile (described later) together with single-pass cIM-MS analysis, a further 16 peptides or protein species were detected (at the expense of two of the proteins detected without the adjustment) for a total of 44 proteins. For the rat kidney sample, 19 proteins were detected when the ion mobility dimension was not considered including α- and β-globins. Single-pass cIM-MS analysis revealed a further 60 proteins. Higher resolution multipass experiments were performed in which a narrow quadrupole isolation window (to avoid wrap around in the cIM device27) was combined with one, two, and three passes of the cIM device, enabling the detection of 24, 37, and 54 proteins, respectively. Although we have used LESA for extraction of proteins from tissue, the results are also relevant for more traditional experiments combining tissue homogenization and protein extraction.
Experimental Section
Materials
Thin Tissue Sections
Rat kidney tissue from control (vehicle-dosed) adult male Hans Wister rats was the kind gift of Dr. Richard Goodwin (AstraZeneca). Animals were euthanized by cardiac puncture under isofluorane anesthetic. All tissue dissection was performed by trained AstraZeneca staff (project license 40/3484, procedure number 10). Mouse brain tissue was obtained from wild-type mice (extraneous tissue from culled animals) and was the kind gift of Prof. Steve Watson (University of Birmingham). All organs were snap frozen and stored at −80 °C until sectioning. Tissues were cryosectioned at a thickness of 10 μm slices using a CM1850 cryostat (Leica Biosystems, Wetzlar, Germany) and thaw mounted onto glass slides.
Sampling Solvents
Formic acid and HPLC-grade ethanol, acetonitrile, and water were purchased from Fisher (Loughborough, U.K.). The lipid extraction solvent consisted of ethanol, water, and formic acid (79.95:19.95:0.1), and the protein extraction solvent consisted of acetonitrile, water, and formic acid (39.5:59.5:1).
LESA Extraction
The glass slides holding the tissue samples were placed in the sample tray of a Triversa Nanomate (Advion, Ithaca, NY), next to half of a 96 well microtiter plate which held the two LESA extraction solvents in separate wells. The advanced user interface (AUI) was used to control LESA sampling of the tissues. For the mouse brain tissue, lipid extraction was first performed; 5 μL of the ethanol-based extraction solvent was aspirated from the relevant solvent well. The pipet tip was then relocated to a position on the tissue specified in the AUI and lowered to a height of approximately 2 mm. Then, 1.2 μL of solvent was dispensed onto the tissue creating a microjunction ∼1.5 mm in diameter which was held for 6 s before 1.3 μL of solvent was reaspirated. The dispense/reaspirate cycle was repeated twice before the extracted sample was dispensed into a clean well in the microtiter plate. A number of locations on three separate tissue sections, for a total of 15 locations, were sampled in this manner. The extracted samples were pooled to give a final sample volume of ∼75 μL. This lipid-containing sample was stored at −80 °C for future analysis but is not further discussed in this Article. The tissue sections were allowed to dry in air at room temperature for ∼10 min before protein extraction was performed. The same locations were resampled using the acetonitrile-based solvent: 5 μL of solvent was aspirated; 1.4 μL of solvent was dispensed onto the tissue with a pipet height of 2.2 mm and held for 7 s, creating a microjunction of approximately 1.5 mm in diameter before 1.5 μL of solvent was reaspirated. The dispense/reaspirate cycle was repeated five times before the sample was dispensed into a clean well. Once again, the extracted samples were pooled to give a final volume of ∼75 μL. The rat kidney tissue was sampled as described above but without pre-extraction of the lipids. The protein-containing samples were stored at −80 °C until analysis.
Cyclic Ion Mobility Mass Spectrometry
All experiments were performed on a prototype cIM-MS instrument (Waters, Wilmslow, UK) (Figure S1, Supporting Information). A detailed description of the instrument design has been published by Giles et al.,27 where it was shown that the resolving power of the cIM device scales as ∼70(n·z)1/2, where n is the number of passes around the device, and z is the charge state of the ion.27 Samples were introduced into the instrument by nanoelectrospray ionization, in positive ion mode, using 4 μm tip glass tip emitters (New Objective, Woburn, MA, USA) with an applied capillary voltage of 1.5 kV. Ions were transferred from the source through the quadrupole mass filter. Mass spectra were acquired over a m/z range of 50–4000 or 50–2000 for ∼7 min. For the broad m/z range work, the quadrupole was operated in nonresolving mode with ramping RF voltage appropriate to the m/z range. For some experiments (see text), specific m/z ranges were selected by use of the quadrupole either in “resolving mode” or “nonresolving mode” with a fixed “low mass cutoff”. Ions were accumulated in the trap region before injection into the orthogonal loop of the cIM for separation. In most experiments, where a broad m/z range of species was transmitted, only a single pass of the cIM was used to avoid the phenomenon known as “wrap around” in which more mobile ions “catch up” with the less mobile ions.27 Multipass experiments were performed on samples from rat kidney: a small (50 m/z) quadrupole isolation was employed to limit the mobility range of the ions and therefore enable second and third passes of the cIM without “wrap around”. Full experimental details are provided in Tables S1, S2, and S3 of the Supporting Information.
Data Analysis
All data analysis was performed using MassLynx V4.1 and Driftscope V2.4 or V2.9 (Waters, Wimslow, U.K.). Protein mass assignments were performed manually using a combination of isotope deconvolution and charge state deconvolution. All reported masses correspond to average masses or the mass of the most abundant isotope.
Results and Discussion
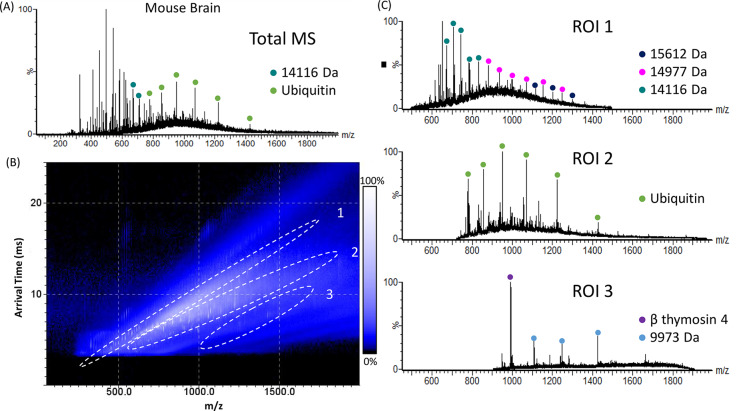
Figure 1A shows the total LESA mass spectrum (i.e., of the entire ATD) obtained from mouse brain tissue following a single-pass cIM-MS analysis. As this spectrum represents the entire ATD, the ion mobility dimension is not considered. The mass spectrum is dominated by peaks corresponding to singly charged ions in the m/z range 250–650, while in the higher m/z range (650–2000) peaks corresponding to multiply charged protein ions are observed. Peaks at m/z 779, 857, 952, 1070, 1223, and 1427 are putatively assigned as the 11+, 10+, 9+, 8+, 7+, and 6+ charge states of ubiquitin (MWave 8564 Da). Ubiquitin is abundant in the brain and is commonly observed in LESA MS of brain tissue sections.13 (Note that unambiguous assignment would require accurate mass measurement and/or MS/MS fragmentation). In addition, a range of proteins of molecular weight 4918 to 16788 Da were detected (Table S4, Supporting Information). In total, 16 individual protein species were detected when IM separation was not considered. Figure 1B shows the corresponding 2D heat-map plot of arrival time versus m/z obtained from the mouse brain sample. The mass spectra extracted from the protein-containing regions of interest (ROI 1–3, indicated in Figure 1B) are shown in Figure 1C. In general, it was observed that ROI 1 typically contained higher molecular weight proteins, ROI 2 intermediate molecular weight proteins, and ROI 3 lower molecular weight proteins. By extracting the mass spectra for the three ROIs from the 2D data, it was possible to detect 97 features corresponding to 30 individual proteins, a 2-fold improvement on the number detected in the absence of ROI extraction.
Figure 1.
LESA single-pass cIM-MS of mouse brain. (A) Total LESA mass spectrum (summed across the entire ATD). (B) 2D heat-map (arrival time vs m/z). Regions of interest (ROI) containing peaks corresponding to proteins are highlighted. (C) Mass spectra extracted from ROI 1, ROI 2, and ROI 3. Abundant proteins are indicated.
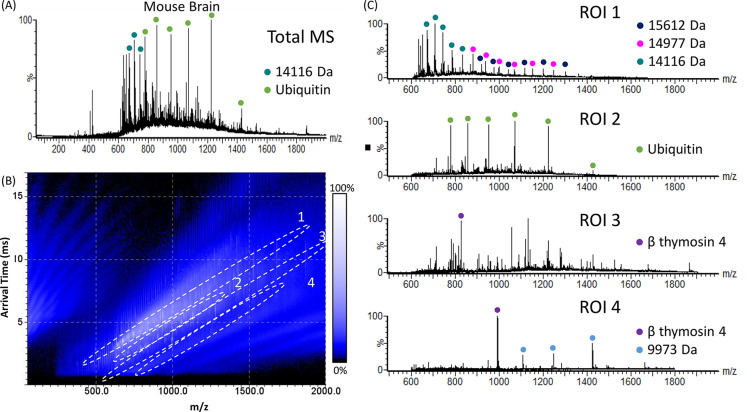
The mass spectrum shown in Figure 1A is dominated by singly charged peaks in the range m/z 250–650. To remove these, the quadrupole was set to reject species below m/z 600 (using the “low mass cutoff”). The remaining ions were subjected to single-pass cIM separation. The resulting total LESA mass spectrum is shown in Figure 2A. A total of 24 individual proteins were detected without ROI extraction (Table S5, Supporting Information). The corresponding 2D heat-map of arrival time versus m/z is shown in Figure 2B, with protein-containing ROIs highlighted. (Note that the trend lines observed below 500 m/z and 5–15 ms are artifacts resulting from carry over of higher m/z ions in the ToF analyzer from the previous MS acquisition). The associated extracted mass spectra from the protein-containing ROIs are shown in Figure 2C. In total, 44 individual peptides and proteins ranging from 1.8–17 kDa were detected (Table S5, Supporting Information). Two of the proteins detected without the use of low mass cutoff (Figure 1) were not detected here. The increased number of proteins detected when the fixed low mass cutoff was employed is perhaps counterintuitive but can at least in part be explained by the quadrupole transmission profile compared to the nonresolving ramped RF mode: Thirteen of the 16 additional species detected when the fixed low mass cutoff was employed were observed within the m/z range 600–900, i.e., close to the transmission maximum (at around m/z 800) for the set quadrupole RF. Additionally, the duty cycle will have increased compared to the (standard) RF ramping mode. The remaining species were observed at m/z 979, 1041, and 1132.
Figure 2.
LESA single-pass cIM-MS of mouse brain tissue, with the quadrupole set to transmit m/z > 600. (A) Total LESA mass spectrum (summed across the entire ATD). (B) 2D heat-map (arrival time vs m/z). Regions of interest (ROI) containing peaks corresponding to proteins are highlighted. (C) Mass spectra extracted from ROI 1, ROI 2, ROI 3, and ROI 4. Abundant proteins are indicated.
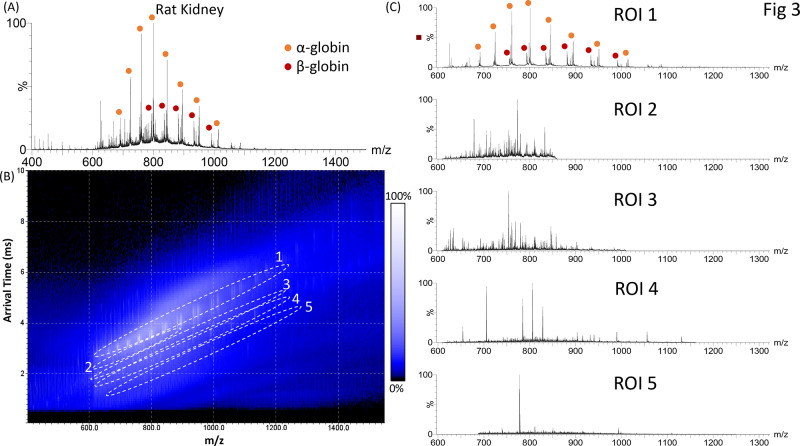
The use of single-pass cIM separation offered similar advantages for the rat kidney sample. Figure 3A shows the total LESA mass spectrum obtained from rat kidney tissue. The mass spectrum is dominated by peaks putatively assigned as the α- and β-globin chains of hemoglobin in charge states from 15+ to 23+ and 16+ to 21+, respectively, based on average molecular weight and prior knowledge of this tissue from previous LESA experiments.16 The singly charged heme group is also observed at m/z 616. Nineteen other protein species were detected in this mass spectrum (Table S6, Supporting Information). Figure 3B shows the corresponding 2D heat-map of arrival time versus m/z with protein-containing ROIs highlighted. The associated mass spectra are shown in Figure 3C. The mass spectrum obtained from ROI 1 contains peaks corresponding to the dominant α- and β-globin chains, while those from ROI 2–5 contain peaks corresponding to intact proteins ranging in molecular weight from 4–18 kDa (Table S6, Supporting Information). The use of the cIM device enabled the detection of an additional 60 proteins.
Figure 3.
LESA single-pass cIM-MS of rat kidney. (A) Total LESA mass spectrum (summed across the entire ATD). (B) 2D heat-map (arrival time vs m/z). Regions of interest (ROI) containing peaks corresponding to proteins are highlighted. (C) Mass spectra extracted from ROI 1, 2, 3, 4, and 5.. Abundant proteins are indicated.
Thus far, the data presented have been acquired using a single pass of the cIM device with R ∼ 70·z1/2.27 Further improvements in R may be achieved by multiple passes; however, LESA extraction of thin tissue sections results in highly complex samples containing a range of molecular classes with a large range of associated mobilities. To minimize the possibility of “wrap around”, the quadrupole was set to transmit a narrow m/z range (m/z 870–920), thereby reducing the range of mobilities of ions entering the cIM device. To understand the contribution of quadrupole isolation to the results, initial experiments compared the number of proteins detected in m/z range 870–920 with and without quadrupole isolation following a single pass of the cIM (Table S7, Supporting Information). Thirteen proteins were detected both with and without quadrupole isolation, with 11 uniquely observed with quadrupole isolation and four uniquely observed without. We subsequently compared the results obtained following one, two, and three passes around the cIM of the m/z selected range of ions Figure 4A shows a comparison of the 2D heat-maps obtained from the one-, two-, and three-pass experiments. Three protein-containing ROIs can be observed below the hemoglobin trend line in the single-pass heat-map, with four observed for the multipass heat-maps. For the multipass (n = 3) experiment, some of the more mobile protein ions were detected “above” the hemoglobin trendline (highlighted by ROI 5 in Figure 4A). This observation is rationalized by the fact that in this acquisition some ions in ROI 5 completed four passes around the cIM. Figure 4B shows a Venn diagram summarizing the numbers of proteins detected. (Note that the five proteins detected in the n = 1 and n = 2 experiments but “missing” in the n = 3 experiment are all of low molecular weight (<6.3 kDa) and may have completed four passes, but their signals are obscured by larger proteins. The two proteins detected solely in the n = 2 experiment are of very low abundance). In total, 54 proteins were detected after three passes, 37 after two passes, and 24 after one pass (Tables S8–S10, Supporting Information). The mass spectra extracted from the ROIs are shown in Figures S2–S4 of the Supporting Information.
Figure 4.
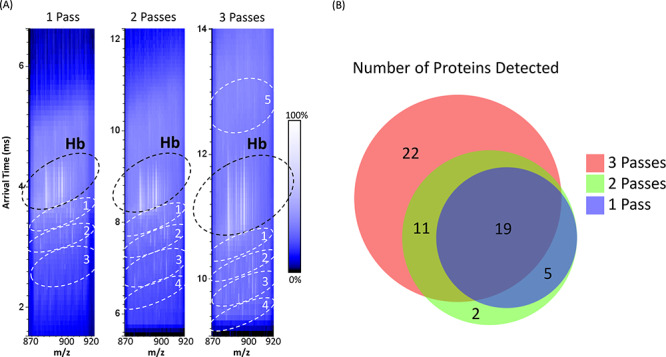
LESA multipass (n = 1, 2, and 3) cIM-MS, with quadrupole isolation of m/z 870–920 of rat kidney tissue. (A) 2D heat-map (arrival time vs m/z) obtained from one pass (left), two passes (middle), and three passes (right). Hb indicates region of interest containing hemoglobin ions. Regions of interest (ROIs) containing peaks corresponding to proteins are highlighted. (B) Venn diagram comparing the proteins detected following different number of passes of the cIM.
The improvements in resolution resulting from multipass separation can be illustrated by comparing the ATDs extracted for several narrow m/z ranges (Figure S5, Supporting Information). In each case, the separation between different ion mobility peaks increases with an increasing number of passes, revealing new features.
Conclusion
The results show that the inclusion of high resolution cIM separations in the LESA MS workflow increases the number of proteins detected from mouse brain and rat kidney tissues. Single-pass cIM-MS resulted in detection of 30 proteins from mouse brain tissue and 81 proteins from rat kidney tissue (compared with 16 and 19, respectively, when the ion mobility dimension was not considered). The cIM-MS mass spectrum obtained from mouse brain tissue was dominated by signals corresponding to singly charged ions; to address this issue, the quadrupole was set to remove ions with m/z below 600. While this improved the numbers of features detected, further analysis revealed that the majority of these peaks corresponded to lower molecular weight peptides or additional charge states of previously detected proteins. A novel feature of the cIM device is the facility for multipass separations and therefore improved ion mobility resolving power. Multipass (n = 1, 2, 3) cIM-MS, coupled with a narrow quadrupole isolation (50 m/z), of the rat kidney sample improved S/N and resulted in the detection of 24, 37, and 54 proteins, respectively. In the present experiments, the LESA samples were pooled, and future work is needed to determine sensitivity and potential for spatial specificity. The results presented are also of relevance to more traditional experiments in which protein extraction follows tissue homogenization.
Acknowledgments
H.J.C. is an EPSRC Established Career Fellow (EP/L023490/1 and EP/S002979/1). E.K.S. was in receipt of an EPSRC studentship via the Centre for Doctoral Training in Physical Sciences for Health (Sci-Phy-4-Health) (EP/L016346/1), in collaboration with UCB Pharma. F.A.F.-L. was supported by a University of Birmingham Institute of Advanced Studies Vanguard Fellowship. The authors thank Dr. Richard Goodwin for providing rat tissue and Prof. Steve Watson for providing mouse tissue. Supplementary data supporting this research is openly available from the University of Birmingham data archive at https://search.datacite.org/works/10.25500/edata.bham.00000437.
Supporting Information Available
The Supporting Information is available free of charge at https://pubs.acs.org/doi/10.1021/acs.analchem.9b05169.
Figure S1: Schematic of the cIM-MS instrument. Table S1: Cyclic sequence settings. Table S2: Frequencies and pressures in the instrument. Table S3: Instrument parameters. Table S4: Proteins detected following LESA single-pass cIM mass spectrometry of mouse brain. Table S5: Proteins detected following LESA single-pass cIM mass spectrometry of mouse brain, with a low mass cutoff (below 600 m/z). Table S6: Proteins detected following LESA single-pass cIM mass spectrometry of rat kidney. Table S7: Summary of proteins detected in m/z range 870–920 with and without quadrupole isolation following a single pass of the cIM. Table S8: Proteins detected following LESA single-pass cIM mass spectrometry of rat kidney, with narrow quadrupole isolation (m/z 870–920). Table S9: Proteins detected following LESA double-pass cIM mass spectrometry of rat kidney, with narrow quadrupole isolation (m/z 870–920). Table S10: Proteins detected following LESA triple-pass cIM mass spectrometry of rat kidney, with narrow quadrupole isolation (m/z 870–920). Figure S2: Mass spectra extracted from ROIs following a single pass of the cIM (with narrow quadrupole isolation). Figure S3: Mass spectra extracted from ROIs following two passes of the cIM (with narrow quadrupole isolation). Figure S4: Mass spectra extracted from ROIs following three passes of the cIM (with narrow quadrupole isolation). Figure S5: Arrival time distributions of ions at m/z ranges 766.81 ± 0.02 and 791.48 ± 0.05 and 857.65 ± 0.04 from rat kidney. (PDF)
The authors declare the following competing financial interest(s): J.U., M.P., and K.G. are employees of Waters Corp.
Supplementary Material
References
- Kertesz V.; Van Berkel G. J. Fully automated liquid extraction-based surface sampling and ionization using a chip-based robotic nanoelectrospray platform. J. Mass Spectrom. 2010, 45, 252–260. 10.1002/jms.1709. [DOI] [PubMed] [Google Scholar]
- Hall Z.; Chu Y.; Griffin J. L. Liquid Extraction Surface Analysis Mass Spectrometry Method for Identifying the Presence and Severity of Nonalcoholic Fatty Liver Disease. Anal. Chem. 2017, 89, 5161–5170. 10.1021/acs.analchem.7b01097. [DOI] [PubMed] [Google Scholar]
- Eikel D.; Vavrek M.; Smith S.; Bason C.; Yeh S.; Korfmacher W. A.; Henion J. D. Liquid extraction surface analysis mass spectrometry (LESA-MS) as a novel profiling tool for drug distribution and metabolism analysis: the terfenadine example. Rapid Commun. Mass Spectrom. 2011, 25, 3587–3596. 10.1002/rcm.5274. [DOI] [PubMed] [Google Scholar]
- Xu L.-X.; Wang T.-T.; Geng Y.-Y.; Wang W.-Y.; Li Y.; Duan X.-K.; Xu B.; Liu C. C.; Liu W.-H. J. A. The direct analysis of drug distribution of rotigotine-loaded microspheres from tissue sections by LESA coupled with tandem mass spectrometry. Anal. Bioanal. Chem. 2017, 409, 5217–5223. 10.1007/s00216-017-0440-5. [DOI] [PubMed] [Google Scholar]
- Swales J. G.; Strittmatter N.; Tucker J. W.; Clench M. R.; Webborn P. J. H.; Goodwin R. J. A. Spatial Quantitation of Drugs in tissues using Liquid Extraction Surface Analysis Mass Spectrometry Imaging. Sci. Rep. 2016, 6, 37648–37648. 10.1038/srep37648. [DOI] [PMC free article] [PubMed] [Google Scholar]
- Ryan D. J.; Nei D.; Prentice B. M.; Rose K. L.; Caprioli R. M.; Spraggins J. M. Protein identification in imaging mass spectrometry through spatially targeted liquid micro-extractions. Rapid Commun. Mass Spectrom. 2018, 32, 442–450. 10.1002/rcm.8042. [DOI] [PMC free article] [PubMed] [Google Scholar]
- Ryan D. J.; Patterson N. H.; Putnam N. E.; Wilde A. D.; Weiss A.; Perry W. J.; Cassat J. E.; Skaar E. P.; Caprioli R. M.; Spraggins J. M. MicroLESA: Integrating Autofluorescence Microscopy, In Situ Micro-Digestions, and Liquid Extraction Surface Analysis for High Spatial Resolution Targeted Proteomic Studies. Anal. Chem. 2019, 91, 7578–7585. 10.1021/acs.analchem.8b05889. [DOI] [PMC free article] [PubMed] [Google Scholar]
- Lamont L.; Baumert M.; Ogrinc Potočnik N.; Allen M.; Vreeken R.; Heeren R. M. A.; Porta T. Integration of Ion Mobility MSE after Fully Automated, Online, High-Resolution Liquid Extraction Surface Analysis Micro-Liquid Chromatography. Anal. Chem. 2017, 89, 11143–11150. 10.1021/acs.analchem.7b03512. [DOI] [PMC free article] [PubMed] [Google Scholar]
- Edwards R. L.; Creese A. J.; Baumert M.; Griffiths P.; Bunch J.; Cooper H. J. Hemoglobin Variant Analysis via Direct Surface Sampling of Dried Blood Spots Coupled with High-Resolution Mass Spectrometry. Anal. Chem. 2011, 83, 2265–2270. 10.1021/ac1030804. [DOI] [PMC free article] [PubMed] [Google Scholar]
- Randall E. C.; Bunch J.; Cooper H. J. Direct Analysis of Intact Proteins from Escherichia coli Colonies by Liquid Extraction Surface Analysis Mass Spectrometry. Anal. Chem. 2014, 86, 10504–10510. 10.1021/ac503349d. [DOI] [PubMed] [Google Scholar]
- Sarsby J.; Martin N. J.; Lalor P. F.; Bunch J.; Cooper H. J. Top-Down and Bottom-Up Identification of Proteins by Liquid Extraction Surface Analysis Mass Spectrometry of Healthy and Diseased Human Liver Tissue. J. Am. Soc. Mass Spectrom. 2014, 25, 1953–1961. 10.1007/s13361-014-0967-z. [DOI] [PMC free article] [PubMed] [Google Scholar]
- Kocurek K. I.; Stones L.; Bunch J.; May R. C.; Cooper H. J. Top-Down LESA Mass Spectrometry Protein Analysis of Gram-Positive and Gram-Negative Bacteria. J. Am. Soc. Mass Spectrom. 2017, 28, 2066–2077. 10.1007/s13361-017-1718-8. [DOI] [PMC free article] [PubMed] [Google Scholar]
- Griffiths R. L.; Creese A. J.; Race A. M.; Bunch J.; Cooper H. J. LESA FAIMS Mass Spectrometry for the Spatial Profiling of Proteins from Tissue. Anal. Chem. 2016, 88, 6758–6766. 10.1021/acs.analchem.6b01060. [DOI] [PubMed] [Google Scholar]
- Mason E. A.; McDaniel E. W.. Transport Properties of Ions in Gases; John Wiley& Sons: New York, 1988. [Google Scholar]
- Sarsby J.; Griffiths R. L.; Race A. M.; Bunch J.; Randall E. C.; Creese A. J.; Cooper H. J. Liquid Extraction Surface Analysis Mass Spectrometry Coupled with Field Asymmetric Waveform Ion Mobility Spectrometry for Analysis of Intact Proteins from Biological Substrates. Anal. Chem. 2015, 87, 6794–6800. 10.1021/acs.analchem.5b01151. [DOI] [PubMed] [Google Scholar]
- Griffiths R. L.; Simmonds A. L.; Swales J. G.; Goodwin R. J. A.; Cooper H. J. LESA MS Imaging of Heat-Preserved and Frozen Tissue: Benefits of Multistep Static FAIMS. Anal. Chem. 2018, 90, 13306–13314. 10.1021/acs.analchem.8b02739. [DOI] [PubMed] [Google Scholar]
- Feider C. L.; Elizondo N.; Eberlin L. S. Ambient Ionization and FAIMS Mass Spectrometry for Enhanced Imaging of Multiply Charged Molecular Ions in Biological Tissues. Anal. Chem. 2016, 88, 11533–11541. 10.1021/acs.analchem.6b02798. [DOI] [PMC free article] [PubMed] [Google Scholar]
- Garza K. Y.; Feider C. L.; Klein D. R.; Rosenberg J. A.; Brodbelt J. S.; Eberlin L. S. Desorption Electrospray Ionization Mass Spectrometry Imaging of Proteins Directly from Biological Tissue Sections. Anal. Chem. 2018, 90, 7785–7789. 10.1021/acs.analchem.8b00967. [DOI] [PMC free article] [PubMed] [Google Scholar]
- Griffiths R. L.; Hughes J.; Abbatiello S. E.; Belford M. W.; Styles I. B.; Cooper H. J. Comprehensive LESA mass spectrometry imaging of intact proteins by integration of cylindrical FAIMS. Anal. Chem. 2020, 92, 2885–2890. 10.1021/acs.analchem.9b05124. [DOI] [PMC free article] [PubMed] [Google Scholar]
- Towers M. W.; Karancsi T.; Jones E. A.; Pringle S. D.; Claude E. Optimised Desorption Electrospray Ionisation Mass Spectrometry Imaging (DESI-MSI) for the Analysis of Proteins/Peptides Directly from Tissue Sections on a Travelling Wave Ion Mobility Q-ToF. J. Am. Soc. Mass Spectrom. 2018, 29, 2456–2466. 10.1007/s13361-018-2049-0. [DOI] [PMC free article] [PubMed] [Google Scholar]
- Griffiths R. L.; Sisley E. K.; Lopez-Clavijo A. F.; Simmonds A. L.; Styles I. B.; Cooper H. J. Native mass spectrometry imaging of intact proteins and protein complexes in thin tissue sections. Int. J. Mass Spectrom. 2019, 437, 23–29. 10.1016/j.ijms.2017.10.009. [DOI] [Google Scholar]
- Giles K.; Pringle S. D.; Worthington K. R.; Little D.; Wildgoose J. L.; Bateman R. H. Applications of a travelling wave-based radio-frequency-only stacked ring ion guide. Rapid Commun. Mass Spectrom. 2004, 18, 2401–2414. 10.1002/rcm.1641. [DOI] [PubMed] [Google Scholar]
- Pringle S. D.; Giles K.; Wildgoose J. L.; Williams J. P.; Slade S. E.; Thalassinos K.; Bateman R. H.; Bowers M. T.; Scrivens J. H. An investigation of the mobility separation of some peptide and protein ions using a new hybrid quadrupole/travelling wave IMS/oa-ToF instrument. Int. J. Mass Spectrom. 2007, 261, 1–12. 10.1016/j.ijms.2006.07.021. [DOI] [Google Scholar]
- Giles K.; Wildgoose J. L.; Langridge D. J.; Campuzano I. A method for direct measurement of ion mobilities using a travelling wave ion guide. Int. J. Mass Spectrom. 2010, 298, 10–16. 10.1016/j.ijms.2009.10.008. [DOI] [Google Scholar]
- Shvartsburg A. A.; Smith R. D. Fundamentals of Traveling Wave Ion Mobility Spectrometry. Anal. Chem. 2008, 80, 9689–9699. 10.1021/ac8016295. [DOI] [PMC free article] [PubMed] [Google Scholar]
- Giles K.; Wildgoose J. L.; Pringle S. D.; Garside J.; Carney P.; Nixon P.; Langridge D. J. In 62nd ASMS Conference on Mass Spectrometry and Allied Topics; Baltimore, 2014.
- Giles K.; Ujma J.; Wildgoose J.; Pringle S.; Richardson K.; Langridge D.; Green M. A Cyclic Ion Mobility-Mass Spectrometry System. Anal. Chem. 2019, 91, 8564–8573. 10.1021/acs.analchem.9b01838. [DOI] [PubMed] [Google Scholar]
- Eldrid C.; Ujma J.; Kalfas S.; Tomczyk N.; Giles K.; Morris M.; Thalassinos K. Gas Phase Stability of Protein Ions in a Cyclic Ion Mobility Spectrometry Traveling Wave Device. Anal. Chem. 2019, 91, 7554–7561. 10.1021/acs.analchem.8b05641. [DOI] [PMC free article] [PubMed] [Google Scholar]
Associated Data
This section collects any data citations, data availability statements, or supplementary materials included in this article.


