Abstract
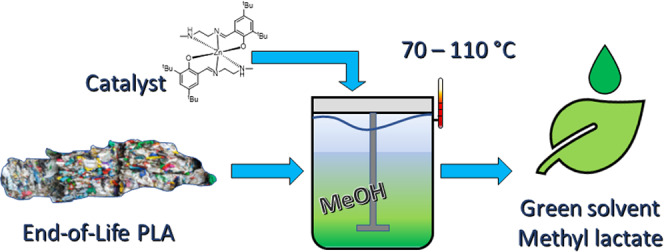
The catalyzed methanolysis of end-of-life poly(lactic acid) (PLA) products by an ethylenediamine Zn(II) complex to form biodegradable methyl lactate was studied experimentally at 70, 90, and 110 °C. The PLA samples consisted of typical consumer waste materials, including a cup, a toy, and a three-dimensional (3D) printing material. High selectivities and yields (>94%) were possible depending on temperature and reaction time. Additionally, and to develop a predictive kinetic model, kinetic parameters (pre-exponential factor and activation energies) of the PLA transesterification reaction were first obtained from virgin PLA. These parameters were subsequently used to estimate the conversion of PLA, selectivity, and yield of methyl lactate after 1 and 4 h of the reaction, and the results were compared with the experimental values of the end-of-life PLA. Despite the presence of unknown additives in the PLA waste material and uncontrolled particle size, the model was able to predict the overall conversion, selectivity, and yield to an average deviation of 5, 7, and 12%, respectively. A greater agreement between the model and experimental values is observed for the higher temperatures and the longer reaction time. Larger deviations were observed for the PLA toy, which we attribute to the presence of additives, since despite its lower molecular weight, it possessed a higher structural strength.
1. Introduction
Nondegradable oil-derived plastics are some of the most common materials used today due to their broad functionality and low cost, whose production has increased over 20-fold since the 1960s.1,2 However, their longevity and increasing demand have unfortunately resulted in plastic pollution in the oceans, which is considered one of the world’s largest environmental catastrophes of our times.1,3 Plastic pollution is not only harmful to marine life but also toxic to human health by marine-related activities.4,5 The interest in natural biodegradable plastics synthesized from renewable resources such as polysaccharides (e.g., starch), proteins (e.g., wool), lipids (e.g., fats), polyesters from plants or microorganisms (e.g., poly(hydroxyalkanoates)), and polyesters from bio-derived monomers (e.g., poly(lactic acid) (PLA)) has grown, and it is believed that these can be a sustainable option to replace harmful plastics.2
In particular, the demand for PLA has increased drastically over the recent years due to its similarity in the properties to polystyrene and poly(ethylene terephthalate) (PET). PLA can be used to produce a wide range of products, including injection-molded articles and packaging.6,7 PLA can be produced from starch and other polysaccharides found in sustainable raw materials, such as corn, which are then fermented to produce lactic acid and then transformed to lactide, the dimer of lactic acid. Lactide then undergoes ring-opening polymerization to produce high-molecular-weight PLA.6,8
However, a high cost is still associated with the production of PLA, which hinders its widespread production.6,9 A reduction in cost could be achieved by chemical recycling of PLA, where monomer regeneration occurs or valuable chemicals are produced, resulting in a circular economy.10 Moreover, chemical recycling will also reduce the environmental impact associated with end-of-life PLA since its degradability only occurs under specific conditions and it is practically nondegradable in seawater,11 therefore still contributing to plastic pollution.
Chemical degradation of PLA occurs via three main methods: thermolysis, hydrolysis, and alcoholysis (transesterification). Thermal degradation takes place over the temperature range of 200–500 °C and is essentially the reverse reaction of ring-opening polymerization; it occurs due to the intramolecular transesterification reactions of the polymer resulting in lactide.12−15 Hydrolysis takes place around 200 °C and occurs heterogeneously through random scission of the ester bonds by water diffusion, preferentially in the amorphous regions; the formation of acidic carboxylic groups leads to an autocatalytic effect.16−18 The hydrolysis of end-of-life PLA at temperatures above 170 °C has been demonstrated by Cristina et al.19
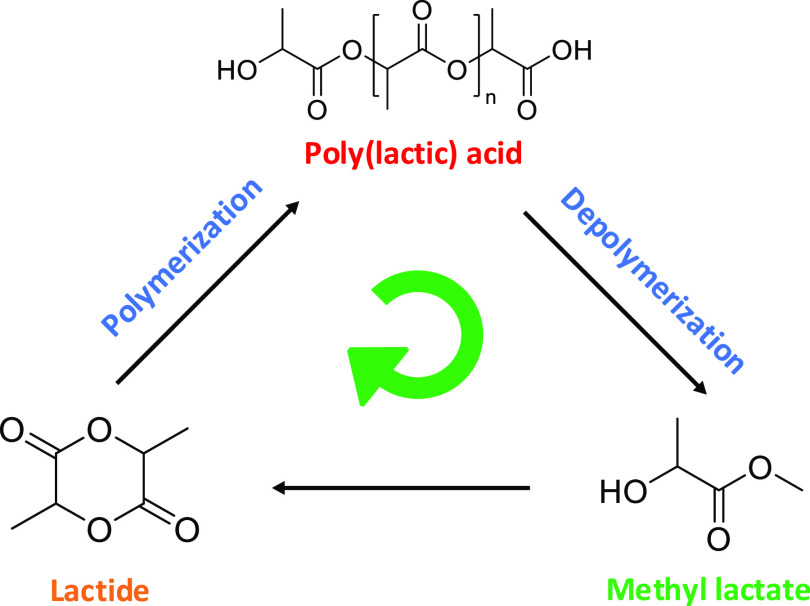
Alcoholysis is the displacement of alcohol from an ester by another alcohol. It allows for lactate esters to be formed, which are known as green solvents due to their biodegradability and low toxicity.20,21 These esters, such as methyl lactate (MeLa), can be transformed back into lactide, closing the loop in the circular economy (Figure 1).22,23 Alcoholysis can use milder conditions compared to thermal and hydrolytic degradations, allowing it to be more economically and environmentally feasible at industrial scales.
Figure 1.
Circular economy in the chemical recycling of poly(lactic acid) into methyl lactate.
Examples of the synthesis of green solvents from PLA include a patent by Coszach et al.24 who demonstrated that the alcoholysis of PLA dissolved in lactic acid ester to produce alkyl lactate at 130 °C. Du Pont25 has patented a faster reaction where 78% of PLA conversion to lactates is achieved in 2 h using H2SO4 as a catalyst between 150 and 190 °C. The use of ionic liquids for the methanolysis of PLA has also been reported achieving conversions of 97%.26 Petrus et al.27 produced several alkyl lactates using metal-based catalysts; temperatures varied from 80 to 260 °C, and it was shown that a higher temperature and pressure with excess alcohol results in higher lactate yields. The depolymerization of end-of-life PLA into MeLa by organocatalysis (4-dimethylaminopyridine) and alkali metal halide catalysis has been demonstrated by Enthaler and co-workers,28,29 where high yields were obtained at temperatures above 160 °C.
Until recently, literature examples of controlled degradation of PLA to form alkyl lactates catalyzed by discrete metal complexes were rare but recent research has shown the degradation of PLA into MeLa by an ethylenediamine Zn(II) complex.30 The investigation found that the main operating parameters affecting the process were temperature and catalyst concentration, as well as identifying tetrahydrofuran (THF) as the most suitable solvent. The methodology presented degraded commercial virgin PLA samples; however, it has not yet been proven to work on end-of-life PLA.
Similar to traditional plastics, PLA products are expected to contain a variety of additives. These are normally added to polymers to improve their characteristics, such as durability and stiffness, and to make them safer and cheaper. Additives include flame retardants, plasticizers, light stabilizers, reinforcements, and pigments, among many others.31 Additives are normally complex molecules,32 and the type and concentration present in the plastic formulation, usually part of the intellectual property of the company, will largely depend on its end use. The type and concentration of additives will obviously have an effect on the degradability of the material.32,33
In the present work, the alcoholysis of end-of-life PLA to produce MeLa is reported at lower temperatures than previous studies found in the literature. The reaction is catalyzed by a Zn(II) complex fully characterized and described elsewhere.30 Temperature-dependent kinetic parameters are first obtained from the reaction of virgin PLA to determine differences in the conversion, yield, and selectivity of the waste PLA. PLA wastes were only characterized in terms of their molecular weight and dispersity; no attempt was made to identify the additives and the amounts present in the samples.
2. Experimental Section
2.1. Materials
Methanol (MeOH) and THF high-performance liquid chromatography (HPLC) grades were acquired from Sigma-Aldrich and used as received. Nitrogen (≥99.998%) and helium (≥99.999%) were purchased from BOC. Virgin PLA beads (Ingeo) were obtained from NatureWorks and used as received. The Ingeo materials were selected to cover a range of applications in extrusion/thermoforming and fiber/nonwoven manufacturing.
End-of-life PLA samples consisted of a cup, an infants’ toy, and a three-dimensional (3D) printed material or leftover 3D filaments (Figure 2). The 3D materials were donated by the Food Microstructure research group at the University of Birmingham. The average molecular weight number (Mn), dispersity (Đ), melting point (Tm), and original source of the samples are presented in Table 1. The waste samples were reduced to small enough pieces (between 1 and 10 mm) to fit into the reactor and to not interfere with the stirrer, but no actual control of particle size was done.
Figure 2.
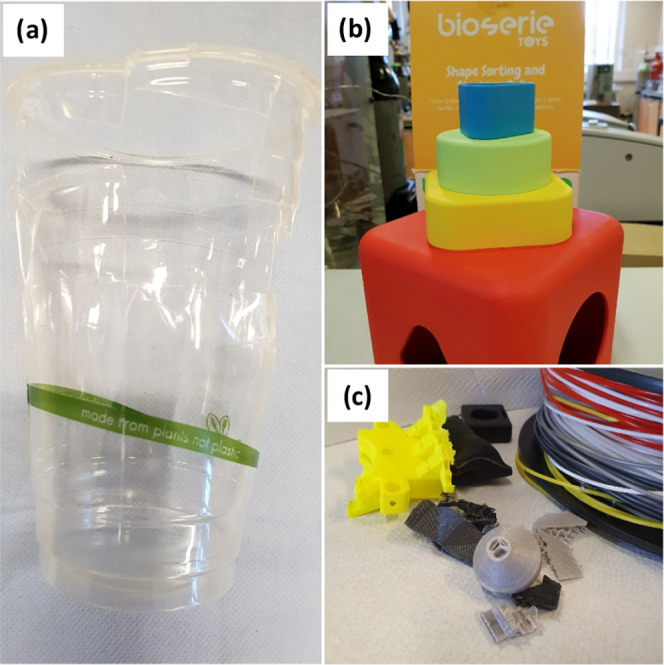
PLA waste samples studied: (a) a cup, (b) toy, and (c) 3D printing material.
Table 1. PLA Sample Properties and Sourcesa,b.
| PLA sample | Mn (g mol–1) | Đ | Tm (°C) | source |
|---|---|---|---|---|
| 6202D | 44 350 | 2.00 | 155–170 | NatureWorks |
| 2500HP | 71 900 | 1.62 | 165–180 | NatureWorks |
| cup | 45 150 | 2.08 | 132–160 | Vegware |
| toy | 36 050 | 2.02 | 151–175 | Bioserie |
| 3D | 65 100 | 2.12 | 154–177 | RS components |
Average molecular weight number (Mn) and dispersity (Đ) were determined by refractive index gel permeation chromatography (GPC); values include a 0.58 correction factor.34
Melting point (Tm) of PLA waste samples was measured by differential scanning calorimetry (DSC); NatureWorks values were taken from the product’s datasheet.
2.2. Catalyst Preparation and Characterization
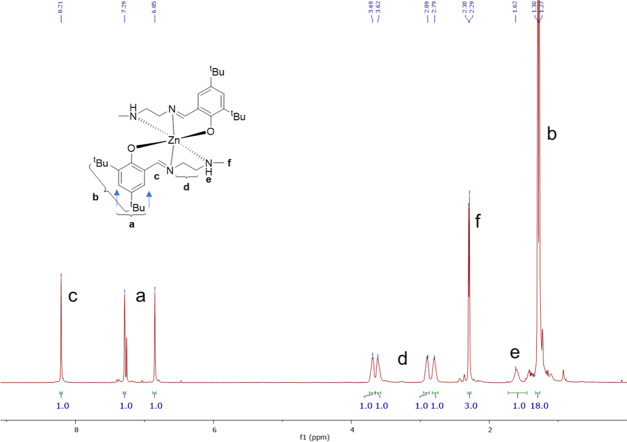
The catalyst was prepared on a multigram scale (25 g, 54 mmol) and characterized according to literature procedures.35 Preparation was performed under inert/Schlenk conditions and stored under an inert atmosphere before use. Successful catalyst synthesis was confirmed by 1H NMR spectroscopy (Figure 3).
Figure 3.
1H NMR spectrum (400 MHz, CDCl3) of the Zn(II) catalyst.
2.3. Apparatus and Procedure
The experimental apparatus was described in detail in Román-Ramírez et al.30 Briefly, the reaction system comprises a PARR 4566 model reactor (300 mL, T316 SS jacketed, stirred vessel), a PARR 4848 monitoring unit (for stirring speed and pressure), a Julabo HE oil bath heating circulator, a Julabo GR150 chiller, and a PerkinElmer 200 HPLC pump.
Two different procedures were followed depending on whether the material reacted was virgin PLA or waste PLA. For the former case, PLA (12.5 g), THF (200 mL), and catalyst (1.0 g) were charged into the reactor, the vessel was sealed, and the mixture was flushed with nitrogen for a few minutes at room temperature to achieve an inert atmosphere. Heating was then started, and once the desired reaction temperature was reached, MeOH (50 mL) was added by the HPLC pump at 10 mL min–1. The start of the alcohol addition marked the start of the reaction time. Samples were taken at different time intervals to monitor the progress of the reaction. This procedure generates more accurate kinetic data since it reduces the experimental error due to the ongoing reaction during the heating time, considering the catalyst has shown to be active for the depolymerization of PLA even at temperatures of 40 °C.30
For the case of the waste samples, all materials (PLA, THF, catalyst, and MeOH) were charged to the reactor from the start, the mixture was flushed with nitrogen for several minutes, and heating was then started. The start of the heating process marked the start of the reaction. This procedure resembles more closely industrial operating procedures. The experiments were performed in duplicates, and samples were taken at 1 and 4 h of the reaction.
MeLa concentration (g mL–1) was determined by a gas chromatograph (GC, Agilent Technologies 6890N) equipped with an FID detector and a capillary column 30 m × 0.32 mm ID, 0.25 μm (Agilent Technologies HP-5). Helium (CP grade from BOC) was used as the carrier and make-up gas. One microliter of the samples was injected with an autosampler (7683B) at 150 °C and 250 °C inlet and detector temperatures, respectively, a 1:100 split ratio, an initial oven temperature of 90 °C (4 min), followed by 120 °C (1 min) at 100 °C min–1 and then 200 °C (3 min) at 100 °C min–1. The initial flow rate was 0.7 mL min–1 (5 min), followed by a 3 mL min–1 at 100 mL min–1.
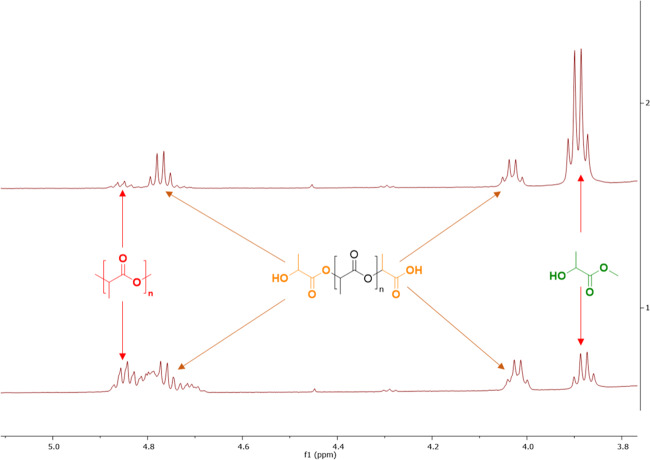
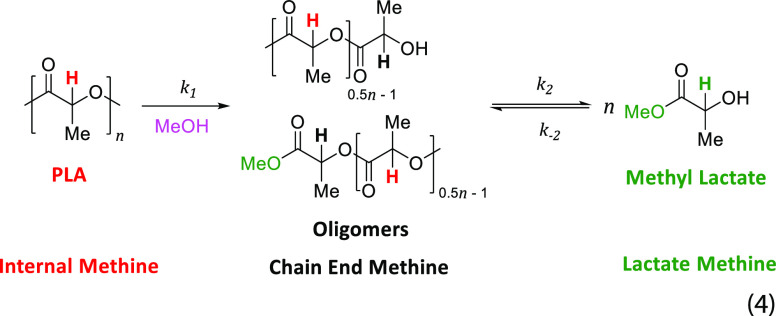
Internal methine (Int), chain-end methine (CE), and methyl lactate methine (MeLa) proton group concentrations (%) were determined by 1H NMR spectroscopy (400 MHz Bruker Avance III) and referenced to residual solvent resonances (Figure 4). The three different methine groups are representative of the PLA (Int), intermediate oligomers (CE), and MeLa concentrations, as detailed elsewhere.30 Conversion (X), selectivity (S), and yield (Y) were calculated according to eqs 1–3
| 1 |
| 2 |
| 3 |
Figure 4.
1H NMR spectrum (400 MHz, C6D6) of PLA toy degradation at 70 °C.
3. Kinetic Modeling
It has been previously shown that the formation of MeLa from the transesterification of PLA with excess MeOH can be described by a consecutive reaction according to eq 4(30,36)
 |
4 |
Temperature-dependent parameters (pre-exponential factor, A, and activation energies, Ea) of the reaction rate coefficients (k) were obtained by fitting the experimental concentrations to the mass balance of the system (eqs 5–7) with initial conditions (eq 8) and assuming Arrhenius temperature-dependent form of the rate coefficients (eq 9). Optimum parameters were found using gPROMS, which uses the maximum likelihood estimation method as the objective function in the fitting procedure37,38
| 5 |
| 6 |
| 7 |
| 8 |
| 9 |
4. Results and Discussion
4.1. Virgin PLA
Int, CE, and MeLa concentrations determined by 1H NMR spectroscopy and GC for the virgin PLA samples are presented in Table S1. Despite the small differences in reaction rate between the two PLA grades, these differences cannot be considered statistically significant, i.e., the reaction rate proceeds at the same rate regardless of PLA Mn.30 The deviations can be attributed to small differences in measurements of the reactants and catalysts, particularly weighing of the catalysts since catalyst concentration has been shown to be a main contributor to reaction rate.30
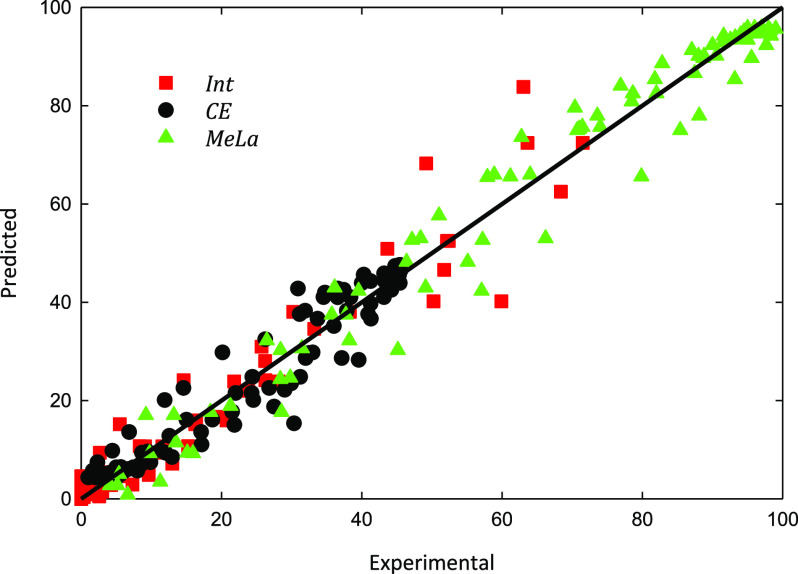
A good representation between experiments and modeling results for all temperatures was obtained (see, for instance, Figure 5). The reaction rate coefficients of the three reactions show a linear dependency on temperature with Arrhenius parameters presented in Table 2. There is a clear increase in the reaction rate by the increase in temperature, as shown in the values for the rate coefficients. The parity plot (Figure 6) reveals the good agreement between experimental and modeling data for both PLA Mn samples and for all temperatures. The largest deviations from the reference line are observed for the Int concentrations during the initial stages of the reaction and at the lowest temperature (70 °C).
Figure 5.
Reaction profiles at (a) 70 °C, (b) 90 °C, and (c) 110 °C. Symbols: experimental results; lines: modeling results using Arrhenius parameters from Table 2.
Table 2. Arrhenius Parameters (Pre-exponential Factor, A, and Activation Energy, Ea) Obtained from the Fitting Procedure for the Three Reaction Rate Coefficients.
| k1 | k2 | k3 | |
|---|---|---|---|
| A (min–1) | 47 009 ± 37 | 108 129 ± 100 | 1344 ± 9 |
| Ea (kJ mol–1) | 40.8 ± 2.3 | 44.7 ± 2.8 | 40.8 ± 21.1 |
Figure 6.
Parity plot of predicted vs experimental values for all data.
4.2. PLA Waste
The results for the PLA waste samples are analyzed in terms of the X, S, and Y at 1 and 4 h (Figures 7–9).
Figure 7.
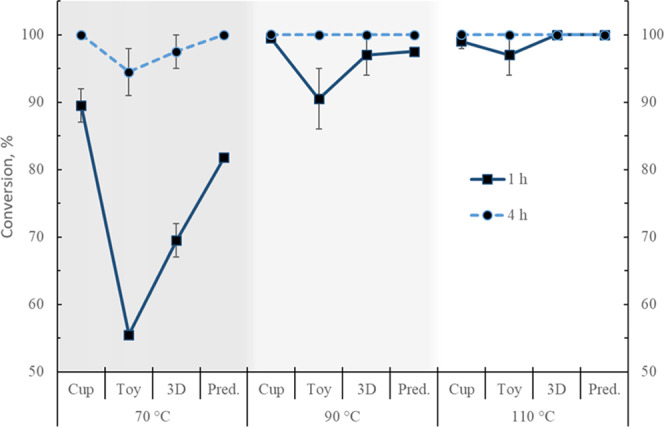
Poly(lactic acid) conversion experimental values at 1 and 4 h for the end-of-life samples tested at three different temperatures. Predicted (Pred.) values from the modeling. Error bars correspond to 1 standard deviation.
Figure 9.
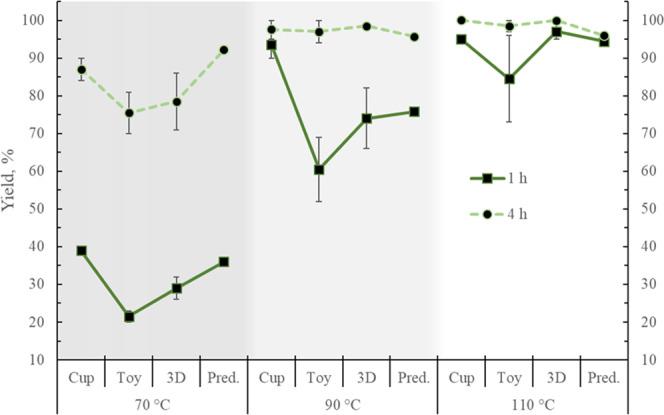
Methyl lactate yields experimental values at 1 and 4 h for the end-of-life samples tested at three different temperatures. Predicted (Pred.) values from the modeling. Error bars correspond to 1 standard deviation.
Figure 8.
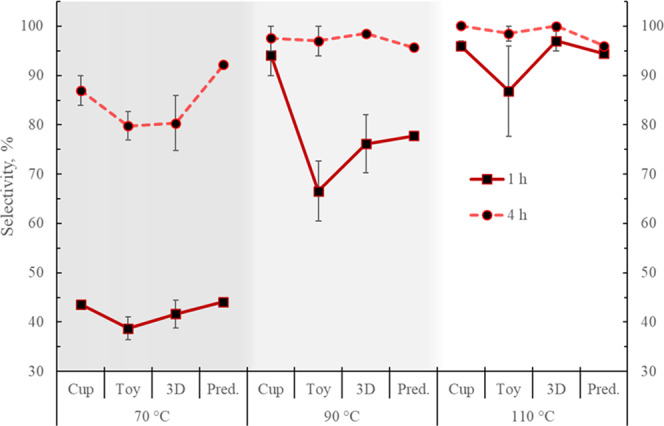
Methyl lactate selectivity experimental values at 1 and 4 h for the end-of-life samples tested at three different temperatures. Predicted (Pred.) values from the modeling. Error bars correspond to 1 standard deviation.
4.2.1. Effect of Temperature
Higher X, S, and Y are achieved with the increase in temperature for all samples. As expected, higher values of these parameters are obtained after 4 h of reaction. The X, S, and Y are lower at 70 °C, in particular, for the toy. A conversion of 100% is achieved for all samples after 4 h, except for the toy and the 3D printing material at 70 °C, but these samples also present the largest standard deviations.
MeLa selectivities for all of the materials are below 45% at 70 °C at just 1 h reaction but their value almost double after 4 h. At higher temperatures, the selectivity increases, although for the toy it shows the lowest increase and the larger deviations, especially at 1 h. Selectivities of 100% were obtained for the cup and the 3D printing samples after 4 h.
In terms of yield, this increases at the higher temperatures for all samples, although again, the toy exhibits the lowest increments and the largest deviations, particularly at 1 h. A 100% yield is obtained for the cup and 3D material after 4 h. In the case of the cup, there is not much improvement in performing the reaction at 90 or 110 °C since only a 2% increment is obtained in terms of S and Y by increasing the temperature by 20 °C.
4.2.2. Effect of PLA Waste
In general, the cup presented the highest values of X, S, and Y at both times, whereas the lowest values, as well as the largest standard deviations, were observed for the toy. This could be the effect of the presence of different unknown additives in the toy, considering it is designed to be a long-lasting nonhazardous item. The material may contain, for instance, flame retardants, fillers, reinforcements, and colorants. This is appreciated in the toy’s hardness despite its low Mn (Table 1). This fact seems to be corroborated by the observation of two phases in the final samples of the reactions due to the sedimentation of THF-insoluble particles (Figure 10). The conversions presented in this work are in terms of the amount of PLA, as measured by the 1H NMR; a more appropriate way to determine the conversion, in this case, would be by weighing the initial amount of the PLA sample and also measuring the final weight of the undissolved solid residue after proper treatment. Nevertheless, in terms of PLA, and to perform the comparison, the values of the X, S, and Y as described before are used. The toy also presented the second highest Tm (Table 1), and this improvement in thermal stability, in combination with additives, could relate to the reduced degradation.
Figure 10.
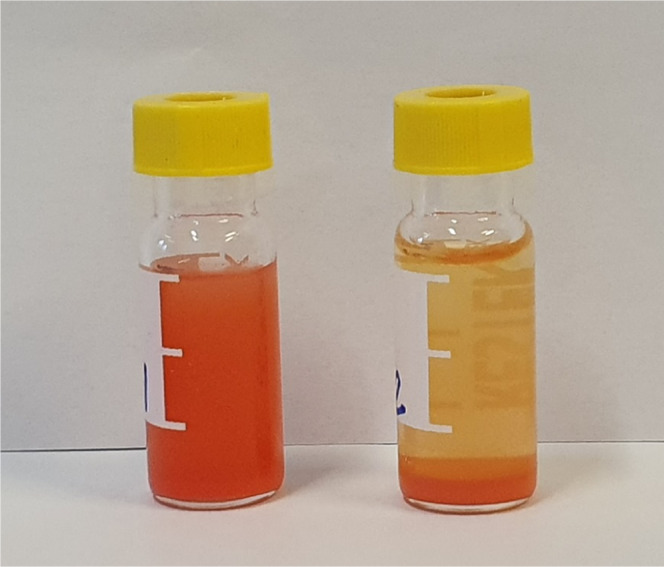
Dispersed (left) and sedimented (right) insoluble particles in a final sample of PLA toy depolymerized at 110 °C.
The cup seems to contain the lowest amount of additives; the final samples were clear in color although some parts of it contained some of the ink product labels. The cup also presented the lowest thermal parameters. Despite having the higher Tm, the 3D material gave intermediate results, and this may relate to the reduced amount of additives most likely only colorants.
4.2.3. Experimental vs Simulation
The batch reaction process was simulated using the temperature-dependent kinetic parameters obtained from the virgin PLA in gPROMS to predict the X, S, and Y at 1 and 4 h (Figures 7–9) of the end-of-life-treated samples from an initial temperature of 20 °C (the room temperature in the laboratory) to the final reaction temperature (70, 90, or 110 °C).
The experimental X, S, and Y values for the cup are overall closer to the simulation results (Table 3). There is a particularly good agreement between the experimental and the predicted values for the conversion at both times, with average deviations of 2%. This supports the notion that the cup contains fewer additives than the other samples, therefore being closer to the virgin PLA material. However, at 90 °C, there are large differences between the predicted and the experimental values for the cup, and, as mentioned before, the experimental results at 90 and 110 °C are very close. This could mean that the manufacturing process of the cup (thermoforming) has modified the structural and mechanical properties of the polymer, making it easier to depolymerize at some intermediate temperature, as evidenced by other studies on PLA.39 Similar observations have been shown for poly(methyl methacrylate) and polystyrene after extrusion processing.40 The second best predictions for X, S, and Y are shown for the 3D printing samples, which are believed to contain more additives than the cup but fewer than the toy. The largest differences between the experimental and the simulated values are observed for the toy.
Table 3. Average Absolute Deviations for Int Conversion (X), MeLa Selectivity (S), and MeLa Yield (Y) between Experimental Values and Predicted Values.
| PLA sample | T (°C) | time (h) | X (%) | S (%) | Y (%) |
|---|---|---|---|---|---|
| cup | 70 | 1 | 9 | 1 | 8 |
| cup | 70 | 4 | 0 | 6 | 6 |
| cup | 90 | 1 | 2 | 17 | 19 |
| cup | 90 | 4 | 0 | 2 | 2 |
| cup | 110 | 1 | 1 | 2 | 1 |
| cup | 110 | 4 | 0 | 4 | 4 |
| toy | 70 | 1 | 47 | 14 | 68 |
| toy | 70 | 4 | 6 | 16 | 22 |
| toy | 90 | 1 | 8 | 17 | 25 |
| toy | 90 | 4 | 0 | 1 | 1 |
| toy | 110 | 1 | 3 | 9 | 12 |
| toy | 110 | 4 | 0 | 3 | 3 |
| 3D | 70 | 1 | 18 | 6 | 24 |
| 3D | 70 | 4 | 3 | 15 | 17 |
| 3D | 90 | 1 | 1 | 2 | 2 |
| 3D | 90 | 4 | 0 | 3 | 3 |
| 3D | 110 | 1 | 0 | 3 | 3 |
| 3D | 110 | 4 | 0 | 4 | 4 |
| average | 5 | 7 | 12 |
Arguably, the sample size may be a factor also affecting the reaction rate. The cup and 3D printing material were easier to cut into small pieces compared with the toy. Although no specific control on the particle size was imposed, all PLA samples were reduced to small enough pieces to fit into the reactor. Any difference in size would have a lesser effect as the temperature increases since the sample would be completely solubilized. Two tests on virgin PLA showed that complete dissolution was observed at temperatures above 80 °C at a 4:1 THF/MeOH ratio. It can therefore be assumed that the major differences in the X, S, and Y for the toy are due to the presence of the additives rather than particle size.
Catalyst deactivation does not seem to occur due to the additives in the PLA waste samples. Although lower X, S, and Y are observed for the toy, an increase in activity is observed by the increase in temperature, something that would not be seen if catalyst deactivation was occurring.
It would be expected that the predictions would represent the best-case scenario of the activities and that the experimental results would always be below the predictions considering that no interference due to particle size or additives is present. However, the experimental values for the cup were in most of the cases better than the theoretical simulated values, particularly at 1 h of reaction time. In some cases, the toy and 3D results were also better than the predicted values (for instance, the selectivity at 90 °C).
The higher values of the X, S, and Y for the end-of-life samples can be explained, considering that the properties of polymer (molecular weight, chemical structure, thermal stability, crystallinity, and mechanical properties) are altered during industrial thermoplastic processing (injection and extrusion), as shown by studies on PLA39 and other polymers.40 Additionally, research comparing the pyrolysis of virgin and waste polymer has shown differences in product yields and compositions between both types, with lower-energy requirements for the waste material.41−43
5. Conclusions
Green solvent methyl lactate was obtained from the chemical degradation of end-of-life poly(lactic acid) catalyzed by a Zn complex. Three different samples were tested: a cup, a toy, and a 3D printing material, at three temperatures: 70, 90, and 110 °C. Kinetic parameters were obtained from the experimental data of virgin PLA, and the model was used to predict the conversion, selectivity, and yield of the PLA waste samples from a batch process in which the samples start at a room temperature of 20 °C until they reached the final process temperature.
The deviations between the predicted and experimental values of the end-of-life samples varied depending on temperature, reaction time, and sample. The deviations are overall in good agreement for the cup, which is believed to have the fewest amount of additives. Larger deviations are observed for the toy, which seems to contain the largest amounts of additives as exhibited by their structural strength and by the final mixture containing an insoluble phase.
Despite the large amount of uncertainty in the samples given by additive type and concentration, particle size, manufacturing process, and molecular weight, the kinetic parameters obtained in this work can be used to get a good approximation of the conversion, selectivity, and yield of the methanolysis of end-of-life PLA into methyl lactate to an average deviation of 5, 7, and 12, respectively.
Acknowledgments
The authors acknowledge the financial support of ESPRC (Grant No. EP/P016405/1). NatureWorks LLC is acknowledged for its donation of 2500HP and 6202D samples. The Food Microstructure research group at the University of Birmingham is acknowledged for its donation of 3D printing samples.
Supporting Information Available
The Supporting Information is available free of charge at https://pubs.acs.org/doi/10.1021/acs.iecr.0c01122.
Int, CE, and MeLa concentrations were determined by 1H NMR spectroscopy and GC for the virgin PLA samples at three different temperatures (6202D and 2500HP) (PDF)
The authors declare no competing financial interest.
Supplementary Material
References
- De Smet M.The New Plastics Economy: Rethinking the Future of Plastics & Catalysing Action; Ellen MacArthur Foundation: Cowes, Isle of Wight, UK, 2017. [Google Scholar]
- Madhavan Nampoothiri K.; Nair N. R.; John R. P. An Overview of the Recent Developments in Polylactide (PLA) Research. Bioresour. Technol. 2010, 101, 8493–8501. 10.1016/j.biortech.2010.05.092. [DOI] [PubMed] [Google Scholar]
- Derraik J. G. B. The Pollution of the Marine Environment by Plastic Debris: A Review. Mar. Pollut. Bull. 2002, 44, 842–852. 10.1016/S0025-326X(02)00220-5. [DOI] [PubMed] [Google Scholar]
- Gregory M. R. Environmental Implications of Plastic Debris in Marine Settings- Entanglement, Ingestion, Smothering, Hangers-on, Hitch-Hiking and Alien Invasions. Philos. Trans. R. Soc., B 2009, 364, 2013–2025. 10.1098/rstb.2008.0265. [DOI] [PMC free article] [PubMed] [Google Scholar]
- Glausiusz J. Toxicology: The Plastics Puzzle. Nature 2014, 508, 306–308. 10.1038/508306a. [DOI] [PubMed] [Google Scholar]
- Gupta A. P.; Kumar V. New Emerging Trends in Synthetic Biodegradable Polymers - Polylactide: A Critique. Eur. Polym. J. 2007, 43, 4053–4074. 10.1016/j.eurpolymj.2007.06.045. [DOI] [Google Scholar]
- Sin L. T.; Rahmat A. R.; Rahman W. A. W. A.. Applications of Poly(Lactic Acid). In Polylactic Acid, Ebnesajjad S., Ed.; William Andrew Publishing: Oxford, 2013; pp 301–327. [Google Scholar]
- Ovitt T. M.; Coates G. W. Stereoselective Ring-Opening Polymerization of Meso-Lactide: Synthesis of Syndiotactic Poly(Lactic Acid). J. Am. Chem. Soc. 1999, 121, 4072–4073. 10.1021/ja990088k. [DOI] [Google Scholar]
- Dusselier M.; Van Wouwe P.; Dewaele A.; Jacobs P. A.; Sels B. F. Shape-Selective Zeolite Catalysis for Bioplastics Production. Science 2015, 349, 78–80. 10.1126/science.aaa7169. [DOI] [PubMed] [Google Scholar]
- Hong M.; Chen E. Y. X. Chemically Recyclable Polymers: A Circular Economy Approach to Sustainability. Green Chem. 2017, 19, 3692–3706. 10.1039/C7GC01496A. [DOI] [Google Scholar]
- Haider T. P.; Völker C.; Kramm J.; Landfester K.; Wurm F. R. Plastics of the Future? The Impact of Biodegradable Polymers on the Environment and on Society. Angew. Chem., Int. Ed. 2019, 58, 50–62. 10.1002/anie.201805766. [DOI] [PubMed] [Google Scholar]
- Lv S.; Zhang Y.; Tan H. Thermal and Thermo-Oxidative Degradation Kinetics and Characteristics of Poly (Lactic Acid) and Its Composites. Waste Manage. 2019, 87, 335–344. 10.1016/j.wasman.2019.02.027. [DOI] [PubMed] [Google Scholar]
- Herrera-Kao W. A.; Loría-Bastarrachea M. I.; Pérez-Padilla Y.; Cauich-Rodríguez J. V.; Vázquez-Torres H.; Cervantes-Uc J. M. Thermal Degradation of Poly(Caprolactone), Poly(Lactic Acid), and Poly(Hydroxybutyrate) Studied by TGA/FTIR and Other Analytical Techniques. Polym. Bull. 2018, 75, 4191–4205. 10.1007/s00289-017-2260-3. [DOI] [Google Scholar]
- Fan Y.; Nishida H.; Shirai Y.; Tokiwa Y.; Endo T. Thermal Degradation Behaviour of Poly(Lactic Acid) Stereocomplex. Polym. Degrad. Stab. 2004, 86, 197–208. 10.1016/j.polymdegradstab.2004.03.001. [DOI] [Google Scholar]
- Fan Y.; Nishida H.; Mori T.; Shirai Y.; Endo T. Thermal Degradation of Poly(L-Lactide): Effect of Alkali Earth Metal Oxides for Selective L,L-Lactide Formation. Polymer 2004, 45, 1197–1205. 10.1016/j.polymer.2003.12.058. [DOI] [Google Scholar]
- Piemonte V.; Gironi F. Kinetics of Hydrolytic Degradation of PLA. J. Polym. Environ. 2013, 21, 313–318. 10.1007/s10924-012-0547-x. [DOI] [Google Scholar]
- Mohd-Adnan A. F.; Nishida H.; Shirai Y. Evaluation of Kinetics Parameters for Poly(L-Lactic Acid) Hydrolysis under High-Pressure Steam. Polym. Degrad. Stab. 2008, 93, 1053–1058. 10.1016/j.polymdegradstab.2008.03.022. [DOI] [Google Scholar]
- Elsawy M. A.; Kim K. H.; Park J. W.; Deep A. Hydrolytic Degradation of Polylactic Acid (PLA) and Its Composites. Renewable Sustainable Energy Rev. 2017, 79, 1346–1352. 10.1016/j.rser.2017.05.143. [DOI] [Google Scholar]
- Cristina A. M.; Sara F.; Fausto G.; Vincenzo P.; Rocchina S.; Claudio V. Degradation of Post-Consumer PLA: Hydrolysis of Polymeric Matrix and Oligomers Stabilization in Aqueous Phase. J. Polym. Environ. 2018, 26, 4396–4404. 10.1007/s10924-018-1312-6. [DOI] [Google Scholar]
- Calvo-Flores F. G.; Monteagudo-Arrebola M. J.; Dobado J. A.; Isac-García J. Green and Bio-Based Solvents. Top. Curr. Chem. 2018, 376, 18 10.1007/s41061-018-0191-6. [DOI] [PubMed] [Google Scholar]
- Bowmer C. T.; Hooftman R. N.; Hanstveit A. O.; Venderbosch P. W.; van der Hoeven N. The Ecotoxicity and the Biodegradability of Lactic Acid, Alkyl Lactate Esters and Lactate Salts. Chemosphere 1998, 37, 1317–1333. 10.1016/S0045-6535(98)00116-7. [DOI] [PubMed] [Google Scholar]
- De Clercq R.; Dusselier M.; Poleunis C.; Debecker D. P.; Giebeler L.; Oswald S.; Makshina E.; Sels B. F. Titania-Silica Catalysts for Lactide Production from Renewable Alkyl Lactates: Structure–Activity Relations. ACS Catal. 2018, 8, 8130–8139. 10.1021/acscatal.8b02216. [DOI] [Google Scholar]
- De Clercq R.; Dusselier M.; Makshina E.; Sels B. F. Catalytic Gas-Phase Production of Lactide from Renewable Alkyl Lactates. Angew. Chem., Int. Ed. 2018, 57, 3074–3078. 10.1002/anie.201711446. [DOI] [PubMed] [Google Scholar]
- Coszach P.; Bogaert J.-C.; Willocq J.. Chemical Recycling of PLA by Hydrolysis. US8,431,6832013.
- Brake L. D.Preparation of Alkyl Esters by Depolymerization. U.S. Patent US5,264,6171993.
- Song X.; Zhang X.; Wang H.; Liu F.; Yu S.; Liu S. Methanolysis of Poly(Lactic Acid) (PLA) Catalyzed by Ionic Liquids. Polym. Degrad. Stab. 2013, 98, 2760–2764. 10.1016/j.polymdegradstab.2013.10.012. [DOI] [Google Scholar]
- Petrus R.; Bykowski D.; Sobota P. Solvothermal Alcoholysis Routes for Recycling Polylactide Waste as Lactic Acid Esters. ACS Catal. 2016, 6, 5222–5235. 10.1021/acscatal.6b01009. [DOI] [Google Scholar]
- Alberti C.; Damps N.; Meißner R. R. R.; Enthaler S. Depolymerization of End-of-Life Poly(Lactide) Via 4-Dimethylaminopyridine-Catalyzed Methanolysis. ChemistrySelect 2019, 4, 6845–6848. 10.1002/slct.201901316. [DOI] [Google Scholar]
- Alberti C.; Damps N.; Meißner R. R. R.; Hofmann M.; Rijono D.; Enthaler S. Selective Degradation of End-of-Life Poly(Lactide) Via Alkali-Metal-Halide Catalysis. Adv. Sustainable Syst. 2019, 4, 1900081 10.1002/adsu.201900081. [DOI] [Google Scholar]
- Román-Ramírez L. A.; McKeown P.; Jones M. D.; Wood J. Poly(Lactic Acid) Degradation into Methyl Lactate Catalyzed by a Well-Defined Zn(II) Complex. ACS Catal. 2019, 1, 409–416. 10.1021/acscatal.8b04863. [DOI] [Google Scholar]
- British Plastics Federation Plastics Additives. https://www.bpf.co.uk/plastipedia/additives/default.aspx. (Oct 25, 2019).
- Hahladakis J. N.; Velis C. A.; Weber R.; Iacovidou E.; Purnell P. An Overview of Chemical Additives Present in Plastics: Migration, Release, Fate and Environmental Impact During Their Use, Disposal and Recycling. J. Hazard. Mater. 2018, 344, 179–199. 10.1016/j.jhazmat.2017.10.014. [DOI] [PubMed] [Google Scholar]
- Gewert B.; Plassmann M. M.; MacLeod M. Pathways for Degradation of Plastic Polymers Floating in the Marine Environment. Environ. Sci.: Processes Impacts 2015, 17, 1513–1521. 10.1039/C5EM00207A. [DOI] [PubMed] [Google Scholar]
- Baran J.; Duda A.; Kowalski A.; Szymanski R.; Penczek S. Intermolecular Chain Transfer to Polymer with Chain Scission: General Treatment and Determination of Kp/Ktr in L,L-Lactide Polymerization. Macromol. Rapid Commun. 1997, 18, 325–333. 10.1002/marc.1997.030180409. [DOI] [Google Scholar]
- McKeown P.; McCormick S. N.; Mahon M. F.; Jones M. D. Highly Active Mg(II) and Zn(II) Complexes for the Ring Opening Polymerisation of Lactide. Polym. Chem. 2018, 9, 5339–5347. 10.1039/C8PY01369A. [DOI] [Google Scholar]
- McKeown P.; Román-Ramírez L. A.; Bates S.; Jones M. D.; Wood J. Zinc Complexes for PLA Formation and Chemical Recycling: Towards a Circular Economy. ChemSusChem 2019, 12, 5233–5238. 10.1002/cssc.201902755. [DOI] [PubMed] [Google Scholar]
- Process Systems Enterprise Ltd. gPROMS Model Builder. version 5.1.1. https://www.psenterprise.com/products/gproms/modelbuilder, 2019.
- Aldrich J. R.A. Fisher and the Making of Maximum Likelihood 1912–1922. Stat. Sci. 1997, 12, 162–176. 10.1214/ss/1030037906. [DOI] [Google Scholar]
- Farah S.; Anderson D. G.; Langer R. Physical and Mechanical Properties of PLA, and Their Functions in Widespread Applications — a Comprehensive Review. Adv. Drug Delivery Rev. 2016, 107, 367–392. 10.1016/j.addr.2016.06.012. [DOI] [PubMed] [Google Scholar]
- Capone C.; Di Landro L.; Inzoli F.; Penco M.; Sartore L. Thermal and Mechanical Degradation During Polymer Extrusion Processing. Polym. Eng. Sci. 2007, 47, 1813–1819. 10.1002/pen.20882. [DOI] [Google Scholar]
- Kiran Ciliz N.; Ekinci E.; Snape C. E. Pyrolysis of Virgin and Waste Polypropylene and Its Mixtures with Waste Polyethylene and Polystyrene. Waste Manage. 2004, 24, 173–181. 10.1016/j.wasman.2003.06.002. [DOI] [PubMed] [Google Scholar]
- Yan G.; Jing X.; Wen H.; Xiang S. Thermal Cracking of Virgin and Waste Plastics of PP and LDPE in a Semibatch Reactor under Atmospheric Pressure. Energy Fuels 2015, 29, 2289–2298. 10.1021/ef502919f. [DOI] [Google Scholar]
- Singh M. V. Waste and Virgin High-Density Poly(Ethylene) into Renewable Hydrocarbons Fuel by Pyrolysis-Catalytic Cracking with a COCO3 Catalyst. J. Anal. Appl. Pyrolysis 2018, 134, 150–161. 10.1016/j.jaap.2018.06.003. [DOI] [Google Scholar]
Associated Data
This section collects any data citations, data availability statements, or supplementary materials included in this article.


