Abstract
T cell-secreted IFNγ can exert pleiotropic effects on tumor cells that include induction of immune checkpoints and antigen presentation machinery components, and inhibition of cell growth. Despite its role as key effector molecule, little is known about the spatiotemporal spreading of IFNγ secreted by activated CD8+ T cells within the tumor environment. Using multiday intravital imaging, we demonstrate that T cell recognition of a minor fraction of tumor cells leads to sensing of IFNγ by a large part of the tumor mass. Furthermore, imaging of tumors in which antigen-positive and -negative tumor cells are separated in space reveals spreading of the IFNγ response, reaching distances of >800 µm. Notably, long-range sensing of IFNγ can modify tumor behavior, as both shown by induction of PD-L1 expression and inhibition of tumor growth. Collectively, these data reveal how, through IFNγ, CD8+ T cells modulate the behavior of remote tumor cells, including antigen-loss variants.
Keywords: CD8+ T cells, IFNγ spreading, intravital imaging, tumor immunology, IFNγ receptor signaling reporter
Introduction
CD8+ cytotoxic T lymphocytes (CTLs) play a central role in immune-mediated control of cancer in both preclinical models and in cancer patients. First, CD8+ T cells that recognize either shared antigens or patient-specific neo-antigens are frequently observed in cancer lesions1, and the intratumoral presence of CD8+ T cells forms a positive prognostic marker in many cancer types2, 3. Second, interference with immune checkpoint molecules, such as CTLA-4 and PD-1, that modulate the activity of T cells has resulted in prolonged clinical benefits in cancer patients4. Furthermore, clinical response to PD-1 blocking antibodies has been associated with the density of intratumoral CD8+ T cells prior treatment, and proliferation of intratumoral CD8+ T cells has been observed in responding patients5. Third, and most directly, infusion of autologous tumor-infiltrating lymphocyte (TIL)-derived T cell products, including purified CD8+ T cell products6 has shown an approximate 50% objective response rate in metastatic melanoma7, and has been demonstrated to induce regression of a subset of epithelial cancers8, 9.
The release of perforin- and granzyme-containing cytotoxic granules towards target tumor cells forms a relatively well-understood mechanism of action of CD8+ T cells in tumor control. However, it has been called into question whether such direct tumor cell killing can explain tumor control at the low T cell – tumor cell ratios that are observed in tumors10. Next to the secretion of perforin and granzymes, CTLs also respond to antigen encounter by the secretion of cytokines, such as interferon γ (IFNγ) and tumor necrosis factor α (TNFα), that may modify the behavior of responding tumor cells. As an example, signaling through the IFNγ receptor (IFNγR) can induce the expression of the CXCL9, 10 and 11 chemokines that induce migration of activated T cells to the tumor site11. In addition, IFNγR signaling leads to the enhanced expression of immune checkpoint molecules, such as PD-L1 and PD-L2, but also increases the expression of components of the antigen presentation machinery12, 13. Finally, IFNγ can have direct cytopathic and cytostatic effects on both cancer cells and stromal cells in the tumor mass, inducing either cell cycle arrest, cellular senescence or cell death, depending on the (tumor) cell type involved12, 14, 15, 16. Evidence that these downstream effects of IFNγR signaling are of relevance in T cell-mediated tumor control comes from several observations. Early work in mice by Schreiber and colleagues demonstrated that tumor cells that lack the IFNγR can be less sensitive to T cell-mediated clearance because of their reduced MHC expression17. More recently, inactivation of components of the IFNγR pathway, such as STAT1, Jak1, Jak2 and IFNγR 1 and 2, was shown to result in resistance to CD8+ T cell attack in a series of in vitro and in vivo CRISPR-based genetic screens18, 19, 20. In addition, enhanced sensitivity to CD8+ T cell attack was obtained upon loss of a chromatin regulator that suppresses sensitivity of tumor cells to IFNγ21. Importantly, inactivating mutations in the IFNγR signaling pathway have been demonstrated to promote tumor cell outgrowth in human tumors22, 23 and such mutations have been identified in tumors that either relapsed after anti-PD-1 treatment22, or showed upfront resistance to anti-CTLA-424 and anti-PD-1 treatment25. Next to the direct effects of IFNγ on tumor cells themselves, T-cell-derived IFNγ has also been shown to induce tumor regression in preclinical models by targeting stromal cells, such as endothelial cells in the tumor vasculature16, 26, 27, 28, 29.
In spite of this evidence for a widespread role of IFNγR signaling in tumor control, it is not well understood how different cells in the tumor micro-environment (TME) encounter CD8+ T cell-derived IFNγ. In particular, a number of studies has provided evidence that transfer of peptide antigens to MHC class I molecules on stromal cells (i.e. through peptide cross-presentation) can result in the IFNγ-mediated killing of these cells. However, in other studies it remains unclear whether IFNγR signaling may also be induced on ‘bystander cells’ that aren’t directly recognized by T cells. Such a bystander effect of CD8+ T cell derived IFNγ in tumor tissue would be of potential interest, as it would allow activated T cells to exert effects beyond the cells they can directly contact, including tumor cell subclones that have lost T cell-recognized antigens30.
For CD4+ helper T cells, it has previously been established that secreted IFNγ can induce expression of IFNγ responsive genes in cells outside parasite-infected areas31, 32, with responding cells up to 80 mm (i.e. ≈ 4-8 cell layers) away from the closest infected cell31. By the same token, production of IFNγ and TNFα by intratumoral CD4+ T-cells has been shown to induce senescence in tumor cells that are deficient for MHC class II15. In case of cytotoxic CD8+ T cells, seemingly contradictory results have been obtained. Specifically, in vitro and in vivo analyses of CD8+ T cell – target conjugates indicate that the delivery of IFNγ is directed towards the immunological synapse that is formed between these cells33, 34, suggesting that the IFNγ signal that is emitted following TCR triggering would primarily reach the involved target cell. In contrast, robust IFNγR signaling by bystander cells that lacked a specific T cell antigen has been observed in in vitro astrocyte – T cell cocultures, an observation that has been explained by synaptic leakage of CD8+ T cell-produced IFNγ34. At present, in vivo data on the potential spreading of CD8+ T cell-derived IFNγ, including its spatiotemporal behavior, are lacking, and in this study, we set out to: I) analyze whether antigen-negative cells can sense the IFNγ that is secreted upon antigen encounter by tumor-specific CD8+ T cells; II) how such a signal spreads through the tumor mass in space and time, and; III) whether the long-range sensing of IFNγ can yield a functional response of bystander tumor cells that cannot be directly recognized by T cells. The data obtained demonstrate that tumor recognition by even a limited number of intratumoral CD8+ T cells induces a gradient of IFNγ that reaches tumor cells that are removed by many cell layers. The observed long-range sensing of CD8+ T cell-derived IFNγ has implications for both preemptive tumor cell resistance to immune attack, and for the control of antigen-loss variants that arise during clonal evolution.
Results
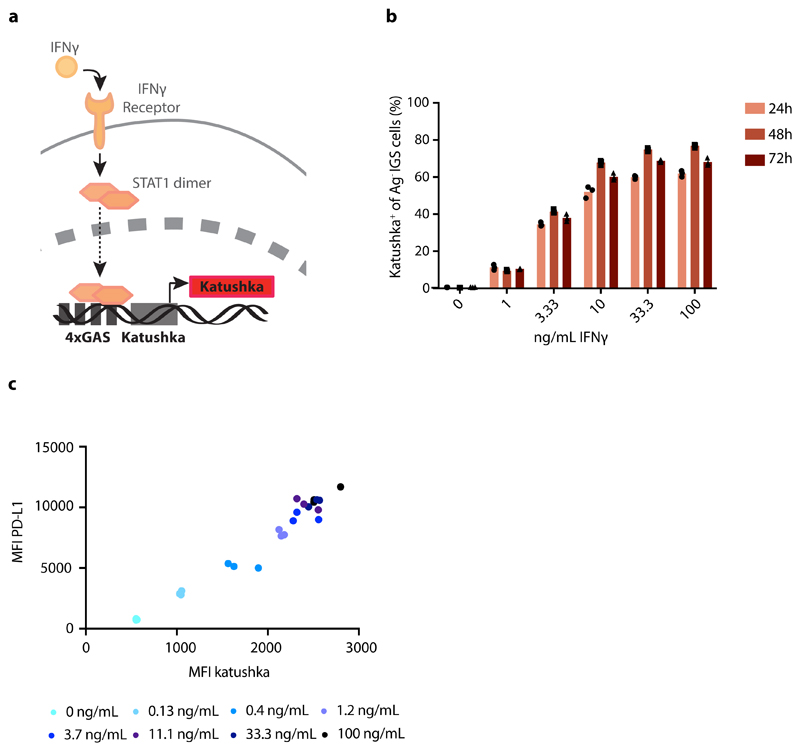
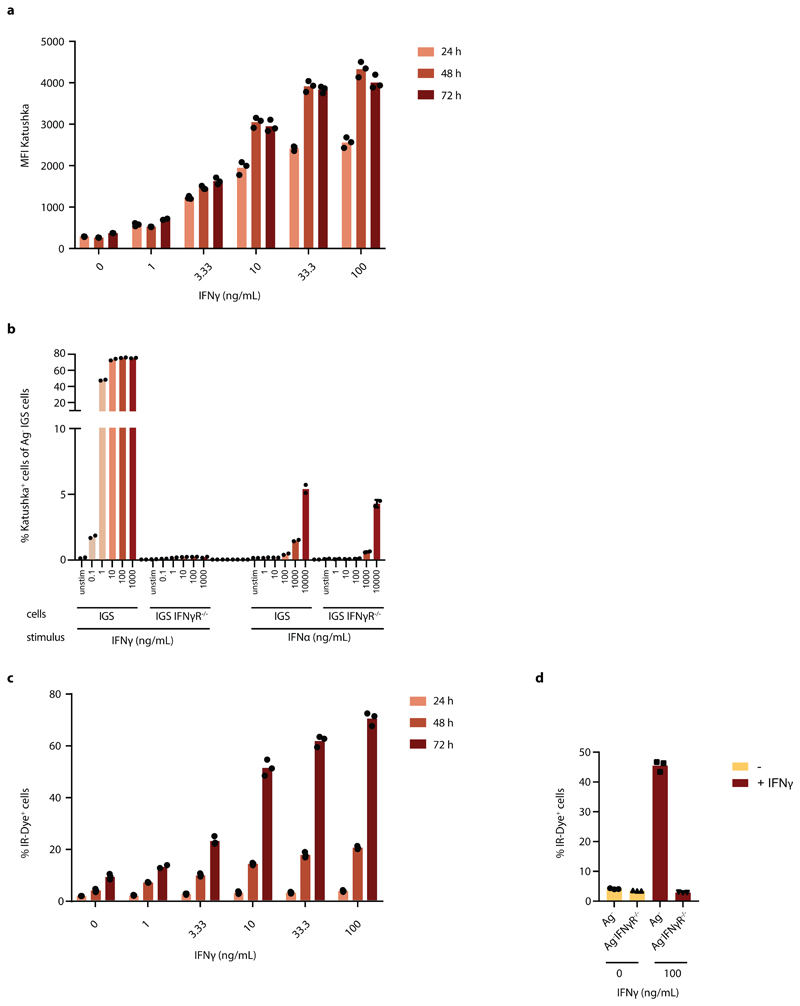
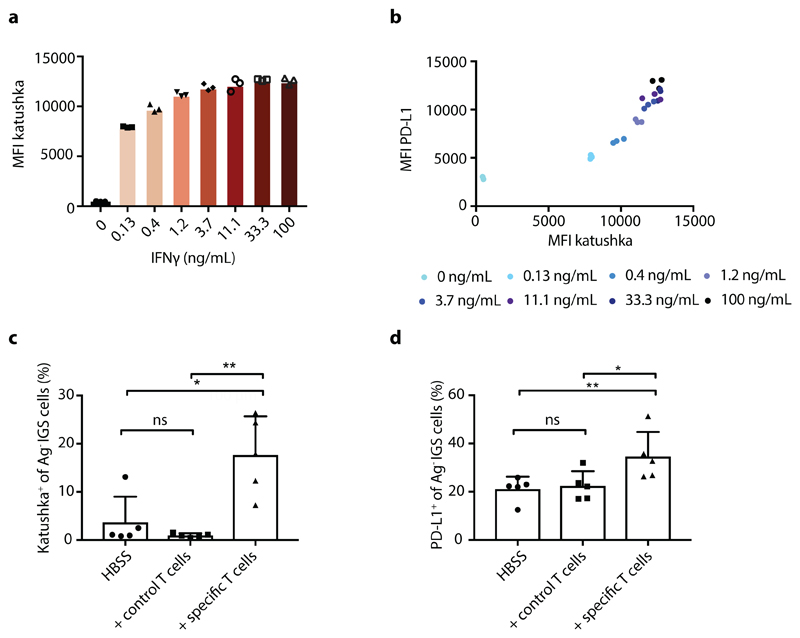
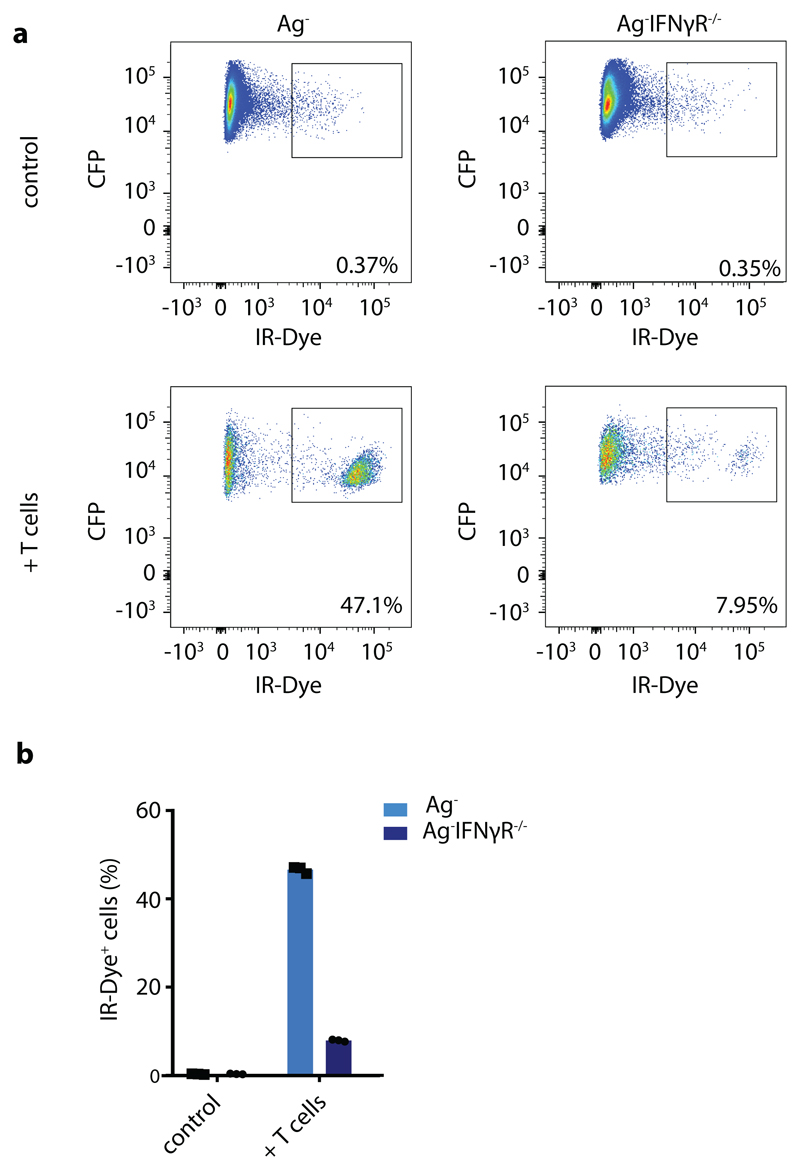
In order to analyze the spatial spreading of CD8+ T-cell-derived IFNγ in vivo, we aimed to set up a system in which the activity of IFNγ-induced signaling in tumor cells could be followed in both space and time. To this end, we first created an IFNγ-sensing (IGS) reporter that induces the expression of the Katushka fluorescent protein in cells after IFNγR triggering, and that consists of an IFNγR-signaling responsive promoter containing a series of Gamma interferon Activation Sites (‘GAS elements’) followed by the Katushka fluorescent protein sequence (Fig. 1a). To validate this IGS reporter, human ovarian carcinoma (OVCAR5) cells modified with the reporter were exposed to either IFNγ or IFNα. Consistent with expectations, IGS reporter-modified tumor cells showed robust Katushka expression within 24 hours after exposure to low concentrations of IFNγ (half-maximal concentration of approx. 3 ng/ml), with maximal Katushka signal 48 hours after stimulation (Fig. 1b and Extended data Fig. 1a). In contrast, exposure to IFNα only resulted in low-level Katushka expression when used at high concentrations (10000 U/ml, Extended data Fig. 1b). Comparable reporter expression kinetics were observed in MDA-MB-231 breast cancer cells (Extended data Fig. 2a), and induction of reporter expression was highly correlated with induction of PD-L1, a known endogenous IFNγ-inducible protein (Fig. 1c and Extended data Fig. 2b). Notably, prolonged IFNγ exposure of OVCAR5 induced cell death (Extended data Fig. 1c and d), thereby providing a second, late and functional, measure of IFNγ sensing.
Figure 1. Characterization of the IFNγR signaling (IGS) reporter system.
a) Schematic representation of IGS reporter system. b) Percentage Katushka-expressing cells of IGS reporter-modified CFP+ OVCAR5 cells upon incubation with the indicated concentrations of recombinant IFNγ. Bar graph shows mean of n=3 technical replicates. Representative data of two independent experiments. c) Median fluorescence intensity of PD-L1 staining as a function of median Katushka fluorescence intensity of CFP+Ag- IGS reporter cells incubated for 24h with recombinant IFNγ under the indicated conditions. Representative data of two independent experiments are depicted.
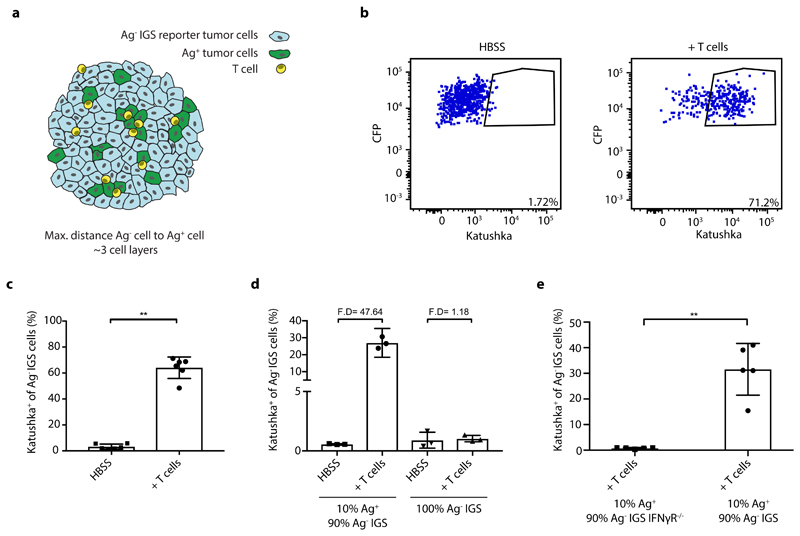
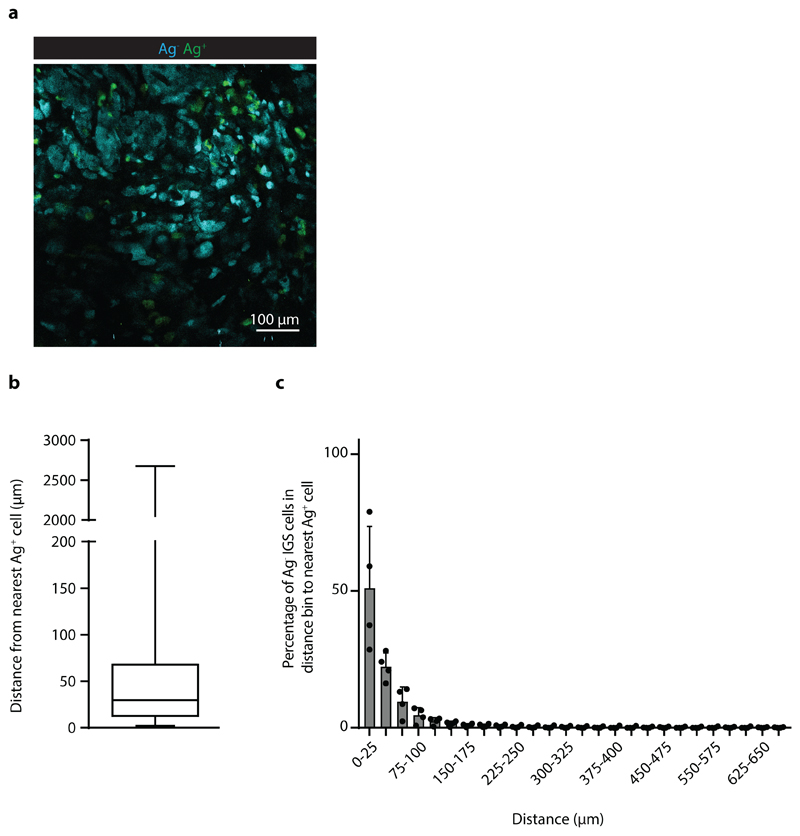
To measure in vivo IFNγ sensing by bystander cells that cannot be directly recognized by CD8+ T cells, we generated chimeric tumors that contain small adjacent groups of tumor cells that do and do not form T cell targets, by injection of mixtures of neoantigen-positive and neoantigen-negative tumor cells (Fig. 2a). Analysis of expression of the IGS reporter in the latter cells provides a means to determine whether tumor cell subclones that lack antigen are influenced by the IFNγ that is secreted by activated T cells in close proximity. Prior data have shown that, while bystander cells can respond to IFNγ released by CD8+ T cells in in vitro assays34, the IFNγ containing vesicles in CD8+ T cells are selectively transported towards the immunological synapse33, 34, suggesting localized effector activity to the target cell. To address whether the IFNγ that is secreted by activated intratumoral CD8+ T cells in vivo is sensed by bystander tumor cells, a GFP+ OVCAR5 tumor cell line was generated that expresses the patient-derived mutant Cyclin-dependent kinase 4 (CDK4R>L) neoantigen35. Subsequently, mixtures of these neoantigen-positive (Ag+) tumor cells together with CFP+ IGS reporter cells that lack the mutant CDK4 neoantigen (Ag-) were injected into NOD-scid Il2rynullB2mnull (NSG-β2m-/-) mice. In the absence of tumor-specific T cells, mice developed chimeric tumors that were composed of small, intermingled groups of both tumor cell populations (Extended data Fig. 3a). To analyze to what extent bystander tumor cells that lack a T cell-recognized antigen respond to CD8+ T-cell-secreted IFNγ, mice were treated with CDK4R>L-specific TCR transduced CD8+ T cells. Remarkably, whereas only a small fraction of bystander tumor cells showed detectable Katushka expression in control mice (3.2% +/- 2.0%), a large fraction of bystander tumor cells (64.0% +/- 8.3%) demonstrated pronounced Katushka expression in tumors with an ongoing tumor-specific T cell response (Fig. 2b and c, Extended data Fig. 4a), an observation that was replicated in the MDA-MB-231 tumor model (Extended data Fig. 2c). This reporter expression by bystander tumor cells required the presence of both tumor-specific CD8+ T cells and a subpopulation of antigen-positive tumor cells (Fig. 2d), and was observed even when the antigen-positive tumor cell subclone formed only a minor fraction (10%) of the tumor cell mass (Fig. 2d). To assess whether the observed reporter expression by antigen-negative cells was directly due to IFNγ sensing, or could be explained by e.g. type I interferon signaling 36, we generated tumors in which Ag- IGS reporter cells that lacked the IFNγ receptor were intermingled with low numbers of Ag+ tumor cells. In this setting, no Katushka reporter signal was observed in recipients of tumor-specific CD8+ T cells, indicating that the observed bystander signaling response critically depends on IFNγ sensing by the bystander tumor cells (Fig. 2e).
Figure 2. In vivo identification of IFNγ sensing bystander cell.
a) Schematic representation of experimental setting in which Ag-positive and Ag- IGS reporter bystander tumor cells are intermingled. b) NSG-β2m-/- mice injected subcutaneously with a mixture of 80% GFP+Ag+ cells and 20% CFP+ IGS reporter bystander OVCAR5 tumor cells (8 x 10⁶ total) were treated with HBSS (control) or with 5 x 10⁶ CDK4R>L-specific CD8+ T cells, and tumors were harvested at day 4 after treatment. Plots show representative flow cytometry analyses used to identify Katushka+ cells within the IGS reporter cell population. c) Quantification of b, with bar graphs depicting mean percentage plus SD of Katushka+ reporter cells in control and T cell treated mice, n=6 mice per group. Representative data from three independent experiments are depicted. p= 0.0022 (**) d) Mouse tumors consisting of a mixture of GFP+Ag+ tumor cells (10%) and CFP+ IGS reporter cells (90%) (left two bars), or solely consisting of CFP+ IGS reporter cells (right two bars) were generated as in b. Mice were then treated with either HBSS (control) or 5 x 10⁶ CDK4R>L-specific CD8+ T cells, and tumors were harvested at day 3 after treatment. Bar graphs depict mean percentage of Katushka+ reporter cells with n=3 mice per group plus SD. Representative data of two biologically independent experiments are depicted. Fold differences (F.D.) were calculated by dividing the means of T cell treated and HBSS treated groups. e) Mouse tumors consisting of 10%-90% mixtures of GFP+Ag+ tumor cells and IFNγR deficient or IFNγR proficient CFP+ IGS reporter cells were generated as in b. Mice were then treated with 5 x 10⁶ CDK4R>L-specific CD8+ T cells, and tumors were harvested at day three after treatment. Bar graphs depict mean percentage of Katushka positive reporter cells plus SD, n=5 mice per group. Representative data of two independent experiments are depicted p= 0.0079 (**). Two-tailed Mann-Whitney U-tests were performed for all statistical analyses.
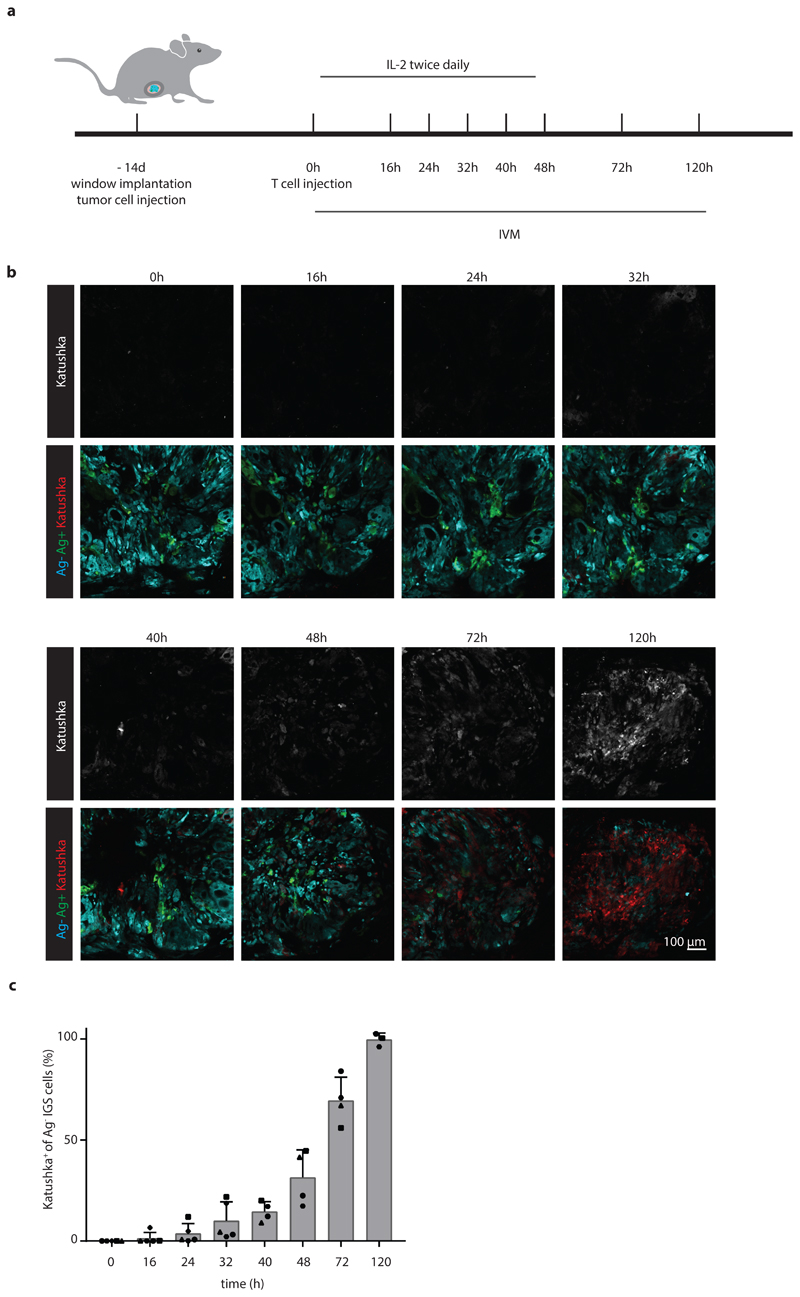
The above data demonstrate that a substantial fraction of bystander tumor cells responds to CD8+ T-cell-secreted IFNγ, but do not provide any spatiotemporal information on the spreading of this IFNγ response. To address this issue, we generated chimeric tumors that are located behind imaging windows, thereby allowing longitudinal in vivo analysis of IFNγ sensing (Fig. 3a). Subsequently, consecutive imaging sessions (n=5 mice for t=0, 16, 24, and 32 h, n=4 mice for t=40, 48, and 72 h, and n=3 mice for t=120 h) were performed of tumor areas that contained a low fraction of Ag+ tumor cells. During these repetitive intravital microscopy sessions, discrete areas with Katushka positive cells became apparent within 16h after T cell transfer. In the following period, areas with Katushka signal-positive cells increased in number and in size (Fig. 3b and c, Extended data Fig. 4b), and in mice imaged for the full 120h after T cell infusion, a large majority of bystander cells within the tumor had responded to IFNγ (Fig. 3b and c).
Figure 3. Kinetics of IFNγ sensing by bystander tumor cells.
a) Illustration of imaging window setup and experimental timeline. At the indicated time points in the 0h – 120h time window, intravital imaging of tumor lesions was performed. b) Sequential intravital 2-photon imaging of tumors consisting of 10% GFP+ Ag+ tumor cells (green) and 90% CFP+ IGS reporter bystander tumor cells (cyan) was initiated 14 days following injection of tumor cells (8 *106 cells total) into the mouse mammary gland. Upon IGS reporter activation, cells gain Katushka signal (white in upper panel, red in lower panel). A representative imaging series of a tumor region with Katushka reporter expression (top panel) and merge of GFP+Ag+ (green), CFP+Ag- (cyan) and Katushka reporter (red) (lower panel) signal is depicted over time. Scale bar is 100 mm. Data are representative of c. c) Quantification of the percentage of IGS Katushka+ cells in the Ag- cell population showing the mean plus SD over time. Symbols represent data from different animals (n=5 mice for time 0, 16, 24, and 32h; n=4 mice for 40, 48, and 72h; n=3 mice for 120, obtained in all independent experiments. IVM: intravital microscopy.
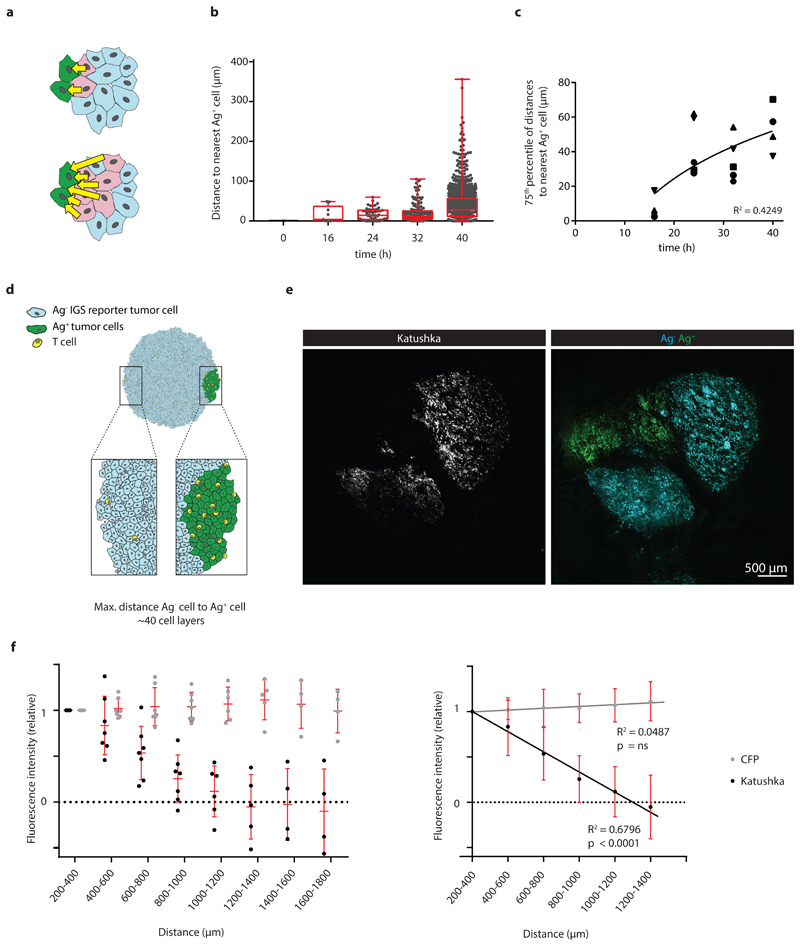
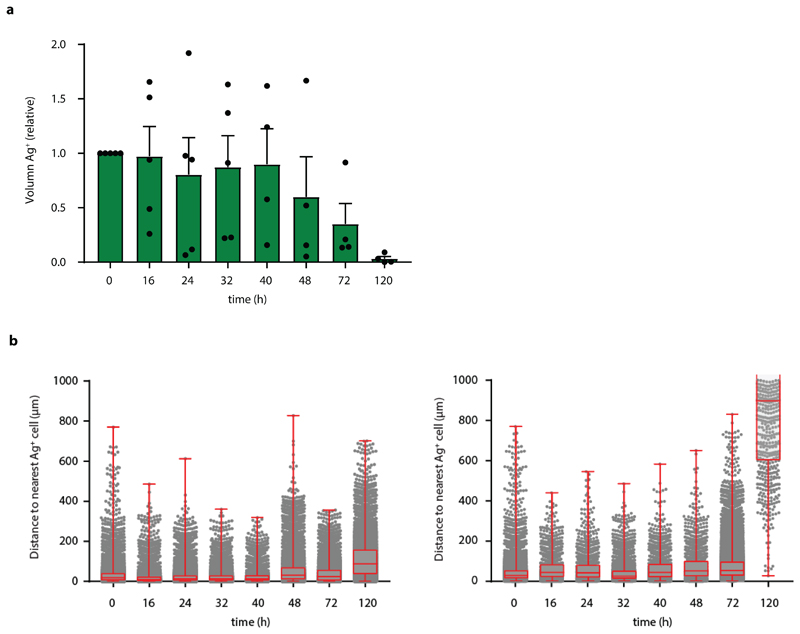
The observed increase of Katushka positive reporter cells at later time points could both be explained by an increased number of local regions of T cell activity, or by the gradual spreading of an IFNγ signal through the tumor mass. To understand whether the activity of IFNγ is progressively observed at larger distances from sites of antigen presentation, we measured the distance of each Katushka positive bystander cell to the nearest antigen-presenting tumor cell at different times post T cell transfer. Importantly, as antigen-positive tumor cells are expected to be cleared over time due to T cell-mediated killing, it was essential to focus this analysis on time points in which the average distance between antigen-positive tumor cells and all bystander tumor cells (i.e. irrespective of their Katushka expression) is constant. To determine this, we first measured the total volume of GFP+ Ag-positive cells in tumors over time, observing a substantial loss of GFP+ tumor area starting around 48 hours after T cell infusion (Extended data Fig. 5a). In line with this, the median distance between the entire pool of bystander tumor cells, irrespective of reporter expression, and antigen-positive tumor cells was stable during the first 40h after T cell injection (Extended data Fig. 5b), providing a window to measure the spreading of the IFNγ response up to that time. Notably, analysis of the distances between Katushka-positive bystander cells and the nearest antigen-expressing tumor cell within this time window revealed a pronounced increase over time that was reproducibly observed in different mice (Fig. 4a), with reporter-positive cells located up to 100-300 mm away from the nearest Ag-positive cell at the latest time point analyzed (representative graph, Fig. 4b and c).
Figure 4. Long distance spreading of CD8+ T cell derived IFNγ from sites of antigen presentation.
a) Cartoon depicting the distances (yellow arrows) between individual Katushka+ cells and the nearest Ag+ cell, as measured in b and c. b) Distance between Katushka+ reporter tumor cells and the closest GFP+ Ag+ tumor cell at the indicated time points for the imaging experiments shown in Fig. 3 are depicted in a boxplot presenting the minimum, 25th percentile, median, 75th percentile and the maximum. Data from a representative tumor are depicted, dots represent individual Katushka+ cells. For total sample size per timepoint see Source Data Fig 4. c) 75th percentile of the distances between Katushka+ cells and the closest Ag+ cell as a function of time, using data from n=5 mice obtained in all independent experiments. Symbols represent different mice, and a logarithmic regression analysis of the data is depicted (R2= 0.4249). d) Schematic representation of experimental setting in which large islands of Ag-positive tumor cells and IGS reporter Ag- bystander cells are spatially separated. e) Representative 2-photon confocal images of Katushka signal (left panel, white) in a tumor with spatially separated GFP+Ag+ (green) and CFP+Ag- IGS reporter cells (cyan) islands, obtained by sequential injection of Ag- and Ag+ cells. Scale bar is 500 mm. Note the spreading of the Katushka signal (white) far into the CFP-Ag- tumor area. f) Quantification of relative fluorescence intensity of Katushka (black) and CFP (grey) at the indicated distances from the Ag+ area. Mean fluorescence intensity was normalized to the mean intensity measured between 200-400 mm. Left panel: dots represent individual tumors, and mean and SD for n=7 mice are depicted, using data from two independent experiments. Right panel: regression line for data presented in the left panel, for signals above background. Note the significant decrease of Katushka signal proportional to the distance to the Ag+ area, p<0.00001 and R2=0.625, while CFP signal is unaltered, p=0.521 (ns) and R2=0.092. P-values determined by one-tailed F-test, testing if the slope is different from zero.
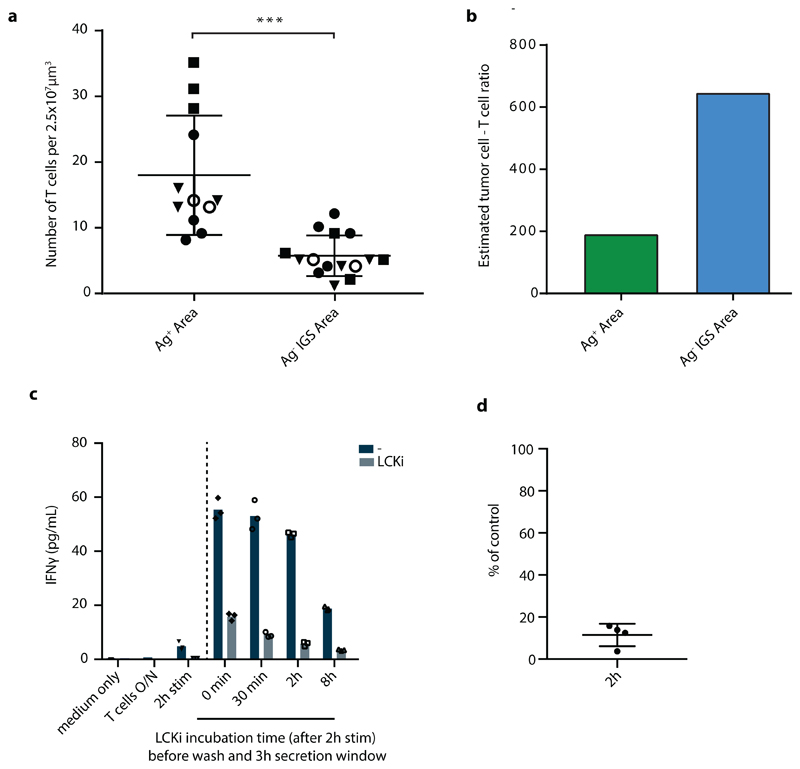
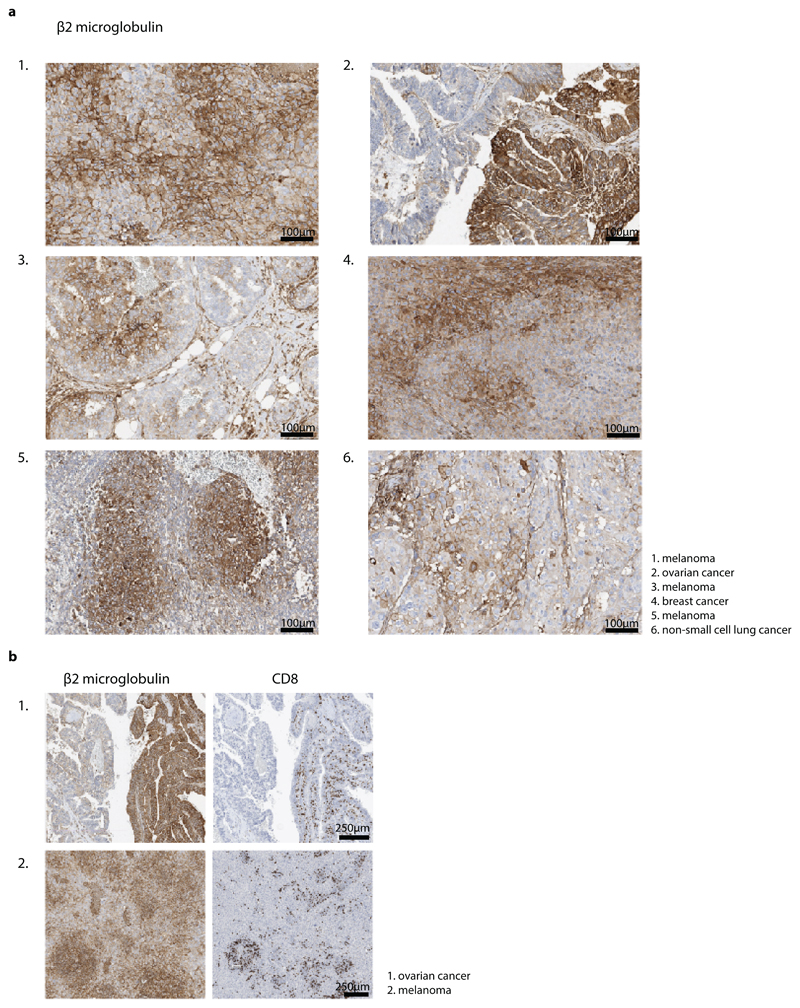
While the above data directly demonstrated how the IFNγ response in tumors can spread from sites of T cell activation (i.e. areas that harbor antigen-positive tumor cells), accurate long-range measurements of IFNγ sensing were precluded by the fact that the large majority of bystander cells is located within 100 mm from the nearest antigen-positive tumor cell (Extended data Fig. 3), providing little data to quantify spreading at greater distances. To be able to measure long-distance sensing of CD8+ T cell-derived IFNγ, we generated tumors that consist of large islands of antigen-positive cells and antigen-negative IGS reporter cells (Fig.4d), using matrigel-embedded Ag- IGS reporter cell spheres, that were then injected with a low number of antigen-positive cells (see Methods). After tumor outgrowth and Ag-specific T cell transfer, resulting tumors showed strictly defined antigen-negative and antigen-positive areas, with antigen-reactive CD8+ T cells locating preferentially to the antigen-positive areas of these tumors (representative tumor in Fig. 4e, Extended data Fig. 6a and b). This tumor setup resembles the islands of distinct tumor cell populations seen in human tumors as read out by β2m expression (representative images in Extended data Fig. 7,) with increased CD8+ T cell counts in the β2m+ areas (Extended data Fig. 7; discrete β2m+ and β2m- areas observed in 16/51 tumors analyzed). Strikingly, analysis of the Katushka reporter signal in the antigen-negative tumor lobe following T cell transfer revealed a pronounced IFNγ response that started at the interface between the antigen-positive and -negative tumor lobe and that extended more than 800 mm into bystander tumor territory (n=7 mice). In addition, whereas the CFP signal (present in all Ag- IGS cells, irrespective of reporter activation) was constant over distance, analysis of consecutive rings of bystander tumor tissue showed a gradual waning of Katushka reporter signal as a function of distance to the antigen-positive tumor compartment (Fig. 4e and f). Based on the observation that T cell density is higher in the antigen-positive tumor area than in the antigen-negative area, and the observation that T cells cease to produce IFNγ within hours after TCR signaling is terminated (with a reduction of more than 80% in the first 2 h, Extended data Fig. 6c and d), we interpret the observed gradient in Katushka signal to occur as a consequence of IFNγ diffusion. However, reporter activation by bystander cells that are approached by tumor-specific T cells that have left the antigen-positive area and that continue to secrete IFNγ remains a formal possibility. Most importantly, these data indicate that CD8+ T cell activation can induce activity of the IFNγR signaling pathway in cells that are located more than 30-40 cell layers away from the site of antigen-T cell interaction.
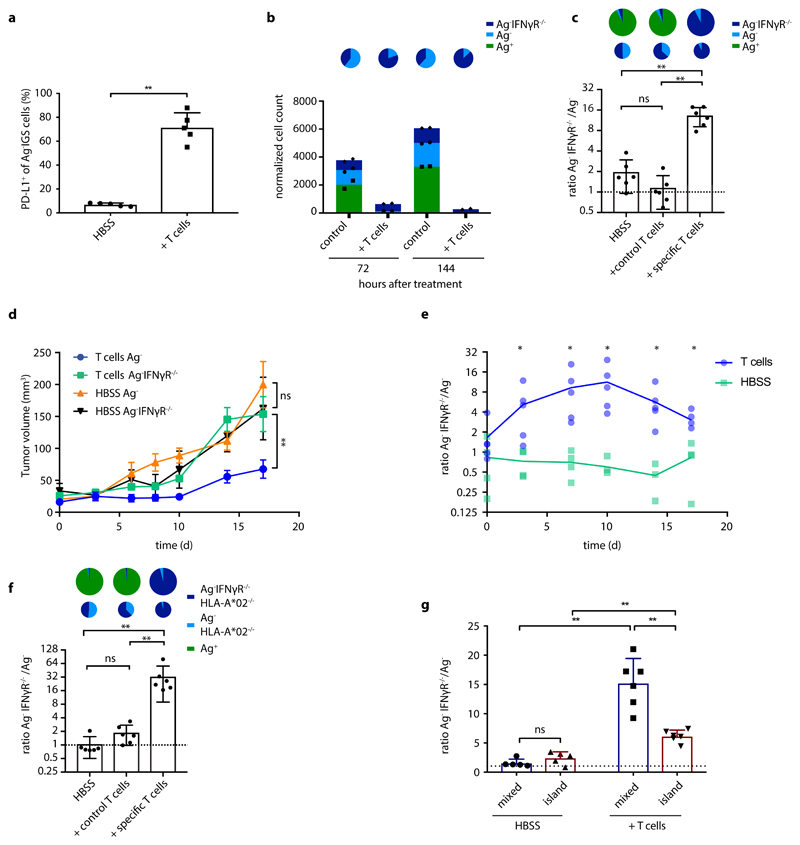
Long-range sensing of IFNγ may modulate the behavior of tumor cells in a negative way by inducing a ‘preemptive’ expression of immune checkpoints. Alternatively, sensing of T-cell-secreted IFNγ by bystander tumor cells may potentially also boost tumor control by inducing enhanced MHC expression, by inducing the expression of chemokines such as CXCL9 and 10, or by directly inducing tumor cell death. To explore the occurrence of preemptive immune checkpoint expression, we generated tumors in which Ag- bystander cells were intermingled with low numbers of Ag+ tumor cells and measured PD-L1 expression following T cell transfer. Importantly, following T cell treatment, a large fraction (71% +/- 12%) of bystander tumor cells demonstrated a prominent induction of PD-L1 expression (Fig. 5a; Extended data Fig 2d). In a second test for the functional consequences of long-range IFNγ sensing, we exploited the prior observation that OVCAR5 cells undergo cell death upon prolonged IFNγ exposure (Extended data Fig. 1d and e). In line with this, following in vitro coculture with a combination of Ag+ tumor cells and antigen-specific T cells, Ag- bystander tumor cells that were IFNγR proficient were selectively lost relative to Ag- bystander cells that lacked the IFNγ receptor (Fig. 5b, Extended data Fig. 8). Subsequently, we assessed whether IFNγ sensing can also form a selective disadvantage of bystander tumor cells in vivo. To this purpose, mice were inoculated with tumor cell mixtures that consist of antigen-positive tumor cells, and of two separate bystander tumor cell populations that were either IFNγR proficient or IFNγR deficient. Following tumor cell outgrowth, mice were either mock treated or received tumor specific T cells, and the relative numbers of the antigen expressing tumor cells and the two bystander tumor cell populations were compared. Consistent with expectations, treatment of mice with CDK4R>L-specific CD8+ T cells resulted in a major decrease in CDK4R>L neoantigen-positive tumor cells. Notably, while roughly equal numbers of IFNγR proficient and IFNγR deficient tumor cells were recovered in control-treated mice, an almost full depletion of IFNγR proficient bystander tumor cells was observed in tumors with an ongoing tumor-specific T cell response (Fig. 5c). In additional experiments, tumors that contained IFNγR proficient bystander cells were shown to display an impaired tumor growth after T cell treatment, as compared to tumors that contained IFNγR deficient bystander cells (Fig. 5d). Finally, direct analysis of the outgrowth of the bystander tumor cell compartment by bioluminescence demonstrated impaired outgrowth of IFNγR proficient bystander cells relative to IFNγR deficient bystander cells in the same animal in T cell-treated mice but not in control mice (Fig. 5e). To assess whether the observed deletion of antigen-negative tumor cells through IFNγR signaling could be due to antigen cross-presentation, we generated IFNγR proficient and deficient bystander cells that lack the HLA-A*02 heavy chain that forms the restriction element for the CDK4R>L neoantigen. Also in a setting in which bystander tumor cells both lack antigen and the relevant HLA class I allele, widespread IFNγR-dependent deletion of bystander tumor cells was observed after a T cell response was initiated (Fig. 5f). Impaired outgrowth of bystander tumor cells was both observed in a setting in which Ag+ tumor cells and bystander cells were intermingled or were separated into larger domains, but was more prominent in the former case (Fig. 5g). This suggests that IFNγ is most likely to exert a selective pressure on the bystander tumor cell compartment in an early phase of genetic diversification of tumor tissues, when tumor cell compartments that can and that cannot be recognized by T cells are still in close proximity.
Figure 5. Functional consequences of CD8+ T cell derived IFNγ.
a) NSG-β2m-/- mice injected subcutaneously with a mixture of 10% GFP+Ag+ cells and 90% CFP+ IGS reporter bystander OVCAR5 tumor cells (8 x 10⁶ total) were treated with HBSS (control) or with 5 x 10⁶ CDK4R>L-specific CD8+ T cells, and tumors were harvested at day 3 after treatment. Bar graphs depict mean percentage of PD-L1+ Ag- IGS cells plus SD from n=5 mice per group. Representative data from three independent experiments are depicted. Two-tailed Mann-Whitney U-tests was performed p=0.0079 (**) .b) A mixture of 50% GFP+Ag+ cells, 25% CFP+ bystander and 25% CFP+ Katushka+ IFNγR-/- bystander OVCAR5 tumor cells was cocultured with CDK4R>L-specific CD8+ T cells at a T cell - tumor cell ratio of 5:1, and cells were analyzed by flow cytometry at the indicated time points. Representative data of three independent experiments are depicted, symbols represent technical duplicates. Cell counts were normalized to counting beads. Pie chart representations above the bar graphs depict the ratio of bystander and IFNγR-/- bystander cells under the indicated conditions. c) GFP+ Ag+, CFP+ Ag- and CFP+ Katushka+Ag- IFNγR-/- OVCAR5 cells were mixed (80%-10%-10%) and 8 x 10⁶ cells were injected subcutaneously into NSG-β2m-/- mice. At day 7, mice were either treated with 5 x 10⁶ CDK4R>L-specific CD8+ T cells or control T cells, or received HBSS. At day 21 post treatment, tumors were harvested and the ratio between the indicated cell populations was determined by flow cytometry. Each dot represents one tumor, bar graphs show mean of the indicated groups plus SD, n=6 mice per group. Representative data of three independent experiments are depicted. p=0.0931 (ns); p= 0.0022 (**) d) NSG-β2m-/- mice were injected subcutaneously with 50% GFP+Ag+ and 50% CFP+Ag-Luc+ cells (8 x 10⁶ total) in one flank and 50% GFP+Ag+ and 50% CFP+Ag-IFNγR-/-Luc+ (8 x 10⁶ total) OVCAR5 cells in the other flank. At day 7, mice were treated with HBSS (control) or 5 x 10⁶ CDK4R>L-specific CD8+ T cells. Data represent mean tumor volume, error bars indicate SEM of biological replicates, n=4 mice for group HBSS Ag-IFNγR-/- n=5 mice for other groups. Two-tailed Mann-Whitney U-tests were performed for all timepoints, with significant differences from day 14 onwards. p=0.0047 (**); p=0.979 (ns). Representative data from three independent experiments are depicted. e) Growth of CFP+Ag-Luc+ and CFP+Ag-IFNγR-/-Luc+ cells was monitored by bioluminescence imaging from tumors described in d. Graph depicts the ratio of CFP+Ag-IFNγR-/-Luc+ to CFP+Ag-Luc+ photon flux/s measured in the same animal. Two-tailed Mann-Whitney U-tests were performed for each time point, p=0.0159 (*). f) As in c, but using CFP+Ag- and CFP+Ag-IFNγR-/- tumor cells that were deficient in HLA-A*02. Each dot represents one tumor, bar graphs represent mean of the indicated groups plus SD, n=5 mice per group. Representative data of two independent experiments are depicted. Two-tailed Mann-Whitney U-tests were performed for all statistical analyses, p= 0.064 (ns); p= 0.0022 (**). g) Mixed tumors consisting of intermingled GFP+Ag+, Ag- bystander cells and Ag-IFNγR deficient bystander cells, and island tumors in which GFP+Ag+ were separated from intermingled Ag- bystander cells and Ag-IFNγR deficient bystander cells were generated. Ratio between CFP+Ag-IFNγR-/- and CFP+Ag- in both spatial arrangements were determined by flow cytometry 14 days after HBSS (control) or T cell treatment. Bar graph depicts mean of the indicated groups plus SD, n=5-6 mice per group. Representative data of two independent experiments are depicted. p= 0.222 (ns); p< 0.005 (**)
Discussion
Exposure to IFNγ can influence cell behavior in a number of ways, and can for instance inhibit tumor cell growth through induction of apoptosis37, senescence15 and ferroptosis38. To our knowledge, the current data provide the first evidence that CD8+ T cell activity in tumors can modulate the behavior of a large fraction of the tumor mass, even when only a small percentage of the tumor cells in that lesion can be recognized by CD8+ T cells, and even when tumor-antigen specific T cells are present at low frequencies (T cell: Ag+-target ratio of approx. 1:200, Extended data Fig. 6). Furthermore, using tumors that contain large substructures of antigen-positive and negative tumor cells, we document that IFNγ sensing can occur at long distances (>800 mm, equivalent to 30-40 cell layers) from sites of antigen encounter, a substantially larger distance than, for instance, the maximal spread of oxygen derived from capillary blood vessels in tumor tissue (4-8 cell layers)39. The most likely explanation for this widespread IFNγ sensing would be substantial diffusion of IFNγ away from the immunological synapse after T cell activation, but a contribution of T cells that continue to secrete IFNγ into the surrounding space after disengagement from the antigen expressing tumor cells remains a possibility. Of note exposure of OVCAR5 tumor cells to IFNγ does not induce an increase in IFNg transcript levels (data not shown), ruling out a feed forward loop as an underlying mechanism for the observed signal spreading.
With respect to the functional consequences of the observed IFNγ sensing, we would like to highlight three things. First, the current data strongly indicate that preemptive resistance of tumor cells through IFNγ-driven expression of inhibitory molecules such as PD-L1, TNFRSF14 and Galectin-940 can occur well before the actual arrival of CD8+ T cells in a tumor substructure. Second, for those tumors that are sensitive to IFNγ-mediated killing, growth arrest or senescence, the observed bystander IFNγ sensing may be considered a fail-safe mechanism in case of antigen loss. In other words, tumor cells that have lost relevant antigens, and are therefore invisible to T cells, may still be cleared by means of “back-up” cytokine secretion by tumor-specific T cells. Third, besides acting on tumor cells, the widespread effects of IFNγ can be expected to influence other cell types present in the TME such as the T cells themselves, potentially inducing apoptosis of activated tumor antigen-specific T cell clones that express high levels of the IFNγ receptor41. In conclusion, the ultimate outcome of the observed long-range sensing of IFNγ will be determined by factors such as the antigen presentation potential, expression of inhibitory molecules, and immune infiltrate of individual tumors42, and inhibition of this sensing could be attractive in certain setting. From a more conceptual point of view, with our increasing understanding of the cytokine and chemokine output of tumor-antigen specific CD8+ T cells 43, 44,45, 46, it will be of interest to understand the relative spreading of molecules such as IFNγ, TNFα, and CXCL13, but also to understand how the joint sensing of these molecules collectively modulates the TME upon spontaneous or therapy-induced T cell activation.
Methods
IGS Reporter generation and viral vectors
To generate the IGS reporter vector, four tandem repeats of the Gamma interferon activation site (GAS) flanked by enhancer elements (5’-agtttcatattactctaaatc-3’, GAS consensus sequences underlined47, enhancer elements derived from GAS cis-Reporting Systems, (Agilent #219093)) were cloned in front of the coding sequences of the Katushka fluorescent protein (TurboFP635, Evrogen), a P2A element, and the CreERT2 protein (CreERT2 expression was not utilized in this study), into a variant of the lentiviral pCDH-puromycin vector (Addgene #2082) in which the CMV promoter had been removed. To generate the CDK4R>L-GFP vector, a sequence encoding the patient-derived mutant Cyclin-dependent kinase epitope (CDK4R>L, ALDPHSGHFV), followed by an IRES and green fluorescent protein (GFP) sequence, was inserted into the pMX-retroviral vector (Addgene #3674). To generate the CFP expressing vector, the CFP sequence was inserted into the pMX-retroviral vector. To generate the pCDH-Katushka vector, the Katushka sequence was inserted into the lentiviral PCDH-EF1a vector (Addgene #72266).
For bioluminescence experiments, the lentiviral pLKO-1-UbC-fire-fly-luciferase-blast was used. As TCR expression vectors, retroviral pMP71 vectors encoding either the CDK4R>L specific TCR (clone 17, NKI12)48, the CDK4R>L specific TCR followed by an IRES-Puro-p2A-mOrange2, or the MART-1-specific 1D3 TCR49 were utilized. The integrity of the indicated vectors was verified by Sanger sequencing.
Tumor cell culture and viral transductions
Human ovarian carcinoma OVCAR5 cells (F. Scheeren, The Netherlands Cancer Institute, The Netherlands) and human mammary breast cancer MDA-MB-231 cells (ATCC, HTB-26), were cultured at 37°C/ 5% CO2 in IMDM (Gibco) supplemented with 10% FCS (Sigma), 100 U/ml penicillin (Roche), 100 mg/ml streptomycin (Roche), and GlutaMax (Gibco, 1x). For OVCAR5, cell identity was validated by short tandem repeat analysis.
For retroviral transduction, FLYRD18 packaging cells (ECACC no. 95091902) were plated into 6 well plate dishes at 0.5×10⁶ cells per well. After 24 h, cells were transfected with 3 mg of one of the above indicated retroviral vectors using X-tremeGENE (Roche), according to the manufacturer’s protocol. After 48 h, virus supernatant was harvested, filtered through a 0.45-μm filter and added to tumor cells in the presence of 8 mg/ml polybrene (Sigma) at a 1:1 medium to viral supernatant ratio.
For lentiviral transductions, HEK293T cells (ATCC, CRL-3216) were plated at 3x10⁶ cells per 10 cm dish. After 24 h, cells were transfected with 8 mg of one of the above indicated lentiviral plasmids, plus the lentiviral packaging and envelope plasmids psPAX (Addgene #12260) and pMD2.G (Addgene #12259) (3 mg each) using X-tremeGENE (Roche), according to the manufacturer’s protocol. 2-3 days after transfection, supernatant of transfected cells was harvested, filtered through 0.45-mm filters, and added to OVCAR5 or MDA-MB-231 cells at a 1:1 medium to viral supernatant ratio. Antigen-positive GFP+ OVCAR5 or MDA-MB-231 cells were generated by retroviral transduction with the pMX-CDK4R>L-GFP vector (see above). Antigen-negative CFP+ cells were generated by retroviral transduction with the pMX-CFP vector (see above). After transduction, indicated cell populations were sorted on a FACSaria Fusion (BD biosciences) to >90% purity. Ag-CFP+IGS reporter cells were subsequently generated by lentiviral transduction of Ag- CFP+ cells with IGS reporter virus (see above), followed by selection of the transduced cells in the presence of 2 mg/mL puromycin (Sigma). Ag- CFP+ Luc+ and Ag- CFP+ IFNγR-/- Luc+ were generated by lentiviral transduction of Ag- CFP+ cells or Ag- CFP+ IFNγR-/- with the pLKO-luciferase vector (see above).
Generation of knockout cell lines
Ag- CFP+ IFNγR-/- cells, Ag- CFP+ HLA-A-/- cells and Ag-CFP+ IFNγR-/-HLA-A-/- cells were generated using the CRISPR–Cas9 system, by transfection of cells with a pLentiCRISPR v.2 vector (Addgene 52961) encoding the sgRNA sequence ACATGAACCCTATCGTATAT (IFNγR1) or GCCAGTCACAGACTGACCGAG (HLA-A) using X-tremeGENE (Roche), according to the manufacturer’s protocol. 48h after transfection, cells were selected with 2 mg/ml puromycin (Sigma) for one day, and cells negative for IFNγR1/HLA-A*02 were isolated on a FACSaria Fusion (BD biosciences) to >90% purity. Ag-CFP+ IFNγR-/- IGS reporter cells were generated by transduction of Ag-CFP+ IFNγR-/- cells with IGS reporter virus (see above). To distinguish between IFNγR proficient and deficient cells, IFNγR deficient tumor cells were subsequently transduced with the pCDH-Katushka vector and isolated by cell sorting.
T cell culture and T cell transductions
Retroviral transduction of T cells was performed as described previously50. In brief, FLYRD18 packaging cells were plated onto 6 well plates at 0.5×10⁶ cells per well. After 24 h, cells were transfected with 3 mg of pMP71-CDK4R>L TCR, pMP71-CDK4R>L TCR-mOrange2, or pMP71-1D3 TCR (see above), using X-tremeGENE (Roche), according to the manufacturer’s protocol. CD8+ T cells were isolated from peripheral blood mononuclear cells (PBMCs) of healthy donors (Sanquin, the Netherlands) using the CD8+ T Cell Isolation Kit (Miltenyi Biotec). Isolated CD8+ T cells were seeded in 24-well plates at a density of 1 × 10⁶ cells per well, and stimulated with CD3/CD28 Dynabeads (Life Technologies) in a 1:1 mix of Aim 5 (Gibco) and RPMI medium (Gibco), supplemented with 10% AB serum (Life Technologies), 100 U/ml penicillin (Roche), 100 mg/ml streptomycin (Roche), 60 U/ml IL-2 (Proleukin, Novartis), and 10 ng/ml IL-15 (Peprotech). After 48 h, virus-containing supernatants were collected and centrifuged to remove cellular debris. Supernatants were subsequently transferred to Retronectin (Takara)-coated 24-well plates, and plates were centrifuged at 430g for 90 min at 4°C. After centrifugation, virus supernatants were removed and replaced with 5 × 10⁵ activated CD8+ T cells per well in medium supplemented with 60 U/ml IL-2 (Proleukin, Novartis) and 10 ng/ml IL-15 (Peprotech). After 72 h, cells were stained with an antibody specific for the mouse TCRb constant domain that is present in all TCR sequences used (see below), and transduction efficiency was determined by flow cytometry. Transduced CD8+ T cells were grown for 3 weeks, receiving fresh medium and cytokines every 3-4 days until used in functional assays or cryopreservation. Following cryopreservation, transduced CD8+ T cells were thawed and rested for one day in 50:50 medium supplemented with 60 U/ml IL-2 (Proleukin, Novartis) at 37°C/ 5% CO2 before experimental use.
In vitro characterization of IGS reporter cells and T cell-mediated tumor cell killing
Ag- CFP+ IGS reporter tumor cells proficient or deficient for the IFNγR, were plated at 20,000 cells/well in 48-well plates and either received the indicated concentrations of human IFNα (Thermo Fisher Scientific) or human IFNγ (Invitrogen). At the indicated time points, cells were harvested, stained with IR-Dye (Invitrogen) and analyzed by flow cytometry. To measure T cell-mediated death of bystander tumor cells, a mixture of GFP+ Ag+, CFP+ Ag- IFNγR proficient and CFP+ Ag- IFNγR deficient OVCAR5 cells was plated at 100,000 cells/well in 6 well plates at a 2:1:1 ratio, and cells were then incubated with either HBSS (Gibco) or CDK4R>L-specific CD8+ T cells in HBSS at a 5:1 T cell: (total) tumor cell ratio. Cell death and total cell counts were analysed at day 3 after treatment by IR-Dye (Invitrogen) staining, and subsequent flow cytometry using AccuCountBlank 15.2 mm beads (Spherotech).
LCK inhibitor experiments
Isolated CD8+ T cells from PBMCs (see above) were activated in 96-well plates coated with 5mg/ml plate bound Ultra-LEAF™ anti-CD3 Ab (OKT3, Biolegend) and 2mg/ml plate bound Ultra-LEAF™ anti-CD28 Ab (CD28.2, Biolegend) at a density of 1 × 10⁵ cells per well, in a 1:1 mix of Aim 5 (Gibco) and RPMI medium (Gibco), supplemented with 10% AB serum (Life Technologies), 100 U/ml penicillin (Roche), 100 mg/ml streptomycin (Roche). After 2 h, cells were either left untreated or were treated with 5 nM LCKi inhibitor (Merck Milipore) for the indicated time periods. Cells were subsequently washed 3 times with medium to remove already secreted IFNγ, and cells were then cultured for 3h in 40 ml fresh control medium or fresh medium containing 5 nM LCK inhibitor. Subsequently, supernatants were collected and IFNγ concentrations were determined using the BD™ Cytometric Bead Array (CBA) Human Th1/Th2/Th17 Cytokine Kit, according to the manufacturer’s protocol.
Mice
NOD-scid Il2rynullB2mnull mice were obtained from Jackson Laboratories. All animal experiments were approved by the Animal Welfare Committee of the NKI, in accordance with national guidelines. All animals were maintained in the animal department of The Netherlands Cancer Institute (NKI), housed in individually ventilated cage (IVC) systems under specific pathogen-free conditions and received food and water ad libitum. Mice were used at 8 to 26 weeks of age.
In vivo tumor experiments
Mixed tumors
8x10⁶ OVCAR5 cells or 5x10⁵ MDA-MB-231 cells were injected subcutaneously into the flank of NSG-b2 m-/- mice in 50 ml HBSS (Gibco) and 50 ml matrigel (Corning), using the indicated mixtures of tumor cell variants.
Segmented tumors
First the major contributing cell population was injected subcutaneously into the flank of NSG-β2m-/- mice in 40 ml HBSS (Gibco) plus 40 ml matrigel (Corning). Subsequently, mice were placed on a 37°C heating pad for 15 min, while kept under a 2% isoflurane (Pharmachemie BV) /compressed air mixture. The minor cell compartment was then injected into the solid Matrigel sphere in 10 ml HBSS (Gibco) plus 10 ml matrigel (Corning), using a Veo™ insulin syringe with a BD Ultra-Fine™ 6mm x 31G needle (BD). Indicated mixtures of tumor cell variants were injected, adding up to a total of 8x10⁶ tumor cells per tumor.
Mixed tumors for intravital imaging
First, a mammary imaging window was surgically inserted into the skin of female mice under aseptic conditions, on top of the 4th mammary gland (for more details, see50). Subsequently, 8x 10⁶ tumor cells were injected into the fat pad of the 4th mammary gland, while animals were sedated with a 2% isoflurane/compressed air mixture. Thirty minutes before and 24h after surgery, mice were treated with buprenorphine (0.01 mg/ kg, Buprecare, Multidosis-Astfarma), and following surgery mice were kept at 37°C until fully recovered.
At day 7 (for tumors in the flank) or day 14 (for tumors in the mammary fat pad) after tumor inoculation, tumor bearing mice received an intravenous injection of either 200 ml HBSS (Gibco) or 5x10⁶ tumor-specific (mOrange2) CDK4R>L TCR transduced or control 1D3 TCR transduced CD8+ T cells in 200 ml HBSS. On day 0, 1 and 2, mice received injections of 7.2x10⁵ IU IL-2 (Proleukin, Novartis) dissolved in 200 ml HBSS (Gibco), twice daily, with an interval of 6-12 hours between injections.
At the indicated times after T cell transfer, tumors were intravitally imaged (see below), or mice were sacrificed and tumors were harvested. Harvested tumors were either imaged (see below) or manually minced and enzymatically digested in RPMI medium (Gibco) supplemented with 200 U/mL collagenase type IV (Gibco) and 200 mg/mL DNaseI (Sigma) at 37°C for 30 min under continuous shaking. Subsequently, cell digests were filtered through a 70 mm strainer (Falcon) and single cell suspensions were stained with IR-Dye (Invitrogen) and anti-CD8 antibody, and analyzed by flow cytometry.
Tumor volume measurement and bioluminescence imaging
Kinetics of tumor growth were analyzed twice a week by caliper measurements. Bioluminescence imaging was performed immediately before treatment and twice per week after. To perform bioluminescence imaging, mice were injected with 150mg/kg D-Luciferin (Promega) and, after a 5 min incubation while being kept under isoflurane inhalation anesthesia, were imaged in an IVIS spectrum 120V, using 8x8 binning and exposure times ranging from 1s to 15s. Tumor growth kinetics were subsequently quantified using the Living Image software 4.5.5 (PerkinElmer) and photon flux/s was determined by measuring unsaturated ROIs followed by background subtraction.
Flow cytometry
The following antibodies were used for flow cytometry: anti-human CD8, (clone RPA-T8; BD biosciences), anti-human IFNγR (CD119, Clone GIR-208; eBioscience), anti-human HLA-A*02 (clone BB7.2; BD Biosciences), anti-mouse TCRb constant domain (clone H57-597; BD Biosciences) and anti-human PD-L1 (CD274, clone MIH1, eBioscience). Cell surface expression of indicated markers was assessed by staining of cells with fluorochrome-labeled antibodies in FACS buffer (0.5% w/v bovine serum albumin (Fisher Scientific) in PBS) for 20–30 min at 4 °C, while protected from light. After incubation, cells were washed twice with FACS buffer before resuspension in FACS buffer for analysis. IR-Dye (Invitrogen) was used to allow for live cell selection.
Multiday intravital imaging
For each imaging session, mice were sedated using isoflurane inhalation anesthesia (~1.0% isoflurane/ compressed air mixture) and received 200 ml sterile PBS by subcutaneous injection. Mice were then placed in a custom designed imaging box on the microscope while kept under constant anesthesia, with the imaging box and the microscope adjusted to 34.5°C using a climate chamber. Following each imaging session, mice were kept at 37°C until they had fully recovered from anesthesia. Intravital images were acquired using an inverted Leica SP8 Dive system (Mannheim, Germany) with a MaiTai eHP DeepSee laser (Spectra-Physics) and Insight (Spectra-Physics). Three-dimensional tile scans of the full visible tumor area were acquired with 10 mm Z-steps. The microscope was equipped with 4 HyD-RLD detectors: CFP, and mOrange2 were simultaneously excited at 819 nm (Mai Tai) and 1100 nm (Insight) and detected at 454-486 nm for CFP and 562-585 nm for mOrange2, together with second harmonic generation (Collagen I, stroma) at 406-416 nm. In a second sequential scan, GFP and Katushka were simultaneously excited at 960 nm (Mai Tai) and 1191 nm (Insight) and detected at 499-518 nm for GFP and 619-683 nm for Katushka. All images were collected at 12 bit and acquired with a 25x water immersion objective with a free working distance of 2.40 mm (HC FLUOTAR L 25x/0.95 W VISIR 0.17).
Post-processing and analysis of intravital microscopy data
For analysis, three-dimensional tile scans acquired by intravital microscopy were imported in Imaris (Bitplane) software. To annotate cells, 3D binary images were created from the GFP (i.e. Ag+), CFP (i.e. Ag-), and Katushka (i.e. IGS) channels based on a threshold that was optimized for each time point, channel, and experiment, and split into cells with a diameter of 12.2 mm. Autofluorescence signal that was present in each channel was excluded from the analysis. For each signal, the total volume (as a measure of the number of cells) was determined. In addition, for each Ag- cell and Katushka+ Ag- cell, the distance to the nearest Ag+ neighbor was calculated using the distance transformation and intensity center functions.
Imaging and analysis of segmented tumors
Tumors were isolated from mice and placed between two coverslips. From these freshly isolated tumors, three-dimensional tile scan images were acquired by 2 photon confocal microscopy (same settings as described in multiday intravital microscopy). Using a custom-made ImageJ v1.52i macro (available upon request), the mean intensity of CFP and Katushka signal was measured as a function of the distance to the nearest Ag+ area. In brief: binary images were created from the GFP (i.e. Ag+) and CFP (i.e. Ag-) channels based on a threshold. The binary image from the GFP channel was dilated with steps of 200 mm to create bins of ROIs at increasing distances from Ag+ areas. Next, the ROIs at various distances were combined with the binary image of the CFP channel with an AND function. For those ROIs at different distances from the Ag+ area with an area larger than 4x 104 mm2, the mean intensity of CFP and Katushka signal in the original image was determined, and the obtained mean intensities were corrected for background signal as measured in the GFP area. In order to be able to compare data between experiments, the mean signal intensities per region of interest were normalized to the mean intensity measured in the ROI at 200-400 mm distance from Ag+ area. Analysis was done on multiple Z-slices per mouse, and mean signal intensity per distance bin was averaged per mouse.
T cell quantification
The number of mOrange2+ T cells was quantified in three-dimensional tile scans (500 mm x 500 µm x 100 mm) in the Ag+ and Ag- area of segmented tumors by manual counting using ImageJ v1.52i. The number of tumor cells was estimated by dividing tumor volume by the volume of a spherical tumor cell. The average volume of spherical tumor cells was determined by measuring the diameter of 50 cancer cells, yielding a value of 24 mm.
Human tumor immunohistochemistry
Human tumor tissue was obtained from 51 patients (no data on specific patient characteristics) in accordance with national guidelines, following opt-out procedure and after approval by the local medical ethical committee (institutional review board (IRB) of The Netherlands Cancer Institute, Antoni van Leeuwenhoek hospital (NKI-AVL)). Tumor tissue was collected from surgical specimens after macroscopic examination of the tissue by a pathologist. For each specimen, a fragment was formalin-fixed and paraffin embedded (FFPE) for histology. 3 mm sections were cut from FFPE tumor material and slides were stained with anti-β2m (polyclonal, DAKO / Agilent) or anti-CD8 (clone C8/144B, DAKO / Agilent) antibodies. Slides were counterstained with Hematoxylin and Bluing Reagent (Ventana Medical Systems). All slides were scanned on the Aperio Scanscope, uploaded on Slide Score (https://www.slidescore.com/) and manually assessed for β2m and CD8 expression.
Statistics and Reproducibility
All repeated independent experiments showed similar results. Statistical analyses were performed in Prism (GraphPad). Two-tailed Mann-Whitney U-tests and a two-tailed unpaired t-test with normality test were used. For all box-plots, center-line represents the median, box limits represent upper and lower quantiles and whiskers represent min. and max. values. No statistical method was used to predetermine sample sizes. In the analysis of Figure 4b and c, areas smaller than 4*10^4 mm2 were excluded from analysis due to the very small numbers of cells present, and therefore high variability in the measurements. No further data were excluded from the analyses. Treatment of tumor bearing mice (controls/ T cells) was randomized. Intravital microscopy analysis was performed blinded, as such that the person performing the analysis did not know the time points corresponding to the data. Tumor analysis by flow cytometry was blinded with the person performing the analysis not knowing the treatments given.
Reporting Summary
Further information on research design is available in the Nature Research Reporting Summary linked to this article.
Extended Data
Extended Data Fig. 1. In vitro IGS reporter cell characteristics.
a) Median Katushka fluorescence intensity of IGS reporter-modified CFP+ OVCAR5 cells upon incubation with recombinant IFNγ under the indicated conditions. Bar graph shows mean of n=3 technical replicates, representative data of two independent experiments are depicted. b) CFP+ IGS reporter modified OVCAR5 cells proficient or deficient for the IFNγR were incubated for 48h with the indicated concentrations of recombinant IFNγ or IFNα and Katushka expression was analyzed by flow cytometry. Bar graphs show mean of technical duplicates data obtained from one experiment. c) Percentage IR-Dye positive IGS reporter-modified CFP+ OVCAR5 cells upon incubation with recombinant IFNγ under the indicated conditions. Bar graph shows mean of n=3 technical replicates. Representative data of two independent experiments are depicted. d) Percentage of IR-Dye positive Ag-CFP+ or Ag-IFNγR-/- OVCAR5 cells after 72h incubation with 100 ng/mL IFNγ. Bar graph shows mean of n=3 technical replicates. Representative data of three independent experiments are depicted.
Extended Data Fig. 2. IFNγ-induced IGS reporter and PD-L1 expression in MDA-MB-231 cells.
a) Median Katushka fluorescence intensity of IGS reporter-modified CFP+ MDA-MB-231 cells upon incubation with recombinant IFNγ under the indicated conditions. Bar graph shows mean of n=3 technical replicates. Representative data from two independent experiments are depicted. b) Median fluorescence intensity of PD-L1 staining as a function of median Katushka fluorescence intensity of CFP+Ag- IGS MDA-MB-231 reporter cells incubated for 24h with recombinant IFNγ under the indicated conditions. Plot depicts representative data three technical replicates of two independent experiments. c) 20% GFP+ Ag+ cells and 80% CFP+ IGS reporter bystander MDA-MB-231 tumor cells (5 x 10⁵ total) were subcutaneously injected in NSG-β2m-/- mice. Mice were treated with HBSS (control), 5 x 10⁶ control CD8+ T cells or with 5 x 10⁶ CDK4R>L-specific CD8+ T cells, and tumors were harvested at day 3 after treatment. Bar graphs depicting mean percentage plus SD of Katushka+ reporter cells in control and tumor-specific T cell treated mice, n=5 mice per group. Representative data of two independent experiments are depicted. Two tailed Mann-Whitney U test was performed, with: p= 0.3095 (ns); p= 0.0317 (*); p= 0.0079 (**). d) Percentage of PD-L1-expressing cells of IGS reporter-modified CFP+ MDA-MB-231 cells from tumors as described in c. Bar graphs depict mean percentage of PD-L1 positive Ag- IGS cells plus SD, n=5 mice per group. Representative data of n=2 independent experiments are depicted. Two tailed Mann-Whitney U test was performed, with: p> 0.9999 (ns); p= 0.0317 (*); p= 0.0079 (**).
Extended Data Fig. 3. Distance from Ag- IGS cells to the nearest Ag+ cell upon tumor cell co-injection.
Analysis of the distance between Ag- IGS tumor cells and the nearest Ag+ tumor cell for the imaging experiments depicted in Fig. 3. a) Representative image of a tumor with intermingled Ag- and Ag+IGS cells. Scale bar is 100 mm b) Plots show the min., max., and mean of 25th and 75th percentile plus the median for n=4 mice. c) Percentage of Ag-IGS reporter cells in the indicated distance bins to the nearest Ag+ cell, depicted mean plus SD for n=4 mice. Data obtained from three independent experiments.
Extended Data Fig. 4. CD8+ T cell dependent Katushka signaling in IGS reporter cells in vivo.
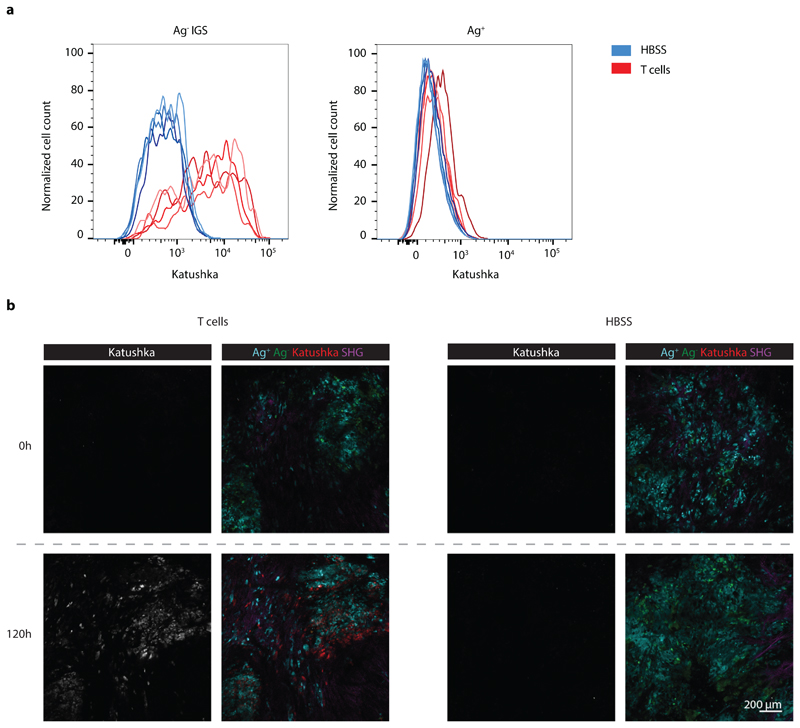
a) Flow cytometric analysis of Katushka expression in CFP+ IGS reporter (left panel) and GFP+ Ag+ (right panel) cells derived from mixed tumors described in Fig. 2b. Data from mice treated with HBSS are depicted in blue, data from mice treated with CDK4R>L-specific CD8+ T cells are depicted in red, n=4 mice per condition, data obtained from one experiment. b) Representative images of tumors before and 120h after injection of CDK4R>L-specific CD8+ T cells (left panel, three independent experiments with n=1 mouse each) or HBSS (right panel, two independent experiments with n=1 mouse each), for the imaging experiments described in Fig. 3. SHG: Second-harmonic generation. Scale bar is 200 mm.
Extended Data Fig. 5. Analysis of T cell mediated loss of Ag-presenting tumor cells over time.
a) Relative GFP+ volume in tumors from imaging experiments described in Fig. 2 quantified over time. Mean and SEM are depicted for n=5 mice (n=5 mice for time 0, 16, 24, and 32 h; n=4 for 40, 48, and 72 h; n=3 for 120 h, from data obtained in all independent experiments. b) The distance between CFP+ bystander tumor cells and the closest GFP+ Ag+ tumor cell was determined at indicated time points from tumors described in Fig. 2 for n=2 mice. Data are obtained from two independent experiments, boxplot presenting the minimum, 25th percentile, median, 75th percentile and the maximum For total sample size per timepoint see Source Data ED_Fig5_source table.
Extended Data Fig. 6. CD8+ T cell quantification in Ag+ and Ag- IGS reporter tumor areas.
a) Quantification of mOrange2+ CD8+ T cells in tumors with spatially separated GFP+Ag+ (green) and CFP+Ag- IGS reporter cell (cyan) islands obtained by sequential injection, as described in Fig. 4d and e. Number of mOrange2+ T cells was determined in multiple three-dimensional stacks of 2.5*107 mm3 in either Ag+ or Ag- areas. Symbols represent individual mice, and mean and SD for n=4 mice are depicted, obtained from two independent experiments. Normal distribution was confirmed by D'Agostino and Pearson omnibus normality test. Two tailed unpaired t-tests were performed, p=0.0003 (***). b) Estimate of the ratio of tumor cells to T cells in Ag+ and Ag- areas under the assumption that the diameter of an average tumor cell is 24 mm. c) Purified CD8+ T cells were activated with plate-bound anti-CD3/anti-CD28 antibodies for 2h. Subsequently, cells were either left untreated or were treated with 5nM LCKi inhibitor for the indicated times. Cells were washed to remove previously secreted IFNγ, and fresh control medium or medium containing 5nM LCK inhibitor was added to the cells. After 3h incubation, supernatants were collected and IFNγ concentrations were analysed. Bar graph shows mean IFNγ concentrations of n=3 technical replicates. Representative data of four independent experiments are depicted. d) As in c, depicting the IFNγ concentration in supernatants obtained from 2h LCK inhibitor treated cell cultures as a percentage of IFNγ concentration in control, non treated cell cultures. Dots represent four independent experiments, using different T cell donors in each experiment.
Extended Data Fig. 7. Distinct β2m positive and negative areas in human cancers.
a) Immunohistochemical staining of β2m and b) β2m and CD8 proteins on FFPE tissue of indicated human tumors. Heterogeneous β2m signal was observed in 16/51 tumors analyzed, one representative slide per tumor (obtained from resection material) was assessed and representative images are depicted in a. a. Scale bars are 100 mm. Note that CD8+ T cells in tumors predominantly localize to β2m high regions, representative images are depicted in b. Scale bars are 250 mm.
Extended Data Fig. 8. CD8+ T cell mediated killing of bystander OVCAR5 tumor cells.
A mixture of GFP+ Ag+, CFP+ Ag- IFNγR proficient and CFP+ Ag- IFNγR deficient OVCAR5 cells (2:1:1 ratio) was treated with CDK4R>L-specific CD8+ T cells at a 2:1 T cell: tumor cell ratio, or left untreated, and cell survival was analyzed by staining with IR-Dye and subsequent flow cytometry. a) Representative plots depicting the percentage of IR-Dye+ cells for the indicated groups. b) Quantification of a, bar graph shows mean of n=3 technical replicates. Representative data of two independent experiments are depicted.
Acknowledgements
We would like to thank E. Beerling, M. Mertz, B. van den Broek, L. Fanchi, R. Mezzadra, D. Peters, A. Broeks and staff at the NKI animal facility, flow cytometry facility, bioimaging facility and Molecular Pathology & Biobanking facility for technical support and input, and members of the Schumacher and van Rheenen laboratories for discussions. This work was supported by a Boehringer Ingelheim Fonds PhD Fellowhip (to M.E.H), a Swiss National Science Foundation APM fellowship (P300PB_177881) (to D.S.T.), ERC CoG Cancer-recurrence (648804), Cancer Genomics Netherlands, and the Doctor Josef Steiner Foundation (to J.v.R.), and ERC AdG SENSIT (to T.N.S.).
Footnotes
Data availability statement
Statistical source data for all figures and extended data figures including all independent repeats are provided.
All other data supporting the findings of this study are available from the corresponding author upon reasonable request.
Author information
Mirjam E Hoekstra and Laura Bornes contributed equally to this work.
Author Contributions
M.E.H., L.B., D.P. and I.N.P performed experiments and analyzed data. L.B. performed multiphoton imaging, F.E.D. and M.E.H designed and tested the IGS reporter. L.B. and M.E.H designed imaging analyses. M.E.H. and M.T performed Lcki experiments. D.S.T. provided and analyzed human tumor samples. M.E.H, L.B., F.E.D., J.v.R. and T.N.S. contributed to experimental design. M.E.H., L.B., J.v.R. and T.N.S. prepared the manuscript with input of all co-authors.
Competing interests
The authors declare no competing financial interests.
References
- 1.Durgeau A, Virk Y, Corgnac S, Mami-Chouaib F. Recent Advances in Targeting CD8 T-Cell Immunity for More Effective Cancer Immunotherapy. Front Immunol. 2018;9:14. doi: 10.3389/fimmu.2018.00014. [DOI] [PMC free article] [PubMed] [Google Scholar]
- 2.Hadrup S, Donia M, Thor Straten P. Effector CD4 and CD8 T cells and their role in the tumor microenvironment. Cancer Microenviron. 2013;6:123–133. doi: 10.1007/s12307-012-0127-6. [DOI] [PMC free article] [PubMed] [Google Scholar]
- 3.Galon J, et al. Type, density, and location of immune cells within human colorectal tumors predict clinical outcome. Science. 2006;313:1960–1964. doi: 10.1126/science.1129139. [DOI] [PubMed] [Google Scholar]
- 4.Ribas A, Wolchok JD. Cancer immunotherapy using checkpoint blockade. Science. 2018;359:1350–1355. doi: 10.1126/science.aar4060. [DOI] [PMC free article] [PubMed] [Google Scholar]
- 5.Tumeh PC, et al. PD-1 blockade induces responses by inhibiting adaptive immune resistance. Nature. 2014;515:568–571. doi: 10.1038/nature13954. [DOI] [PMC free article] [PubMed] [Google Scholar]
- 6.Dudley ME, et al. Randomized selection design trial evaluating CD8+-enriched versus unselected tumor-infiltrating lymphocytes for adoptive cell therapy for patients with melanoma. J Clin Oncol. 2013;31:2152–2159. doi: 10.1200/JCO.2012.46.6441. [DOI] [PMC free article] [PubMed] [Google Scholar]
- 7.Rosenberg SA, et al. Durable complete responses in heavily pretreated patients with metastatic melanoma using T-cell transfer immunotherapy. Clin Cancer Res. 2011;17:4550–4557. doi: 10.1158/1078-0432.CCR-11-0116. [DOI] [PMC free article] [PubMed] [Google Scholar]
- 8.Yang JC, Rosenberg SA. Adoptive T-Cell Therapy for Cancer. Adv Immunol. 2016;130:279–294. doi: 10.1016/bs.ai.2015.12.006. [DOI] [PMC free article] [PubMed] [Google Scholar]
- 9.Rohaan MW, van den Berg JH, Kvistborg P, Haanen J. Adoptive transfer of tumor-infiltrating lymphocytes in melanoma: a viable treatment option. J Immunother Cancer. 2018;6:102. doi: 10.1186/s40425-018-0391-1. [DOI] [PMC free article] [PubMed] [Google Scholar]
- 10.Beck RJ, Slagter M, Beltman JB. Contact-dependent killing by cytotoxic T lymphocytes is insufficient for EL4 tumor regression in vivo. Cancer Res. 2019 doi: 10.1158/0008-5472.CAN-18-3147. [DOI] [PubMed] [Google Scholar]
- 11.Nakajima C, et al. A role of interferon-gamma (IFN-gamma) in tumor immunity: T cells with the capacity to reject tumor cells are generated but fail to migrate to tumor sites in IFN-gamma-deficient mice. Cancer Res. 2001;61:3399–3405. [PubMed] [Google Scholar]
- 12.Mojic M, Takeda K, Hayakawa Y. The Dark Side of IFN-gamma: Its Role in Promoting Cancer Immunoevasion. Int J Mol Sci. 2017;19 doi: 10.3390/ijms19010089. [DOI] [PMC free article] [PubMed] [Google Scholar]
- 13.Castro F, Cardoso AP, Goncalves RM, Serre K, Oliveira MJ. Interferon-Gamma at the Crossroads of Tumor Immune Surveillance or Evasion. Front Immunol. 2018;9:847. doi: 10.3389/fimmu.2018.00847. [DOI] [PMC free article] [PubMed] [Google Scholar]
- 14.Schroder K, Hertzog PJ, Ravasi T, Hume DA. Interferon-gamma: an overview of signals, mechanisms and functions. J Leukoc Biol. 2004;75:163–189. doi: 10.1189/jlb.0603252. [DOI] [PubMed] [Google Scholar]
- 15.Braumuller H, et al. T-helper-1-cell cytokines drive cancer into senescence. Nature. 2013;494:361–365. doi: 10.1038/nature11824. [DOI] [PubMed] [Google Scholar]
- 16.Kammertoens T, et al. Tumour ischaemia by interferon-gamma resembles physiological blood vessel regression. Nature. 2017;545:98–102. doi: 10.1038/nature22311. [DOI] [PMC free article] [PubMed] [Google Scholar]
- 17.Shankaran V, et al. IFNgamma and lymphocytes prevent primary tumour development and shape tumour immunogenicity. Nature. 2001;410:1107–1111. doi: 10.1038/35074122. [DOI] [PubMed] [Google Scholar]
- 18.Manguso RT, et al. In vivo CRISPR screening identifies Ptpn2 as a cancer immunotherapy target. Nature. 2017;547:413–418. doi: 10.1038/nature23270. [DOI] [PMC free article] [PubMed] [Google Scholar]
- 19.Patel SJ, et al. Identification of essential genes for cancer immunotherapy. Nature. 2017;548:537–542. doi: 10.1038/nature23477. [DOI] [PMC free article] [PubMed] [Google Scholar]
- 20.Kearney CJ, et al. Tumor immune evasion arises through loss of TNF sensitivity. Sci Immunol. 2018;3 doi: 10.1126/sciimmunol.aar3451. [DOI] [PubMed] [Google Scholar]
- 21.Pan D, et al. A major chromatin regulator determines resistance of tumor cells to T cell-mediated killing. Science. 2018;359:770–775. doi: 10.1126/science.aao1710. [DOI] [PMC free article] [PubMed] [Google Scholar]
- 22.Zaretsky JM, et al. Mutations Associated with Acquired Resistance to PD-1 Blockade in Melanoma. N Engl J Med. 2016;375:819–829. doi: 10.1056/NEJMoa1604958. [DOI] [PMC free article] [PubMed] [Google Scholar]
- 23.Sucker A, et al. Acquired IFNgamma resistance impairs anti-tumor immunity and gives rise to T-cell-resistant melanoma lesions. Nat Commun. 2017;8 doi: 10.1038/ncomms15440. 15440. [DOI] [PMC free article] [PubMed] [Google Scholar]
- 24.Gao J, et al. Loss of IFN-gamma Pathway Genes in Tumor Cells as a Mechanism of Resistance to Anti-CTLA-4 Therapy. Cell. 2016;167:397–404 e399. doi: 10.1016/j.cell.2016.08.069. [DOI] [PMC free article] [PubMed] [Google Scholar]
- 25.Shin DS, et al. Primary Resistance to PD-1 Blockade Mediated by JAK1/2 Mutations. Cancer Discov. 2017;7:188–201. doi: 10.1158/2159-8290.CD-16-1223. [DOI] [PMC free article] [PubMed] [Google Scholar]
- 26.Briesemeister D, et al. Tumor rejection by local interferon gamma induction in established tumors is associated with blood vessel destruction and necrosis. Int J Cancer. 2011;128:371–378. doi: 10.1002/ijc.25350. [DOI] [PubMed] [Google Scholar]
- 27.Spiotto MT, Rowley DA, Schreiber H. Bystander elimination of antigen loss variants in established tumors. Nat Med. 2004;10:294–298. doi: 10.1038/nm999. [DOI] [PubMed] [Google Scholar]
- 28.Spiotto MT, Schreiber H. Rapid destruction of the tumor microenvironment by CTLs recognizing cancer-specific antigens cross-presented by stromal cells. Cancer Immun. 2005;5:8. [PubMed] [Google Scholar]
- 29.Zhang B, et al. Induced sensitization of tumor stroma leads to eradication of established cancer by T cells. J Exp Med. 2007;204:49–55. doi: 10.1084/jem.20062056. [DOI] [PMC free article] [PubMed] [Google Scholar]
- 30.Bhatia A, Kumar Y. Cellular and molecular mechanisms in cancer immune escape: a comprehensive review. Expert Rev Clin Immunol. 2014;10:41–62. doi: 10.1586/1744666X.2014.865519. [DOI] [PubMed] [Google Scholar]
- 31.Muller AJ, et al. CD4+ T cells rely on a cytokine gradient to control intracellular pathogens beyond sites of antigen presentation. Immunity. 2012;37:147–157. doi: 10.1016/j.immuni.2012.05.015. [DOI] [PubMed] [Google Scholar]
- 32.Perona-Wright G, Mohrs K, Mohrs M. Sustained signaling by canonical helper T cell cytokines throughout the reactive lymph node. Nat Immunol. 2010;11:520–526. doi: 10.1038/ni.1866. [DOI] [PMC free article] [PubMed] [Google Scholar]
- 33.Barcia C, et al. In vivo polarization of IFN-gamma at Kupfer and non-Kupfer immunological synapses during the clearance of virally infected brain cells. J Immunol. 2008;180:1344–1352. doi: 10.4049/jimmunol.180.3.1344. [DOI] [PMC free article] [PubMed] [Google Scholar]
- 34.Sanderson NS, et al. Cytotoxic immunological synapses do not restrict the action of interferon-gamma to antigenic target cells. Proc Natl Acad Sci U S A. 2012;109:7835–7840. doi: 10.1073/pnas.1116058109. [DOI] [PMC free article] [PubMed] [Google Scholar]
- 35.Stronen E, et al. Targeting of cancer neoantigens with donor-derived T cell receptor repertoires. Science. 2016;352:1337–1341. doi: 10.1126/science.aaf2288. [DOI] [PubMed] [Google Scholar]
- 36.Ivashkiv LB, Donlin LT. Regulation of type I interferon responses. Nat Rev Immunol. 2014;14:36–49. doi: 10.1038/nri3581. [DOI] [PMC free article] [PubMed] [Google Scholar]
- 37.Kotredes KP, Gamero AM. Interferons as inducers of apoptosis in malignant cells. J Interferon Cytokine Res. 2013;33:162–170. doi: 10.1089/jir.2012.0110. [DOI] [PMC free article] [PubMed] [Google Scholar]
- 38.Wang W, et al. CD8(+) T cells regulate tumour ferroptosis during cancer immunotherapy. Nature. 2019;569:270–274. doi: 10.1038/s41586-019-1170-y. [DOI] [PMC free article] [PubMed] [Google Scholar]
- 39.Rouwkema J, Rivron NC, van Blitterswijk CA. Vascularization in tissue engineering. Trends Biotechnol. 2008;26:434–441. doi: 10.1016/j.tibtech.2008.04.009. [DOI] [PubMed] [Google Scholar]
- 40.Benci JL, et al. Tumor Interferon Signaling Regulates a Multigenic Resistance Program to Immune Checkpoint Blockade. Cell. 2016;167:1540–1554 e1512. doi: 10.1016/j.cell.2016.11.022. [DOI] [PMC free article] [PubMed] [Google Scholar]
- 41.Pai CS, et al. Clonal Deletion of Tumor-Specific T Cells by Interferon-gamma Confers Therapeutic Resistance to Combination Immune Checkpoint Blockade. Immunity. 2019;50:477–492 e478. doi: 10.1016/j.immuni.2019.01.006. [DOI] [PMC free article] [PubMed] [Google Scholar]
- 42.Benci JL, et al. Opposing Functions of Interferon Coordinate Adaptive and Innate Immune Responses to Cancer Immune Checkpoint Blockade. Cell. 2019;178:933–948 e914. doi: 10.1016/j.cell.2019.07.019. [DOI] [PMC free article] [PubMed] [Google Scholar]
- 43.Workel HH, et al. A Transcriptionally Distinct CXCL13(+)CD103(+)CD8(+) T-cell Population Is Associated with B-cell Recruitment and Neoantigen Load in Human Cancer. Cancer Immunol Res. 2019;7:784–796. doi: 10.1158/2326-6066.CIR-18-0517. [DOI] [PubMed] [Google Scholar]
- 44.Thommen DS, et al. A transcriptionally and functionally distinct PD-1(+) CD8(+) T cell pool with predictive potential in non-small-cell lung cancer treated with PD-1 blockade. Nat Med. 2018;24:994–1004. doi: 10.1038/s41591-018-0057-z. [DOI] [PMC free article] [PubMed] [Google Scholar]
- 45.Farhood B, Najafi M, Mortezaee K. CD8(+) cytotoxic T lymphocytes in cancer immunotherapy: A review. J Cell Physiol. 2019;234:8509–8521. doi: 10.1002/jcp.27782. [DOI] [PubMed] [Google Scholar]
- 46.Nagarsheth N, Wicha MS, Zou W. Chemokines in the cancer microenvironment and their relevance in cancer immunotherapy. Nat Rev Immunol. 2017;17:559–572. doi: 10.1038/nri.2017.49. [DOI] [PMC free article] [PubMed] [Google Scholar]
- 47.Platanias LC. Mechanisms of type-I- and type-II-interferon-mediated signalling. Nat Rev Immunol. 2005;5:375–386. doi: 10.1038/nri1604. [DOI] [PubMed] [Google Scholar]
- 48.van Rooij N, et al. Tumor exome analysis reveals neoantigen-specific T-cell reactivity in an ipilimumab-responsive melanoma. J Clin Oncol. 2013;31:e439–442. doi: 10.1200/JCO.2012.47.7521. [DOI] [PMC free article] [PubMed] [Google Scholar]
- 49.Jorritsma A, et al. Selecting highly affine and well-expressed TCRs for gene therapy of melanoma. Blood. 2007;110:3564–3572. doi: 10.1182/blood-2007-02-075010. [DOI] [PubMed] [Google Scholar]
- 50.Linnemann C, et al. High-throughput identification of antigen-specific TCRs by TCR gene capture. Nat Med. 2013;19:1534–1541. doi: 10.1038/nm.3359. [DOI] [PubMed] [Google Scholar]


