Figure 5:

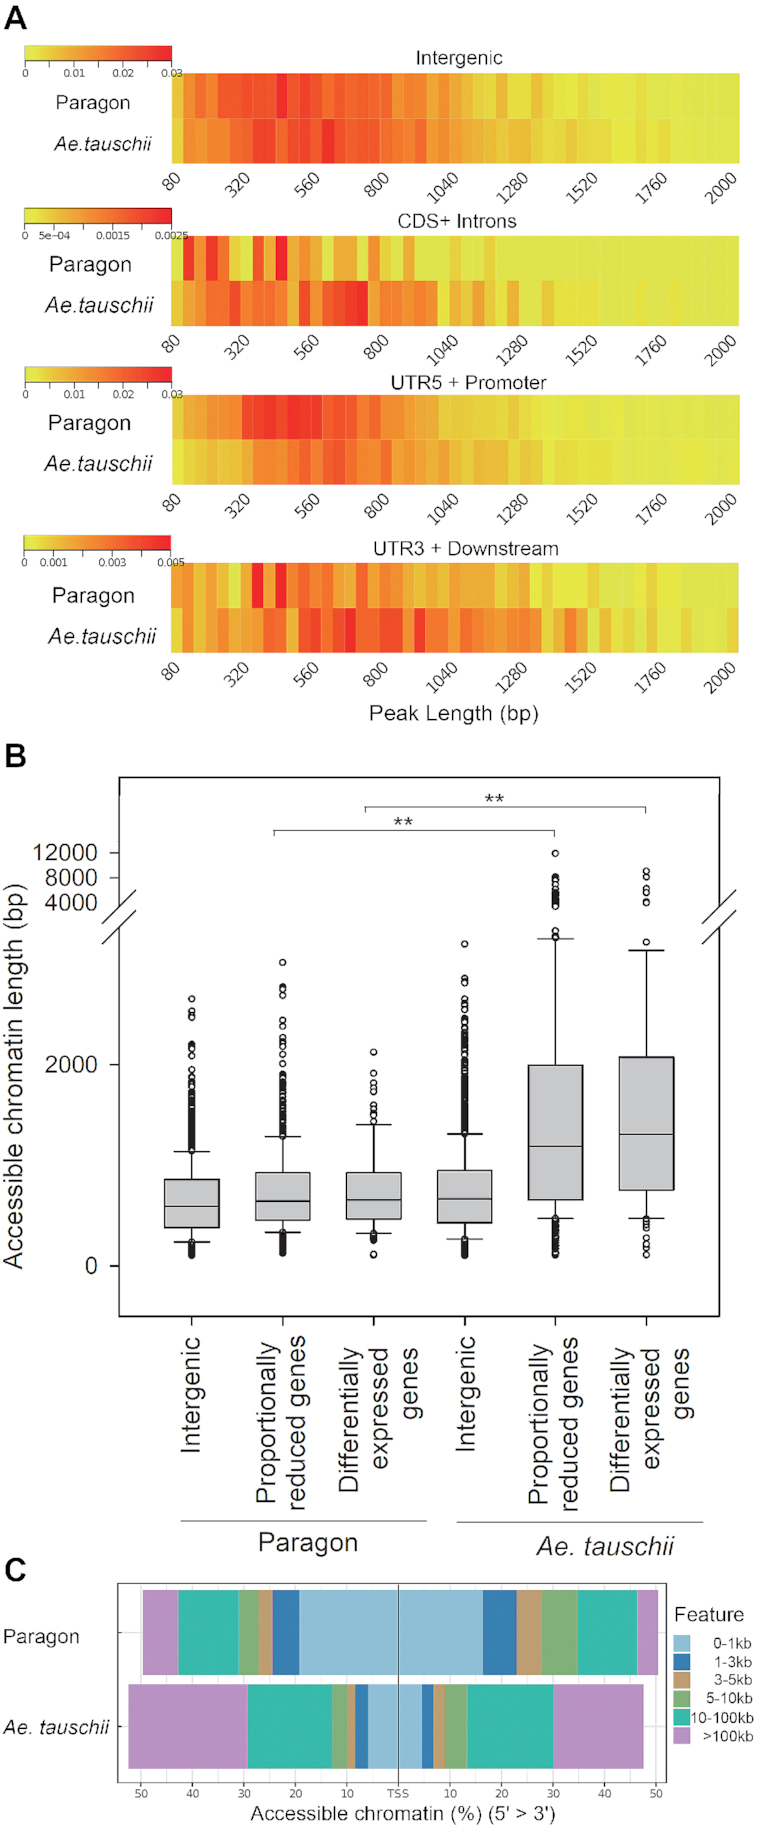
The distribution of accessible chromatin on wheat chromosome 3DL and Ae tauschii chromosome 3 L. (A) Normalized ATAC peak length enrichment for 4 classes of chromosomal regions on Paragon wheat chromosome 3DL and Ae tauschii 3 L. The chromosomal regions are intergenic, CDS+introns, 5′UTR+2 kb upstream putative promoter region, and 3′UTR+2 kb downstream. ATAC peak length distributions are shown in base pairs on the horizontal axis. The colour scale shows ATAC peak frequency distribution per bin. (B) Box plots of ATAC peak lengths across intergenic regions, genes with proportionately reduced expression patterns, and genes showing differential expression between wheat 3DL and Ae tauschii 3 L. The significance of ATAC peak length differences was assessed by 1-way analysis of variance. Peak length differences for balanced genes between wheat at Ae tauschii were significant at 6.99E−68, and 1.34E−10 for differentially expressed genes. (C) Normalized distance distribution of ATAC-sequence peaks relative to the TSS of genes in hexaploid wheat and diploid Ae tauschii genes.
