Abstract
Background
Oral squamous cell carcinoma (OSCC) is the sixth most prevalent cancer worldwide, with low 5-year survival rate. To identify novel prognostic markers for OSCC and determine the immune and stromal landscape of OSCC, a risk signature for OSCC patients was constructed in this study.
Material/Methods
Immune and stromal scores for OSCC samples from the Genomic Data Commons Data Portal were computed to delineate the tumor microenvironment landscape of oral cancer based on the Estimation of STromal and Immune cells in MAlignant Tumours using Expression data algorithm. An immune score-based risk signature was constructed by combining random forest and support vector machine methods. Correlation analysis of risk signature gene expression and immune cell infiltration was conducted, and the distinguishing power of individual signature genes was evaluated by analyzing receiver operating characteristics (ROC) curves. Differentially enriched pathways between high and low risk groups were investigated via gene set variation analysis. ROC curves were plotted for signature genes to examine their ability to distinguish the recurrence and survival status of OSCC patients from GSE84846.
Results
An immune score-related risk signature composed of ARMH1, F2RL2, AC004687.1, COL6A5, AC008750.1, RAB19, CRLF2, GRIP2, and FAM162B performed well in the prognostic stratification of OSCC patients and could effectively distinguish their survival status. Lists of pathways, including cytokine–cytokine receptor interaction and cell adhesion molecules displayed remarkable differential enrichment between high and low risk OSCC patients.
Conclusions
An immune score-based risk signature constructed presently may be useful to decide appropriate treatment options for individual OSCC patients.
MeSH Keywords: Corneal Stroma; Immunity, Cellular; Microarray Analysis; Mouth Neoplasms; Prognosis; Sequence Analysis, RNA
Background
Oral squamous cell carcinoma (OSCC), which accounts for 60% of head and neck squamous cell carcinoma cases, is ranked as the sixth most prevalent cancer worldwide, with 354 864 new cases reported annually [1,2]. OSCC most commonly occurs in the horizontal borders and the base of the tongue as well as the bottom of the mouth [2]. Although fantastic progress has been made in the development of treatment strategies for OSCC, which include radical resection, postoperative radiotherapy, and chemotherapy, its daunting lethality has been demonstrated by low 5-year survival rate [3,4]. Challenges faced in overcoming this disease may include early recurrence, peripheral invasion, distant metastasis, and extra nodal extension [5]. Furthermore, OSCC patients may be afflicted by complications of the aforementioned therapies [6]. The aggressiveness of OSCC has suggested a need to identify novel prognostic markers to assist the clinical management of OSCC patients.
The tumor microenvironment (TME) consists of various cells and cytokines, including cancer-associated fibroblasts, multitudinous infiltrating immune cells, and the extracellular matrix [7,8]. Complex interactions between multiple components of the TME and between the TME and tumor cells play essential roles in regulating the biological behaviors of human cancers, including invasion, metastasis, apoptosis, angiogenesis, and energy metabolism [9,10]. OSCC is highly associated with immune infiltration [11], and there is growing evidence that the TME exerts a non-negligible influence on the prognosis of cancer patients [12–14]. Comprehensive exploration of the complicated network of immune and stromal cells in oral cancer may facilitate the development of prognostic monitors and ways to clarify the molecular mechanisms of OSCC.
In the present study, immune and stromal scores for oral cancer samples were computed to delineate their TME landscape based on the Estimation of STromal and Immune cells in MAlignant Tumours using Expression data (ESTIMATE) algorithm invented by Yoshihara et al. [15]. An immune score-based risk signature was constructed by combining machine learning methods. Findings from this study may guide the prognostic study of oral cancer, especially regarding the TME.
Material and Methods
Curation of mRNA-seq data
We downloaded level 3 RNA-seq data and clinical information for 198 oral cancer patients from the Genomic Data Commons Data Portal (GDC Data Portal; https://portal.gdc.cancer.gov/). Raw expression data was in the form of fragments per kilobase million (FPKM) and was processed into the form of log2 (TPM+0.001) to calculate immune and stromal scores. Then, log2 (TPM+0.001) normalized expression data was used to calculate immune and stromal scores for 198 oral cancer patients via the ESTIMATE package in R software v.3.6.1. An independent samples t-test and Kruskal-Wallis test were conducted using Graphpad Prism v.8.0.1 to compare the distribution of immune scores among various subgroups of clinical variables. Statistical significance was set at P<0.05.
Differentially expressed genes (DEGs) between high and low immune scores
In addition to FPKM expression data, we downloaded count data for 198 oral cancer patients. All 198 cases were classified into 2 groups in accordance with their median immune score. Based on count data, the limma voom package was used to select DEGs (log2FC >1 or <−1 and adjusted P value <0.05).
Identification of prognostic DEGs
Through the survival package in R software v.3.6.1, univariate Cox regression analysis was used to identify genes with significant prognostic value (P<0.05) in DEGs. Oral cancer patients enrolled for univariate Cox regression and subsequent analysis were those with more than 90 days of overall survival time. For identified prognostic DEGs, Gene Ontology (GO) and Kyoto Encyclopedia of Genes and Genomes (KEGG) pathway analyses were implemented using the clusterProfiler package in R software v.3.6.1 to analyze their functional enrichment. Terms with P<0.05 were considered significant. The STRING database v.11.0 (https://string-db.org/) was used to construct a protein-to-protein interaction (PPI) network for DEGs.
Immune score-based risk signature
Optimal genes for the construction of an immune score-based risk signature were chosen from prognostic DEGs. A random forest machine learning method was applied to the survival dataset of the present study to determine the best genes for the risk signature, which required loading the Boruta package in R software v.3.6.1. The label of the input dataset was the survival status of oral cancer patients included in the survival analysis. After determining signature genes, hierarchical clustering was performed to separate oral cancer patients into 2 categories according to the normalized expression value of signature genes. Receiver operating characteristics (ROC) curves were plotted to assess the degree of conformity between hierarchical clustering and the actual classification of oral cancer patients’ survival status. The survival difference between the 2 above groups identified by hierarchical clustering was compared using Kaplan-Meier survival curves. ROC and Kaplan-Meier survival curves were drawn in SPSS v.22.0.
Risk signatures for oral cancer patients were constructed according to the support vector machine (SVM) method using signature genes identified in the random forest. The label of the input dataset was the survival status of oral cancer patients included in the survival analysis, and the Kernel method for SVM was polynomial. Patients were categorized into high or low risk groups according to the risk signature constructed using SVM. ROC curves were plotted to assess the degree of conformity between risk classification and the actual survival status of oral cancer patients. The survival difference between the 2 groups identified by hierarchical clustering was compared using Kaplan-Meier survival curves. ROC and Kaplan-Meier survival curves were drawn in SPSS v.22.0. SVM methods for constructing patients’ risk signatures were implemented using the e1071 package in R software v.3.6.1.
Independent prognostic value of the immune score-based risk signature
It was necessary to establish whether or not the prognostic value of patients’ immune score-based risk signature was independent of other clinical characteristics, including race, age, gender, T stage, ethnicity, margin status, clinical stage, histologic grade, laterality, pathological stage, perineural invasion, lymph node metastasis, lymphovascular invasion, and the presence of pathological nodal extracapsular spread. Univariate and multivariate Cox regression analyses were used to determine immune score-based risk signatures together with the aforementioned clinical features.
Nomograms were established by combining patients’ immune score-based risk signature and significant clinical variables from univariate Cox regression analysis (P<0.05). Calibration curves were created to appraise the conformity of nomogram-predicted survival outcome with the actual survival condition of oral cancer patients at 3 and 5 years. Rms, foreign, and survival packages in R software v.3.6.1 were used to plot nomograms and calibration curves.
Gene Set Variation Analysis (GSVA) for risk-stratified oral cancer patients
Gene Set Variation Analysis (GSVA) was conducted using the package of the same name in R software v.3.6.1 to investigate the enrichment of oral cancer patients’ KEGG pathways with the c2.cp.kegg.v6.2.symbols.gmt gene set from the Molecular Signature Database (MSigDB; http://software.broadinstitute.org/gsea/msigdb/index.jsp) as the reference annotation. KEGG pathways with significantly different enrichment scores between high and low risk groups were confirmed using the limma package in R software v.3.6.1 (log2FC >0.1 or <−0.1; P<0.05).
Further research on individual signature genes
We explored the correlation between the signature gene expression and infiltration level of immune cells and tumor purity in head and neck squamous cell carcinoma using the Tumor Immune Estimation Resource (TIMER; https://cistrome.shinyapps.io/timer/). The prognostic value of individual signature genes was measured using Kaplan-Meier survival curves. OSCC patients were grouped according to the median value of the log2 (TPM+0.001) expression value of signature genes. Statistical significance was set at P<0.05.
Verification of risk signature
No microarray contained the expression data of all signature genes and prognostic information, so only some of the prognostic value of part of the signature genes in OSCC was validated in the present analysis. ROC curves were plotted for 5 genes, including CRLF2, F2RL2, FAM162B, COL6A5, and GRIP2 to examine their ability to distinguish the recurrence and survival status of 99 oral cancer patients from GSE84846.
Results
Immune and stromal scores estimated from RNA-seq data
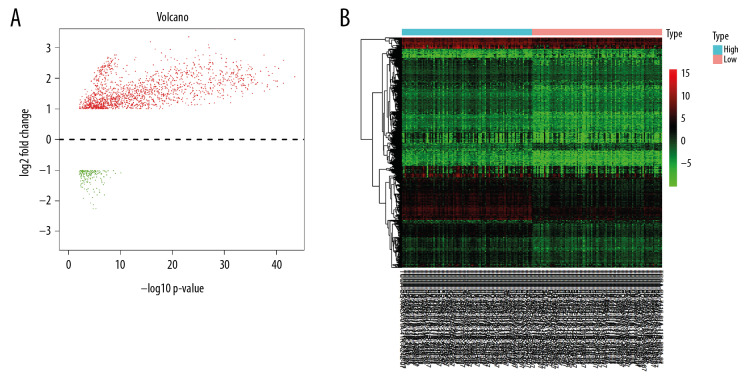
Immune and stromal scores were computed via normalized RNA-seq data of 198 OSCC patients from GDC Data Portal (data not shown). There were no significant relationships between immune or stromal scores and any clinical parameters of OSCC (data not shown). Differential expression analysis for the 198 OSCC patients identified 1773 DEGs in total. In those DEGs, compared to low immune score group, 1599 genes were significantly upregulated, and 174 genes were significantly downregulated in the high immune score group (Figure 1).
Figure 1.
Differentially expressed genes between high and low immune score groups. (A) Volcano plot; (B) Heatmap.
Immune-related DEGs with prognostic value
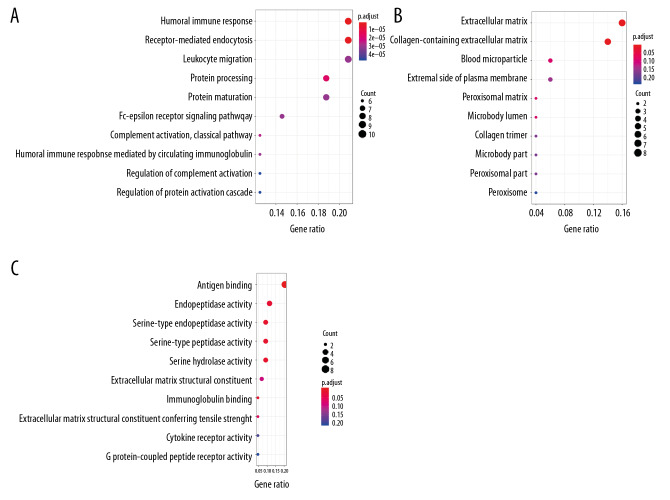
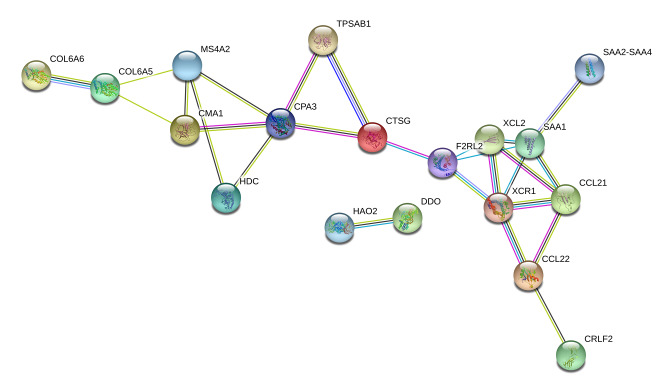
A total of 80 immune-related DEGs were significantly related to the overall prognosis of OSCC patients (P<0.05). Using GO enrichment analysis, these were predicted to be actively involved in biological processes, such as humoral immune response; receptor-mediated endocytosis and protein processing; cellular components, such as the extracellular matrix, collagen-containing extracellular matrix, and blood microparticles; and molecular functions, such as antigen binding, serine-type endopeptidase activity, and serine-type peptidase activity (P<0.05; Table 1, Figure 2). The PPI network for interconnections between the 80 immune-related DEGs with prognostic value has been displayed in Figure 3.
Table 1.
Gene Ontology enrichment analysis based on the 80 prognostic differentially expressed genes.
| ID | Category | Description | GeneRatio | P value | P.adjust | Count | Gene ID |
|---|---|---|---|---|---|---|---|
| GO: 0006959 | BP | Humoral immune response | 10/48 | 2.5E-09 | 1.76E-06 | 10 | IGLV2-11/IGHV2-5/CFI, etc. |
| GO: 0006898 | BP | Receptor-mediated endocytosis | 10/48 | 5.75E-09 | 2.02E-06 | 10 | IGLV2-11/IGHV2-5IGHA1, etc. |
| GO: 0016485 | BP | Protein processing | 9/48 | 7.53E-08 | 1.77E-05 | 9 | IGLV2-11/IGHV2-5/CMA1, etc. |
| GO: 0006958 | BP | Complement activation, classical pathway | 6/48 | 1.5E-07 | 2.65E-05 | 6 | IGLV2-11/IGHV2-5/CFI, etc. |
| GO: 0038095 | BP | Fc-epsilon receptor signaling pathway | 7/48 | 3.12E-07 | 3.12E-05 | 7 | IGLV2-11/IGHV2-5/IGHE, etc. |
| GO: 0031012 | CC | Extracellular matrix | 8/50 | 3.12E-05 | 0.001715 | 8 | COL6A5/COL6A6/MMP25, etc. |
| GO: 0062023 | CC | Collagen-containing extracellular matrix | 7/50 | 8.71E-05 | 0.002396 | 7 | COL6A5/COL6A6/TPSAB1, etc. |
| GO: 0072562 | CC | Blood microparticle | 3/50 | 0.007144 | 0.090592 | 3 | IGHV3-13/IGHA2/IGHA1 |
| GO: 0005782 | CC | Peroxisomal matrix | 2/50 | 0.008236 | 0.090592 | 2 | HAO2/DDO |
| GO: 0031907 | CC | Microbody lumen | 2/50 | 0.008236 | 0.090592 | 2 | HAO2/DDO |
| GO: 0003823 | MF | Antigen binding | 9/44 | 1.41E-10 | 1.34E-08 | 9 | IGLV2-11/IGLV3-16/IGHE, etc. |
| GO: 0004252 | MF | Serine-type endopeptidase activity | 4/44 | 0.000384 | 0.018241 | 4 | TPSAB1/CFI/CTSG, etc. |
| GO: 0008236 | MF | Serine-type peptidase activity | 4/44 | 0.000735 | 0.019613 | 4 | TPSAB1/CFI/CTSG, etc. |
| GO: 0017171 | MF | Serine hydrolase activity | 4/44 | 0.000826 | 0.019613 | 4 | TPSAB1/CFI/CTSG, etc. |
| GO: 0004175 | MF | Endopeptidase activity | 5/44 | 0.001412 | 0.025427 | 5 | ECEL1/TPSAB1/CFI, etc. |
GO – Gene Ontology.
Figure 2.
Enrichment analysis of 80 differentially expressed prognostic genes. (A) Dot plot for biological process. (B) Dot plot for cellular components. (C) Dot plot for molecular function.
Figure 3.
Protein-to-protein interaction network for 80 differentially expressed prognostic genes. Nodes and links in the network represented different genes and their interplays.
Selection of genes for risk signature
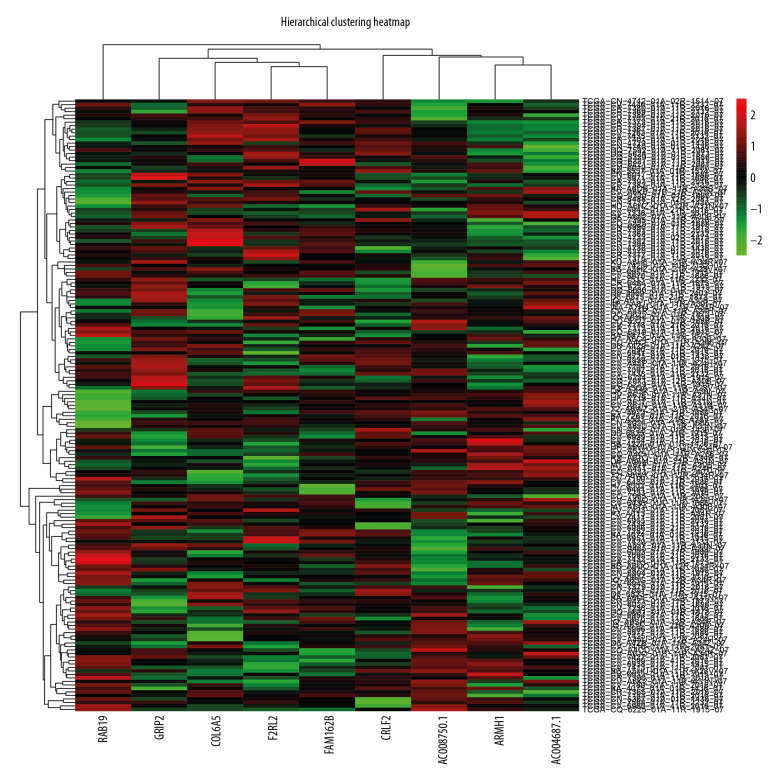
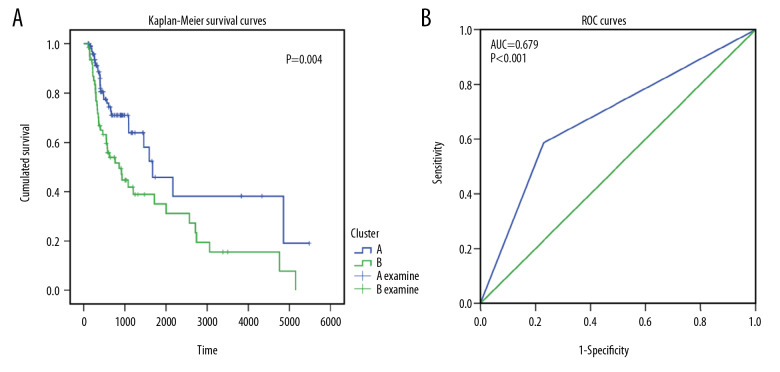
According to feature selection methods of the random forest, 9 genes (ARMH1, F2RL2, AC004687.1, COL6A5, AC008750.1, RAB19, CRLF2, GRIP2, and FAM162B) were chosen as signature genes for the immune score-based risk signature. Hierarchical analysis of 175 OSCC patients divided them into 2 subgroups according to their normalized expression (Figure 4). Two subgroups of OSCC patients exhibited obviously different survival conditions (P=0.004), and ROC curves with an area under the curve (AUC) value of 0.679 indicated good consistency between hierarchical clustering and the survival status classification of OSCC patients (Figure 5).
Figure 4.
Hierarchical cluster map for oral squamous cell carcinoma patients based on risk signature gene expression. Colors of each grid represented the expression of risk signature genes in different samples.
Figure 5.
The prognostic and discriminating power of hierarchical clustering. (A) Kaplan-Meier survival curves for 2 hierarchical-clustered groups based on risk signature gene expression. (B) Receiver operating characteristics curves for evaluating the ability of hierarchical clustering to distinguish the survival status of oral squamous cell carcinoma patients.
Immune score-based risk signature
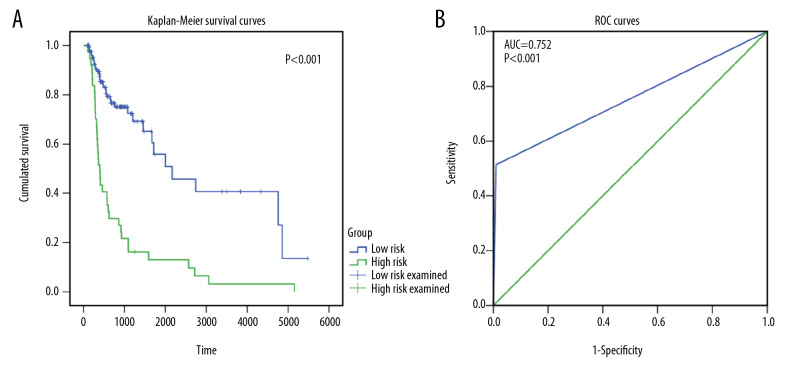
After determining signature genes, an immune score-based risk signature was constructed using SVM methods, which classified 110 OSCC patients as low risk and 65 OSCC patients as high risk. High risk OSCC patients had significantly poorer overall survival than low risk OSCC patients (Figure 6A). Moreover, the majority of low risk patients showed an overall status of alive, while the majority of high risk patients showed an overall status of dead, indicating a high conformity between risk signature-based risk stratification and the actual overall survival status of OSCC patients (AUC=0.752; Figure 6B).
Figure 6.
The prognostic and discriminating power of risk signature. (A) Kaplan-Meier survival curves for high and low risk groups divided by risk signature. (B) Receiver operating characteristics curves showing the ability of oral squamous cell carcinoma patients’ risk signature to distinguish their survival status.
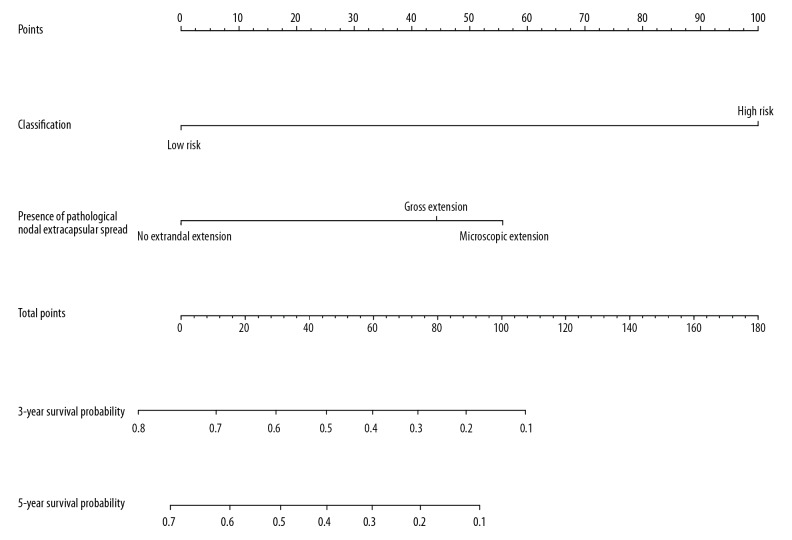
Univariate Cox regression analysis was performed on 175 OSCC patients that met the selection criteria. Univariate and multivariate Cox regression analyses for risk signature and clinical variables supported the independent prognostic value of OSCC patients’ risk signature (P<0.05). The presence of pathological nodal extracapsular spread and patients’ risk signature were 2 significant prognostic factors in univariate Cox regression analysis (P<0.05; Table 2), and risk signature was the only significant prognostic factor in multivariate Cox regression analysis (Table 3). We incorporated the presence of pathological nodal extracapsular spread and risk signature into a nomogram. The nomogram demonstrated the import influence of risk signature on the overall survival of OSCC patients (Figure 7), though the survival prediction of the nomogram at 3 and 5 years did not fit well with patients’ real survival condition (data not shown).
Table 2.
Univariate Cox regression analysis for risk signature and clinical variables.
| Risk signature or clinical variables | B | SE | Wald | df | Significance | Hazard ratio [95% CI] |
|---|---|---|---|---|---|---|
| Classification | 1.366 | 0.241 | 32.203 | 1 | 0 | 3.921 [2.446–6.285] |
| Gender | 0.082 | 0.253 | 0.106 | 1 | 0.745 | 1.086 [0.661–1.782] |
| Race list | – | – | 6.391 | 3 | 0.094 | – |
| Age at initial pathologic diagnosis | 0.176 | 0.319 | 0.304 | 1 | 0.581 | 1.193 [0.638–2.229] |
| Ethnicity | 0.149 | 0.481 | 0.096 | 1 | 0.757 | 1.161 [0.452–2.978] |
| Laterality | – | – | 2.199 | 2 | 0.333 | – |
| Margin status | – | – | 4.498 | 2 | 0.106 | – |
| Presence of pathological nodal extracapsular spread | – | – | 6.954 | 2 | 0.031 | – |
| Lymphovascular invasion present | 0.258 | 0.348 | 0.55 | 1 | 0.458 | 1.294 [0.655–2.558] |
| Perineural invasion present | 0.343 | 0.319 | 1.158 | 1 | 0.282 | 1.409 [0.755–2.632] |
| Neoplasm histologic grade | – | – | 3.306 | 2 | 0.191 | – |
| Clinical stage | 0.203 | 0.255 | 0.635 | 1 | 0.426 | 1.225 [0.743–2.02] |
| Stage event pathologic stage | 0.489 | 0.289 | 2.862 | 1 | 0.091 | 1.63 [0.925–2.873] |
| T stage | 0.237 | 0.247 | 0.923 | 1 | 0.337 | 1.267 [0.782–2.055] |
| Lymph node metastasis | −0.143 | 0.251 | 0.325 | 1 | 0.569 | 0.867 [0.53–1.417] |
B – coefficient value; SE – standard error; df – degree of freedom; CI – confidence interval.
Table 3.
Multivariate Cox regression analysis for risk signature and clinical variables.
| Risk signature or clinical variables | B | SE | Wald | df | Significance | Hazard ratio [95% CI] |
|---|---|---|---|---|---|---|
| Classification | 2.237 | 1.079 | 4.296 | 1 | 0.038 | – |
| Gender | −0.073 | 1.015 | 0.005 | 1 | 0.943 | – |
| Race list | 0.562 | 0.904 | 0.386 | 1 | 0.534 | – |
| Age at initial pathologic diagnosis | 13.083 | 517.25 | 0.001 | 1 | 0.98 | 1.754 [0.298–10.323] |
| Ethnicity | – | – | – | – | – | 480569.91 [−] |
| Laterality | −0.062 | 0.496 | 0.016 | 1 | 0.9 | – |
| Margin status | 0.25 | 0.912 | 0.075 | 1 | 0.784 | 0.939 [0.356–2.482] |
| Presence of pathological nodal extracapsular spread | −0.643 | 0.762 | 0.712 | 1 | 0.399 | 1.283 [0.215–7.671] |
| Lymphovascular invasion present | 0.639 | 1.423 | 0.202 | 1 | 0.653 | 0.526 [0.118–2.34] |
| Perineural invasion present | 1.566 | 1.368 | 1.311 | 1 | 0.252 | 1.894 [0.117–30.792] |
| Neoplasm histologic grade | 0.107 | 0.804 | 0.018 | 1 | 0.894 | 4.788 [0.328–69.864] |
| Clinical stage | 1.395 | 2.255 | 0.383 | 1 | 0.536 | 1.113 [0.23–5.384] |
| Stage event pathologic stage | −1.972 | 1.236 | 2.547 | 1 | 0.111 | – |
| T stage | 0.453 | 1.656 | 0.075 | 1 | 0.784 | 0.139 [0.012–1.568] |
| Lymph node metastasis | −1.542 | 1.862 | 0.686 | 1 | 0.407 | 1.573 [0.061–40.362] |
B – coefficient value; SE – standard error; df – degree of freedom; CI – confidence interval.
Figure 7.
Nomogram of risk signature and other clinical parameters. Risk signature was combined with pathological nodal extracapsular spread to form the nomogram.
GSVA analysis for OSCC patients
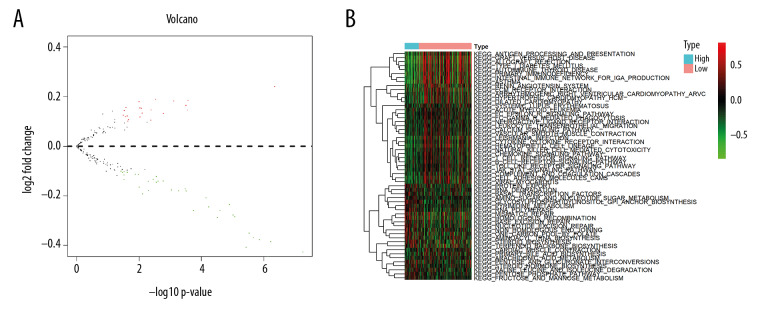
According to GSVA analysis, 57 KEGG pathways showed significant differential enrichment between high and low risk OSCC patients (Figure 8). More than half the KEGG pathways, including asthma, autoimmune thyroid disease, and allograft rejection were highly clustered in high risk samples (Figure 8).
Figure 8.
Differentially enriched Kyoto Encyclopedia of Genes and Genomes pathways between high and low risk groups. (A) Volcano plot; (B) Heatmap.
Analysis of individual signature genes
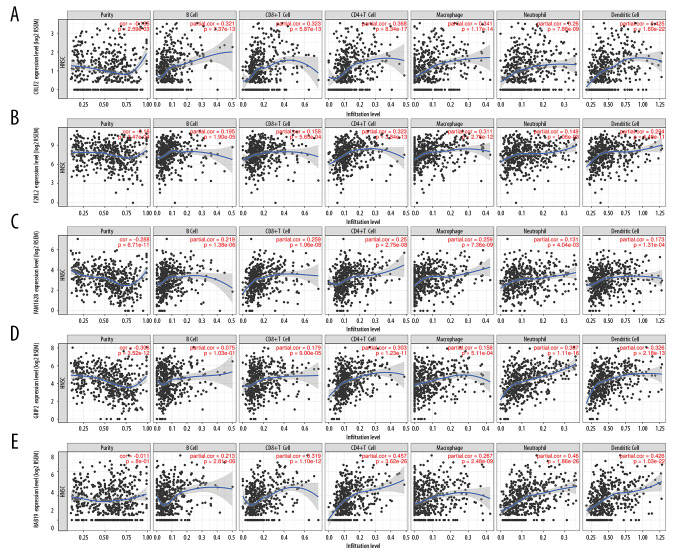
Kaplan-Meier survival curves for the 9 signature genes revealed no obvious survival difference between patient groups with high or low expression of these genes (data not shown). Five of the 9 signature genes (CRLF2, F2RL2, FAM162B, GRIP2, and RAB19) with available query terms in TIMER had a negative correlation with OSCC tumor purity and a positive correlation with the immune infiltration of B cells, CD8+ T cells, CD4+ T cells, macrophages, neutrophils, and dendritic cells (Figure 9).
Figure 9.
Immune relativity of signature genes in head and neck squamous cell carcinoma. (A) The correlation between CRLF2 expression and tumor purity or immune cell infiltration. (B) The correlation between F2RL2 expression and tumor purity or immune cell infiltration. (C) The correlation between FAM162B expression and tumor purity or immune cell infiltration. (D) The correlation between GRIP2 expression and tumor purity or immune cell infiltration. (E) The correlation between RAB19 expression and tumor purity or immune cell infiltration.
Validation of signature genes using microarrays
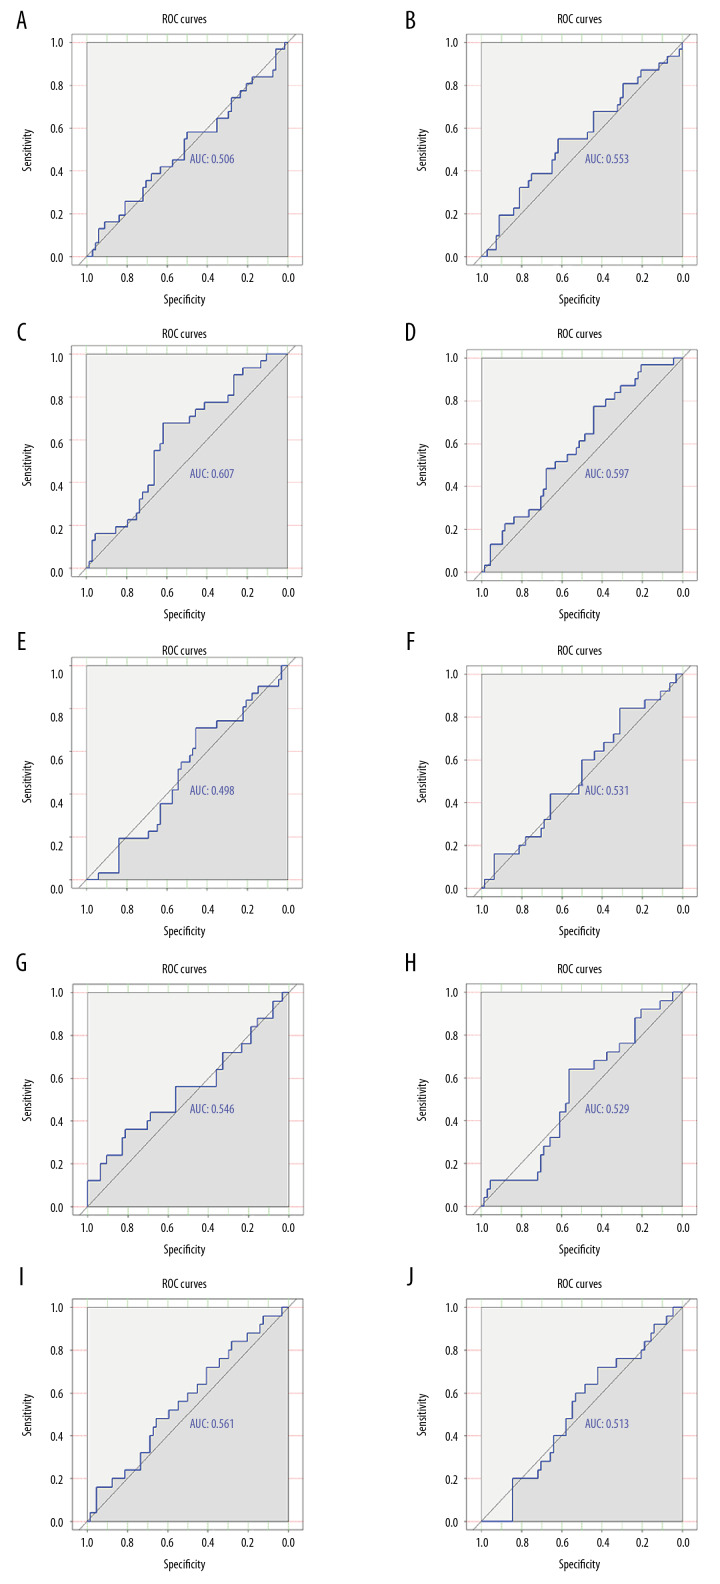
ROC curves for 5 genes (CRLF2, F2RL2, FAM162B, COL6A5, and GRIP2) suggested that these genes had a general ability to differentiate the survival and recurrence status of 99 OSCC patients (Figure 10).
Figure 10.
Validation of the distinguishing capacity of signature genes in oral squamous cell carcinoma. (A) Receiver operating characteristics (ROC) curves of survival status for CRLF2 in GSE84846. (B) ROC curves of survival status for F2RL2 in GSE84846. (C) ROC curves of survival status for FAM162B in GSE84846. (D) ROC curves of survival status for COL6A5 in GSE84846. (E) ROC curves of survival status for GRIP2 in GSE84846. (F) ROC curves of recurrence status for CRLF2 in GSE84846. (G) ROC curves of recurrence status for F2RL2 in GSE84846. (H) ROC curves of recurrence status for FAM162B in GSE84846. (I) ROC curves of recurrence status for COL6A5 in GSE84846. (J) ROC curves of recurrence status for GRIP2 in GSE84846.
Discussion
In the present study, which is the first of its kind, we constructed a risk signature for OSCC patients based on the DEGs of high and low immune score groups. The immune score-related risk signature performed well in the prognostic stratification of OSCC patients and effectively distinguished the survival status of OSCC patients in GDC Data Portal cohorts. When taking into account other clinical variables, the immune-related risk signature had independent prognostic value for OSCC. Findings from this study implied that an immune score-based risk signature might serve as a promising biomarker for prognostic prediction in OSCC patients.
Signature genes for the prognostic model of the present study were selected from the prognostic DEGs of high and low immune score groups. GO analysis for these genes indicated their significant enrichment in immune-related biological processes and molecular functions, including humoral immune response, receptor-mediated endocytosis, protein processing, and antigen binding. This supported the vital involvement of prognostic DEGs in the immune activities of OSCC. The risk signature developed in the present study consisted of ARMH1, F2RL2, AC004687.1, COL6A5, AC008750.1, RAB19, CRLF2, GRIP2, and FAM162B. To date, none of these signature genes have been reported in literature on OSCC, which demonstrates the novelty of our findings.
All 9 signature genes in the present study were closely associated with tumor purity and the infiltration of various immune cells in oral cancer. Of the 9 genes, CRLF2 has been extensively reported to play crucial roles in several inflammatory immune response-related diseases [16]. CRLF2, also known as thymic stromal lymphopoietin receptor (TSLPR), is a heterodimer complex composed of TSLPR and IL-7R-α or CD127, an IL-7 receptor [17]. Borriello et al. showed that a functionally discrete subset of human CD14+ CD1c+ monocytes expressed high levels of TSLPR upon stimulation of lipopolysaccharide [18]. In addition, Cui et al. explained the protective effect of TSLP-TSLPR signaling on Pseudomonas aeruginosa keratitis by targeting dendritic cells and the regulation of the IL-23/IL-17 signaling pathway [19]. These findings, with the results of the current work, supported the essential participation of the risk signature in immune-related processes of OSCC.
To investigate the molecular mechanism of the risk signature in OSCC, we conducted GSVA analysis to find differentially enriched KEGG pathways between high and low risk OSCC patients. A list of pathways, including the intestinal immune network for IgA production, primary immunodeficiency, graft-versus-host disease, hematopoietic cell lineage, leishmania infection, cytokine–cytokine receptor interaction, and cell adhesion molecules displayed remarkable differential enrichment between high and low risk OSCC patients. We conjectured that the differential enrichment of these pathways may account for the mechanism underlying the distinct survival conditions of OSCC patents stratified by risk signature.
There were several limitations of this study. First, the risk signature could not be reconstructed in an independent validation cohort to verify its prognostic value for OSCC. Second, the biological roles of signature genes in the immunology of OSCC was not elucidated. In vitro and in vivo experiments are warranted in future work to explore the exact functions of signature genes in OSCC. We would also recommend sequencing analysis in real world samples to validate the risk signature.
Conclusions
In summary, we created an immune score-based risk signature with preferable risk stratification and prognostic prediction capacities in patients with OSCC. The immune score-base signature reflected characteristics of the immune landscape of OSCC. It is hoped that the immune score-based risk signature may become a useful tool for clinicians to decide appropriate treatment options for individual OSCC patients.
Acknowledgements
The authors sincerely thank Dr. Li Gao and Dr. Xiang-Ming Wang for their assistance in computational pathology.
Footnotes
Conflict of interest
None.
Source of support: The study was supported by the funds of the Promoting Project of Basic Capacity for Young and Middle-aged University Teachers in Guangxi (2019KY0136), National Natural Science Foundation of China (NSFC81860596), Guangxi Natural Scientific Research Foundation, China (2016GXNSFAA380022) and Guangxi Degree and Postgraduate Education Reform and Development Research Projects, China (JGY2019050)
References
- 1.Bray F, Ferlay J Soerjomataram IcGlobal cancer statistics 2018. GLOBOCAN estimates of incidence and mortality worldwide for 36 cancers in 185 countries. Cancer J Clin. 2018;68(6):394–424. doi: 10.3322/caac.21492. [DOI] [PubMed] [Google Scholar]
- 2.Morris J, Gonzales CB, De La Chapa JJ, et al. The highly pure neem leaf extract, scne, inhibits tumorigenesis in oral squamous cell carcinoma via disruption of pro-tumor inflammatory cytokines and cell signaling. Front Oncol. 2019;9:890. doi: 10.3389/fonc.2019.00890. [DOI] [PMC free article] [PubMed] [Google Scholar]
- 3.Quadri MFA, Tadakamadla SK, John T. Smokeless tobacco and oral cancer in the Middle East and North Africa: A systematic review and meta-analysis. Tob Induc Dis. 2019;17:56. doi: 10.18332/tid/110259. [DOI] [PMC free article] [PubMed] [Google Scholar]
- 4.Fang C, Li Y. Prospective applications of microRNAs in oral cancer. Oncol Lett. 2019;18(4):3974–84. doi: 10.3892/ol.2019.10751. [DOI] [PMC free article] [PubMed] [Google Scholar]
- 5.Shaban M, Khurram SA, Fraz MM, et al. A novel digital score for abundance of tumour infiltrating lymphocytes predicts disease free survival in oral squamous cell carcinoma. Sci Rep. 2019;9(1):13341. doi: 10.1038/s41598-019-49710-z. [DOI] [PMC free article] [PubMed] [Google Scholar]
- 6.Valdez JA, Brennan MT. Impact of oral cancer on quality of life. Dent Clin North Am. 2018;62(1):143–54. doi: 10.1016/j.cden.2017.09.001. [DOI] [PubMed] [Google Scholar]
- 7.Peltanova B, Raudenska M, Masarik M. Effect of tumor microenvironment on pathogenesis of the head and neck squamous cell carcinoma: A systematic review. Mol Cancer. 2019;18(1):63. doi: 10.1186/s12943-019-0983-5. [DOI] [PMC free article] [PubMed] [Google Scholar]
- 8.Wang M, Zhao J, Zhang L, et al. Role of tumor microenvironment in tumorigenesis. J Cancer. 2017;8(5):761–73. doi: 10.7150/jca.17648. [DOI] [PMC free article] [PubMed] [Google Scholar]
- 9.Xie C, Ji N, Tang Z, et al. The role of extracellular vesicles from different origin in the microenvironment of head and neck cancers. Mol Cancer. 2019;18(1):83. doi: 10.1186/s12943-019-0985-3. [DOI] [PMC free article] [PubMed] [Google Scholar]
- 10.Eckert AW, Wickenhauser C, Salins PC, et al. Clinical relevance of the tumor microenvironment and immune escape of oral squamous cell carcinoma. J Transl Med. 2016;14:85. doi: 10.1186/s12967-016-0828-6. [DOI] [PMC free article] [PubMed] [Google Scholar]
- 11.Lee SL, Cabanero M, Hyrcza M, et al. Computer-assisted image analysis of the tumor microenvironment on an oral tongue squamous cell carcinoma tissue microarray. Clin Transl Radiat Oncol. 2019;17:32–39. doi: 10.1016/j.ctro.2019.05.001. [DOI] [PMC free article] [PubMed] [Google Scholar]
- 12.Galon J, Costes A, Sanchez-Cabo F, et al. Type, density, and location of immune cells within human colorectal tumors predict clinical outcome. Science. 2006;313(5795):1960–64. doi: 10.1126/science.1129139. [DOI] [PubMed] [Google Scholar]
- 13.Cao L, Che X, Qiu X, et al. M2 macrophage infiltration into tumor islets leads to poor prognosis in non-small-cell lung cancer. Cancer Manag Res. 2019;11:6125–38. doi: 10.2147/CMAR.S199832. [DOI] [PMC free article] [PubMed] [Google Scholar]
- 14.Luo J, Wang D, Zhang S, et al. BolA family member 2 enhances cell proliferation and predicts a poor prognosis in hepatocellular carcinoma with tumor hemorrhage. J Cancer. 2019;10(18):4293–304. doi: 10.7150/jca.31829. [DOI] [PMC free article] [PubMed] [Google Scholar]
- 15.Yoshihara K, Shahmoradgoli M, Martinez E, et al. Inferring tumour purity and stromal and immune cell admixture from expression data. Nat Commun. 2013;4:2612. doi: 10.1038/ncomms3612. [DOI] [PMC free article] [PubMed] [Google Scholar]
- 16.Nie SF, Zha LF, Fan Q, et al. Genetic regulation of the thymic stromal lymphopoietin (TSLP)/TSLP receptor (TSLPR) gene expression and influence of epistatic interactions between IL-33 and the TSLP/TSLPR axis on risk of coronary artery disease. Front Immunol. 2018;9:1775. doi: 10.3389/fimmu.2018.01775. [DOI] [PMC free article] [PubMed] [Google Scholar]
- 17.Watanabe N, Hanabuchi S, Marloie-Provost MA, et al. Human TSLP promotes CD40 ligand-induced IL-12 production by myeloid dendritic cells but maintains their Th2 priming potential. Blood. 2005;105(12):4749–51. doi: 10.1182/blood-2004-09-3622. [DOI] [PubMed] [Google Scholar]
- 18.Borriello F, Iannone R, Di Somma S, et al. Lipopolysaccharide-elicited TSLPR expression enriches a functionally discrete subset of human CD14(+) CD1c(+) monocytes. J Immunol. 2017;198(9):3426–35. doi: 10.4049/jimmunol.1601497. [DOI] [PubMed] [Google Scholar]
- 19.Cui X, Gao N, Me R, et al. TSLP protects corneas from pseudomonas aeruginosa infection by regulating dendritic cells and IL-23-IL-17 pathway. Invest Ophthalmol Vis Sci. 2018;59(10):4228–37. doi: 10.1167/iovs.18-24672. [DOI] [PMC free article] [PubMed] [Google Scholar]


