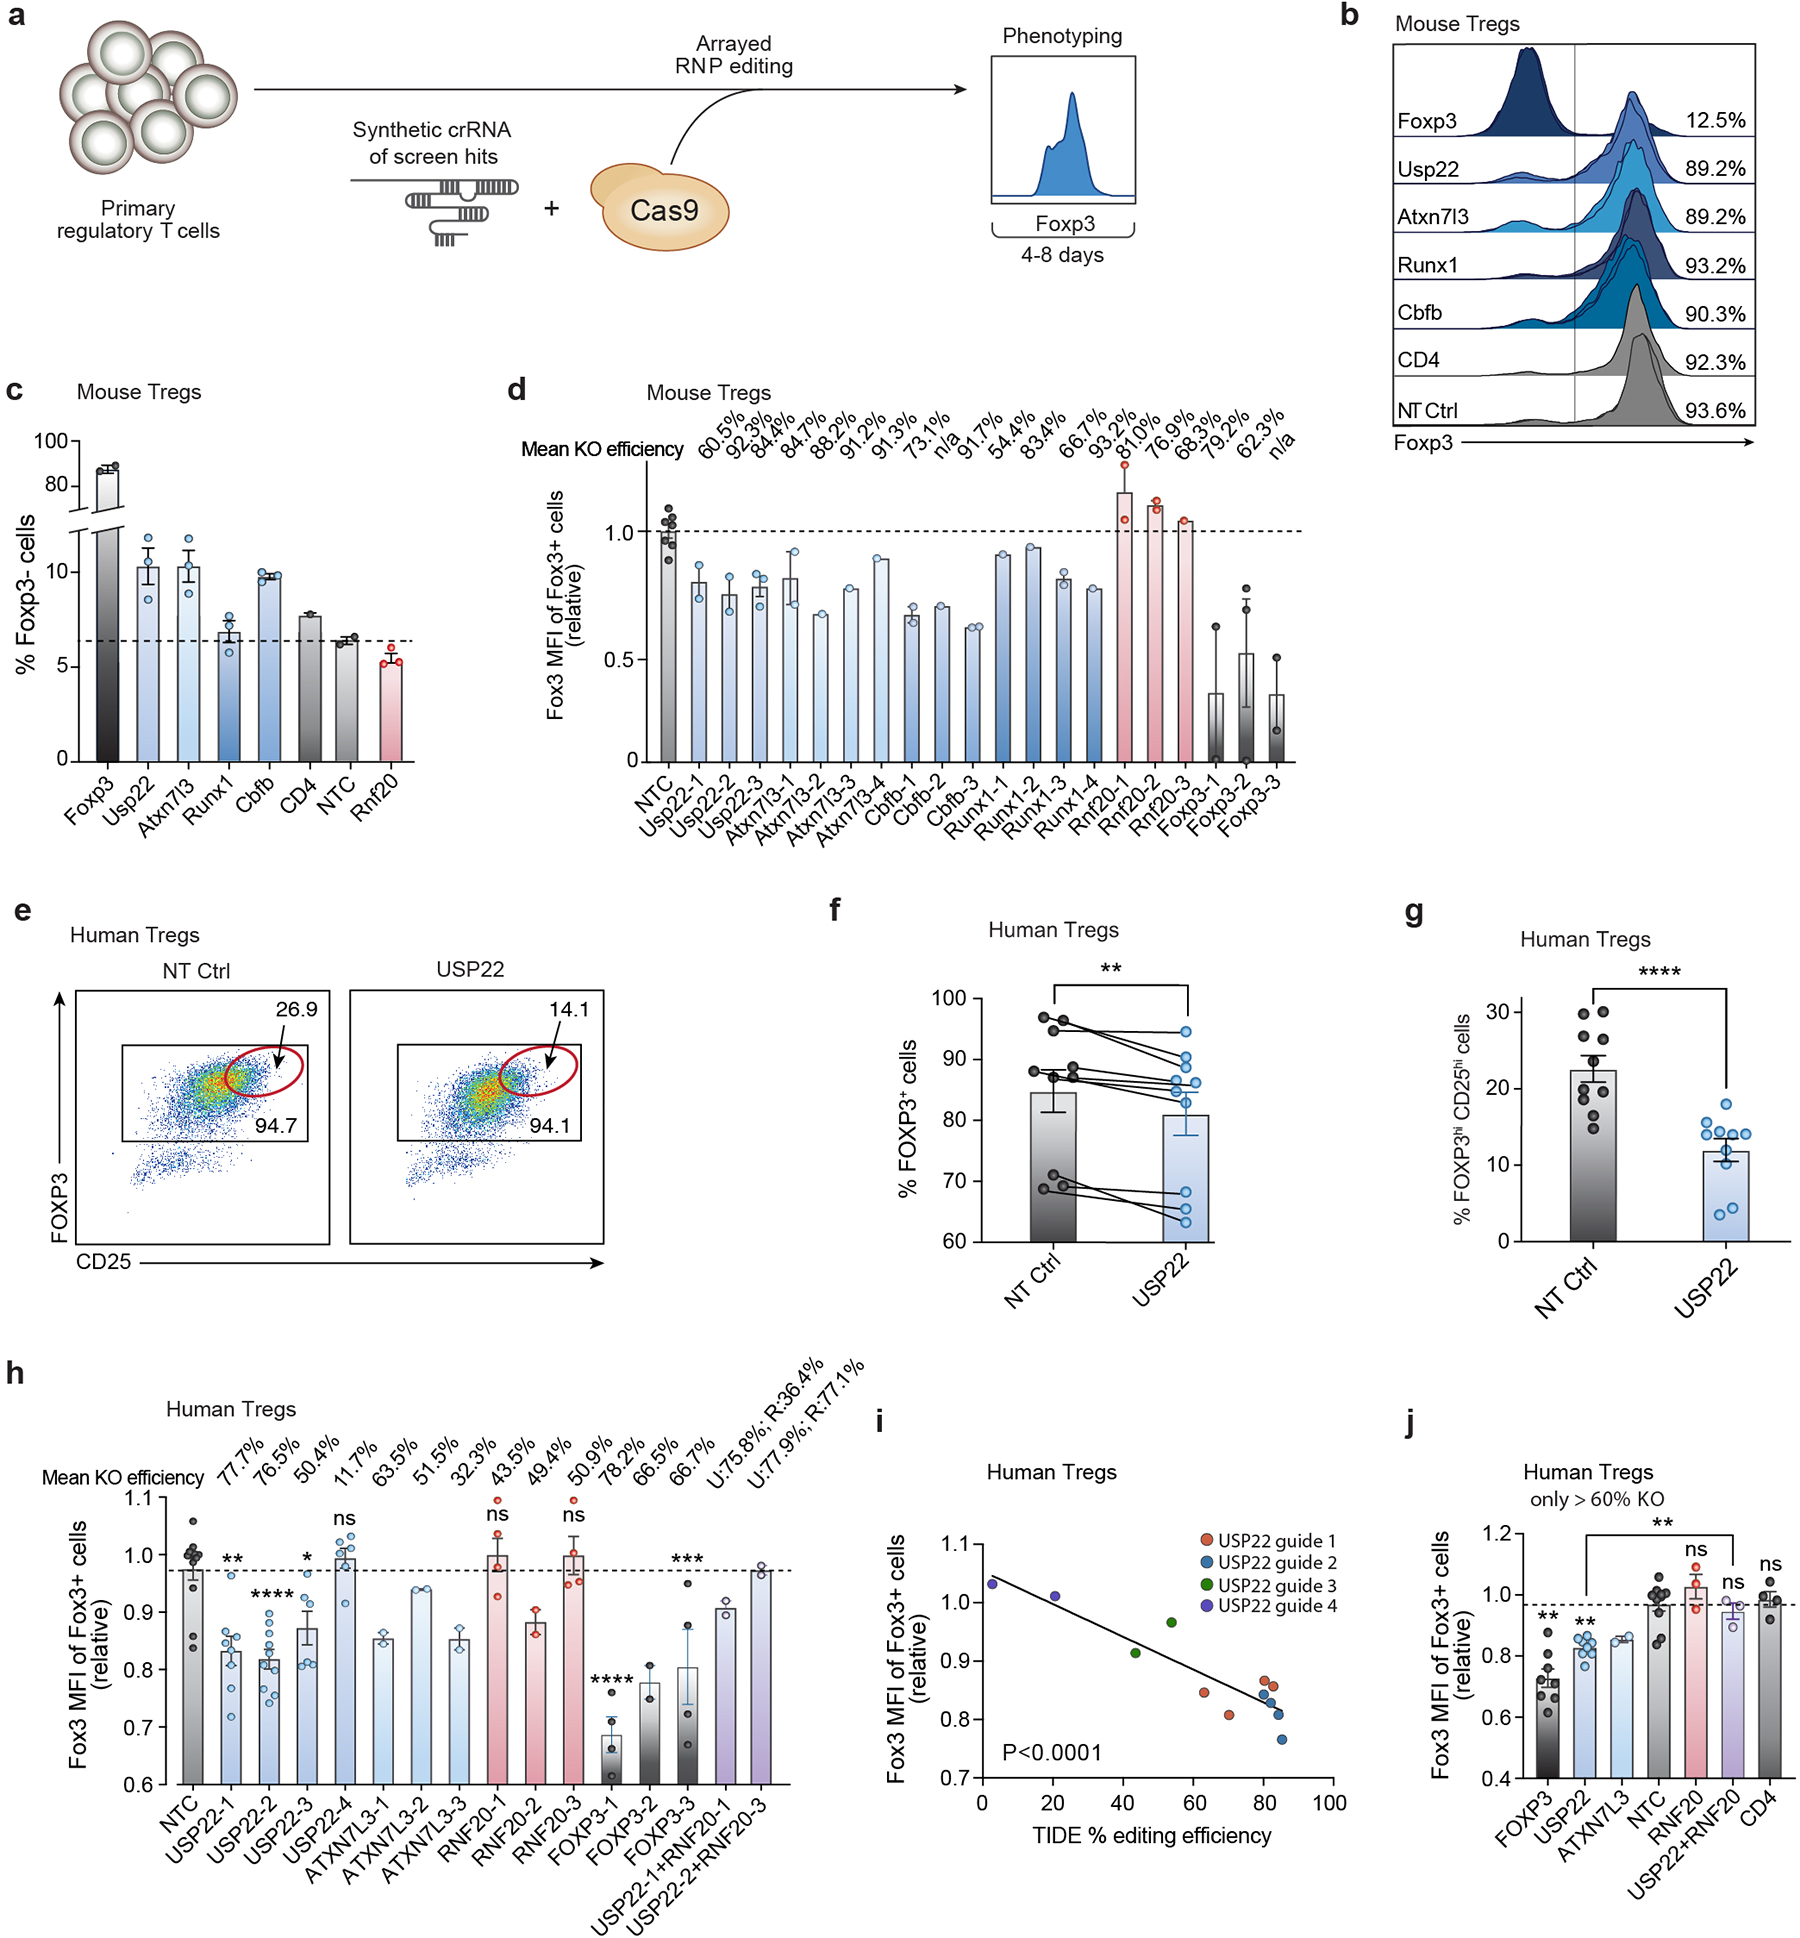
Extended Data Figure 2. Validation of Foxp3 Modulators in Primary Mouse and Human Tregs with Cas9 RNP Electroporation.

a) Overview of orthogonal validation strategy using arrayed electroporation of Cas9 RNPs in Tregs.
b) Foxp3 expression 4 days post electroporation of Cas9 RNPs in mouse Tregs as measured by flow cytometry of top screen hits. Each row shows 3 histograms layered on top of one another (1–2 for controls) with each representing effects of independent gRNAs for each target gene. Percentages shown on the right depict the average frequency of Foxp3+ cells across gRNAs targeting each gene.
c) Percentage of Foxp3- cells of live, CD4+ cells 4 days post electroporation of Cas9 RNPs in mouse Tregs as measured by flow cytometry of top screen hits. Each data point represents an independent sgRNA for each target gene.
d) Foxp3 MFI of Foxp3+ mouse Tregs for 3–4 distinct gRNAs targeting each gene paired with the mean KO efficiency (top) for each guide as determined by TIDE analysis.
e) Representative flow plots depicting FOXP3 and CD25 expression 7 days post electroporation of Cas9 RNPs targeting USP22 or NT Ctrl in human Tregs. The subpopulation of cells with the highest expression of FOXP3 and CD25 (FOXP3hiCD25hi) is highlighted with a red gate.
f) Percentage of FOXP3+ cells from human Tregs electroporated with Cas9 RNPs targeting USP22 or NT Ctrl in 10 biological replicates. Lines connect paired samples.
g) Percentage of FOXP3hiCD25hi cells from human Tregs electroporated with Cas9 RNPs targeting USP22 or NT Ctrl in 10 biological replicates.
h) FOXP3 MFI of human Tregs for 3–4 distinct gRNAs targeting each gene paired with the mean KO efficiency (top) for each guide as determined by TIDE analysis.
i) Simple linear regression of FOXP3 MFI (y-axis) by percentage of editing efficiency determined by TIDE analysis (x-axis) for 4 gRNAs targeting USP22 in 2–4 biological donors.
j) FOXP3 MFI of human Tregs electroporated with Cas9 RNPs with 2–3 distinct sgRNAs each in 2–4 biological donors; corresponding to panel h. Data points with less than 60% editing efficiency KO by TIDE analysis were excluded from the graph.
All data are presented as mean ±SEM. ns indicates no significant difference, *P < 0.05, **P < 0.01, ***P < 0.001, ****P < 0.0001. The exact sample sizes (n), p-values, statistical tests and number of times the experiment was replicated can be found in the “Statistics and Reproducibility” section.
