

SUMMARY
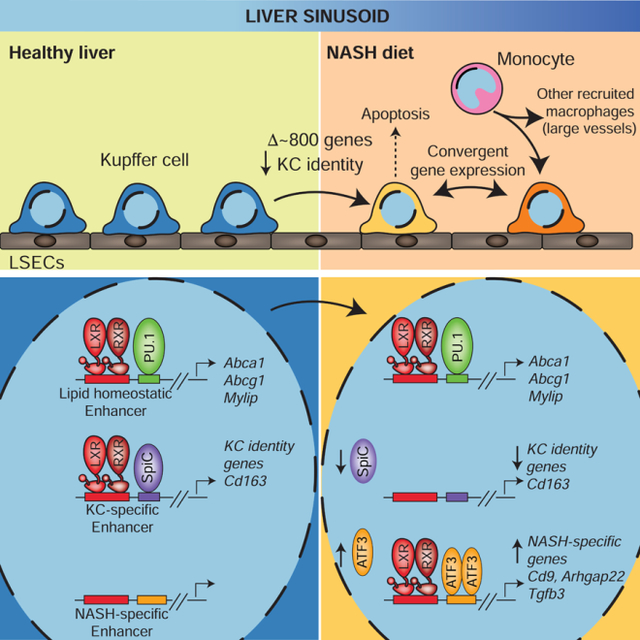
Tissue resident and recruited macrophages contribute to both host defense and pathology. Multiple macrophage phenotypes are represented in diseased tissues, but we lack deep understanding of mechanisms controlling diversification. Here we investigate origins and epigenetic trajectories of hepatic macrophages during diet-induced non-alcoholic steatohepatitis (NASH). The NASH diet induced significant changes in Kupffer cell enhancers and gene expression, resulting in partial loss of Kupffer cell identity, induction of Trem2 and Cd9 expression, and cell death. Kupffer cell loss was compensated by gain of adjacent monocyte derived macrophages that exhibited convergent epigenomes, transcriptomes and functions. NASH-induced changes in Kupffer cell enhancers were driven by AP-1 and Egr that reprogrammed LXR functions required for Kupffer cell identity and survival to instead drive a scar-associated macrophage phenotype. These findings reveal mechanisms by which disease-associated environmental signals instruct resident and recruited macrophages to acquire distinct gene expression programs and corresponding functions.
Graphical Abstract
eTOC BLURB
Kupffer cells and recruited myeloid cells contribute to the pathology of nonalcoholic steatohepatitis (NASH), but molecular mechanisms specifying their distinct identities and functions are not known. Seidman and colleagues address this problem by defining cell and disease-specific enhancer landscapes that enable inference of key transcription factors that drive myeloid cell diversity in NASH.
INTRODUCTION
Tissue resident macrophages exhibit different transcriptomes in response to environmental signals, enabling tissue-specific functions (Gautier et al., 2012; Gosselin et al., 2014; Lavin et al., 2014; Mass et al., 2016). Most tissues acquire resident macrophage populations early in development from yolk sac or fetal liver erythromyeloid progenitor (EMP) cells (Ginhoux et al., 2010; Gomez Perdiguero et al., 2015; McGrath et al., 2015; Schulz et al., 2012). In the brain and liver, EMP-derived microglia and Kupffer cells (KCs) continue as exclusive, self-renewing populations. In other tissues, EMP-derived macrophages are partially or completely replaced over time by hematopoietic stem cell (HSC) derived cells (Bain et al., 2014; De Schepper et al., 2018; Shaw et al., 2018; Yona et al., 2013).
Resident macrophages and infiltrating monocyte-derived cells contribute to a diverse array of human diseases (Holtman et al., 2017; Kiss et al., 2018; Pirzgalska and Domingos, 2018). Nonalcoholic steatohepatitis (NASH) is a form of nonalcoholic fatty liver disease (NAFLD) and develops through combinatorial actions of steatosis and growing inflammation in response to cellular stresses of the perturbed fatty liver environment (Haas et al., 2016; Hardy et al., 2016; MacHado and Diehl, 2016; Musso et al., 2016; Rinella and Sanyal, 2016; Younossi et al., 2016). During NASH or acute liver injury, new macrophages are derived from circulating monocytes (Karlmark et al., 2009; Seki et al., 2009a; Seki et al., 2009b; Tacke and Zimmermann, 2014; Zigmond et al., 2014). These recruited monocyte-derived cells can have both detrimental and supportive roles, contributing to increases in pathology during fibrosis onset, but hastening recovery when the damage-evoking agent is removed (Ju and Tacke, 2016; Karlmark et al., 2009; Mitchell et al., 2009; Seki et al., 2009a; Seki et al., 2009b; Zigmond et al., 2014). These observations raise questions as to the mechanisms underlying the phenotypic diversity of disease-associated macrophages.
Here, we define the identities, developmental origins and micro-anatomic locations of the major myeloid populations in response to a NASH-inducing diet. By sorting these cell populations and performing deep transcriptomic and epigenomic analysis, we provide evidence for combinatorial effects of diet and anatomic location on regulatory pathways and transcription factors that explain the emergence of disease-associated macrophage phenotypes.
RESULTS
Single-cell RNA-seq Defines Myeloid Diversity During Dietary NASH
To investigate immune cell heterogeneity during NASH, we performed single-cell RNA sequencing (scRNA-seq) on liver non-parenchymal cells from healthy mice fed a control diet or a NASH diet. As noted in previous studies (Hall et al., 2010; Poussin et al., 2011), C57BL/6J mice exhibited rapid weight gain when fed the NASH diet (Figure S1A) and developed steatosis, inflammation, and a modest degree of fibrosis (Figure S1B). Non-parenchymal cells from control mice and mice fed the NASH diet for 30 weeks were purified using fluorescence activated cell sorting (FACS) (Figure S1C). Over 6,000 scRNA-seq libraries that passed quality thresholds were created from these isolated cells.
The NASH diet induced qualitative transcriptional differences in cell clustering between cells from control livers and NASH livers (Figure 1A left, Figure 1B, and Table S1). Further, 3 of 17 clusters were primarily derived from cells from control diet mice while 8 clusters were primarily derived from NASH diet mice (Figure 1A, Figure S1D and Table S1). Interrogation of the most abundant and most differentially expressed (DE) transcripts in each cluster allowed a cell identity to readily be assigned to most clusters. Further studies were focused on the five most abundant macrophage clusters. (Table S1 and Figure S1E).
Figure 1: Transcriptional diversity of hepatic macrophages during NASH.

A. tSNE projections of identified graph-based cell clusters from scRNA-seq data derived from hepatic CD45+CD146− cells from control mice or mice fed a NASH diet for 30 weeks. (Left) cells are colored based on dietary condition. (Right) cells are colored based on cell identity of the five major myeloid cells identified. Data represent two independent donor mice per group.
B. Macrophage proportions from A for control mice (left) or mice with NASH (right).
C. Gene expression of normalized scRNA-seq data of genes supporting cluster identities.
D. Terminal FACS gates for purification of KCs from control mice (left), or CD11bloF4/80hiTim4+ and Tim4− cells from mice with NASH (right).
E. Terminal FACS gates for purification of Ly6Chi and Ly6Clo CD11bhiF4/80loLy6G− CX3CR1+ recruited hepatic macrophages (RM). “PMN” stands for polymorphonuclear leukocyte.
F. Comparison of myeloid clusters defined by scRNA-seq (left) and bulk RNA-seq (right) for the corresponding sorted populations. Left heatmap (100 cell per column) depicts normalized and scaled expression values for marker genes identified using a Wilcoxon rank sum test through Seurat. Right heatmap shows z-normalized row expression of each gene for RNA-seq from bulk purified cell populations from independent biological duplicates. Please see also Figure S1.
The three most abundant clusters (KC-H, healthy KC; KC-N, NASH KC; and KN-RM, named for being a recruited macrophage occupying the KC niche, as described later) had high expression of Adgre1, encoding the tissue macrophage marker F4/80, and high expression of putative KC lineage-determining transcription factors (LDTFs) Mafb and Maf, and KC-specific genes, as well as low expression of Itgam, encoding CD11b (Figure 1C and S1E) (Lavin et al., 2014). KC-H consisted almost entirely of cells from controls while KC-N and KN-RM consisted of cells from the NASH diet animals (Figure 1A, Figure 1B, and Table S1). The other two major macrophage clusters were predominantly found in NASH livers and had characteristic gene expression of previously described monocyte-derived liver macrophages (Figure 1C and S1E) (Krenkel et al., 2018). Cluster 4 (hereafter referred to as Ly6Chi-RM) expressed higher amounts of transcripts typical of Ly6Chi monocytes such as Ly6c2, Chil3, F13a1, and Fn1, while cluster 9 (hereafter referred to as Ly6Clo-RM) highly expressed Cd209a, Cd7, and Itgax (Figure S1E).
Using flow cytometry, we observed both Tim4+ and Tim4− cells in the CD11bloF4/80hi KC gate during NASH in similar proportions to KC-N and KN-RM and collected them for bulk RNA-seq and epigenomic profiling (Figure 1D). We also collected CD11bhiF4/80lo-Ly6Chi-RM and Ly6Clo-RM for RNA-seq and assay for transposase-accessible chromatin (ATAC-seq) (Buenrostro et al., 2013) (Figure 1E). RNA-seq analysis of these populations yielded concordant expression profiles to scRNA-seq when comparing Seurat marker genes, indicating that we isolated the corresponding macrophage populations defined by scRNA-seq (Figure 1F).
We next compared these mouse macrophages to human scRNA-seq populations of non-parenchymal liver cells from individuals with either advanced cirrhosis or without evident liver disease (Ramachandran et al., 2019). Using orthogonal genes to cluster the combined set of human and mouse cells under control and disease conditions resulted in 8 clusters (0–7, Figure S1F and S1G). Human livers exhibited a greater diversity of myeloid cells and, in contrast to the mouse model, all cell populations were present to some extent in individuals with or without cirrhosis. Importantly, mouse KC-H cells overlapped with human KCs (clusters 0 and 1). A key finding of the human studies was the increased presence of a ‘scar-associated macrophage’ (SAM) population in cirrhotic livers (Ramachandran et al., 2019). These cells were found to reside in close proximity to areas of fibrosis and were characterized by increased expression of TREM2 and CD9. Importantly, the cluster containing SAMs also contained substantial fractions of the NASH-associated KC-N and KN-RM cells (cluster 3), but not KC-H cells, consistent with the former cell type’s increased expression of Trem2 and Cd9 (Figure 1F). Thus, despite relatively sparse fibrosis, a SAM phenotype emerges in this model.
Ontogeny and Environment Contribute to Diversity of Myeloid Cells During NASH
We hypothesized that similar to experimental KC ablation (Bonnardel et al., 2019; Sakai et al., 2019; Scott et al., 2016), Tim4− KC-like macrophages that arise during NASH (KN-RM) may be ontogenically distinct from the embryonically-derived Tim4+ KCs (KC-N). To test this hypothesis, we performed lineage tracing experiments using Cx3cr1CreERT2; Rosa26tdTomato/+ mice (Figure S2A) (Theurl et al., 2016; Yona et al., 2013). This model labels tissue macrophages if tamoxifen is administered perinatally, while only certain macrophages such as microglia, but not KCs, are labeled if mice are pulsed during adulthood (Dick et al., 2019; Theurl et al., 2016; Yona et al., 2013). In contrast, during adulthood, tamoxifen labels peripheral monocytes and thus monocyte-derived macrophages.
Tamoxifen administration on day 1 and day 2 post-parturition resulted in ~50% labeling of embryonic KCs (Figure S2B–D). After 20 weeks on the NASH diet, nearly all tdTomato+ cells were Tim4+ KCs (KC-N) (Figure S2B–D), indicating that Tim4− KC-like macrophages (KN-RM) are not long-lived daughters of embryonic KCs. Conversely, when adult mice fed the NASH diet for 20 weeks were given tamoxifen 4 weeks or 1 week prior to sacrifice, ~90% of circulating monocytes were TdTomato+ 2 days after the final tamoxifen injection (data not shown) and more than 10% of Tim4− KC-like macrophages (KN-RM) were TdTomato+ (Figure S2C,D). We also observed a small degree of labeling of Tim4+ KCs (Figure S2C,D), which could be due to low expression of Cx3cr1 in Tim4+ KC-N cells or due to the gradual upregulation of Tim4 by recruited cells (Scott et al., 2016). Overall, these results indicate that embryonic KCs remain in the liver during development of NASH and are Tim4+, while most recruited CD11bloF4/80hi macrophages are Tim4−. These results also indicate that recruited KN-RM cells can survive at least 4 weeks in the NASH liver while Ly6Chi&lo-RMs are shorter lived.
To determine the localization of myeloid cells in the liver during NASH, immunofluorescence microscopy was performed on livers from Cx3cr1CreERT2; Rosa26tdTomato/+ mice pulsed with tamoxifen 7 days prior to tissue collection (Figure S2A 2A,B, S2E and S3A). As expected, tdTomato+ monocyte-derived cells were abundant in NASH livers but nearly absent in control livers (Figure S2E). Using multi-parameter imaging and histo-cytometry (Gerner et al., 2012), we distinguished KC-H or KC-N, KN-RM, and Ly6Chi&lo-RM in the control and NASH livers based on Tim4, F4/80 and tdTomato expression. As Ly6C histological staining could not be performed, Mgl2 was used as a surrogate marker for Ly6Chi&lo-RM, with the Ly6Chi fraction being Mgl2−, and Ly6Clo being represented by Mgl2+ (Figure 2A–C, see Figure 3G for Ly6Clo-specific expression of Mgl2). Following in situ confirmation of these myeloid cell subsets, we assessed their spatial distribution using the positional data preserved in histo-cytometry and nearest-neighbor distance analyses. The two subsets (KN-RM and Ly6Chi&lo-RM) that were increased during NASH displayed significant differences in their spatial distributions. By comparing nearest-neighbor distances from KC-N, KN-RM cells were found to be distributed significantly closer to KC-N cells than Ly6Chi&lo-RM cells (Figure 2D). In addition, the small number KN-RM cells observed in control livers were also in close proximity to KC-H cells (Figure S3B and not shown).
Figure 2: Expanded macrophage diversity during NASH is supported by monocyte recruitment and occupancy of distinct anatomical niches.

A. Confocal image of NASH liver showing E-cadherin (to demark the peri-portal regions) and tdTomato F4/80+ summed channel. Highlighted in the center by white circles are the central veins (CV). Demarked at the periphery of the liver lobule, portal-venous/arterial vessels (PV). N=3–4 mice/condition.
B. Histo-cytometry analysis of NASH liver sample. Statistical information of segmented objects (F4/80+tdTomato+ surfaces) was imported into FlowJo and subsequently gated on F4/80 and tdTomato expression to quantify KC-N, KN-RM, and Ly6Chi&lo-RM cells. Tim4 mean fluorescence intensity (MFI) for each gated population are shown in the middle panel, and Mgl2 expression on Ly6Chi&lo-RM cells macrophage is shown at right to distinguish Ly6Chi (Mgl2−) or Ly6Clo (Mgl2+) cells.
C. Confocal image of NASH liver showing distribution of rendered surfaces of KC-N, KN-RM, and Ly6Chi&lo-RM (Rec) cells. Dashed lines denote peri-portal regions as in A.
D. Distance and phenotype (KN-RM, Mgl2lo-RM, or Mgl2hi-RM) of closest neighbor to KC-N cells in NASH livers. Data pooled from n=4 mice. Wilcox Two-sided test; p < 0.001(***).
E. Distance to nearest portal or central vein vasculature (large diameter vessels defined to be greater than 15 µm in diameter) of KC-N, KN-RM, and Ly6Chi&lo-RM cells. Kruskal-Wallis with Dunn test; p < 0.001(***).
F. Zoom-in representative confocal image of NASH liver showing distribution of rendered surfaces of Mgl2lo (Ly6Chi) and Mgl2hi (Ly6Clo)-RMs. E-cadherin demarks the peri-portal regions and highlighted by white circles are CV and PV blood vessels.
G. Distance to nearest center of CV or PV of Ly6Chi and Ly6Clo RM cells (µm). Kruskal-Wallis with Dunn test; p < 0.01(**), p < 0.001.
H. Immunofluorescence (IF) image assessing in situ cell death via TUNEL staining in addition to Tim4 and F4/80 staining. Image from NASH mice; maximum intensity projection (MIP) of a 20-µm z-stack.
I. Quantification of total TUNEL+ hepatic macrophages per area (1000 µm2) in Ctrl and NASH mouse livers.
J. Nearest neighbor distance of all TUNEL+ cells to KN-RM, Ly6Chi or lo-RM and KC-N cells in NASH livers, data pooled from n=4 mice. Kruskal-Wallis with Dunn test; p < 0.001(***).
K. Temporal assessment of percentage of total CD11bloF4/80+CD146− cells that are Tim4− KN-RM from mice fed a NASH diet as indicated. Please see also Figure S2 and Figure S3.
Figure 3: Highly divergent gene expression patterns across myeloid populations in NASH.

A. Unsupervised hierarchical clustering of DE genes in the indicated cell types in control and NASH liver.
B. PCA of 2,000 most variable genes in RNA-seq data from myeloid cells in liver and blood from healthy and NASH diet fed mice, or recruited liver macrophages from Sakai et al. (Sakai et al., 2019), n = 2–3 per group.
C. Scatterplot of RNA-seq data in healthy (KC-H) or NASH (KC-N) Tim4+ KCs. DE genes identified by DESeq2 (FC > 2, p-adj < 0.05) are colored in red.
D. Comparison of NASH Tim4+ KCs (KC-N) and Tim4− Kupffer niche recruited macrophages (KN-RM).
E. Comparison of NASH Tim4− Kupffer niche recruited macrophages (KN-RM) and Ly6Chi-RM.
F. Comparison of NASH blood Ly6Chi monocytes and Ly6Chi-RM.
G. RNA-seq expression (mean TPM +/− SD) of representative genes. TPM = transcripts per kilobase million).
H. Percentage of hepatic CD45+F4/80hiCD11bloLiveSinglets from Clec4f-cre R26-iDTR−/− (n = 6) or Clec4f-cre R26i-DTR+ (n =6) mouse livers. Mice were treated with DT, allowed to rest for 4 weeks, then fed the CDAHFD diet for 4 weeks.
I. RNA-seq from whole liver tissue from Clec4f-cre R26-iDTR−/− (n = 10) or Clec4f-cre R26-iDTR+ mice (n =12) as in H. Zero DE genes (DESeq2).
J. Representative (n > 5) H&E staining of liver tissue.
K. NASH CRN scoring of stained liver sections. Scores >5 are indicative of steatohepatitis. No significant difference was identified using Kruskal-Wallis rank sum test (p = 0.71). Please see also Figure S4.
KCs reside within the hepatic sinusoids but the sub-anatomical organization of other liver macrophages during NASH is less certain (Ju and Tacke, 2016). High magnification imaging using Collagen IV to visualize the endothelial basement membrane demonstrated that KC-N and KN-RM cells resided within hepatic sinusoids in this model (Figure S3C). In contrast, Ly6Chi&lo-RM cells were predominantly not found within the liver sinusoids, but were highly enriched around both portal and central vein vasculature identifiable by the large vessel diameter (15 µm or larger) (Figure 2D and Figure 2E). Further, Ly6Chi-RM (Mgl2−) cells were bi-modally distributed around portal and central veins while Ly6Clo-RM (Mgl2+) cells were more uniformly distributed in closer proximity to central veins (Figure 2F,G). Together, these findings further supported Ly6Chi&lo-RM cells as being positionally separated from KC-N and KN-RM cells based on measurements that were independent of anatomical landmarks. These results provide evidence that KC-N and KN-RM cells reside in a similar niche within the liver sinusoids, which is spatially distinct from the anatomic positions occupied by Ly6Chi&lo-RMs.
Previous work found that DLL4 expression by liver sinusoidal endothelial cells (LSECs) is graded towards higher expression patterns in periportal zones (Halpern et al., 2018). Further, DLL4 mediated activation of RBPJ participates in driving differentiation of monocytes to Kupffer-like cells in a repopulation model (Sakai et al., 2019). During NASH, we confirmed the peri-portal (E-cadherin+) enrichment of DLL4 on LSECs (Figure S3D–E). Further, KC-N and KN-RM cells were significantly closer to DLL4+ CD138+ LSECs compared to Ly6Chi&lo-RMs (Figure S3F–G). These results provide support for DLL4 as a factor that may support niche specialization of distinct macrophage populations during NASH, consistent with its known function in instructing a KC program in recruited monocytes.
NASH Diet Induces KC Death and Replacement
KCs are considered a self-renewing population that is normally closed to HSC-derived cells (Perdiguero and Geissmann, 2015). However, the observation that the NASH diet resulted in recruitment of HSC-derived KN-RM cells raised the question of whether the NASH diet induces loss of embryonic KCs, providing an open niche. TUNEL staining of NASH livers showed apoptosis of Tim4+ KC-Ns during NASH diet but not of KC-H cells from mice fed a control diet (Figure 2H,I). In both control and NASH livers, TUNEL+ KN-RM and Ly6Chi&lo-RM cells were rare (Figure 2I). By nearest-neighbor analysis of TUNEL+ cells, KN-RM cells were significantly enriched in nearby areas as compared to Ly6Chi&lo-RM and KC-N cells (Figure 2J). Time course experiments indicated that KN-RM cells were detected by ten weeks after initiation of the NASH diet, and progressively accumulated to account for more than 50% of the KC population at 30 weeks (Figure 2K). These results indicate that Tim4Pos KCs undergo cell death during NASH, potentially resulting in partial opening of the niche and enabling repopulation by HSC-derived KN-RM cells.
Effect of NASH Diet on Resident and Recruited Myeloid Cell Transcriptomes
The ability to sort distinct populations of hepatic myeloid cells defined by scRNA-seq analysis enabled deep transcriptomic profiling of each population (Table S2). Unsupervised hierarchical clustering of 2,210 differentially expressed (DE) genes among KC-H, KC-N, KN-RM, Ly6Chi-RM, and Ly6Clo-RM tightly grouped KC-N and KN-RM and distinguished KC-H, KC-N and KN-RM cells from Ly6Chi&lo-RMs (Figure 3A). With inclusion of DE genes in blood monocytes, principal component analysis (PCA) also indicated that KC-N and KN-RM cells from NASH mice grouped most closely with KC-H cells from healthy mice (Figure 3B). After experimental KC ablation, blood Ly6Chi monocytes are recruited to the liver and rapidly differentiate into KC-like liver macrophages (Bonnardel et al., 2019; Sakai et al., 2019; Scott et al., 2016). At 14 days after KC ablation, these repopulating macrophages also grouped closely with KC-H, KC-N and KN-RM (Figure 3B). Collectively, these results suggest that monocyte-derived KN-RMs follow a similar developmental trajectory in the context of NASH to that of repopulating liver macrophages (RLMs) in the KC ablation model.
Pairwise comparisons of KC-H and KC-N cells indicated that the NASH diet had a large impact on resident KC gene expression (> 800 DE genes), consistent with scRNA-seq data (Figure 3C). Notably, fewer than 100 genes were identified as significantly altered when comparing KC-N and KN-RM KCs from mice with NASH (Figure 3D), despite their distinct origins (EMP versus HSC). In contrast, during NASH, KN-RM cells exhibited more than 2,200 DE genes in comparison to Ly6Chi-RM, despite both cells originating from an HSC precursor (Figure 3E). The divergent differentiation programs of KN-RM and Ly6Chi-RM were further reinforced by pairwise comparisons with gene expression in Ly6Chi circulating monocytes, indicating more than 2,000 DE genes in each case (Figure 3F and S4A).
Prior studies defined a set of KC identity genes that distinguish the KC from other tissue resident macrophages (Lavin et al., 2014). Twenty-eight of the genes downregulated during the transition of KC-H cells to KC-N cells in the NASH model are among this set, exemplified by Cd163 and C6 (Figure 3G and S4B). However, many KC-specific genes maintained similar expression in cells from mice on the NASH diet, including C1qa, Cd5l, Id3, and Il18bp, indicating that only a subset of the KC-specific gene expression program is altered during NASH. Furthermore, KC identity genes such as Clec4f, Vsig4, and Cdh5 were highly expressed in KN-RM but neither Ly6Chi&lo-RM population. Considering the differential spatial distribution of these cell populations, such findings suggest that the KC niche is necessary to promote induction of these genes (Figure S4B).
Gene ontology analyses of genes whose expression distinguishes KC-H, KC-N and KN-RM cells from Ly6Chi&lo-RM, (Clusters 1 and 2, Figure 3A) were consistent with a stronger pro-inflammatory and wound repair phenotype of the Ly6Chi&lo-RMs (Figure S4C), in agreement with prior studies (Heymann and Tacke, 2016). Examples of DE genes associated with the functional categories of “ROS metabolism” and “response to wounding” are illustrated in Figure 3G. Ly6Clo-RM preferentially expressed Mgl2 (CD301b), a gene recently reported to be expressed in skin macrophages that activates a specific myofibroblast population implicated in tissue repair and aging (Shook et al., 2018). In addition, we observed increased expression of Trem2 and Cd9 in both KC-N and KN-RM cells, consistent with recent observations identifying these genes as markers for macrophages associated with increased lipid burden and the presence of tissue scarring (Hill et al., 2018; Jaitin et al., 2019; Ramachandran et al., 2019; Xiong et al., 2019). Collectively, these results indicate that the NASH diet acts to reprogram the endogenous KC population and induce divergent programs of differentiation of KN-RM cells and Ly6Chi&lo-RMs.
Functional Convergence of Embryonic KCs and KN-RMs in NASH
To clarify the functional biological roles of embryonic KCs and monocyte origin KN-RM cells, we used the Clec4f-cre R26-iDTR system (Sakai et al., 2019). We treated DTR+ or DTR− mice with DT to ablate embryonic KCs and then allowed the KC niche to repopulate with monocyte precursors. After a 4-week recovery period, the mice were subjected to ad libitum feeding for 4 weeks with a rapid NASH inducing model (Matsumoto et al., 2013). Ablation of embryonic (KC-H) KCs before feeding mice the NASH diet led to increased proportions of Tim4− KN-RM cells, as expected (Figure 3H). To assess the global molecular consequence of replacing embryonic KCs with monocyte derived KN-RMs, we performed RNA-seq on total liver tissue (Figure 3I). Notably, we found no DE genes between the two groups. We also found no differences in 23 circulating inflammatory cytokines (Figure S4D). Finally, quantitative histological assessment of liver sections indicated no effect of replacing KCs with KN-RM. These results are consistent with the largely convergent transcriptomes observed in comparison of KC-N and KN-RM (Figure 3J,K).
Niche Occupancy Reprograms the Epigenetic Landscapes
To investigate mechanisms responsible for environment-specific programs of gene expression, we identified accessible chromatin defined by ATAC-seq in five populations of cells from mice with NASH: KC-N and KN-RM cells, Ly6Chi&lo-RMs, and Ly6Chi blood monocytes. Examples of ATAC-seq peaks in these five populations of cells from mice fed the NASH diet in the vicinity of the Clec4f and Itgam genes, which are highly differentially expressed in KCs compared to Ly6Chi&lo-RMs, are illustrated in Figure 4A. Genome wide comparisons of ATAC-seq peak tag counts for Ly6Clo-RM versus Ly6Chi blood monocytes are illustrated in Figure 4B and the same comparison for KN-RM and Ly6Chi blood monocytes is shown in Figure 4C. Differential regions from the five myeloid populations in NASH mice, as well as healthy KC-H cells and 24- and 48-hour RLMs after KC ablation (Sakai et al., 2019) were used for PCA illustrated as in Figure 4D. PC1, accounting for ~65% of variance, primarily distinguished KC-H, KC-N and KN-RM populations from Ly6Chi blood monocytes and Ly6Chi&lo-RM. RLMs 24 and 48 hours after KC ablation became incrementally closer to KCs along PC1, reflecting chromatin remodeling after arriving at the KC niche. PC2, accounting for ~13% of variance, primarily separated Ly6Chi blood monocytes from Ly6Chi&lo-RM.
Figure 4: Niche-specific reprogramming of epigenetic landscapes.

A. UCSC genome browser tracks of ATAC-seq signals in the vicinities of the Clec4f and Itgam genes in the indicated cell types. Bar plots to the right of each track represent the RNA-seq gene expression (mean TPM +/− SD) in each population.
B. Genome-wide comparison of normalized ATAC-seq peak tags at enhancer like regions (>3kb removed from TSS) comparing Ly6Chi blood monocytes and Ly6Clo-RM during NASH. Differential regions were identified using DESeq2 (FC > 2 and p-adj < 0.05 using independent biological duplicates).
C. Genome-wide comparison of normalized ATAC-seq peak tags at enhancer-like regions (>3kb removed from TSS) comparing open chromatin in Ly6Chi blood monocytes and KN-RM.
D. PCA of ATAC-seq data sets (N = 2–3) for the top 10,000 most variable distal (>3kb from TSS) regions in myeloid cell populations during NASH, or recruited liver macrophages (RLM) from Sakai et al. (Sakai et al., 2019).
E. De novo motifs enriched in distal open chromatin regions (>3kb from TSS) enriched in KN-RM (top), Ly6Clo-RM (bottom), or enriched in both populations (middle) compared to Ly6Chi blood monocytes during NASH. The background for motif enrichment analysis is the distal open chromatin from Ly6Chi blood monocytes.
F. Expression (mean TPM +/− SD) of KC LDTFs in the indicated cell types. Please see also Figure S5.
Hierarchical clustering of ATAC-seq data further support the relationships suggested by PCA, with KC-N and KN-RM cells exhibiting highly similar patterns of open chromatin that are distinct from the transitional patterns observed in Ly6Chi&lo-RM (Figure S5A). Based on these findings and the results of lineage tracing experiments, we considered the open chromatin regions of KN-RM and Ly6Clo-RM populations as divergent endpoints of chromatin remodeling events following entry of Ly6Chi blood monocytes into the NASH liver. ATAC-seq peaks specific for KN-RM or Ly6Clo-RM in comparison to circulating Ly6Chi monocytes (red data points in Figures 4B and 4C, respectively) indicated that approximately 75% of these peaks were specific to KN-RM or Ly6Clo-RM cells (Figure 4E). Peaks specific for KN-RM cells were highly enriched for motifs recognized by LXR and members of the MAF and TFE families (Figure 4E). In contrast, ATAC-seq peaks specific for Ly6Clo-RM cells were highly enriched for NF-κB motifs and motifs recognized by RUNX, ZEB and KLF TFs. Open chromatin regions lost from blood monocytes during acquisition of either the KC or Ly6Chi&lo -RM niche signatures (Figures 4B and 4C, blue points) were enriched for KLF and C/EBP motifs (Figure S5B,C). The open chromatin regions lost during acquisition of the KC niche additionally included motifs for RUNX and CTCF (Figure S5B).
The pattern of motif enrichment in KC-N and KN-RM cells implies that liver niche signals increase the expression and/or activities of TFs that bind to LXR, MAF and TFE motifs. Consistent with this possibility, Nr1h3 (encoding LXRα), Mafb, Tfec and Id3 (Lavin et al., 2014; Mass et al., 2016) are among a set of KC LDTFs higher expressed in KC-N and KN-RM cells than in Ly6Chi&lo-RM cells (Figure 4F and Table S2). Importantly, these TFs are highly induced in RLMs within 12 hours of entry into the open KC niche of the liver (Sakai et al., 2019). These findings further support a model in which KN-RM cells largely follow the developmental program taken by RLMs following KC depletion upon adherence to LSECs. In contrast, the lack of induction of KC LDTFs in Ly6Chi&lo-RM cells is consistent with their location outside of the sinusoidal space. NF-κB motifs are enriched in KC enhancers in comparison to other tissue resident macrophages (Sakai et al., 2019), but the particularly strong enrichment for this motif in Ly6Clo-RM cells implies that the niche occupied by these cells provides additional signals that activate NF-κB. In addition, while RUNX factors are lower in KC-N and KN-RM cells in comparison to blood Ly6Chi monocytes, their expression is maintained or increased in Ly6Chi&lo-RMs (Figure S5D). In concert, analysis of open chromatin provides evidence that the divergent patterns of gene expression observed in HSC-derived KN-RM and Ly6Chi&lo-RM cells are in part determined by whether or not they receive niche-specific signals necessary to adequately induce KC LDTFs.
NASH Diet Reprograms the KC Enhancer Landscape
We next sought to understand the basis for the altered expression of the more than 900 mRNAs during the transition of KC-H cells in the healthy liver to KC-N cells in the NASH liver (Figure 3A, C). Corresponding changes in the regulatory landscapes during this transition would potentially enable inference of TFs and upstream signaling pathways that mediate responses to the NASH diet. In contrast to changes in open chromatin observed in transition of Ly6Chi blood monocytes to KN-RM cells (Figure 4C, D), relatively few differences in open chromatin were observed comparing KC-H and KC-N cells (Figure 5A, left). The enriched motifs associated with the increased chromatin accessibility included sites for AP1 and Egr factor binding, whereas sites of decreased chromatin accessibility were enriched for PU.1 and SpiC motifs (Figure 5A right).
Figure 5: The NASH diet alters the activity states of resident KC enhancers.

A. (Left) Normalized ATAC-seq signal at all distal open chromatin regions (> 3kb from TSS) in Tim4+ KCs from healthy mice (KC-H) or Tim4+ KCs from mice on NASH diet (KC-N). Regions with significantly more chromatin accessibility during NASH are colored in red while regions with less accessibility during NASH are colored blue. (Right) De novo motif enrichment from differentially accessible chromatin region shown at right.
B. (Left) H3K27ac ChIP-seq signal around distal (> 3kb from TSS) ATAC-seq peaks in a 2,000 bp window. Differentially acetylated regions were determined using DESeq2 (FC > 2, p-adj < 0.05). Regions overlapping with KC signature enhancers (Figure S6A) are colored green. Enhancers with more acetylation during NASH are colored red, or orange if also a KC signature enhancer. Enhancers with less acetylation during NASH are colored blue, or purple if also a KC signature enhancer. (Right) Representative motif enrichment from differentially acetylated chromatin regions.
C. Summaries of percent representation of (left) differentially activated enhancers between control and NASH KCs, or (right) differentially acetylated enhancers intersected with the KC signature enhancers.
D. Ratio-ratio plot depicting fold change in H3K27ac ChIP-seq signal at enhancers (2,000 bp window centered on ATAC-seq peaks > 3kb from TSS) compared to fold change in mRNA expression of closest gene annotated to enhancer region in Tim4+ KCs in NASH diet mice (KC-N) versus healthy mice (KC-H). Points colored in blue are significantly different (FC > 2, p-adj < 0.05) for both H3K27ac ChIP-seq signal at enhancers and closest mRNA. Pearson correlation of 0.70 denotes relationship between the highlighted differential data points.
E. Log2FC of candidate TFs known to bind DNA elements found enriched in (B) for KCs from healthy mice (KC-H) and NASH mice (KC-N). *p-adj < 0.05, **p-adj < 0.01, and ***p-adj < 0.001 using DESeq2.
F. UCSC genome browser tracks of ATAC-seq or H3K27ac ChIP-seq signals in the vicinities of the indicated genes.
G. Mean TPM (LOESS fit) of the indicated genes in Tim4+ KCs from mice fed the AMLN NASH diet as indicated (0 week: n = 3; 1 week: n = 2; 4 week: n = 2; 10 week: n = 3; 20 week: n = 3; 30 week: n = 4). Please see also Figure S6.
To investigate potential changes in the transcriptional functions of these regions, we performed chromatin immunoprecipitation sequencing (ChIP-seq) for acetylation of histone H3 lysine 27 (H3K27ac) in KC-H cells in the healthy liver and KC-N cells in the NASH liver. H3K27ac is deposited by histone acetyltransferases (HATs) associated with transcriptional co-activators and is highly correlated with regulatory element activity (Creyghton et al., 2010). Out of 43,352 total distal open chromatin regions defined by ATAC-seq, 4,201 putative enhancers gained H3K27ac and 3,583 putative enhancers lost H3K27ac in response to the NASH diet (Figure 5B), affecting 18% of the enhancer-like regions overall (Figure 5C).
A comparison of H3K27ac associated with ATAC-seq peaks in KC-H cells versus in other macrophage populations enabled definition of a set of 10,452 putative KC-H-signature enhancers (Figure S6A and (Sakai et al., 2019)). A profound overlap was observed between KC signature enhancers and enhancers downregulated by the NASH diet, in total identifying 2,553 KC signature downregulated enhancers (24% of KC signature enhancers, 71% of all downregulated enhancers, Fisher’s exact test p-value <0.001) (Figure 5B,C). Conversely, only 365 KC signature enhancers were upregulated by NASH diet (3.5% of KC signature enhancers, 8.7% of all upregulated enhancers, Fisher’s exact test p-value = 1) (Figure 5B,C). Changes in H3K27ac were highly correlated with changes in expression of the nearest gene (Figure 5D). These findings suggest a preferential suppressive effect of the NASH diet on gene regulatory networks governing the function of KC enhancers, in line with the corresponding downregulation of KC identity genes (Figure S4B).
ATAC-seq and H3K27ac ChIP-seq tracks associated with the downregulated KC identity genes C6 and Cd163 illustrated substantial loss of H3K27ac at their respective promoters and distal regions of open chromatin (Figure 5F). The opposite pattern was observed at the upregulated lipid-associated macrophage (LAM) and SAM defining genes Trem2 and Cd9 (Jaitin et al., 2019; Ramachandran et al., 2019). In addition, Trem2 and Cd9 both provided examples of genes in which new regions of open chromatin are established that are associated with H3K27ac (Figure 5F), representing putative NASH-dependent enhancers. Both pre-existing and NASH-induced regions associated with Trem2 were shifted but conserved at the TREM2 locus in human microglia (Figure S6C). Additional examples of NASH-induced genes in KCs and associated gene ontologies are shown in Figure S6B.
Motif enrichment analysis of regions of open chromatin exhibiting loss of H3K27ac in response to the NASH diet showed enrichment for binding sites recognized by LXR, MAF and IRF TFs (Figure 5B right). Each of these motifs are recognized by TFs that are established or proposed to drive KC identity (Lavin et al., 2014; Mass et al., 2016; Sakai et al., 2019; Scott et al., 2018). In contrast, open chromatin regions with gained H3K27ac were enriched for de novo motifs matching AP1, NFAT, RUNX and EGR TFs (Figure 5B right).
Comparison of KC-H to KC-N cells indicated significant induction of Atf3, Fos, Jun, Egr2, and Runx1 mRNAs (Figure 5E,G), suggesting that increased expression of these TFs during NASH may contribute to activation of enhancers with corresponding DNA binding elements (Figure 5B). Conversely, mRNAs encoding a subset of KC LDTFs were downregulated in response to the NASH diet, including Spic, Irf1 and Tfec. Notably, SpiC (encoded by Spic) binds to a motif nearly identical to that recognized by PU.1 that is enriched at genomic regions exhibiting loss of open chromatin in NASH. In contrast, while LXR motifs were highly enriched at genomic regions exhibiting loss of open chromatin, expression of Nr1h3, encoding LXRα, was not affected by the NASH diet, and expression of Nr1h2, encoding LXRβ, was slightly increased (Figure 5E).
To relate changes in TF expression to global changes in gene expression, we performed RNA-seq analysis of KCs following 1, 4, 10, 20 and 30 weeks of the NASH diet. Coordinated changes in gene expression began to occur between 4 and 10 weeks of the NASH diet, with upregulation of Atf3 and Egr2 associated with increases in Trem2 and Cd9 expression and downregulation of Spic associated with decreases in Cd163 and C6 expression (Figure 5G). These findings indicate that acquisition of features corresponding to the LAM or SAM phenotype characterized by high expression of Trem2 and Cd9 requires prolonged exposure to the NASH diet, which ultimately results in substantial reprogramming of the KC regulatory landscape.
NASH Diet Selectively Impairs LXR Regulation of KC Identity Genes
The observation that LXR binding motifs were highly enriched in genomic regions exhibiting diet-induced loss of H3K27ac led to a focused analysis of LXR function. Comparison of effects of LXR deletion with effects of the NASH diet on KC gene expression indicated that a subset of LXR target genes associated with its role as a KC LDTF were strongly down-regulated by the NASH diet. For example, Cd5l, Timd4, Cd209l, Pcolce2 and Plac8 require LXRα for expression (Sakai et al., 2019) and all but Cd5l exhibited significantly reduced expression in response to the NASH diet (Figure 6A). However, many canonical LXR target genes such as Abca1, Abcg1, Mylip, and Srebf1, were significantly upregulated in response to the NASH diet (Figure 6B and Table S3), arguing against a general loss of LXR function. Targeted lipidomic analysis of known LXR ligands (Peet et al., 1998) in liver indicated that the concentration of desmosterol, which is by far the most abundant endogenous LXR ligand in the liver (Sakai et al., 2019; Yang et al., 2006), was significantly increased in the setting of the cholesterol-rich NASH diet in comparison to the control diet (Figure 6C). All other natural LXR agonists were present at much lower concentrations (data not shown). The increase in desmosterol is consistent with the upregulation of general LXR target genes involved in cholesterol homeostasis. A corresponding increase in desmosterol was reported in livers of human subjects with NASH and cirrhosis (Gorden et al., 2015).
Figure 6: Genome wide occupancy of LXR binding in KCs during NASH.

A. RNA-seq expression (mean TPM +/− SD) of LXR dependent KC signature genes. *p-adj < 0.05, **p-adj < 0.01, and ***p-adj < 0.001 using DESeq2.
B. RNA-seq expression (mean TPM +/− SD) of canonical LXR target genes.
C. Quantification of desmosterol, 24-, 25- and 27-OHC and 24,25-EC in livers from control or NASH mice. *** = p < 0.001.
D. Mean LXR ChIP-seq signal at merged IDR peaks from KC nuclei. Nuclei were sorted from Clec4f-Cre-NLS-TdTomato mice fed either a control diet (n = 2) or the NASH diet for 20 weeks (n = 2). Peaks with significantly altered LXR binding were determined using DESeq2 (FC > 2, p-adj < 0.05).
E. ATAC-seq, H3K27ac ChIP-seq and LXR ChIP-seq signals in the vicinities of the indicated genes.
F. Normalized distribution of LXR ChIP-seq density or H3K27ac ChIP-seq density at enhancers with either significantly altered LXR binding during NASH or all LXR bound enhancers.
G. (Left) De novo motif enrichment for NASH gained LXR peaks (right) or NASH lost LXR peaks (right) shown in 7D. Please see also Figure S7.
To investigate whether changes in gene expression are associated with corresponding changes in LXR binding, we performed ChIP-seq for LXRα + LXRβ in the combination of KC-N and KN-RM cells marked by sorting nuclei prepared from rapidly fixed control or NASH livers for nuclear Clec4f-tdTomato expression (Figure S7A). These studies yielded high quality data sets that could not be obtained using conventionally sorted cells and indicated that the NASH diet induced LXR binding by more than 2-fold at more than 1,700 locations and resulted in a loss of binding at more than 1000 locations (Figure 6D). Notably, DNA binding was relatively unchanged at most of the LXR binding sites associated with canonical LXR activity (e.g., Abca1), which are highly LXR-dependent but are not affected at the mRNA level by the NASH diet (Figure 6E). In contrast, LXR binding in the vicinity of Timd4, Pcolce2 and Plac8 was markedly reduced. Overall, LXR ChIP-seq peaks were preferentially depleted from KC signature enhancers (405/1046, or ~39% of total downregulated LXR peaks in enhancers, blue points, Fisher’s exact test p-value < 0.001) compared to LXR signal gained at KC signature enhancers (128/1795, or ~7% of total upregulated LXR peaks in enhancers, red points, Fisher’s exact test p-value = 1) (Figure 6D and S7B). Sites at which LXR binding was gained were associated with increased H3K27ac whereas the opposite pattern was observed at sites at which LXR binding was lost, consistent with a positive regulatory function of LXR at these locations (Figure 6F).
NASH-induced collaborative binding partners repurpose LXRs
Motif analysis of genomic regions exhibiting gain or loss of LXR binding in response to the NASH diet indicated enrichment for AP-1 or ATF, EGR, and MITF motifs at gained sites, and PU.1 or SPIC, GLIS3, and nuclear receptor half site motifs at lost sites (Figure 6G). The distance relationships of these motifs to the center of the LXR peak were consistent with collaborative binding interactions observed for other LDTFs (Heinz et al., 2015) (Figure 7A). These findings suggested the possibility that NASH-induced changes in the binding and function of LXRs were the consequence of altered collaborative binding interactions with AP-1 factors, EGRs, and members of the ETS TF family PU.1 and/or SpiC. To examine this possibility, we focused on ATF3, as it was the most highly induced AP-1 factor in response to the NASH diet (Figure 5E) and recognized the AP-1 motif enriched in NASH-specific enhancers (Figure 5B). Similar to expression amounts of Atf3, we detected ~2.5 times as many peaks in nuclei from mice with NASH (not shown). This observation correlated with an overall increased magnitude of ATF3 ChIP-seq signal during NASH (Figure 7B and S7D). Enhancers with gained ATF3 binding during NASH were enriched for de novo motifs corresponding to AP-1, EGR, and MITF2 TFs (Figure 7C and S7C).
Figure 7: Combinatorial actions of LXR and ATF3 coordinate NASH responsive gene expression in KCs during NASH.

A. Motif frequency within 500 bp of LXR binding sites described in Figure 6F.
B. Normalized ATF3 ChIP-seq signal at merged IDR peaks from KC nuclei. Nuclei were sorted from Clec4f-Cre-NLS-TdTomato mice fed either a control diet or the NASH diet for 20 weeks (n = 2). Significant ATF3 peaks had Poisson enrichment p-value < 0.0001 and FC > 4.
C. De novo motif enrichment for NASH specific ATF3 peaks as in 7B.
D. Intersection of ATF3 and/or LXR IDR ChIP-seq peaks from KC nuclei isolated from NASH diet fed mice with enhancers with increased activity during NASH (from Figure 5B).
E. Normalized distribution of ChIP-seq tag density at sites co-bound by LXRs and ATF3 indicated in 7D.
F. UCSC genome browser tracks of LXR, ATF3 and P300 ChIP-seq signals in the vicinities of the indicated genes. Peaks with NASH-gained (HOMER) binding for both LXR and ATF3 are shaded yellow and peaks with only gained ATF3 are shaded green.
G. Mean expression (TPM) for genes nearest to NASH specific LXR peaks co-bound by ATF3. DE genes identified using p-adj < 0.05 and FC > 2.
H. RNA-seq (n = 2 per group) of KN-RM from control mice or Clec4fCre-LXRαfl/flLXRβfl/fl mice fed the NASH diet for 20 weeks. DE genes identified as in G.
I. As in H for selected genes. **p-adj < 0.01; ***p-adj < 0.001. Please see also Figure S7.
Intersection of the LXR and ATF3 ChIP-seq data sets indicated ~28,000 instances of overlapping peaks (Figure S7E). Of the 1,793 LXR binding sites increased by >2-fold in NASH, ~80% overlapped with ATF3 peaks, consistent with a collaborative binding relationship. Notably, the combination of LXR and ATF3 was observed at 54% of NASH-induced enhancers (Figure 7D). The majority of these sites were occupied by LXRs under control conditions, but exhibited substantial increases in H3K27ac in the context of NASH (Figure 7E). This result suggested that diet-induced binding of ATF3 to these sites resulted in the subsequent recruitment of HATs. We therefore performed ChIP-seq for the HAT P300 and found its recruitment to the LXR and ATF3 peaks in response to the NASH diet, indicating a likely role in contribution to acetylation of H3K27 and subsequent enhancer function (Figure 7E and S7F–H). Representative examples of NASH-induced co-binding of LXRs and ATF3 or for NASH-induced binding of ATF3 at pre-existing LXR binding sites are illustrated for Trem2, Cd9, Arhgap22, and Kcnn4 in Figure 7F.
Analysis of the genes nearest to enhancers bound by ATF3 and LXR in the context of the NASH diet revealed a shift in expression distribution towards a higher mean during NASH (Figure 7G). To directly evaluate NASH-specific functions of LXRs resulting from these induced binding sites, we crossed LXRα−/−LXRβ−/− mice to the Clec4f-cre-TdTomato mouse to generate KC-N and KN-RM-specific LXRα−/−LXRβ−/− mice. The progeny were then fed either a control diet or the NASH diet for 20 weeks. Due to the near complete absence of KC-N cells in the Clec4f-cre-TdTomato LXRαfl/flLXRβfl/fl mice, comparisons were made of control and Clec4f-cre-TdTomato LXRαfl/flLXRβfl/fl KN-RMs. By comparing LXR dependent gene expression in KN-RMs under these two conditions, we identified a set of 146 NASH-specific LXR dependent genes (Figure 7H,I), 33 of which were part of the set defined in Figure 7G. Notably, LXR dependency was observed both at genes exhibiting NASH-induced binding of LXR (e.g., the SAM-associated gene Cd9), and genes exhibiting recruitment of ATF3 to pre-existing LXR binding sites (e.g., Arhgap22 and Kcnn4). Trem2 expression was reduced in LXRα−/− LXRβ−/− KN-RMs, but did not retain statistical significance after correction for multiple testing. Collectively, these findings provide evidence that NASH-induced changes in collaborative TFs result in altered binding and function of LXRs, contributing to the NASH-specific program of KC gene expression.
DISCUSSION
Here, investigation of genomic and anatomic relationships among phenotypically distinct macrophage populations in a mouse model of NASH revealed a strong association of niche occupancy with the transcriptional and phenotypic states of different EMP- and HSC-derived myeloid cells. HSC-derived macrophages observed in this model of NASH reside in at least two distinct niches associated with divergent pathways of differentiation. One pathway corresponds to the development of Ly6Chi&lo-RMs which reside proximal to large portal and central vein vessels in contact with conventional (but most likely inflamed) vascular endothelium. An alternative pathway results in the accumulation of KN-RM cells, which colocalized with KC-N in contact with the LSECs and adopted a similar pattern of gene expression. This process occurred concordantly with progressive loss of resident KC-Ns, most likely due to apoptosis. These findings provide strong evidence for instructive roles of the LSECs and the NASH diet in determining the molecular phenotypes of both KN-RM and KC-N cells. Of particular interest, we observed that a subset of KC-N and KN-RM cells acquire similarities to the recently identified SAM that reside in areas of fibrosis in human cirrhotic livers (Ramachandran et al., 2019).
The transitions of open chromatin, H3K27ac and genome-wide locations of LXRs and ATF3 provide evidence for NASH-induced alterations in expression and activities of ATF3, resulting in reprogramming KC specific functions of LXRs. In the context of relatively constant LXR expression, increased ATF3 and likely other AP-1 TFs are suggested to drive redistribution of LXR to NASH-specific enhancers as well as activate poised enhancers bound by LXRs under control conditions. The decreased expression of Spic in the context of the NASH diet may also contribute to loss of collaborative LXR binding at a subset of KC-specific enhancers. The delineation of NASH-induced regulatory elements associated with the Cd9 and Trem2 genes that are occupied by LXRs and ATF3 suggest roles of these TFs in establishing the SAM and/or LAM phenotypes. A key remaining question is to determine whether the altered functions of LXRs in KCs are pathogenic or represent an adaptive response to the NASH diet.
Overall, these studies are consistent with a model in which distinct microenvironments within the NASH liver drive divergent patterns of differentiation of resident and infiltrating cells by remodeling the open chromatin landscapes of recruited monocytes and altering the activities of pre-existing enhancers of the resident KC population. The inference of TFs and upstream signaling pathways associated with these distinct cell populations provides a basis for understanding how disease-promoting environmental signals instruct resident and recruited macrophages to acquire distinct pathogenic programs of gene expression. Application of the methods utilized in this study should prove valuable in gaining a better understanding how distinct myeloid phenotypes are established in other disease contexts.
STAR Methods
Lead Author
Further information and requests for resources and reagents should be directed to and will be fulfilled by the Lead Contact, Christopher K. Glass (ckg@ucsd.edu).
RESOURCE AVAILABILITY
Materials Availability
This study did not generate new unique reagents.
Data and Code Availability
The datasets generated during this study are available at GEO GSE128334.
EXPERIMENTAL MODEL AND SUBJECT DETAILS
Mice
Mice used in this study were bred and maintained in the Glass laboratory vivarium on the C57BL/6J background or were C57BL/6J sourced directly from Jackson laboratories. Creation and validation of the Clec4f-Cre-tdTomato mice, which express a T2A cleavable polypeptide of Cre coupled to TdTomato with a nuclear localization sequence in the 3’UTR of Clec4f, was describe elsewhere (Sakai et al., 2019). The Clec4f-Cre-tdTomato mice are available at The Jackson Laboratory as Stock No. 033296. Cx3cr1 driven inducible lineage tracing was performed by crossing B6.129P2(Cg)-Cx3cr1tm2.1(cre/ERT2)Litt/WganJ (Jackson stock no. 021160) mice to B6.Cg-Gt(ROSA)26Sortm14(CAG-tdTomato)Hze/J (Jackson stock no. 007914) mice. Progeny were injected on days 1 and 2 of life with 50 µg then 75 µg tamoxifen dissolved in corn oil and ethanol. To label monocyte lineage cells, adult mice were injected via the intraperitoneal route 1 week prior to euthanasia for 5 consecutive days with 75 mg/kg tamoxifen dissolved in corn oil and ethanol. Nr1h2fl/fl and Nr1h3fl/fl mice were provided by the lab of Pierre Chambon and crossed to Clec4f-Cre-tdTomato mice at UCSD. All animals were maintained and all procedures performed in accordance with an approval animal study protocol meeting AALAC standards.
NASH-Model Diets
Mice are fed for up to 30 weeks with a NASH-model diet (Research Diets, D09100301) composed of 40 kcal% fat from vegetable shortening, 20 kcal% from fructose, and 2% cholesterol by mass, or a custom defined control diet (Research Diet, D15100601) composed of 10% kcal from fat with 50 g inulin (a dietary fiber) per 4,057 kcal.
Diphtheria toxin (DT)-mediated depletion of Kupffer cells
Mice expressing diphtheria toxin receptors (DTR) in Kupffer cells were produced by crossing Clec4f-cre-tdTomato mice to Rosa26-Lox-Stop-Lox-DTR mice (Rosa26-iDTR, The Jackson Laboratory, Stock No.007900) (Buch et al., 2005) and depleted of Kupffer cells by a single intraperitoneal administration of 200ng Diphtheria toxin from Corynebacterium diphtheriae (Sigma Cat#D0564) 8 weeks before sorting liver macrophages. Clec4f-cre-tdTomato-positive DTR-negative mice were used as control. All mice were fed CDAHFD diet (Research Diets, A06071302) (Matsumoto et al., 2013) for 4 weeks prior to sorting. Upon harvesting, plasma was saved for multiplex assessment of an inflammatory cytokine panel. Whole liver pieces were processed for histology and hematoxylin and eosin stained sections were scored by a board certified pathologist for steatohepatitis using the NASH CRN scoring system (Kleiner et al., 2005).
METHOD DETAILS
Microscopy and Histo-Cytometry
Livers were perfused with 2% PFA and fixed using 0.5% BD fix/perm buffer for 12 hours, dehydrated in 30% sucrose, and subsequently embedded in OCT freezing media (Sakura Finetek). 20 µm sections were made with a Leica cryostat and blocked with a blocking buffer containing 1% Fc-Block (anti-CD16/32), 1% BSA, and 0.3% Triton X-100 for 3 hours. Sections were stained with directly conjugated antibodies or appropriate primary and secondary antibodies for 5 hours at room temperature or overnight at 4 °C, in a humidified chamber. The following antibodies were used for staining: anti-F4/80 (BM8), anti-Collagen IV (Rabbit), anti-Tim4, anti-CD138. The following secondaries were used: goat anti-rabbit (Invitrogen). Sections were mounted with Flouromount G (Southern Biotech, Cat# 0100–01) and images were acquired on a Leica SP8 confocal microscope (40x objective), and subsequent analysis performed using Imaris software (Bitplane), and R-studio (spatstat package used for nearest neighbor analyses) (Baddeley et al., 2016). Histo-cytometry analysis was performed as previously described (Gerner et al., 2012). In short, surfaces were created for F4/80 and tdTomatoPos cells and mean fluorescence intensity (MFI) for all channels were obtained using Imaris. Objects were then exported into FlowJo 10.3 (TreeStar Inc.) and later analyzed with Prism (Graphpad). For detection of in situ cell death (TUNEL staining), staining was performed using the supplier’s protocol (Sigma-Roche). In brief, the tissue was blocked and stained with primary and secondary antibodies (as outlined above). Cells were permeabilized with 0.1% Triton for 20 min at 4C. Tissue sections then were washed gently three times with PBS (5 min each) and dried briefly. The enzyme-probe buffer solution was then added for 1hr at 37C in dark. The tissue was subsequently washed gently three times with PBS (5 min each) and mounted, then imaged.
Nuclei Sorting
Mice were humanely euthanized by exposure to CO2, then briefly perfused with HBSS without Ca++ or Mg++ supplemented with 0.5mM EGTA, 0.5mM EDTA, and 20mM HEPES. Perfusions were then switched sequentially to 1 mg/ml disuccinimidyl glutarate in PBS for 30 minutes, then 1% formaldehyde in PBS for 10 minutes. Finally, the fixation was quenched by perfusion with 20 ml 0.125M glycine. Livers were excised, finely minced with a razor, and washed twice with 20 ml ice cold NF1 buffer (10mM Tris pH 8.0, 5mM MgCl2, 0.1M sucrose, 0.5% Triton X-100) followed by centrifugation 1,200 XG for 7 minutes at 4C. Liver pellets were next suspended in NF1 buffer and homogenized using the “loose” pestle of a Dounce homogenizer for 10 strokes, followed by incubation on ice for 30 minutes. Samples were finally homogenized using the “tight” pestle of a Dounce homogenizer for an additional 10–20 strokes, with periodic assessment for released nuclei by microscopy. The homogenized liver was then strained through a 70-micron mesh strainer, centrifuged at 1,200 XG for 7 minutes at 4C, then washed once more in PBS. Finally, the homogenized liver was suspended in PBS with 2mM EDTA and passed through a 40-micron mesh strainer. Nuclei were purified by FACS using a Sony SH800 based on TdTomato expression and forward scatter. Acquired nuclei were snap frozen in a dry ice ethanol bath and stored at −80C prior to use in ChIP-seq experiments.
Cell Sorting and Flow Cytometry
Mice were humanely euthanized by exposure to CO2 and liver non-parenchymal cells processed for fluorescence activated cell sorting of Kupffer cells, with modifications from published methodology (Mederacke et al., 2015; Muse et al., 2018; Seki et al., 2007). In brief, livers were retrograde perfused for 3 min at a rate of 5–7 ml/min through the inferior vena cava with HBSS without Ca++ or Mg++ supplemented with 0.5 mM EGTA, 0.5 mM EDTA, and 20 mM HEPES. Perfusions were then switched to 40 ml of a digestion buffer, held at 37C, comprised of HBSS with Ca++ and Mg++ supplemented with 0.033 mg/ml of Liberase TM (Roche), 20 µg/ml DNaseI (Worthington), and 20 mM HEPES. Livers were then excised, minced, and digested for an additional 20 minutes in vitro at 37C with gentle rotation in 20 ml of fresh digestion buffer. The perfusion and digestion steps were performed in the presence of 1 µM flavopiridol to offset transcriptional changes associated with digestion. After tissue digestion, cells were passed through a 70-micron cell strainer and hepatocytes removed by 2 low-speed centrifugation steps at 50 X G for 2 min. Non-parenchymal cells in the supernatant were further separated from debris by pelleting for 15 min at 600 X G in 50 ml of 20% isotonic Percoll (Sigma Aldrich) at room temperature. Cells were then washed from Percoll containing buffer and suspended in 10 ml 28% OptiPrep (Sigma Aldrich) and carefully underlaid beneath 3 ml of wash buffer. The resulting gradient was centrifuged at 1,400 X G for 25 minutes at 4C with no break and cells enriched at the interface were saved and subjected to isotonic erythrocyte lysis. Enriched non-parenchymal cells were then washed, suspended in PBS, then stained for 10 minutes with Zombie NIR (BioLegend) and purified anti-CD16/32 (93, BioLegend) to label dead cells and block Fc receptors. Cells were then immunolabeled with specific antibodies of interest, washed, and sorted using a Beckman Coulter MoFlo Astrios EQ configured with spatially separated 355 nm, 405 nm, 488 nm, 561 nm, and 642 nm lasers.
Single-Cell RNA-Seq
Liver non-parenchymal cells were isolated as above and sorted using FACS on the basis of CD45+, CD146− (to exclude endothelial cells) and viability (negative for the live/dead dye Zombie NIR). The resulting purified cell preparations were washed twice with PBS and suspended in PBS supplemented with 400 µg/ml non-acetylated bovine serum albumin (Sigma Aldrich, B6917). Individual cells were then coupled to beads using the 10X Genomics Chromium controller. Single-cell sequencing libraries were prepared following the 10X Genomics Protocol using v2 chemistry and sequenced to a median depth of approximately 50,000 reads per cell using an Illumina HiSeq 2500 on rapid run. Data was mapped using Cell Ranger (10X Genomics) to mm10 and analyzed using the Seurat R toolkit for single cell genomics (Satija et al., 2015).
ATAC-Seq
Approximately 50,000 sorted cells were washed once with PBS and once with 10mM Tris pH 7.4, 10 mM NaCl, 3 mM MgCl2, and 0.1% Igepal by centrifugation at 500 X G at 4C. Cells were then suspended in 50 µl reaction buffer comprised of 25 µl Tagment DNA buffer, 2.5 µl Tagment DNA enzyme, and 22.5 µl nuclease free water, using reagents sourced from Illumina Nextera DNA Library Prep Kit (Buenrostro et al., 2013). Transposase reactions were carried out at 37C for 30 minutes and immediately DNA was purified using Zymo ChIP Clean & Concentrate columns. Resulting DNA was PCR amplified for 14 cycles using barcoding primers and resulting libraries were size selected by gel excision to 175–225 bp as described in (Link et al., 2018). Library DNA was purified, and single end sequenced using a HiSeq 4000 or a NextSeq 500. Metrics of sequencing data are summarized in Table S5.
Poly A RNA-Seq
Performed as published previously (Gosselin et al., 2017; Oishi et al., 2016). Isolated cells were pelleted and put into 150 µl lysis/Oligo d(T) Magnetic Beads binding buffer and stored at −80°C until processing. mRNAs were enriched by incubation with Oligo d(T) Magnetic Beads (NEB, S1419S) and then fragmented/eluted by incubation at 94°C for 9 min. Poly A enriched mRNA was fragmented, in 2x Superscript III first-strand buffer with 10mM DTT (Invitrogen), by incubation at 94°C for 9 minutes, then immediately chilled on ice before the next step. The 10 µL of fragmented mRNA, 0.5 µL of Random primer (Invitrogen), 0.5 µL of Oligo dT primer (Invitrogen), 0.5 µL of SUPERase-In (Ambion), 1 µL of dNTPs (10 mM) and 1 µL of DTT (10 mM) were heated at 50°C for three minutes. At the end of incubation, 5.8 µL of water, 1 µL of DTT (100 mM), 0.1 µL Actinomycin D (2 µg/µL), 0.2 µL of 1% Tween-20 (Sigma) and 0.2 µL of Superscript III (Invitrogen) were added and incubated in a PCR machine using the following conditions: 25°C for 10 minutes, 50°C for 50 minutes, and a 4°C hold. The product was then purified with RNAClean XP beads according to manufacturer’s instruction and eluted with 10 µL nuclease-free water. The RNA/cDNA double-stranded hybrid was then added to 1.5 µL of Blue Buffer (Enzymatics), 1.1 µL of dUTP mix (10 mM dATP, dCTP, dGTP and 20 mM dUTP), 0.2 µL of RNAse H (5 U/µL), 1.05 µL of water, 1 µL of DNA polymerase I (Enzymatics) and 0.15 µL of 1% Tween-20. The mixture was incubated at 16°C for 1 hour. The resulting dUTP-marked dsDNA was purified using 28 µL of Sera-Mag Speedbeads (Thermo Fisher Scientific), diluted with 20% PEG8000, 2.5M NaCl to final of 13% PEG, eluted with 40 µL EB buffer (10 mM Tris-Cl, pH 8.5) and frozen at −80°C. The purified dsDNA (40 µL) underwent end repair by blunting, A-tailing and adapter ligation as previously described (Heinz et al., 2010) using barcoded adapters (NextFlex, Bioo Scientific). Libraries were PCR-amplified for 9–14 cycles, size selected by gel extraction, quantified using a Qubit dsDNA HS Assay Kit (Thermo Fisher Scientific) and sequenced on a Hi-seq 4000 or a NextSeq 500 (Illumina, San Diego, CA) according to the manufacturer’s instructions. Metrics of sequencing data are summarized in Table S4.
Chromatin Immunoprecipitation
ChIP for H3K27ac was performed essentially as describe previously (Eichenfield et al., 2016). In brief, FACS purified cells were fixed with 1% paraformaldehyde for 10 minutes at room temperature. Next, 2.625 M glycine was added to 125 mM to quench fixation and cells were collected by centrifugation with the addition of 0.01% Tween-20 at 1,200 X G for 10 minutes at 4C. Cells were washed once with 0.01 % Tween-20 in PBS and collected by centrifugation at 1,200 X G for 10 minutes at 4C. Cell pellets were then snap frozen and stored at −80C. For ChIP reactions, cell pellets were thawed on ice and lysed in 80 µl LB3 (10 mM Tris/HCl pH 7.5, 100 mM NaCl, 1 mM EDTA, 0.5mM EGTA, 0.1% deoxcycholate, 0.5% sarkosyl, 1 × protease inhibitor cocktail, and 1 mM sodium butyrate). Lysate was sonicated using a Covaris for 12 cycles with the following setting: time, 60 seconds; duty, 5.0; PIP, 140; cycles, 200; amplitude, 0.0; velocity, 0.0; dwell, 0.0. Samples were collected and 10% Triton X-100 was added to 1% final concentration. One percent of the sonicated lysate was saved as a ChIP input. For each chromatin immunoprecipitation, aliquots of ~500,000 cells were added to 20 µl Dynabeads Protein A with 2 µg anti-H3K27ac (Active Motif) and incubated with slow rotation at 4C overnight. The following day, beads were collected using a magnet and washed three times each with wash buffer I (20 mM Tris/HCl pH 7.5, 150 mM NaCl, 1% Triton X-100, 0.1% SDS, 2 mM EDTA, and 1 × protease inhibitor cocktail) and wash buffer III (10 mM Tris/HCl pH 7.5, 250 mM LiCl, 1% Triton X-100, 0.7% Deoxycholate, 1 mM EDTA, and 1 × protease inhibitor cocktail). Beads were then washed twice with ice cold 10 mM Tris/HCl pH 7.5, 1 mM EDTA, 0.2% Tween-20. Sequencing libraries were prepared for ChIP products while bound to the Dynabeads Protein A initially suspended in 25 µl 10 mM Tris/HCl pH 8.0 and 0.05% Tween-20.
For ATF3, LXR, and P300 ChIP-seq, FACS purified Kupffer cell nuclei were resuspended in wash buffer (10mM HEPES/KOH pH7.9, 85mM KCl, 1mM EDTA, 0.2% IGEPAL CA-630, 1x protease inhibitor cocktail (Sigma), 1 mM PMSF) for 5 minutes on ice. Nuclei were spun down and resuspended in 130 µl RIPA-NR1 lysis buffer (20 mM Tris/HCl pH7.5, 1 mM EDTA, 0.5 mM EGTA, 0.1% SDS, 0.4% Na-Deoxycholate, 1% NP-40 alternative, 0.5 mM DTT, 1x protease inhibitor cocktail (Sigma), 1 mM PMSF) and chromatin was sheared by sonication. Samples were sonicated in a 96 Place microTUBE Rack (Covaris cat#500282) using a Covaris E220 for 18 cycles with the following setting: time, 60 seconds; duty, 5.0; PIP, 140; cycles, 200; amplitude, 0.0; velocity, 0.0; dwell, 0.0. Samples were recovered and spun down at max speed, 4°C for 10 minutes. 1% supernatant was taken as input DNA and remaining supernatant was transferred to PCR strips and brought up to a volume of 200 µl using RIPA-NR1 lysis buffer (20 mM Tris/HCl pH7.5, 1 mM EDTA, 0.5 mM EGTA, 0.1% SDS, 0.4% Na-Deoxycholate, 1% NP-40 alternative, 0.5 mM DTT, 1x protease inhibitor cocktail (Sigma), 1 mM PMSF). 30 µl Dynabeads Protein A/G coated with the indicated ATF3 antibodies (2 µg Cell Signaling D2Y5W; 1 µg Invitrogen PA5–36244), 2 µg each of the indicated LXR specific antibodies (Santa Cruz Biotechnology: sc-1000X, sc-133221X, sc-271064X), or the indicated P300 antibodies (2 µg Sigma Millipore RW128, 2 µg Diagenode C15200211), were added to the sample, and immunoprecipitation was carried out with slow rotation at 4°C overnight. Beads were then collected using a magnet and washed with 175 µl ice cold buffer as indicated by incubating samples on ice for 3 minutes: 3 times RIPA-NR1 lysis buffer (20 mM Tris/HCl pH7.5, 1 mM EDTA, 0.5 mM EGTA, 0.1% SDS, 0.4% Na-Deoxycholate, 1% NP-40 alternative, 0.5 mM DTT, 1x protease inhibitor cocktail (Sigma), 1 mM PMSF), 6 times LiCl-NR1 buffer (10 mM Tris/HCl pH7.5, 250mM LiCl, 1 mM EDTA, 0.7% Na-Deoxycholate, 1% NP-40 alternative, 1x protease inhibitor cocktail (Sigma), 1 mM PMSF), 3 times TET (10 mM Tris/HCl pH 8.0, 1 mM EDTA, 0.2% Tween-20, 1x protease inhibitor cocktail (Sigma), 1 mM PMSF), and 1 time IDTE (10 mM Tris/HCl pH 8.0, 0.1 mM EDTA, 1x protease inhibitor cocktail (Sigma), 1 mM PMSF). Bead complexes were resuspended in 25 µl TT (10 mM Tris/HCl pH 8.0, 0.05% Tween-20, 1x protease inhibitor cocktail) and sequencing libraries were prepared on-bead as described below. Metrics of sequencing data are summarized in Table S6.
ChIP-Seq Library Preparation
ChIP libraries were prepared while bound to Dynabeads using NEBNext Ultra II Library preparation kit with reaction volumes reduced by half, essentially as previously described (Heinz et al., 2018). Libraries were eluted and crosslinks reversed by adding to the 46.5 µl NEB reaction 20 µl water, 4 µl 10% SDS, 4.5 µl 5M NaCl, 3 µl 0.5 M EDTA, and 1 µl 20 mg/ml proteinase K, followed by incubation at 55C for 1 hour and 65C for 30 minutes to overnight in a thermal cycler. Dynabeads were removed from the library using a magnet and libraries cleaned by adding 2 µl SpeedBeads 3 EDAC in 61 µl 20% PEG 8000/1.5 M NaCl, mixing well, then incubating at room temperature for 10 minutes. SpeedBeads were collected on a magnet and washed two times with 150 µl 80% ethanol for 30 seconds. Beads were collected and ethanol removed following each wash. After the second ethanol wash, beads were air dried and DNA eluted in 25 µl 10 mM Tris/HCl pH 8.0 and 0.05% Tween-20. DNA was amplified by PCR for 14 cycles in a 50 µl reaction volume using NEBNext Ultra II PCR master mix and 0.5 µM each Solexa 1GA and Solexa 1GB primers. Libraries were cleaned up with SpeedBeads as above using 36.5 µl 20% PEG 8000/1.5 M NaCl and 2 µl SpeedBeads. After ethanol washing and drying, PCR amplified libraries were eluted from the SpeedBeads using 20 µl 10 mM Tris/HCl pH 8.0 and 0.05% Tween-20. Next, libraries were size selected 250–500 bp using gel extraction using 10% TBE acrylamide gels. Libraries were single-end sequenced using either a HiSeq 4000 or a NextSeq 500 to a depth of 10–20 million reads. Metrics of sequencing data are summarized in Table S6.
Lipid Measurements
Livers were processed at the University of Texas Southwestern Medical Center for oxysterol and lipid metabolite analysis by LC-MS as previously described in full (www.lipidmaps.org/protocols/index.html).
QUANTIFICATION AND STATISTICAL ANALYSIS
Sequencing Data Analysis:
Preprocessing:
FASTQ files from sequencing experiments were mapped to the mouse mm10 genome. STAR with default parameters was used to map RNA-seq experiments (Dobin et al., 2013). Bowtie2 with default parameters was used to map ATAC-seq and ChIP-seq experiments (Langmead and Salzberg, 2012). HOMER was used to convert aligned reads into “tag directories” for further analysis (Heinz et al., 2010).
RNA-seq:
Each experiment was quantified using the “analyzeRepeats” script of HOMER. To generate a table of raw read counts, the parameters -count exons -condenseGenes -noadj were used. To generate a table of TPM values, the parameters -count exons -condenseGenes -tpm were used. The TPM values were further processed by log2(TPM+1). DE genes were identified using raw sequencing read counts by DESeq2 (Love et al., 2014) analysis through the “getDifferentialExpression” HOMER command at p-adj (adjusted p value) < 0.05 and FC (fold change) > 2. Gene ontology analysis was performed using Metascape (Tripathi et al., 2015).
IDR analysis:
ChIP-seq experiments were performed in replicate with corresponding input experiments. Peaks were called with HOMER for each tag directory with relaxed peak finding parameters -L 0 -C 0 -fdr 0.9 against the corresponding input directory. For ATAC-seq, no inputs were used and peaks were called with parameters -L 0 -C 0 –fdr 0.9 -minDist 200 -size 200. IDR (Li et al., 2011) was used to test for reproducibility between replicates, and only peaks with IDR < 0.05 were used for downstream analysis. The pooled tag directory from two replicates was used for track visualization.
ATAC-seq and ChIP-seq analysis:
To quantify transcription factor (TF) binding and chromatin accessibility, peak files were merged with HOMER’s mergePeaks and annotated with raw tag counts with HOMER’s annotatePeaks using parameters -noadj, -size given. To annotate H3K27ac signal around ATAC-seq peaks the parameter -size 2000 was used. Subsequently, DESeq2 (Love et al., 2014) was used to identify the differentially bound LXR, H3K27ac signal or chromatin accessibility with FC > 2 and p-adj < 0.05. Data for ATF3 binding in control or NASH conditions did not come from similar distributions. Thus, to identify differential ATF3 binding, we used HOMER “getDifferentialPeaks” with default criteria (4-fold enrichment over background tag count; poisson enrichment p-value < 0.0001 over background tag count).
Motif enrichment:
To identify motifs enriched in peak regions over the background, HOMER’s motif analysis (findMotifsGenome.pl) including known default motifs and de novo motifs was used. The background sequences were either from random genome sequences or from peaks from the comparing condition indicated in the main text and in the figure legends.
Data visualization:
The UCSC genome browser (Kent et al., 2002) was used to visualize ChIP-seq and ATAC-seq data.
Supplementary Material
Table S1. ScRNA-seq cluster identity genes related to Figure 1.
KEY RESOURCES TABLE
| REAGENT or RESOURCE | SOURCE | IDENTIFIER |
|---|---|---|
| Antibodies | ||
| H3K27ac | Active Motif | 39133; RRID: AB_2561016 |
| LXRα/β | Santa Cruz Biotechnology | sc-1000X; RRID: AB_632067 |
| LXRβ | Santa Cruz Biotechnology | sc-133221X RRID: AB_2154783 |
| LXRα/β | Santa Cruz Biotechnology | sc-271064X RRID: AB_10611071 |
| ATF3 | Cell Signaling | D2Y5W |
| ATF3 | Invitrogen | PA5–36244; RRID: AB_2553436 |
| P300 | Sigma Millipore | RW128 |
| P300 | Diagenode | C15200211 |
| Anti-mouse/human CD11b BUV395 (clone m1/70) | BD Biosciences | 565976; RRID: none |
| Anti-mouse/human CD11b PE/Cy7 (clone M1/70) | BioLegend | 101216; RRID: AB_312799 |
| Anti-Mouse CD146 BUV395 (clone ME-9F1) | BD Biosciences | 740330; RRID: none |
| Anti-Mouse CD16/32 (clone 93) | BioLegend | 101302; RRID: AB_312801 |
| Anti-Mouse CD45 Alexa488 (clone 30F11) | BioLegend | 103122; RRID: AB_493531 |
| Anti-Mouse CD45 Alexa647 (clone 30F11) | BioLegend | 103124; RRID: AB_493533 |
| Anti-Mouse CD45 BB515 (clone 30-F11) | BD Biosciences | 564590; RRID: none |
| Anti-Mouse Cx3cr1 A647 (clone SA011F11) | BioLegend | 149004: RRID: AB_2564273 |
| Anti-Mouse F4/80 BV421 (clone BM8) | BioLegend | 123132; RRID: AB_11203717 |
| Anti-Mouse F4/80 PE (clone BM8) | BioLegend | 123110; RRID: AB_893486 |
| Anti-Mouse Ly6C BV785 (clone HK1.4) | BioLegend | 128041; RRID: AB_2565852 |
| Anti-Mouse Ly6G BV650 (clone 1A8) | BioLegend | 127641; RRID: AB_2565881 |
| Anti-Mouse Ly6G FITC (clone 1A8) | BioLegend | 127606; RRID: AB_1236494 |
| Anti-Mouse Tim4 Alexa647 (clone RMT4–54) | BioLegend | 127641; RRID: AB_2271648 |
| Anti-Mouse Tim4 PE (clone RMT4–54) | BioLegend | 130008; RRID: AB_2201843 |
| Anti-Mouse CD138 BV421 (clone 281–2) | BioLegend | 142523; RRID: AB_2565621 |
| Anti-Mouse F4/80 BV480 (clone T45–2342) | BD Biosciences | 565635; RRID: AB_2739313 |
| Anti-Mouse Tim4 Alexa647 (clone F31–5G3) | BioLegend | 129907; RRID: AB_1227797 |
| Anti-Collagen IV (polyclonal rabbit antibody) | Abcam | ab6586; RRID: AB_305584 |
| Anti-Rabbit Alexa700 (polyclonal goat antibody) | Invitrogen | A-21038; RRID: AB_2535709 |
| Anti-Mouse DLL4 (polyclonal goat antibody) | R&D | AF1389 |
| Bacterial and Virus Strains | ||
| Biological Samples | ||
| Chemicals, Peptides, and Recombinant Proteins | ||
| KOD Xtreme Hot Start DNA polymerase | Sigma | Cat#71975 |
| KAPA SYBR FAST qPCR Master mix (2X) | Kapa Biosystems | Cat#07959427001 |
| Dynabeads Protein A | Thermo Fisher Scientific | Cat#10002D |
| Dynabeads Protein G | Thermo Fisher Scientific | Cat#10004D |
| SpeedBeads magnetic carboxylate modified particles | GE Healthcare | Cat#65152105050250 |
| TRIzol Reagent | Thermo Fisher Scientific | Cat#15596018 |
| Formaldehyde | Thermo Fisher Scientific | Cat#BP531–500 |
| Disuccinimidyl glutarate | ProteoChem | Cat#c1104–100mg |
| Oligo d(T)25 Magnetic Beads | NEB | Cat#S1419S |
| DTT | Thermo Fisher Scientific | Cat#P2325 |
| SUPERase-In | Ambion | Cat#AM2696 |
| Oligo dT primer | Thermo Fisher Scientific | Cat#18418020 |
| Agencourt RNA Clean XP Beads | Beckman Coulter | Cat#A63987 |
| 10 X Blue Buffer | Enzymatics | Cat#P7050L |
| DNA polymerase I | Enzymatics | Cat#P7050L |
| Random primers | Thermo Fisher Scientific | Cat#48190011 |
| SuperScript III Reverse Transcriptase | Thermo Fisher Scientific | Cat#18080044 |
| 5 X first-strand buffer | Thermo Fisher Scientific | Cat#18080044 |
| Actinomycin D | Sigma | Cat#A1410 |
| Liberase TM | Sigma Aldrich | Cat#5401127001 |
| DNaseI | Worthington | Cat#LS002139 |
| Flavopiridol | Sigma Aldrich | Cat#F3055 |
| Percoll | Sigma Aldrich | Cat#P1644 |
| Opti-Prep | Sigma Aldrich | Cat#D1556 |
| Non-acetylated bovine serum albumin | Sigma Aldrich | Cat#B6917 |
| Zombie NIR Fixable Viability Kit | BioLegend | Cat#423106 |
| Dynabeads MyOne Silane Beads | Thermo Fisher Scientific | Cat#37002D |
| SPRIselect Reagent Kit | Beckman Coulter | Cat#B23318 |
| Primary NASH model diet | Research Diets | Cat#D09100301 |
| NASH model control diet | Research Diets | Cat#D15100601 |
| Protease inhibitor cocktail | Sigma-Aldrich | Cat#P8340 |
| Critical Commercial Assays | ||
| Chromium Single Cell 3’ Library Kit v2 | 10X Genomics | Cat#120234 |
| Chromium Single Cell 3’ Gel Bead Kit v2 | 10X Genomics | Cat#120235 |
| Chromium Single Cell A Chip Kit v2 | 10X Genomics | Cat#120236 |
| Chromium i7 Multiplex Kit | 10X Genomics | Cat#120262 |
| Direct-zol RNA MicroPrep Kit | Zymo Research | Cat#R2062 |
| Fixation/Permeabilization Solution Kit | BD Biosciences | Cat#554714 |
| NEBNext Ultra II Library Preparation Kit | NEB | Cat#E7645L |
| Nextera DNA Library Prep Kit | Illumina | Cat#15028212 |
| Qubit dsDNA HS Assay Kit | Invitrogen | Cat#Q32851 |
| SuperScript III First-Strand Synthesis System | Thermo Fisher Scientific | Cat#18080051 |
| In Situ Cell Death Detection Kit, Fluorescein | Sigma-Roche | Cat#11684795910 |
| Deposited Data | ||
| Experimental Models: Cell Lines | ||
| Experimental Models: Organisms/Strains | ||
| Mouse: C57BL/6J | The Jackson Laboratory | RRID: IMSR_JAX:000664 |
| Mouse: C57BL/6J-Clec4fem1(cre)Glass/J | Glass Lab | JAX stock #033296 |
| Mouse: Rosa26-Lox-Stop-Lox-DTR (Rosa26iDTR) | The Jackson Laboratory | RRID: IMSR_JAX:007900 |
| Mouse: B6.129P2(Cg)-Cx3cr1tm2.1(cre/ERT2)Litt/WganJ | The Jackson Laboratory | JAX stock #021160 |
| Mouse: B6.Cg-Gt(ROSA)26Sortm14(CAG-tdTomato)Hze/J | The Jackson Laboratory | JAX stock #007914 |
| Mouse Nr1h2fl/fl | Pierre Chambon Lab | NA |
| Mouse: Nr1h3fl/fl | Pierre Chambon Lab | NA |
| Oligonucleotides | ||
| Recombinant DNA | ||
| Software and Algorithms | ||
| Bowtie2 | (Langmead and Salzberg, 2012) | http://bowtie-bio.sourceforge.net/bowtie2/ |
| Cell Ranger | https://github.com/10XGenomics/cellranger | |
| FlowJo | https://www.flowjo.com/ | |
| HOMER | (Heinz et al., 2010) | http://homer.ucsd.edu/homer/ |
| Imaris | Bitplane | NA |
| Irreproducibility Discovery Rate (IDR) | (Li et al., 2011) | https://www.encodeproject.org/software/idr/ |
| Metascape | (Tripathi et al., 2015) | http://metascape.org/gp/index.html#/main/step1 |
| R package: DeSeq2 | (Love et al., 2014) | https://bioconductor.org/packages/release/bioc/html/DESeq2.html |
| R-package: Cowplot | https://CRAN.R-project.org/package=cowplot | |
| R-package: Matrix | https://CRAN.R-project.org/package=Matrix | |
| R-package: Pheatmap | https://CRAN.R-project.org/package=pheatmap | |
| R-package: RColorBrewer | https://CRAN.R-project.org/package=RColorBrewer | |
| R-package: Seurat | (Satija et al., 2015) | https://CRAN.R-project.org/package=Seurat |
| R-package: Tidyverse | https://CRAN.R-project.org/package=tidyverse | |
| STAR | (Dobin et al., 2013) | https://github.com/alexdobin/STAR |
| UCSC Genome Browser | (Kent et al., 2002) | https://genome.ucsc.edu/ |
| RStudio | RStudio | https://www.rstudio.com/ |
| Summit | Beckman Coulter | NA |
| Sony Cell Sorter Software | Sony | NA |
| Other | ||
| AMLN NASH diet | Research Diets | D09100301 |
| CDAHFD diet | Research Diets | A06071302 |
HIGHLIGHTS.
Myeloid cell diversity in NASH is associated with distinct microanatomical niches
Reprogramming of LXR activity leads to impaired Kupffer cell identify and survival
ATF3 collaborates with LXRs to promote a scar-associated macrophage phenotype
Altered enhancer landscapes enable inference of disease mechanisms
ACKNOWLEDGEMENTS
These studies were supported by NIH grants DK091183, HL088083, DK063491, and GM085764 and Fondation Leducq grant 16CVD01. JSS was supported by American Heart Association Fellowship 16PRE30980030 and NIH Predoctoral Training Grant 5T32DK007541. TDT was supported by P30 DK063491, T32DK007044, and NRSA T32CA009523. M.S. was supported by the Manpei Suzuki Diabetes Foundation of Tokyo, Japan, and the Osamu Hayaishi Memorial Scholarship for Study Abroad, Japan. X.S was supported by The American Heart Association Grant 18POST34060088. This work as also supported in part by the Intramural Research program of NIAID, NIH.
Footnotes
Publisher's Disclaimer: This is a PDF file of an unedited manuscript that has been accepted for publication. As a service to our customers we are providing this early version of the manuscript. The manuscript will undergo copyediting, typesetting, and review of the resulting proof before it is published in its final form. Please note that during the production process errors may be discovered which could affect the content, and all legal disclaimers that apply to the journal pertain.
DECLARATION OF INTEREST
J.L.W. and X.S. are named inventors on patent applications or patents related to the use of oxidation-specific antibodies that are held by UCSD. J.L.W. is a consultant to Ionis Pharm and is a scientific founder of Oxitope, Inc.
REFERENCES
- Baddeley A, Rubak E, and Turner R (2016). Spatial point patterns : methodology and applications with R (Boca Raton; London; New York: CRC Press, Taylor & Francis Group; ). [Google Scholar]
- Bain CC, Bravo-Blas A, Scott CL, Perdiguero EG, Geissmann F, Henri S, Malissen B, Osborne LC, Artis D, and Mowat AM (2014). Constant replenishment from circulating monocytes maintains the macrophage pool in the intestine of adult mice. Nat Immunol 15, 929–937. [DOI] [PMC free article] [PubMed] [Google Scholar]
- Bonnardel J, T’Jonck W, Gaublomme D, Browaeys R, Scott CL, Martens L, Vanneste B, De Prijck S, Nedospasov SA, Kremer A, et al. (2019). Stellate Cells, Hepatocytes, and Endothelial Cells Imprint the Kupffer Cell Identity on Monocytes Colonizing the Liver Macrophage Niche. Immunity 51, 638–654 e639. [DOI] [PMC free article] [PubMed] [Google Scholar]
- Buch T, Heppner FL, Tertilt C, Heinen TJ, Kremer M, Wunderlich FT, Jung S, and Waisman A (2005). A Cre-inducible diphtheria toxin receptor mediates cell lineage ablation after toxin administration. Nat Methods 2, 419–426. [DOI] [PubMed] [Google Scholar]
- Buenrostro JD, Giresi PG, Zaba LC, Chang HY, and Greenleaf WJ (2013). Transposition of native chromatin for fast and sensitive epigenomic profiling of open chromatin, DNA-binding proteins and nucleosome position. Nat Methods 10, 1213–1218. [DOI] [PMC free article] [PubMed] [Google Scholar]
- Creyghton MP, Cheng AW, Welstead GG, Kooistra T, Carey BW, Steine EJ, Hanna J, Lodato MA, Frampton GM, Sharp PA, et al. (2010). Histone H3K27ac separates active from poised enhancers and predicts developmental state. Proceedings of the National Academy of Sciences of the United States of America 107, 21931–21936. [DOI] [PMC free article] [PubMed] [Google Scholar]
- De Schepper S, Verheijden S, Aguilera-Lizarraga J, Viola MF, Boesmans W, Stakenborg N, Voytyuk I, Schmidt I, Boeckx B, Dierckx de Casterle I, et al. (2018). Self-Maintaining Gut Macrophages Are Essential for Intestinal Homeostasis. Cell 175, 400–415 e413. [DOI] [PubMed] [Google Scholar]
- Dick SA, Macklin JA, Nejat S, Momen A, Clemente-Casares X, Althagafi MG, Chen J, Kantores C, Hosseinzadeh S, Aronoff L, et al. (2019). Self-renewing resident cardiac macrophages limit adverse remodeling following myocardial infarction. Nat Immunol 20, 29–39. [DOI] [PMC free article] [PubMed] [Google Scholar]
- Dobin A, Davis CA, Schlesinger F, Drenkow J, Zaleski C, Jha S, Batut P, Chaisson M, and Gingeras TR (2013). STAR: Ultrafast universal RNA-seq aligner. Bioinformatics 29, 15–21. [DOI] [PMC free article] [PubMed] [Google Scholar]
- Eichenfield DZ, Troutman TD, Link VM, Lam MT, Cho H, Gosselin D, Spann NJ, Lesch HP, Tao J, Muto J, et al. (2016). Tissue damage drives co-localization of NF-κB, Smad3, and Nrf2 to direct Rev-erb sensitive wound repair in mouse macrophages. eLife 5, 554–562. [DOI] [PMC free article] [PubMed] [Google Scholar]
- Gautier EL, Shay T, Miller J, Greter M, Jakubzick C, Ivanov S, Helft J, Chow A, Elpek KG, Gordonov S, et al. (2012). Gene-expression profiles and transcriptional regulatory pathways that underlie the identity and diversity of mouse tissue macrophages. Nat Immunol 13, 1118–1128. [DOI] [PMC free article] [PubMed] [Google Scholar]
- Gerner MY, Kastenmuller W, Ifrim I, Kabat J, and Germain RN (2012). Histo-cytometry: a method for highly multiplex quantitative tissue imaging analysis applied to dendritic cell subset microanatomy in lymph nodes. Immunity 37, 364–376. [DOI] [PMC free article] [PubMed] [Google Scholar]
- Ginhoux F, Greter M, Leboeuf M, Nandi S, See P, Gokhan S, Mehler MF, Conway SJ, Ng LG, Stanley ER, et al. (2010). Fate mapping analysis reveals that adult microglia derive from primitive macrophages. Science 330, 841–845. [DOI] [PMC free article] [PubMed] [Google Scholar]
- Gomez Perdiguero E, Klapproth K, Schulz C, Busch K, Azzoni E, Crozet L, Garner H, Trouillet C, de Bruijn MF, Geissmann F, et al. (2015). Tissue-resident macrophages originate from yolk-sac-derived erythro-myeloid progenitors. Nature 518, 547–551. [DOI] [PMC free article] [PubMed] [Google Scholar]
- Gorden DL, Myers DS, Ivanova PT, Fahy E, Maurya MR, Gupta S, Min J, Spann NJ, McDonald JG, Kelly SL, et al. (2015). Biomarkers of NAFLD progression: a lipidomics approach to an epidemic. Journal of lipid research 56, 722–736. [DOI] [PMC free article] [PubMed] [Google Scholar]
- Gosselin D, Link VM, Romanoski CE, Fonseca GJ, Eichenfield DZ, Spann NJ, Stender JD, Chun HB, Garner H, Geissmann F, et al. (2014). Environment drives selection and function of enhancers controlling tissue-specific macrophage identities. Cell 159, 1327–1340. [DOI] [PMC free article] [PubMed] [Google Scholar]
- Gosselin D, Skola D, Coufal NG, Holtman IR, Schlachetzki JCM, Sajti E, Jaeger BN, O’Connor C, Fitzpatrick C, Pasillas MP, et al. (2017). An environment-dependent transcriptional network specifies human microglia identity. Science. [DOI] [PMC free article] [PubMed]
- Haas JT, Francque S, and Staels B (2016). Pathophysiology and Mechanisms of Nonalcoholic Fatty Liver Disease. Annu Rev Physiol 78, 181–205. [DOI] [PubMed] [Google Scholar]
- Hall D, Poussin C, Velagapudi VR, Empsen C, Joffraud M, Beckmann JS, Geerts AE, Ravussin Y, Ibberson M, Oresic M, et al. (2010). Peroxisomal and microsomal lipid pathways associated with resistance to hepatic steatosis and reduced pro-inflammatory state. Journal of Biological Chemistry 285, 31011–31023. [DOI] [PMC free article] [PubMed] [Google Scholar]
- Halpern KB, Shenhav R, Massalha H, Toth B, Egozi A, Massasa EE, Medgalia C, David E, Giladi A, Moor AE, et al. (2018). Paired-cell sequencing enables spatial gene expression mapping of liver endothelial cells. Nat Biotechnol 36, 962–970. [DOI] [PMC free article] [PubMed] [Google Scholar]
- Hardy T, Oakley F, Anstee QM, and Day CP (2016). Nonalcoholic Fatty Liver Disease: Pathogenesis and Disease Spectrum. Annu Rev Pathol Mech Dis 11, 451–496. [DOI] [PubMed] [Google Scholar]
- Heinz S, Benner C, Spann N, Bertolino E, Lin YC, Laslo P, Cheng JX, Murre C, Singh H, and Glass CK (2010). Simple Combinations of Lineage-Determining Transcription Factors Prime cis-Regulatory Elements Required for Macrophage and B Cell Identities. Molecular Cell 38, 576–589. [DOI] [PMC free article] [PubMed] [Google Scholar]
- Heinz S, Romanoski CE, Benner C, and Glass CK (2015). The selection and function of cell type-specific enhancers. Nature reviews Molecular cell biology 16, 144–154. [DOI] [PMC free article] [PubMed] [Google Scholar]
- Heinz S, Texari L, Hayes MGB, Urbanowski M, Chang MW, Givarkes N, Rialdi A, White KM, Albrecht RA, Pache L, et al. (2018). Transcription Elongation Can Affect Genome 3D Structure. Cell 174, 1522–1536 e1522. [DOI] [PMC free article] [PubMed] [Google Scholar]
- Heymann F, and Tacke F (2016). Immunology in the liver - from homeostasis to disease. Nature reviews Gastroenterology & hepatology 13, 88–110. [DOI] [PubMed] [Google Scholar]
- Hill DA, Lim HW, Kim YH, Ho WY, Foong YH, Nelson VL, Nguyen HCB, Chegireddy K, Kim J, Habertheuer A, et al. (2018). Distinct macrophage populations direct inflammatory versus physiological changes in adipose tissue. Proceedings of the National Academy of Sciences of the United States of America 115, E5096–E5105. [DOI] [PMC free article] [PubMed] [Google Scholar]
- Holtman IR, Skola D, and Glass CK (2017). Transcriptional control of microglia phenotypes in health and disease. J Clin Invest 127, 3220–3229. [DOI] [PMC free article] [PubMed] [Google Scholar]
- Jaitin DA, Adlung L, Thaiss CA, Weiner A, Li B, Descamps H, Lundgren P, Bleriot C, Liu Z, Deczkowska A, et al. (2019). Lipid-Associated Macrophages Control Metabolic Homeostasis in a Trem2-Dependent Manner. Cell 178, 686–698 e614. [DOI] [PMC free article] [PubMed] [Google Scholar]
- Ju C, and Tacke F (2016). Hepatic macrophages in homeostasis and liver diseases: from pathogenesis to novel therapeutic strategies. Cellular and Molecular Immunology 13, 316–327. [DOI] [PMC free article] [PubMed] [Google Scholar]
- Karlmark KR, Weiskirchen R, Zimmermann HW, Gassler N, Ginhoux F, Weber C, Merad M, Luedde T, Trautwein C, and Tacke F (2009). Hepatic recruitment of the inflammatory Gr1+ monocyte subset upon liver injury promotes hepatic fibrosis. Hepatology 50, 261–274. [DOI] [PubMed] [Google Scholar]
- Kent WJ, Sugnet CW, Furey TS, Roskin KM, Pringle TH, Zahler AM, and Haussler D (2002). The human genome browser at UCSC. Genome Res 12, 996–1006. [DOI] [PMC free article] [PubMed] [Google Scholar]
- Kiss M, Van Gassen S, Movahedi K, Saeys Y, and Laoui D (2018). Myeloid cell heterogeneity in cancer: not a single cell alike. Cell Immunol 330, 188–201. [DOI] [PubMed] [Google Scholar]
- Kleiner DE, Brunt EM, Van Natta M, Behling C, Contos MJ, Cummings OW, Ferrell LD, Liu YC, Torbenson MS, Unalp-Arida A, et al. (2005). Design and validation of a histological scoring system for nonalcoholic fatty liver disease. Hepatology 41, 1313–1321. [DOI] [PubMed] [Google Scholar]
- Krenkel O, Puengel T, Govaere O, Abdallah AT, Mossanen JC, Kohlhepp M, Liepelt A, Lefebvre E, Luedde T, Hellerbrand C, et al. (2018). Therapeutic inhibition of inflammatory monocyte recruitment reduces steatohepatitis and liver fibrosis. Hepatology 67, 1270–1283. [DOI] [PubMed] [Google Scholar]
- Langmead B, and Salzberg SL (2012). Fast gapped-read alignment with Bowtie 2. Nat Methods 9, 357–359. [DOI] [PMC free article] [PubMed] [Google Scholar]
- Lavin Y, Winter D, Blecher-Gonen R, David E, Keren-Shaul H, Merad M, Jung S, and Amit I (2014). Tissue-Resident Macrophage Enhancer Landscapes Are Shaped by the Local Microenvironment. Cell 159, 1312–1326. [DOI] [PMC free article] [PubMed] [Google Scholar]
- Li Q, Brown JB, Huang H, and Bickel J (2011). Measuring reproducibility of high-throughput experiments. The Annals of Applied Statistics 5, 1752–1779. [Google Scholar]
- Link VM, Duttke SH, Chun HB, Holtman IR, Westin E, Hoeksema MA, Abe Y, Skola D, Romanoski CE, Tao J, et al. (2018). Analysis of Genetically Diverse Macrophages Reveals Local and Domain-wide Mechanisms that Control Transcription Factor Binding and Function. Cell 173, 1796–1809 e1717. [DOI] [PMC free article] [PubMed] [Google Scholar]
- Love MI, Huber W, and Anders S (2014). Moderated estimation of fold change and dispersion for RNA-seq data with DESeq2. Genome Biol 15, 550. [DOI] [PMC free article] [PubMed] [Google Scholar]
- MacHado MV, and Diehl AM (2016). Pathogenesis of Nonalcoholic Steatohepatitis. Gastroenterology 150, 1769–1777. [DOI] [PMC free article] [PubMed] [Google Scholar]
- Mass E, Ballesteros I, Farlik M, Halbritter F, Gunther P, Crozet L, Jacome-Galarza CE, Handler K, Klughammer J, Kobayashi Y, et al. (2016). Specification of tissue-resident macrophages during organogenesis. Science 353. [DOI] [PMC free article] [PubMed] [Google Scholar]
- Matsumoto M, Hada N, Sakamaki Y, Uno A, Shiga T, Tanaka C, Ito T, Katsume A, and Sudoh M (2013). An improved mouse model that rapidly develops fibrosis in non-alcoholic steatohepatitis. Int J Exp Pathol 94, 93–103. [DOI] [PMC free article] [PubMed] [Google Scholar]
- McGrath KE, Frame JM, Fegan KH, Bowen JR, Conway SJ, Catherman SC, Kingsley PD, Koniski AD, and Palis J (2015). Distinct Sources of Hematopoietic Progenitors Emerge before HSCs and Provide Functional Blood Cells in the Mammalian Embryo. Cell Rep 11, 1892–1904. [DOI] [PMC free article] [PubMed] [Google Scholar]
- Mederacke I, Dapito DH, Affò S, Uchinami H, and Schwabe RF (2015). High-yield and high-purity isolation of hepatic stellate cells from normal and fibrotic mouse livers. Nature protocols 10, 305–315. [DOI] [PMC free article] [PubMed] [Google Scholar]
- Mitchell C, Couton D, Couty J-P, Anson M, Crain A-M, Bizet V, Ré L, Pol S, Mallet V, Lè Ne Gilgenkrantz H, et al. (2009). Dual Role of CCR2 in the Constitution and the Resolution of Liver Fibrosis in Mice. The American Journal of Pathology 174, 1766–1775. [DOI] [PMC free article] [PubMed] [Google Scholar]
- Muse ED, Yu S, Edillor CR, Tao J, Spann NJ, Troutman TD, Seidman JS, Henke A, Roland JT, Ozeki KA, et al. (2018). Cell-specific discrimination of desmosterol and desmosterol mimetics confers selective regulation of LXR and SREBP in macrophages. Proceedings of the National Academy of Sciences of the United States of America 115, E4680–E4689. [DOI] [PMC free article] [PubMed] [Google Scholar]
- Musso G, Cassader M, and Gambino R (2016). Non-alcoholic steatohepatitis: emerging molecular targets and therapeutic strategies. Nature Publishing Group 15. [DOI] [PubMed] [Google Scholar]
- Oishi Y, Spann NJ, Link VM, Muse ED, Strid T, Edillor C, Kolar MJ, Matsuzaka T, Hayakawa S, Tao J, et al. (2016). SREBP1 Contributes to Resolution of Pro-inflammatory TLR4 Signaling by Reprogramming Fatty Acid Metabolism. Cell Metabolism, 1–16. [DOI] [PMC free article] [PubMed]
- Peet DJ, Janowski BA, and Mangelsdorf DJ (1998). The LXRs: a new class of oxysterol receptors. Curr Opin Genet Dev 8, 571–575. [DOI] [PubMed] [Google Scholar]
- Perdiguero EG, and Geissmann F (2015). The development and maintenance of resident macrophages. Nature immunology 17, 2–8. [DOI] [PMC free article] [PubMed] [Google Scholar]
- Pirzgalska RM, and Domingos AI (2018). Macrophages in obesity. Cell Immunol 330, 183–187. [DOI] [PubMed] [Google Scholar]
- Poussin C, Ibberson M, Hall D, Ding J, Soto J, Abel ED, and Thorens B (2011). Oxidative phosphorylation flexibility in the liver of mice resistant to high-fat diet-induced hepatic steatosis. Diabetes 60, 2216–2224. [DOI] [PMC free article] [PubMed] [Google Scholar]
- Ramachandran P, Dobie R, Wilson-Kanamori JR, Dora EF, Henderson BEP, Luu NT, Portman JR, Matchett KP, Brice M, Marwick JA, et al. (2019). Resolving the fibrotic niche of human liver cirrhosis at single-cell level. Nature. [DOI] [PMC free article] [PubMed]
- Rinella ME, and Sanyal AJ (2016). Management of NAFLD: a stage-based approach. Nature Reviews Gastroenterology and Hepatology 13, 196–205. [DOI] [PubMed] [Google Scholar]
- Sakai M, Troutman TD, Seidman JS, Ouyang Z, Spann NJ, Abe Y, Ego KM, Bruni CM, Deng Z, Schlachetzki JCM, et al. (2019). Liver-Derived Signals Sequentially Reprogram Myeloid Enhancers to Initiate and Maintain Kupffer Cell Identity. Immunity 51, 655–670 e658. [DOI] [PMC free article] [PubMed] [Google Scholar]
- Satija R, Farrell JA, Gennert D, Schier AF, and Regev A (2015). Spatial reconstruction of single-cell gene expression data. Nat Biotechnol 33, 495–502. [DOI] [PMC free article] [PubMed] [Google Scholar]
- Schulz C, Gomez Perdiguero E, Chorro L, Szabo-Rogers H, Cagnard N, Kierdorf K, Prinz M, Wu B, Jacobsen SEW, Pollard JW, et al. (2012). A lineage of myeloid cells independent of Myb and hematopoietic stem cells. Science (New York, NY) 336, 86–90. [DOI] [PubMed] [Google Scholar]
- Scott CL, T’Jonck W, Martens L, Todorov H, Sichien D, Soen B, Bonnardel J, De Prijck S, Vandamme N, Cannoodt R, et al. (2018). The Transcription Factor ZEB2 Is Required to Maintain the Tissue-Specific Identities of Macrophages. Immunity 49, 312–325 e315. [DOI] [PMC free article] [PubMed] [Google Scholar]
- Scott CL, Zheng F, De Baetselier P, Martens L, Saeys Y, De Prijck S, Lippens S, Abels C, Schoonooghe S, Raes G, et al. (2016). Bone marrow-derived monocytes give rise to self-renewing and fully differentiated Kupffer cells. Nature Communications 7, 10321. [DOI] [PMC free article] [PubMed] [Google Scholar]
- Seki E, De Minicis S, Gwak G-Y, Kluwe J, Inokuchi S, Bursill CA, Llovet JM, Brenner DA, Schwabe RF, Bataller R, et al. (2009a). CCR1 and CCR5 promote hepatic fibrosis in mice. The Journal of clinical investigation 119, 1858–1870. [DOI] [PMC free article] [PubMed] [Google Scholar]
- Seki E, de Minicis S, Inokuchi S, Taura K, Miyai K, van Rooijen N, Schwabe RF, and Brenner DA (2009b). CCR2 promotes hepatic fibrosis in mice. Hepatology 50, 185–197. [DOI] [PMC free article] [PubMed] [Google Scholar]
- Seki E, De Minicis S, Osterreicher CH, Kluwe J, Osawa Y, Brenner D.a., and Schwabe RF (2007). TLR4 enhances TGF-beta signaling and hepatic fibrosis. Nature medicine 13, 1324–1332. [DOI] [PubMed] [Google Scholar]
- Shaw TN, Houston SA, Wemyss K, Bridgeman HM, Barbera TA, Zangerle-Murray T, Strangward P, Ridley AJL, Wang P, Tamoutounour S, et al. (2018). Tissue-resident macrophages in the intestine are long lived and defined by Tim-4 and CD4 expression. J Exp Med 215, 1507–1518. [DOI] [PMC free article] [PubMed] [Google Scholar]
- Shook BA, Wasko RR, Rivera-Gonzalez GC, Salazar-Gatzimas E, Lopez-Giraldez F, Dash BC, Munoz-Rojas AR, Aultman KD, Zwick RK, Lei V, et al. (2018). Myofibroblast proliferation and heterogeneity are supported by macrophages during skin repair. Science 362. [DOI] [PMC free article] [PubMed] [Google Scholar]
- Tacke F, and Zimmermann HW (2014). Macrophage heterogeneity in liver injury and fibrosis. In Journal of Hepatology, pp. 1090–1096. [DOI] [PubMed]
- Theurl I, Hilgendorf I, Nairz M, Tymoszuk P, Haschka D, Asshoff M, He S, Gerhardt LMS, Holderried TAW, Seifert M, et al. (2016). On-demand erythrocyte disposal and iron recycling requires transient macrophages in the liver. Nature Medicine 22, 945–951. [DOI] [PMC free article] [PubMed] [Google Scholar]
- Tripathi S, Pohl MO, Zhou Y, Rodriguez-Frandsen A, Wang G, Stein DA, Moulton HM, Dejesus P, Che J, Mulder LCF, et al. (2015). Meta- and Orthogonal Integration of Influenza “oMICs” Data Defines a Role for UBR4 in Virus Budding. Cell Host and Microbe 18, 723–735. [DOI] [PMC free article] [PubMed] [Google Scholar]
- Xiong X, Kuang H, Ansari S, Liu T, Gong J, Wang S, Zhao XY, Ji Y, Li C, Guo L, et al. (2019). Landscape of Intercellular Crosstalk in Healthy and NASH Liver Revealed by Single-Cell Secretome Gene Analysis. Mol Cell 75, 644–660 e645. [DOI] [PMC free article] [PubMed] [Google Scholar]
- Yang C, McDonald JG, Patel A, Zhang Y, Umetani M, Xu F, Westover EJ, Covey DF, Mangelsdorf DJ, Cohen JC, et al. (2006). Sterol intermediates from cholesterol biosynthetic pathway as liver X receptor ligands. The Journal of biological chemistry 281, 27816–27826. [DOI] [PubMed] [Google Scholar]
- Yona S, Kim KW, Wolf Y, Mildner A, Varol D, Breker M, Strauss-Ayali D, Viukov S, Guilliams M, Misharin A, et al. (2013). Fate Mapping Reveals Origins and Dynamics of Monocytes and Tissue Macrophages under Homeostasis. Immunity 38, 79–91. [DOI] [PMC free article] [PubMed] [Google Scholar]
- Younossi ZM, Blissett D, Blissett R, Henry L, Stepanova M, Younossi Y, Racila A, Hunt S, and Beckerman R (2016). The economic and clinical burden of nonalcoholic fatty liver disease in the United States and Europe. Hepatology 64, 1577–1586. [DOI] [PubMed] [Google Scholar]
- Zigmond E, Samia-Grinberg S, Pasmanik-Chor M, Brazowski E, Shibolet O, Halpern Z, and Varol C (2014). Infiltrating Monocyte-Derived Macrophages and Resident Kupffer Cells Display Different Ontogeny and Functions in Acute Liver Injury. The Journal of Immunology 193, 344–353. [DOI] [PubMed] [Google Scholar]
Associated Data
This section collects any data citations, data availability statements, or supplementary materials included in this article.
Supplementary Materials
Table S1. ScRNA-seq cluster identity genes related to Figure 1.
Data Availability Statement
The datasets generated during this study are available at GEO GSE128334.