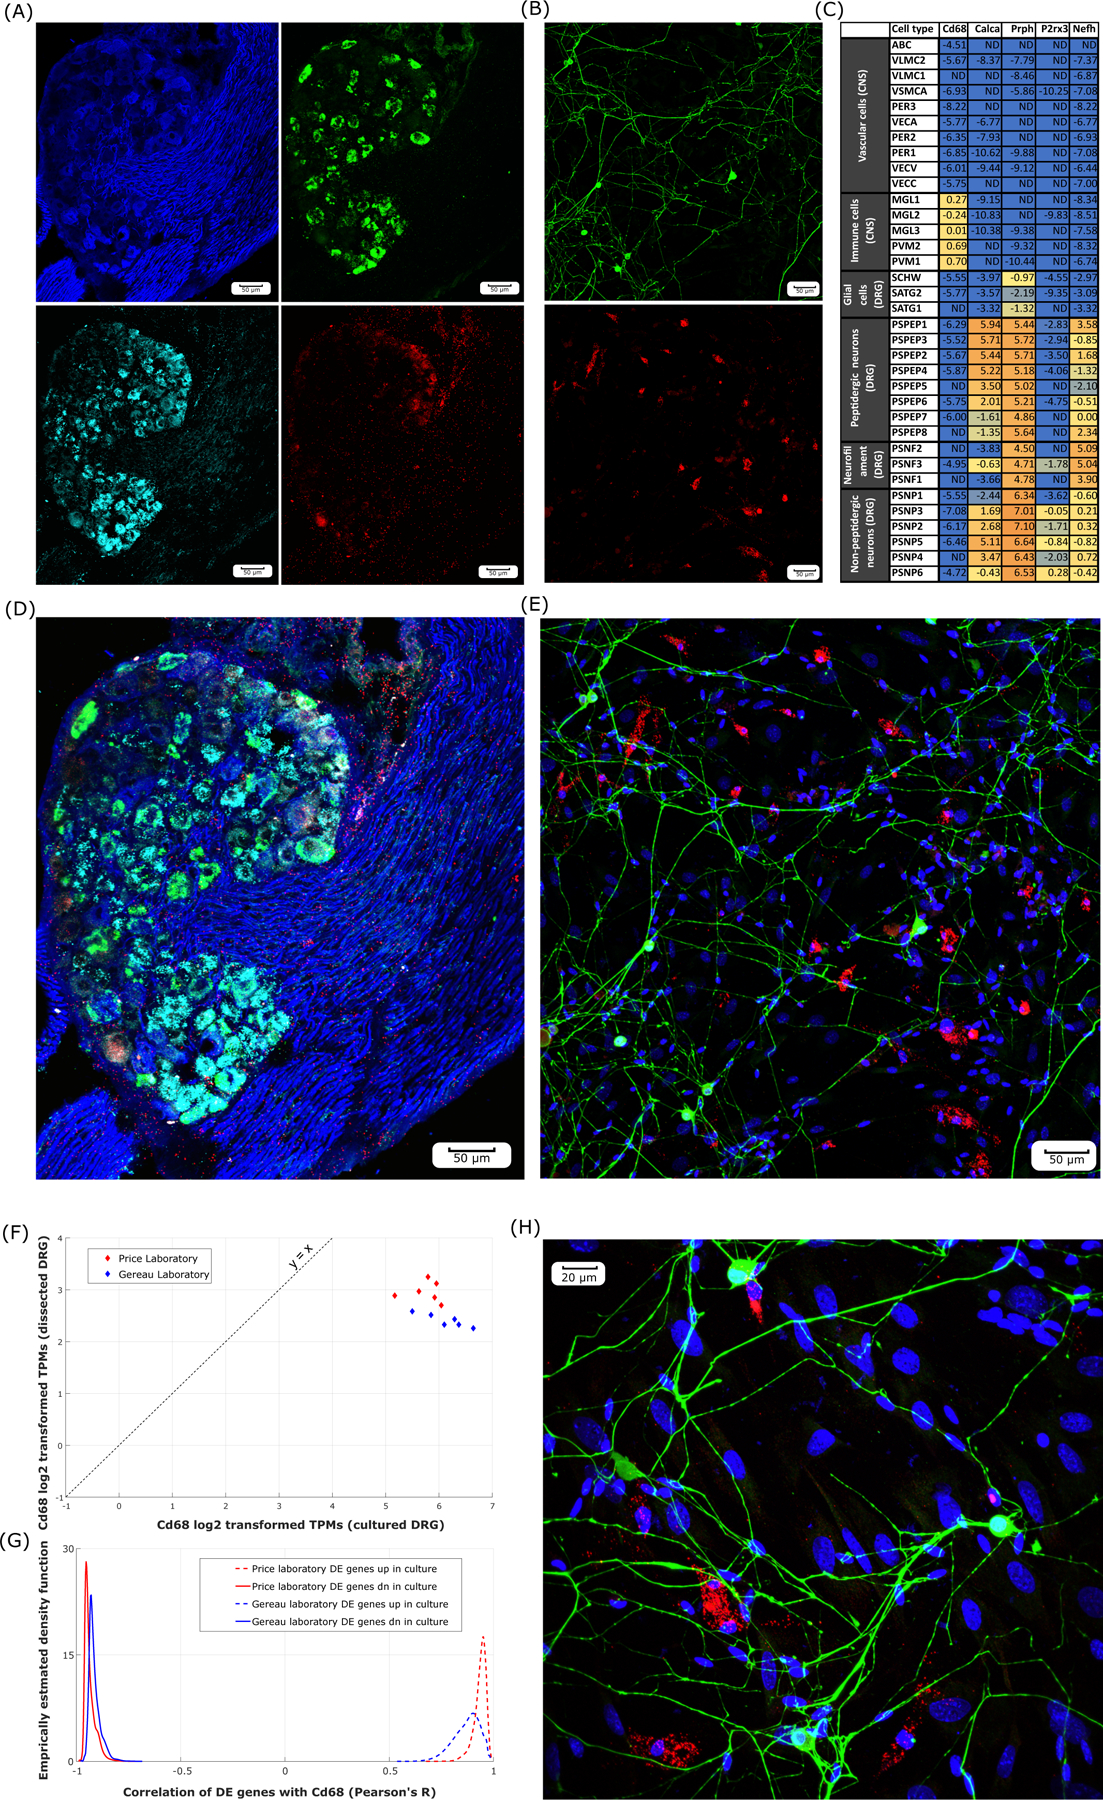
Figure 5.

Cd68 expression in intact vs. cultured mouse DRGs. RNAscope in situ hybridization imaging (20X) in pseudo-color for Cd68 (red) in combination with various neuronal markers including Calca (green), P2rx3 (cyan), and immunostained Nf200 (blue) in intact mouse DRG (A). RNAscope in situ hybridization imaging (20X) in pseudo-color for Cd68 (red) and immunostained Peripherin (green) and DAPI staining (blue) in cultured mouse DRG (B). log2 transformed expression levels of Cd68 and neuronal markers from mousebrain.org (C) in mouse DRG neuron and glial subtypes, and nervous system vascular and immune cells show Cd68 is detected only in macrophage-like cells (ND: Not Detectable). Overlay of images show that Cd68 mRNA is not expressed in neurons in either intact (D) or cultured (E) mouse DRG neurons. Expression levels (in log2-transformed TPMs) of Cd68 in intact versus cultured mouse DRGs are plotted (F) to show the consistent increase of Cd68 expression in cultures. Differentially expressed gene TPMs show strong correlation (or anti-correlation) to Cd68 abundance (in TPMs) (G), suggesting a consistent phenotype across samples and laboratories. Overlay of RNAscope in situ hybridization imaging (40X) for cultured mouse DRG (H) suggests Cd68+ cells have consistent shape and size with respect to DRG macrophages. Scale bar for 20X images equal to 50μm and 40x equal to 20μm.
