

Abstract
Background
Infertility is one of the common health issues around the world. The prevalence of male factor infertility among infertile couples is approximately 30%-35%, of which genetic factors account for 15%. The family-based whole-exome sequencing (WES) approach can accurately detect novel variants. However, selecting an appropriate sample for data generation using WES has proven to be challenging in familial male infertility studies. The aim of this study was to identify types of pathogenic male infertility in cases of familial asthenozoospermia.
Case
Two families with multiple cases were recruited for the purpose of WES. The study population included two affected cases in pedigree I and three affected cases in pedigree II. Two different variant callers (SAMtools and GATK) with a single-sample calling strategy (SSCS) and a multiple-sample calling strategy (MSCS), were applied to identify variant sites.
Conclusion
In this study, we represented the results for variant prioritization of WES data without sequencing fertile siblings in the same pedigree by applying two different pipelines (homozygosity and linkage-based strategy). Using the aforementioned strategies, we prioritized annotated variants and generated a logical shortlist of private variants for each pedigree.
Keywords: Male infertility, Whole-exome sequencing, GATK, SAMtools.
1. Introduction
Infertility is an important social health condition, and is defined as the inability to conceive naturally after at least one year of unprotected intercourse. Approximately 15% couples suffer from infertility and 30%-35% of those cases relate to male factor infertility (1). Numerous factors (ranging from lifestyle to heredity) may affect semen parameters and male infertility (2). Approximately 15% of male infertility cases are attributable to genetic disorders (3). The majority of mechanisms involved in disease heritability are associated with chromosomal abnormalities and genetic variations (4). According to OMIM, autosomal or sex chromosome has more than 60 genes, leading to male infertility. CFTR mutation has been implicated in 60%-90% of cases involving infertile men, with congenital bilateral absence of the vas deferens or epididymal obstruction. Mutations in X-linked genes, such as USP26 and SOX3, have been reported in cases of severe spermatogenesis impairment (5, 6).
Approximately 30%-40% infertility cases in men with unknown etiology may be associated with genetic factors (6). The high proportion of idiopathic infertility in males is attributed to the limitations of traditional gene identification techniques, such as the Sanger sequencing. The most notable disadvantages of these approaches include length of time, low throughput data, and a broad region for candidate genes. Most of these limitations have been addressed by next-generation sequencing (NGS) (7).
The NGS approach, or whole-exome sequencing (WES), is a powerful and unbiased tool for identifying genetic variation by capturing genome coding regions (8). WES covers a region of approximately 1%-1.5% of the human genome, where approximately 85% of causative mutations are located. Overlap-, de novo-, extreme phenotypes, and familial-based are the four main strategies for WES analysis. Of these, family-based WES is an efficient method of identifying potential causal variants (9). This approach led to the identification of causal variants that traditional methods had failed to detect in several pedigrees (10). The WES specialist can generate large amounts of data and, consequently, be of benefit to clinics. However, excluding the called variations across the whole-exome remains an issue, and it is not reasonable to verify all types of candidates via the Sanger sequencing (11, 12). Indeed, prioritizing the best candidate pathogenic variants is the main challenge. Many previous studies have focused on the family-based strategy to increase the efficiency of discovering candidate genes and reducing the number of private variants (13).
The purpose of this study was to illustrate the basic familial framework for the purpose of identifying genes that relate to male infertility. To this end, we studied seven cases in two families. In family I, we sequenced two affected members and their parents to filter out inherited variants. In family II, we focused on the most distantly related family members to reduce shared benign variations. The advantage of this approach, by sequencing non-affected siblings, is that not many private variations were missed.
2. Case
Human subjects and DNA samples
In this case series study, we examined seven cases from two unrelated families (Figure 1). DNA was extracted from the peripheral blood leukocyte using salting out methods.. The quality of the DNA was checked using an agarose gel and NanoDrop analysis.
Whole-exome sequencing platform
The library of all seven samples was prepared using the SureSelectXT Library Preparation Kit (Agilent Technologies, Santa Clara, CA, USA). As a next step, cluster generation, paired-end sequencing was applied on the IlluminaHiSeq 2000 platform using TruSeqv3. The binary base call (BCL) was converted to FASTQ using the Illumina bcl2fastq package.
Quality evaluation of the raw data
The preprocessing and generation of raw reads (FASTQ) involved 3´ end adaptor clipping, primer removal, and the trimming of poor base sequence quality. The sequenced data were assessed using the FastQC tool (http://www.bioinformatics.babraham.ac.uk/projects/fastqc/) to analyze Phred score distribution, together with reads, GC content distribution, read length distribution, and sequence duplication level. The adaptor was removed using Trimomatic (version 1.04.636; www.github.com/ExpressionAnalysis/ea-utils/blob/wiki/FastqMcf.md).
Alignment and duplicated PCR removed
Following the assessment of quality control, the raw reads were aligned to an established human reference genome (version hg19UCSC indexed in the FASTA format (14). Millions of reference genome-scale short reads have been globally streamlined using the Burrows-Wheeler Aligner (BWA) with MEM algorithm alignment in SAM format (15). The default parameters in the software were based on the Burrows-Wheeler conversion. The aligned reads were converted to a BAM file using SAMtools software (16), which was able to clean up and flag read-pairing information. The BAM file was then sorted by genomic location and indexed by SAMtools to save space and help the subsequent process. The Picard tool was combined with bamtools to filter out the mismatching and inappropriate reads for the purpose of assembled genomic data. The Picardtool identified duplicates from the PCR library. Data distribution and reads coverage (alignment statistics) were then evaluated with the CalculateHsMetrics package. Base quality was recalibrated, using GATK covariance recalibration (version 2.8; Broad Institute, Cambridge, MA, USA; www.broadinstitute.org/gatk/).
Variant calling and annotation
Variant identification is the key stage in NGS data analysis. In this step, two programs, GATK and SAMtools, were applied to create a VCF file containing all the sites with potential variants (16). VCF files were filtered based on two criteria: depth of coverage and Fred score quality (DP 9 -'QUAL 25). After calling variants list,, the ANNOVAR software tool was used to annotate screened variations and connect the three annotation modes according to the type of gene, region, and filter (17).
Variant filtering
The number of candidate variants was reduced through four steps. The first step was to filter the variants out of the coding or splicing region. The second step was to prioritize the variants with relatively low minor allele frequency (MAF 1%), or novel variants. The third step was to exclude synonymous variants and retain splice, nonsense, Indel, and nonsynonymous mutations. To reduce the number of candidate genes, we focused on the identification of genes related to two strategies (homozygosity and linkage-based). Family I underwent homozygosity strategy because the DNA samples of both parents were available. Family II was selected for linkage-based strategy because DNA samples from all affected cases were available. Five infertile men in this family were diagnosed with asthenozoospermia (ASZ); the DNA samples of two brothers and one of the most distant affected relatives were sequenced to identify the shared variations. In addition, the homozygosity region for each family was obtained using exome data. A homozygous variant in the homozygous region was prioritized.
Variant analysis
Specific variants were assessed for evolutionary conservation using the GREP and PhastCons tools. Variants with a GREP score of 2.0 and a PhastCons score of 0.3 were considered a conserved variant. The prediction of candidate variants that affected protein or phenotype function was performed using five tools: Mutation Taster, PolyPhen, Sift, CADD, and Proven (18). The variants predicted to be disease-causing by more than two of these tools were further analyzed. A deleterious effect of variants on protein structure was evaluated by the online web service HOPE. Pathogenic variation is able to disrupt intron-exon splice sites, exonic splicing enhancers (ESE) and exonic splicing silencers (ESS), which can affect gene expression and cause genetic diseases by aberrant pre-mRNA splicing. The annotation of intronic and exonic mutations, leading to splicing defects, was performed using the ESEfinder and Human Splicing Finder web resource tools (19, 20).
Figure 1.

Pedigree of families with ASZ. Pedigree I and pedigree II. The black and white squares represent infertile and fertile men, respectively. The proband is indicated by a red arrow. Candidate cases that underwent WES are indicated by a red asterisk.
Ethical consideration
As a first step, written informed consent for genetic studies was obtained from subjects. This case series study was conducted in accordance with the protocols approved by the Institutional Review Board of the Royan Institute Research Center and the Royan Ethics Committee, Tehran, Iran.
Bioinformatics tools
FastQC tool
Trimomatic
Burrows-Wheeler Aligner
SAMtools
BamTools
Picard tool
CalculateHsMetrics package
GATK
ANNOVAR
3. Results
WES Run Statistics and alignment results
Approximately 2.5 gigabytes of exome sequence were obtained for each of the seven samples. All sequence sets yielded a comparable total number of bases, reads, GC (%), Q20 (%), and Q30 (%). Table I shows the raw stats data of each sample. FastQC was performed to check the quality of the raw data, focusing on base quality score, GC content, N content, and sequence duplication level. Mapped results, previously generated by BWA, were computed to create the number of total reads, paired reads, properly-paired reads, duplicate reads, duplication rate percentage (number of duplicates/total reads), number of reads mapped/aligned, and unique reads mapped (Table II).
Variant detection
Variants were called using two different tools, GATK (version 2.6) and SAMtools (version 0.1.18), which are the most widely used, and the Unified Genotyper algorithm was applied. SSCS and MSCS were separately performed for family I and family II. The number of SNPs and Indels was determined by different callers, and we evaluated the effects of SSCS and MSCS on the variant for each family (Table III). Through SAMtool, SSCS increased the number of raw SNPs by 1.6% and 1.1% in family I and family II, respectively. In contrast, MSCS increased the number of raw SNPs called by 1.2% with GATK in both pedigrees. Variants were filtered based on the depth of coverage and quality. In SSCS and MSCS, variant filtering removed 15% and 21% of raw variants called by SAMtools, respectively, whereas 16% and 9.2% of those called by GATK were filtered. These results reflect the importance of filtering in MSCS by SAMtools. We estimated the Ts/Tv ratio of SNP sets using two SSCS and MSCS pipelines. As shown in Figure 2a, in SSCS with SAMtools, the raw SNP sets had a Ts/Tv ratio of between 1.72 and 1.88, while the Ts/Tv ratio increased in the filtered data sets. The Ts/Tv ratio was constant in both unfiltered and filtered MSCS data sets with SAMtools. The Ts/Tv ratio of the raw SNP sets was 1.34-2.07 when the GATK was used, and increased in both SSCS and MSCS with GATK (Figure 2b). The results demonstrate that 83%-91% of SNVs are called by both GATK and SAMtools (Figure 3).
Variant filtering
In this stage, the called variants were filtered in four stages. In the first stage, we excluded approximately two-thirds of variants, which were located in the intronic and intergenic regions. Less than 50% of variants were likely to be pathogenic. Of these, new and rare variants with MAF 1% required further analysis (Table IV). As the affected cases in family II were from a consanguineous marriage, we focused on homozygote variants. The number of private variants in pedigree II is shown in Table V. Approximately 0.05% (SAMtools) and 0.03% (GATK) of the called variations remained after initial filtering in family I (Table VI).
Table 1.
NGS run stats for seven samples
|
| ||||||
| Sample ID | Total read bases (bp) | Total reads | GC (%) | AT (%) | Q20 (%) | Q30 (%) |
| 100 | 10,374,885,048 | 68,707,848 | 52.49 | 47.51 | 96.84 | 94.94 |
| 101 | 9,551,889,446 | 63,257,546 | 52.31 | 47.69 | 96.79 | 94.86 |
| 102 | 8,128,247,252 | 53,829,452 | 52.79 | 47.21 | 95.77 | 93.28 |
| 103 | 10,019,530,104 | 66,354,504 | 51.95 | 48.05 | 96.79 | 94.86 |
| 200 | 9,915,418,624 | 65,665,024 | 52.94 | 47.06 | 96.4 | 94.29 |
| 201 | 10,637,953,322 | 70,450,022 | 53.05 | 46.95 | 96.43 | 94.33 |
| 202 | 9,679,497,432 | 64,102,632 | 53.05 | 46.95 | 96.59 | 94.58 |
| Total read bases: Total number of bases sequenced. Total reads: Total number of reads. For Illumina paired-end sequencing, this value refers to the sum of read 1 and read 2. GC (%): GC content. AT (%): AT content. Q20 (%): Ratio of bases that have a Phred quality score in excess of 20. Q30 (%): Ratio of bases that have a Phred quality score in excess of 30 | ||||||
Table 2.
Alignment statistics for seven data aligned with BWA MEM
|
| ||||||||
| Samples | Paired reads in sequencing | Properly paired | Read 1 | Read 2 | Mapped reads | Unmapped reads | Read-pair optical duplicates | Duplication percentage |
| 100 | 68,707,848 | 67,621,688 | 34,353,924 | 34,353,924 | 68,767,520 | 65,069 | 424,113 | 0.150270 |
| 101 | 63,257,546 | 61,244,026 | 31,628,773 | 31,628,773 | 63,328,202 | 61,270 | 401,670 | 0.151691 |
| 102 | 53,829,452 | 52,945,158 | 26,914,726 | 26,914,726 | 53,969,040 | 49,300 | 315,834 | 0.141146 |
| 103 | 66,354,504 | 64,700,696 | 33,177,252 | 33,177,252 | 66,417,218 | 64,207 | 445,562 | 0.159041 |
| 200 | 65,665,024 | 63,758,102 | 32,832,512 | 32,832,512 | 65,809,832 | 249,151 | 19,714 | 0.144086 |
| 201 | 70,450,022 | 68,075,954 | 35,225,011 | 35,225,011 | 70,636,251 | 249,453 | 21,555 | 0.274010 |
| 202 | 64,102,632 | 63,080,570 | 32,051,316 | 32,051,316 | 64,296,060 | 222,177 | 27,934 | 0.057078 |
Table 3.
Number of SNPs and Indels called by SAMtools and GATK
|
| ||||||||
| Number of variants | Unfiltered SNP | Filtered SNP | Unfiltered indel | Filtered indel | ||||
| SAMtools | GATK | SAMtools | GATK | SAMtools | GATK | SAMtools | GATK | |
| 100 | 1,020,180 | 492,537 | 183,178 | 103,790 | 91,216 | 53,722 | 22,058 | 11,750 |
| 101 | 1,073,008 | 518,360 | 181,294 | 102,548 | 93,768 | 56,052 | 21,935 | 11,474 |
| 102 | 930,610 | 456,647 | 179,665 | 100,100 | 82,297 | 48,705 | 21,764 | 11,242 |
| 103 | 1,066,604 | 458,137 | 177,006 | 95,249 | 86,249 | 46,024 | 20,276 | 9,479 |
| Multiple samples of pedigree I | 2,557,705 | 2,396,362 | 169,315 | 260,117 | 210,415 | 153,486 | 37,415 | 32,228 |
| 200 | 1,290,000 | 870,536 | 140,444 | 82,796 | 85,664 | 76,129 | 17,204 | 9,612 |
| 201 | 1,624,699 | 190,435 | 141,757 | 79,148 | 110,845 | 84,310 | 17,363 | 8,887 |
| 202 | 1,631,100 | 723,156 | 149,358 | 104,198 | 111,435 | 65,608 | 18,524 | 12,024 |
| Multiple samples of pedigree II | 4,013,542 | 2,265,075 | 190,882 | 137,137 | 245,998 | 194,616 | 22,765 | 24,739 |
| SNP: Single nucleotide polymorphism, Indel: Insertion and deletion | ||||||||
Table 4.
Distribution of variant type called by GATK and SAMtools from seven samples
|
| |||||||
| Individual | 100 | 101 | 102 | 103 | 200 | 201 | 202 |
| Variants called with GATK | 114,371 | 111,669 | 10,5012 | 115,909 | 92,631 | 88,211 | 39,347 |
| Exonic, exonic/splicing Splicing | 41,505 | 41,008 | 40,454 | 41,884 | 34,597 | 33,708 | 27,961 |
| Nonsynonymous Indel | 29,898 | 29,233 | 28,439 | 29,962 | 23,504 | 22,671 | 9,584 |
| Rare and novel | 2,848 | 2,831 | 2,607 | 2,776 | 2,106 | 2,215 | 2,848 |
| Variants called with SAMtools | 204,543 | 202,734 | 198,344 | 206,533 | 158,404 | 159,939 | 168,858 |
| Exonic, exonic/splicing Splicing | 55,066 | 55,106 | 54,821 | 55,633 | 45,814 | 45,683 | 47,165 |
| Nonsynonymous Indel | 43,235 | 43,113 | 42,529 | 43,530 | 34,330 | 34,233 | 35,637 |
| Rare and novel | 9,679 | 9,482 | 8,956 | 9,545 | 7,925 | 6,150 | 7,340 |
Table 5.
Private variants of pedigree II called with SAMtools and GATK
|
| ||||||||
| Individual | 100 | 101 | 102 | Common in three affected | ||||
| SAMtools | GATK | SAMtools | GATK | SAMtools | GATK | SAM tools | GATK | |
| Nonsynonymous SNV | 35 | 34 | 35 | 51 | 42 | 32 | 5 | 5 |
| Frame shift | 84 | 1 | 84 | 1 | 84 | 0 | 65 | 0 |
| Indel | 255 | 3 | 255 | 5 | 264 | 5 | 138 | 0 |
| Stopgain | 5 | 0 | 5 | 0 | 5 | 0 | 2 | 0 |
| Stoploss | 1 | 1 | 1 | 0 | 1 | 1 | 0 | 0 |
| 5´UTR | 178 | 10 | 178 | 4 | 213 | 7 | 94 | 0 |
| 3´UTR | 263 | 8 | 263 | 12 | 276 | 4 | 147 | 2 |
| Exonic | 329 | 37 | 329 | 60 | 347 | 37 | 140 | 5 |
| Exonic, splicing | 47 | 1 | 47 | 0 | 47 | 1 | 7 | 0 |
Table 6.
Private variants of pedigree I called with SAMtools and GATK
|
| ||||||||||
| Individual | 200 | 201 | 202 | 203 | Case /control | |||||
| SAMtools | GATK | SAMtools | GATK | SAMtools | GATK | SAMtools | GATK | SAMtools | GATK | |
| Nonsynonymous SNV | 770 | 698 | 792 | 675 | 820 | 751 | 748 | 663 | 85 | 56 |
| Frame shift | 160 | 23 | 148 | 25 | 162 | 24 | 167 | 23 | 23 | 4 |
| Indel | 754 | 60 | 779 | 67 | 726 | 61 | 781 | 54 | 224 | 12 |
| Stopgain | 28 | 6 | 33 | 11 | 35 | 12 | 28 | 10 | 8 | 1 |
| Stoploss | 33 | 3 | 3 | 1 | 2 | 0 | 7 | 1 | 5 | 0 |
| 5´UTR | 669 | 84 | 712 | 98 | 603 | 92 | 647 | 88 | 156 | 21 |
| 3´UTR | 1001 | 177 | 1046 | 192 | 934 | 166 | 1015 | 195 | 322 | 35 |
| Exonic | 1718 | 794 | 1744 | 802 | 1712 | 854 | 1667 | 795 | 225 | 75 |
| Exonic, splicing | 94 | 10 | 96 | 9 | 93 | 10 | 89 | 13 | 14 | 2 |
Figure 2.
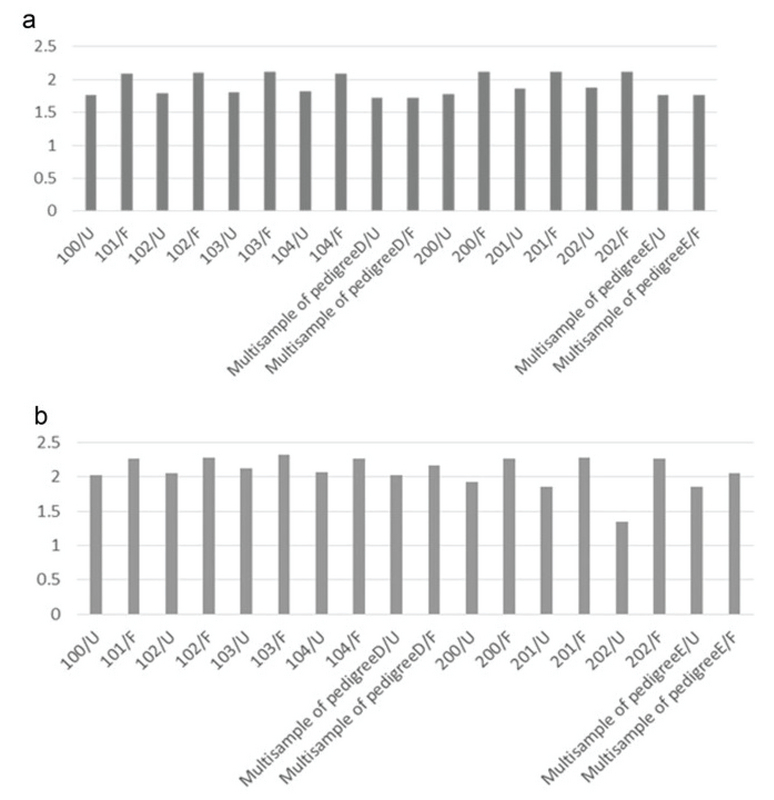
Comparison of Ts/Tv between filtered and unfiltered variants. (a) Ts/Tv ratio of unfiltered (U) and filtered (F) variants called by SAMtools; (b) Ts/Tv ratio of unfiltered (U) and filtered (F) variants called by GATK.
Figure 3.

The intersection of variants identified by the two-caller strategy. The Venn diagram depicts the number of variants in the seven cases, identified by GATK and SAMtools.
4. Discussion
NGS-based technology is a powerful tool for identifying the genetic basis of the human phenotype. As one of the leading molecular techniques in the field of reproductive medicine, WES has a major impact on our understanding of the genetic causes of male infertility. WES generates a large amount of genetic data; however, the processing of WES data can be complex (11). As a standard pipeline, BWA aligns the sequencing reads against the reference genome and variant callers detect the SNVs and Indels (7). In this study, SAMtools and GATK were used as variant callers with SSCS and MSCS. Both unfiltered and filtered variants indicated that SAMtools called more SNVs than GATK did owing to its lower internal filtering criteria. Our results demonstrated that filtered and called Indel variants with SAMtools decreased compared with GATK. In parallel, other studies confirmed the high potential of GATK in the identification of true Indel variants (21). In addition, the number of called raw SNVs increased in SSCS with SAMtools and in MSCS with GATK, in both families. The results showed that SAMtools and GATK are capable of calling more raw SNVs in SSCS and MSCS, respectively, in both analyzed pedigrees. Therefore, we suggest that GATK and SAMtools are appropriate callers in MSCS and SSCS, respectively. These results, along with other reports that illustrate the role of GATK in MSCS, such as those by Liu et al., demonstrate that many variants have been lost by SAMtools in MSCS (21). Cornish and Guda compared 30 different pipelines and found that Novoalign plus the GATK Unified Genotyper showed the highest sensitivity with a low number of false positives (22).
Variants were annotated by ANNOVAR, and variants outside the coding regions, as well as those of synonymous coding, were filtered out. Subsequently, known variants with a frequency greater than 1% in ExAC, dbSNP, and 1,000 Genomes were excluded, to reduce the number of potential disease-causing variants (23-25). Homozygosity mapping and linkage approaches prioritized private variants for further analysis based on the two family-based filtering strategies. As shown in Tables V and VI, SAMtools called more private variants that were either missed by GATK or flagged as low-quality.
We have shown that WES is a powerful, efficient, and cost-effective technique that significantly reduces the number of candidate genes in a small number of infertility cases in families with multiple affected individuals. Our research demonstrates that sequencing a small number of samples, while using appropriate filters against public SNVs and in-house databases, is a sufficient approach to detecting private variants. The genomic study of familial male infertility is limited in several respects: the first challenge is the identification of families that contain more than two infertile men who are willing to participate in the study. The selection of appropriate samples for sequencing is also very important. There is a level of uncertainty when detecting genuine fertile men as a result of assisted reproductive technologies, age of incidence, and cultural barriers. Therefore, great care should be taken in the selection of fertile samples.
5. Conclusion
This study demonstrates two strategies for the WES analysis of familial male infertility cases to suggest a convenient approach to identify potentially functional variants. This, in turn, may further our understanding of the underlying mechanisms behind male infertility.
Conflict of Interest
The authors declare that they have no conflicts of interest.
Acknowledgments
The present study was supported in part by a grant from the University of Sistan and Bluchestan (USB), Zahedan, Iran, a grant from the Royan Research Institute, Tehran, Iran, and a grant from the Iran National Science Foundation (INSF).
References
- 1.Jungwirth Andreas, Giwercman Aleksander, Tournaye Herman, Diemer Thorsten, Kopa Zsolt, Dohle Gert, Krausz Csilla. European Association of Urology Guidelines on Male Infertility: The 2012 Update. European Urology. 2012;62(2):324–332. doi: 10.1016/j.eururo.2012.04.048. [DOI] [PubMed] [Google Scholar]
- 2.Shi Xiao, Chan Carol Pui Shan, Waters Tarah, Chi Ling, Chan David Yiu Leung, Li Tin-Chiu. Lifestyle and demographic factors associated with human semen quality and sperm function. Systems Biology in Reproductive Medicine. 2018;64(5):358–367. doi: 10.1080/19396368.2018.1491074. [DOI] [PubMed] [Google Scholar]
- 3.O'flynn O'brien Katherine L., Varghese Alex C., Agarwal Ashok. The genetic causes of male factor infertility: A review. Fertility and Sterility. 2010;93(1):1–12. doi: 10.1016/j.fertnstert.2009.10.045. [DOI] [PubMed] [Google Scholar]
- 4.Shaffer Lisa, Theisen Disorders caused by chromosome abnormalities. The Application of Clinical Genetics. 2010:159. doi: 10.2147/tacg.s8884. [DOI] [PMC free article] [PubMed] [Google Scholar]
- 5.Hamada Aj, Esteves Sc, Agarwal A. A comprehensive review of genetics and genetic testing in azoospermia. Clinics. 2013;68(S1):39–60. doi: 10.6061/clinics/2013(sup01)06. [DOI] [PMC free article] [PubMed] [Google Scholar]
- 6.Agarwal Ashok, Mulgund Aditi, Hamada Alaa, Chyatte Michelle Renee. A unique view on male infertility around the globe. Reproductive Biology and Endocrinology. 2015;13(1) doi: 10.1186/s12958-015-0032-1. [DOI] [PMC free article] [PubMed] [Google Scholar]
- 7.Gilissen Christian, Hoischen Alexander, Brunner Han G, Veltman Joris A. Disease gene identification strategies for exome sequencing. European Journal of Human Genetics. 2012;20(5):490–497. doi: 10.1038/ejhg.2011.258. [DOI] [PMC free article] [PubMed] [Google Scholar]
- 8.Ramasamy Ranjith, Bakırcıoğlu M. Emre, Cengiz Cenk, Karaca Ender, Scovell Jason, Jhangiani Shalini N., Akdemir Zeynep C., Bainbridge Matthew, Yu Yao, Huff Chad, Gibbs Richard A., Lupski James R., Lamb Dolores J. Whole-exome sequencing identifies novel homozygous mutation in NPAS2 in family with nonobstructive azoospermia. Fertility and Sterility. 2015;104(2):286–291. doi: 10.1016/j.fertnstert.2015.04.001. [DOI] [PMC free article] [PubMed] [Google Scholar]
- 9.Shirzad Hadi, Beiraghi Narges, Ataei Kachoui Mojgan, Akbari Mohammad Taghi. Family-Based Whole-Exome Sequencing for Identifying Novel Variants in Consanguineous Families with Schizophrenia. Iranian Red Crescent Medical Journal. 2016;19(2) doi: 10.5812/ircmj.35788. [DOI] [Google Scholar]
- 10.M Askari, R Karamzadeh, Mh Karimi-Jafari, A Mohseni, M Mehdi, A Bashamboo, et al. Identification of a missense variant in CLDN2 in obstructive azoospermia. J Hum Genet 2019; 64: 1023-1032. [DOI] [PubMed]
- 11.Bamshad Michael J., Ng Sarah B., Bigham Abigail W., Tabor Holly K., Emond Mary J., Nickerson Deborah A., Shendure Jay. Exome sequencing as a tool for Mendelian disease gene discovery. Nature Reviews Genetics. 2011;12(11):745–755. doi: 10.1038/nrg3031. [DOI] [PubMed] [Google Scholar]
- 12.Mcclellan Jon, King Mary-Claire. Genetic Heterogeneity in Human Disease. Cell. 2010;141(2):210–217. doi: 10.1016/j.cell.2010.03.032. [DOI] [PubMed] [Google Scholar]
- 13.M Askari, Dm Kordi-Tamandani, N Almadani, K Mcelreavey. Identification of a homozygous GFPT2 variant in a family with asthenozoospermia. Gene 2019; 699: 16-23. [DOI] [PubMed]
- 14.The Genome Sequencing Consortium Initial sequencing and analysis of the human genome. Nature. 2001;409(6822):860–921. doi: 10.1038/35057062. [DOI] [PubMed] [Google Scholar]
- 15.Li H., Durbin R. Fast and accurate short read alignment with Burrows-Wheeler transform. Bioinformatics. 2009;25(14):1754–1760. doi: 10.1093/bioinformatics/btp324. [DOI] [PMC free article] [PubMed] [Google Scholar]
- 16.Depristo Mark A, Banks Eric, Poplin Ryan, Garimella Kiran V, Maguire Jared R, Hartl Christopher, Philippakis Anthony A, Del Angel Guillermo, Rivas Manuel A, Hanna Matt, Mckenna Aaron, Fennell Tim J, Kernytsky Andrew M, Sivachenko Andrey Y, Cibulskis Kristian, Gabriel Stacey B, Altshuler David, Daly Mark J. A framework for variation discovery and genotyping using next-generation DNA sequencing data. Nature Genetics. 2011;43(5):491–498. doi: 10.1038/ng.806. [DOI] [PMC free article] [PubMed] [Google Scholar]
- 17.Wang K., Li M., Hakonarson H. ANNOVAR: functional annotation of genetic variants from high-throughput sequencing data. Nucleic Acids Research. 2010;38(16):e164–e164. doi: 10.1093/nar/gkq603. [DOI] [PMC free article] [PubMed] [Google Scholar]
- 18.Venselaar Hanka, Te Beek Tim Ah, Kuipers Remko Kp, Hekkelman Maarten L, Vriend Gert. Protein structure analysis of mutations causing inheritable diseases. An e-Science approach with life scientist friendly interfaces. BMC Bioinformatics. 2010;11(1):548. doi: 10.1186/1471-2105-11-548. [DOI] [PMC free article] [PubMed] [Google Scholar]
- 19.Desmet François-Olivier, Hamroun Dalil, Lalande Marine, Collod-Béroud Gwenaëlle, Claustres Mireille, Béroud Christophe. Human Splicing Finder: an online bioinformatics tool to predict splicing signals. Nucleic Acids Research. 2009;37(9):e67–e67. doi: 10.1093/nar/gkp215. [DOI] [PMC free article] [PubMed] [Google Scholar]
- 20.Cartegni L. ESEfinder: a web resource to identify exonic splicing enhancers. Nucleic Acids Research. 2003;31(13):3568–3571. doi: 10.1093/nar/gkg616. [DOI] [PMC free article] [PubMed] [Google Scholar]
- 21.Liu Ze-Kun, Shang Yu-Kui, Chen Zhi-Nan, Bian Huijie. A three-caller pipeline for variant analysis of cancer whole-exome sequencing data. Molecular Medicine Reports. 2017;15(5):2489–2494. doi: 10.3892/mmr.2017.6336. [DOI] [PMC free article] [PubMed] [Google Scholar]
- 22.Cornish Adam, Guda Chittibabu. A Comparison of Variant Calling Pipelines Using Genome in a Bottle as a Reference. BioMed Research International. 2015;2015:1–11. doi: 10.1155/2015/456479. [DOI] [PMC free article] [PubMed] [Google Scholar]
- 23.Consortium 1000 Genomes Project, A Auton, Ld Brooks, Rm Durbin, Ep Garrison, Hm Kang, . , et al. A global reference for human genetic variation. Nature 2015; 526: 68-74. [DOI] [PMC free article] [PubMed]
- 24.Sherry S. T. dbSNP: the NCBI database of genetic variation. Nucleic Acids Research. 2001;29(1):308–311. doi: 10.1093/nar/29.1.308. [DOI] [PMC free article] [PubMed] [Google Scholar]
- 25.M Lek, Kj Karczewski, Ev Minikel, Ke Samocha, E Banks, T Fennell, et al. Analysis of protein-coding genetic variation in 60,706 humans. Nature 2016; 536: 285-291. [DOI] [PMC free article] [PubMed]