

Abstract
Speech perception involves mapping from a continuous and variable acoustic speech signal to discrete, linguistically meaningful units. However, it is unclear where in the auditory processing stream speech sound representations cease to be veridical (faithfully encoding precise acoustic properties) and become categorical (encoding sounds as linguistic categories). In this study, we used functional magnetic resonance imaging and multivariate pattern analysis to determine whether tonotopic primary auditory cortex (PAC), defined as tonotopic voxels falling within Heschl’s gyrus, represents one class of speech sounds—vowels—veridically or categorically. For each of 15 participants, 4 individualized synthetic vowel stimuli were generated such that the vowels were equidistant in acoustic space, yet straddled a categorical boundary (with the first 2 vowels perceived as [i] and the last 2 perceived as [i]). Each participant’s 4 vowels were then presented in a block design with an irrelevant but attention-demanding level change detection task. We found that in PAC bilaterally, neural discrimination between pairs of vowels that crossed the categorical boundary was more accurate than neural discrimination between equivalently spaced vowel pairs that fell within a category. These findings suggest that PAC does not represent vowel sounds veridically, but that encoding of vowels is shaped by linguistically relevant phonemic categories.
Keywords: auditory pathway, hierarchical processing, multivariate pattern analysis, speech perception
Introduction
When we comprehend speech, we effortlessly extract discrete vowels and consonants, even though the acoustic input is highly variable and lacks invariant acoustic cues to phonemic identity (Liberman et al. 1967). This process has been investigated using paradigms in which speech sounds varying on an acoustic continuum between 2 phonemes are not perceived as intermediate exemplars but rather are consistently categorized as 1 phoneme or the other (Liberman et al. 1957; Pisoni and Luce 1987). Closely spaced exemplars can be readily discriminated if they cross the categorical boundary but are either less discriminable or not discriminable at all if they belong to the same phonemic category. Languages differ in their inventories of phonemes and in the locations of boundaries between them, indicating that the categorization of speech sounds is at least partially dependent on linguistic experience (Werker et al. 1981).
The neural substrates of the categorization of speech sounds remain poorly understood. The early structures of the auditory system, from the peripheral hearing apparatus up through the brainstem, encode the acoustic properties of a stimulus with remarkable fidelity (Sachs and Young 1979; Bidelman et al. 2013). While there may be subtle interindividual differences based on linguistic or auditory experience (Krishnan and Gandour 2009; Zhao and Kuhl 2018), the majority of research to date suggests that these earlier stages of the auditory system encode speech sounds “veridically”, such that physical differences between speech sounds are directly reflected in corresponding differences between physiological representations (Young 2008). In contrast, higher-order auditory regions seem to encode speech sounds in a nonlinear manner, such that acoustic differences that fall within a single perceptual category are minimized while those that mark the crossing of a phonemic boundary are enhanced (Chang et al. 2010; Steinschneider et al. 2011;Bidelman et al. 2013). For example, intracranial recordings from the lateral superior temporal gyrus (STG) showed that distributed activity evoked by pairs of consonants could be discriminated only for consonant pairs that crossed a phonemic boundary (Chang et al. 2010). Where in the auditory processing stream does this transformation from a veridical to a categorical mode of representation take place?
In this study, we investigated the nature of speech sound encoding in primary auditory cortex (PAC), the first cortical site of auditory processing. The degree of abstraction of acoustic representations in PAC is actively debated (Nelken 2008; Steinschneider 2013). With regard to speech sounds, the phonetic feature of voice onset time is encoded nonlinearly in PAC, providing a neural substrate for categorization of voiced and unvoiced stop consonants (Steinschneider et al. 1999), but this nonlinear encoding of timing information is not specific to speech sounds (Steinschneider et al. 2005) nor to humans (Steinschneider et al. 2003). Several functional imaging studies have shown that phonemes can be decoded from neural activity in PAC (e.g., Formisano et al. 2008; Obleser et al. 2010), but since phonemes could be reconstructed based on either acoustic differences between them or phonemic representations, these findings do not entail that representations are categorical.
We chose to investigate a pair of vowels that are distinct phonemes in English—[i] (as in “heed”) and [i] (as in “hid”)—but are close neighbors in formant space and are not commonly contrastive crosslinguistically (Crothers 1978). We investigated the neural discriminability of a continuum of 4 synthetic vowels that were equidistant in acoustic space, yet straddled the categorical boundary between [i] and [i]. We hypothesized that to the extent that encoding of vowels in PAC is categorical, then neural discrimination between pairs of vowels that cross the categorical boundary would be more accurate than neural discrimination between equivalently spaced vowel pairs belonging to the same phonemic category.
Materials and Methods
Behavioral Screening
First, a behavioral experiment was carried out to identify individuals who would perceive the 4 artificial vowel stimuli to be used in the imaging experiment as belonging to 2 separate linguistic categories. The experimental demonstration of categorical perception has been shown to be highly dependent on the particulars of the stimuli (van Hessen and Schouten 1999) and the nature of the task(s) (Gerrits and Schouten 2004) and is subject to considerable individual differences (Kong and Edwards 2016; Lopez-Zamora et al. 2012); see Holt and Lotto (2010) for review. Thus, we wanted to identify and scan only participants who would perceive our specific vowel stimuli in a categorical manner.
Participants
A total of 38 neurologically normal native English speakers were recruited for the behavioral screening via campus flyer postings and word of mouth in Nashville, Tennessee (age, 26.2 ± 3.0 (standard deviation) years; range, 20–34 years; 17 male, 21 female; education, 16.6 ± 1.6 years; range, 12–20 years). Participants were required to have normal hearing and no history of speech or language disorders.
All participants gave written informed consent and were compensated for their time. The study was approved by the institutional review board at Vanderbilt University.
Vowel Stimuli
Vowel stimuli were generated using Ronald Sprouse’s python implementation of a Klatt synthesizer (Klatt 1980; https://github.com/rsprouse/klsyn). A continuum of 12 vowels spaced evenly on the mel scale (Fant 1968) between [i] and [i] was generated based on average F1 and F2 values for males reported by Peterson and Barney (1952). An additional pair of equally spaced vowels was then added onto each end of the continuum so as to maximize the vowel space traversed without encroaching upon the territory of other phonemes, resulting in a series of 16 vowels (Fig. 1A). The values for f0, F3, F4, F5, B1, B2, B3, B4, and B5 were held constant at 130, 2780, 3300, 3850, 50, 70, 110, 250, and 200 Hz, respectively, for all stimuli (Kluender et al. 1998). The duration of each vowel was set to 300 ms, with a 13.6 ms fader at onset and offset to avoid level change-related acoustic artifacts.
Figure 1.

Individualized stimulus generation. (A) Vowel chart depicting F1 and F2 values (mel) as defined in Peterson and Barney (1952). Orange dots signify the original 16-point vowel continuum on which identification and discrimination tasks were performed. (B) Performance on the initial identification and discrimination tasks for a single participant. Open circles correspond to raw scores while lines represent a Gaussian fit to the data. The positions of this subject’s final 4 individually generated vowels ([ie], [ib], [ib], and [ie]) along the original vowel continuum are indicated by dotted black lines. (C) Spectrograms of the participant’s 4 individualized vowels. F1 and F2 values as input to the Klatt synthesizer are depicted in red. (D) Spectra of the participant’s 4 individualized vowels. (E) Performance on the follow-up identification task, in which the 4 individualized vowels were categorized, for the same participant. Note the steep increase between [ib] and [ib], corresponding to the perceptual boundary between vowel categories.
Identification and Discrimination Tasks
Participants performed an identification task and a discrimination task on the 16-vowel continuum. Stimuli were presented over Sennheiser HD-280 headphones in a quiet room. In both experiments, the stimuli were presented over recordings of the sound of the functional magnetic resonance imaging (MRI) sequence to be used (acquired using a Marantz PMD661MKII recorder) at an SNR of 0.25 dB SPL (broadband), so that perception would be analogous to perception in the scanner.
In the identification task, participants heard the 16 vowels from the continuum described above, presented 16 times each in a random order. Using 2 keys, participants indicated whether each vowel was more similar to the sound in “heed” (i.e. [i]) or the sound in “hid” (i.e. [i]). Presentation was self-paced, with a 600 ms pause between the response to one trial and the presentation of the next. The total duration of the identification task was approximately 15 min.
Discrimination took the form of an ABX task, in which participants listened to trios of vowel sounds and were required to judge whether the final vowel was the same as the first or the second vowel. The trios consisted of 1 vowel, a 500 ms pause, a second vowel spaced exactly 3 steps away on the 16-vowel continuum, another 500 ms pause, and then a third vowel that matched either the first or the second vowel. Participants indicated which of the first 2 vowels was repeated in the final slot using 2 keys; visual feedback indicated the participant’s response but not its accuracy. Presentation was again self-paced, with a 600 ms pause between each trial and the next. Participants heard each of the 13 possible 3-step vowel pairs 20 times each (including all possible permutations, e.g., V1/V4/V1, V4/V1/V1, V1/V4/V4, and V4/V1/V4) in a random order. The total duration of the discrimination task was approximately 40 min.
Four vowels were then generated for each participant such that the vowels were equidistant in acoustic space, but straddled the participant’s categorical boundary. That is, the first 2 vowels should be perceived as [i] and the last 2 as [i]. To do this, we calculated d prime for the identification and discrimination tasks (Fig. 1B). For the identification task, we used pairs of vowels that were 3 steps apart and followed the Massaro (1989) approach for calculating d prime. We then fit Gaussian curves to these 2 functions. Each participant’s categorical boundary was defined as the peak value of the Gaussian fit to the identification task data. We then defined 4 vowels that were equidistant in mel space, symmetrical around the categorical boundary, and as widely spaced as possible on the original 16-vowel continuum. The F1 and F2 values of those points along the original continuum were calculated and input to the Klatt synthesizer in order to generate 4 participant-specific stimuli: [ie] (the endpoint [i]), [ib] (the near-boundary [i]), [ib] (the near-boundary i), and [ie] (the endpoint i). Example spectrograms (Fig. 1C) and spectra (Fig. 1D) for the 4 vowels as generated for a representative participant are shown.
Finally, to determine whether the 4 individually synthesized stimuli were perceived as intended, each participant performed a second identification task on their 4 individually generated vowels. Participants heard their 4 vowels presented 25 times each in a random order, over scanner noise as above. Using 2 keys, participants identified each vowel as [i] or [i]. The timing was the same as in the previous identification task, and the total task duration was approximately 5 min. Perception was considered sufficiently categorical, and participants were eligible to be scanned if there was at least a 68% difference in identification across the category boundary and no more than a 24% difference in identification between within-category pairs.
Behavioral Screening Results
A total of 20 participants (53%) perceived their individual vowel stimuli sufficiently categorically according to the criteria just described. Of these 20 participants, 15 were able to be scanned at 7 Tesla (see below). Behavioral screening data for these 15 participants are shown in Figure 2. While there was general concordance between d prime across the identification (blue) and discrimination (red) tasks, there was an asymmetry such that vowels closer to the [i] end of the continuum were discriminated more readily than those on the [i] end of the continuum (Fig. 2A,C). Despite this asymmetry, however, performance on the 4-vowel identification task resulted in clear, nonlinear psychometric functions, as evidenced by the sharp increase in [i] identifications between the second and third vowel (Fig. 2D). The endpoint vowels were equally likely to be perceived as intended (|t(14)| = 1.47, P = 0.16), while the near-boundary [ib] was more likely than the near-boundary [ib] to be perceived as the opposite vowel (|t(14)| = 4.32, P = 0.0007). The average categorical boundary across participants fell at position 10.0 ± 0.5 along the original 16-vowel continuum, resulting in average boundary F1 and F2 values of 345.5 ± 5.7 Hz and 2094.8 ± 13.8 Hz, respectively.
Figure 2.

Behavioral pretest results. (A) Average performance on the identification (blue) and discrimination (red) tasks across all successfully scanned participants (n = 15). Error bars represent standard error of the mean. (B) Average F1 and F2 values (mel) of the individualized stimuli across participants. Error bars represent the complete range of values in each formant dimension. (C) Average projected performance on the identification (blue) and discrimination (red) tasks across participants, normalized to individualized vowel values. d prime values are projected for 100 vowels in between the first and last individualized vowel for each participant based on the Gaussian fit from their original behavioral data. Shaded error bars represent standard error of the mean. (D) Average performance on the individualized identification task across scanned participants. Error bars represent standard error of the mean.
The remaining 18 participants did not consistently categorize their 4 individual vowel stimuli as intended: 2 showed inconsistent identification of multiple vowels, while the other 16 frequently identified the third vowel as [i], instead of [i] as intended.
Neuroimaging
Participants
Of the 20 participants who demonstrated sufficiently categorical perception in the behavioral screening experiment, 15 were successfully scanned (age, 26.5 ± 2.4 years; range, 23–31 years; 7 male, 8 female; all right handed; education, 16.7 ± 1.1 years; range, 14–18 years). A total of 5 participants were not successfully scanned due to unanticipated contraindications to 7-Tesla MRI (n = 3), scheduling problems (n = 1), or experimenter error in task administration (n = 1). All participants reported normal hearing and demonstrated pure tone detection thresholds < 25 dB HL over the range 250–8000 Hz in an automated threshold screening.
Structural Imaging
Participants were scanned on a Philips Achieva 7 Tesla scanner using a 32-channel head coil at the Vanderbilt University Institute of Imaging Science.
A whole-brain, T1-weighted structural image was acquired for each participant for anatomical reference (249 sagittal slices; slice thickness = 0.7 mm; field of view = 246 × 246 mm; matrix = 352 × 352; repetition time (TR) = 4.7 ms; echo time (TE) = 2.1 ms; flip angle = 7°; voxel size = 0.7 × 0.7 × 0.7 mm).
Cortical surfaces were reconstructed from the T1-weighted images using FreeSurfer version 6.0.0 (Dale et al. 1999) running on Linux (xubuntu 16.04). Anatomical regions of interest (ROIs) were defined using the Desikan–Killiany atlas as implemented in FreeSurfer (Desikan et al. 2006).
Tonotopic Mapping
Two functional runs were acquired to map tonotopic regions of auditory cortex in each participant. Participants were presented with bandpass-swept nonlinguistic affective human vocalizations (Dick et al. 2012). The duration of each run was 8 min and 32 s, consisting of 8 64-s sweeps that spanned a logarithmic frequency scale of 150–9600 Hz. Tonotopic stimuli were presented at an average binaural level of 90 dB A weighted sound pressure level. To ensure close attention to the stimuli, participants were asked to indicate with a button press when they heard the sound of laughter. This task was very difficult and required close attention to the stimuli. A fixation crosshair was displayed throughout the task, replaced by a green exclamation point when the participant pressed the button. This visual feedback did not indicate accuracy.
Stimuli were presented, and responses were recorded using the Psychophysics Toolbox (Brainard 1997; Pelli 1997) in MATLAB (Mathworks). Auditory stimuli were presented at a comfortable level for each participant with MRI-safe headphones (NordicNeuroLab). Visual stimuli were projected via an Avotec Silent Vision projector onto a screen at the end of the bore, viewed by participants through a mirror mounted to the head coil. Button presses were collected with an in-house fiber optic button box placed in the right hand.
One ascending run and one descending run were acquired. High-resolution T2*-weighted blood oxygen level-dependent (BOLD) echo planar images were collected with the following parameters: 256 volumes; 22 axial slices in ascending order, aligned with the Sylvian fissure centered on Heschl’s gyrus (HG); slice thickness = 1.51 mm with no gap; field of view = 224 × 224 mm; matrix = 224 × 224; TR = 2000 ms; TE = 25 ms; flip angle = 72°; voxel size = 1 × 1 × 1.51 mm. An additional 8 volumes were acquired and discarded at the beginning of each run, to allow for magnetization to reach steady state and to avoid auditory responses to the onset of scanner noise.
The functional data were preprocessed with tools from AFNI (Cox 1996). The data were resampled to account for differences in slice acquisition times. Head motion was corrected, with 6 translation and rotation parameters saved for use as covariates, and all functional runs were aligned with one another. Functional scans were aligned with the structural image using the bbregister function in FreeSurfer. No spatial smoothing was applied to the functional data, except for rendering onto the cortical surface for visualization.
Tonotopic mapping data were analyzed with Fourier methods using Csurf (Sereno et al. 1995), whereby voxels preferentially responding to a particular point in the stimulus cycle will show a higher amplitude at the frequency of stimulus cycling (i.e., 1/64 Hz) than at any other frequency. The best frequency of each tonotopic voxel can then be determined from the phase of response. Runs with downward frequency sweeps were time reversed and averaged with upward-swept scans to compensate for delays in the BOLD response (estimated to be a 0.08 fraction of the 64-s cycle, i.e., ~ 5 s).
Vowel Encoding
Participants completed 2 (n = 4), 3 (n = 10), or 4 (n = 1) functional runs where they listened to blocks of their 4 individually generated vowels. Vowel stimuli were presented at an average binaural level of 94 dB A weighted sound pressure level. Each run was 8 min in duration, and consisted of 6 blocks for each of the 4 vowels, plus 6 blocks of rest, in pseudorandom order. Each block was 16 s in duration. For the first 14 s of each vowel block, the vowel was presented 28 times in succession, with an interstimulus interval of 200 ms. The last 2 s of each block was silent, to avoid participants detecting (or not detecting) changes across block boundaries and the linguistic and cognitive processes that might be invoked by change detection (Zevin et al. 2010).
In order to ensure that participants attended to the vowels, there was an adaptive level change detection task. In two-thirds of the blocks, between 1 and 3 stimuli were included that were quieter than the rest of the stimuli. The participant’s task was to indicate with a button press when they heard a quieter vowel. A logistic function was used to manipulate the presentation level of each deviant vowel, such that incorrect responses led to larger, more noticeable level changes, while correct responses led to smaller, less noticeable changes. There was a fixation crosshair in the center of the screen, which was replaced with a red X for false alarms, a green exclamation point for hits, and the word “miss” in red when a deviant went unreported for 2 s.
In each run, 240 images were acquired and preprocessed exactly as described for the tonotopy runs. Then, the data were fit with a general linear model using the fmrilm function in FMRISTAT (Worsley et al. 2002). Each of the 24 vowel blocks was modeled with a separate explanatory variable, consisting of a 14-s block convolved with a canonical hemodynamic response function. Nuisance predictors for head movement and linear drift were also included in the model, along with first derivatives of explanatory variables.
Multi-Voxel Pattern Analysis
Our primary hypothesis concerned the ability of PAC to discriminate between pairs of vowels that crossed the phonemic boundary, compared to those that did not. The bounds of PAC for each hemisphere in each participant were defined functionally and anatomically (based on Hackett 2015). Voxels were required to show a frequency-selective response in the tonotopic analysis (amplitude F > 3.03, P < 0.05; see Fisher et al. 2018 for details) and to fall within the transverse temporal ROI of the Desikan–Killiany atlas (i.e., Heschl’s gyrus).
Multivariate pattern analysis (MVPA) was carried out with CoSMo MVPA (Oosterhof et al. 2016) in MATLAB 2017b. Each hemisphere in each participant was analyzed separately. We constructed classifiers to discriminate between each of the 6 possible pairs of vowels (i.e., [ie] vs. [ib]; [ie] vs. [ib]; [ie] vs. [ie]; [ib] vs. [ib]; [ib] vs. [ie]; [ib] vs. [ie]). Each block constituted an exemplar, so for the majority of participants who completed 3 runs, there were 36 exemplars for each pair of vowels to be discriminated (3 runs × 2 vowels × 6 blocks per vowel). We used a leave-one-out cross-validation procedure to evaluate prediction of untrained exemplars. For each left-out exemplar, we created a balanced training set of 34 labeled examples (in participants with 3 runs) by also leaving out one randomly selected exemplar corresponding to the other vowel. Then, a set of univariate t-tests were computed to identify the voxels that best distinguished the 2 vowels in the training data, and the top 65% most informative voxels were retained. Next, a linear support vector machine (sequential minimal optimization, c = 1) was trained on the retained voxels and finally was used to predict the identity of the left-out exemplar. Classifier accuracy for the vowel pair was calculated as the average number of correctly predicted exemplars over all iterations of the cross-validation procedure.
Experimental Design and Statistical Analysis
A total of 3 of the 6 pairs of vowels were directly relevant to our main hypothesis: the across-category pairing of adjacent vowels ([ib] vs. [ib]), and the 2 within-category pairings of adjacent vowels ([ie] vs. [ib] and [ib] vs. [ie]). Accuracy of neural discrimination of the 2 within-category pairs was averaged together to obtain a single measure of within-category neural discrimination. A repeated measures analysis of variance (ANOVA) was carried out with 2 within-subjects factors: vowel pair (across category and within category) and hemisphere (left and right). We hypothesized that if representations in PAC are shaped by linguistic categories, then neural discrimination would be more accurate across category than within category. We did not anticipate any effect of hemisphere, because of the bilaterality of early stages of speech perception (Hickok and Poeppel 2007). F statistics were interpreted nonparametrically by comparing observed test statistics to null distributions of each test statistic derived from 10 000 random permutations of all block labels in each participant (Stelzer et al. 2013). Accuracy with respect to chance was assessed with t statistics that were similarly compared to null distributions derived from 10 000 permutations.
An ancillary analysis was performed in which the 2 within-category pairs were modeled separately. We hypothesized that neural discrimination between across-category vowel pairs would be more accurate than discrimination between either of the within-category pairs.
Results
Task Performance
Task performance in the scanner confirmed that all participants maintained attention to the tonotopic and vowel stimuli throughout their scanning sessions.
In the tonotopy task, participants successfully detected 44.1 ± 7.1% of the 42 instances of laughter, making a median of 40 false alarms (range, 13–88, excluding one outlier who erroneously perceived laughter throughout the task). Many false alarms were in response to crying sounds, which could be reasonably mistaken for laughter in the heavily filtered stimulus.
In the vowel task, participants successfully detected an average of 76.6 ± 12.9% of the level-deviant vowels. The adapted stimulus presentation level was 75.0 ± 15.8% of the standard (−2.5 dB SPL) when averaged across the second half of each run.
Tonotopic Maps
Tonotopic gradients were identified bilaterally across HG and the STG in all participants. Two representative participants are shown in Figure 3. Consistent with previous fMRI studies, each participant showed a V-shaped pair of gradients, with a low-to-high frequency gradient running anteromedially across HG and a second low-to-high gradient oriented towards the posterior STG (Saenz and Langers 2014).
Figure 3.
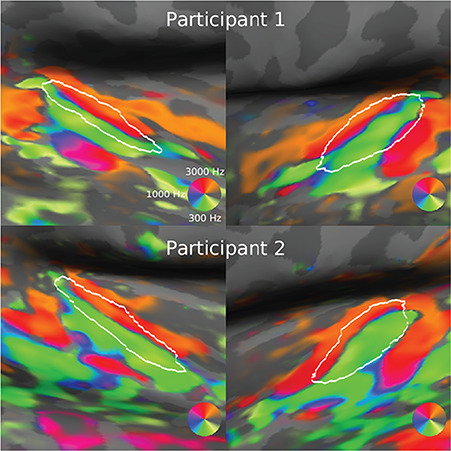
Tonotopic mapping. Two representative participants are shown. White outlines show the border of Heschl’s gyrus as defined in the Desikan–Killiany atlas.
Neural Discrimination Between Pairs of Vowels
Neural discrimination between the 6 possible pairs of vowels in left and right PAC is depicted in Figure 4A. In general, vowel pairs that were further apart on the 4-point F1/F2 continuum were more discriminable than those that were closer together, as indicated by the hotter colors corresponding to acoustically distant vowel tokens and cooler colors corresponding to acoustically adjacent vowel tokens. Note that this pattern could be driven by either phonemic or acoustic differences between the stimuli.
Figure 4.

Classification performance in PAC. (A) Classification accuracy on all pair-wise vowel comparisons. Asterisks denote performance that significantly exceeds chance. Note the high accuracy in discriminating endpoint tokens [ie] and [ie] and the sharp jump in discriminative ability as a category boundary is crossed (e.g., [ie] vs. [ib] compared to [ib] vs. [ib]). (B) Discrimination performance on the across-category vowel pair ([ib], [ib]) versus the average of within-category vowel pairs ([ie], [ib] and [ib], [ie]). Error bars correspond to standard error of the mean. (C) Discrimination performance on the across-category vowel pair versus each within-category vowel pair. Error bars correspond to standard error of the mean.
We next compared neural discrimination in PAC between vowel pairs that crossed a phonemic boundary and vowel pairs within a phonemic category (Fig. 4B). A repeated measures ANOVA with 2 within-subjects factors—vowel pair (across category and within category) and hemisphere (left and right)—showed a main effect of vowel pair (F* = 11.61, P = 0.0099, permutation test), with neural discrimination of across-category vowels (left hemisphere, 60.8 ± 6.2%; right hemisphere, 59.7 ± 10.3%) more accurate than discrimination of within-category vowels (left hemisphere, 54.0 ± 6.8%; right hemisphere, 54.2 ± 6.14%) and better than chance (left hemisphere, t* = 6.73, P < 0.0001, permutation test; right hemisphere, t* = 3.67, P = 0.0057). This finding suggests that within-category vowels are represented more similarly than across-category vowels of the same acoustic distance, mirroring the participants’ categorization data obtained outside the scanner. There was no main effect of hemisphere (F* = 0.0490, P = 0.83), nor an interaction of vowel pair by hemisphere (F* = 0.19, P = 0.67).
We then investigated whether the neural discriminability of both within-category vowel pairs was similar (Fig. 4C). An ANOVA in which the 3 adjacent vowel pairs were coded separately again showed a main effect of vowel pair (F* = 5.94, P = 0.022), no main effect of hemisphere (F* = 0.02, P = 0.89), and no interaction (F* = 1.54, P = 0.24). Follow-up sub-ANOVAs compared the across-category pair to each of the 2 within-category pairs. When across-category discrimination was compared to within-category discrimination of [ie] and [ib], there was a main effect of vowel pair (F* = 12.50, P = 0.0073), as hypothesized. Neural discrimination between [ie] and [ib] was at chance in both hemispheres (left hemisphere, t* = 0.69, P = 0.52; right hemisphere, t* = 0.37, P = 0.73). However, when across-category discrimination was compared to within-category discrimination of [ie] and [ib], although discrimination was numerically better for the across-category pairs, there was no effect of vowel pair (F* = 0.21, P = 0.69). Neural discrimination between [ie] and [ib] was almost above chance in the left hemisphere (t* = 2.31, P = 0.056) and was above chance in the right hemisphere (t* = 3.55, P = 0.0074). There were no interactions or effects of hemisphere in either case. These findings indicate that the 2 within-category pairs did not contribute equally to the primary finding that neural discriminability was better across categories than within categories.
Discussion
The aim of this study was to determine whether vowels are represented in PAC veridically or categorically. We found that in both left and right PAC, neural discrimination between pairs of vowels that crossed a categorical boundary was more accurate than neural discrimination between equivalently spaced vowel pairs that belonged to the same phonemic category. These findings suggest that representations of vowels in PAC are not strictly veridical but are warped by linguistically relevant phonemic categories.
Phonemic Encoding in PAC
The degree of abstraction of auditory representations in PAC is actively debated (Nelken 2008; Steinschneider 2013). PAC has been shown to reflect non-veridical representations of behaviorally relevant sound categories in animals (Ohl et al. 2001; Fritz et al. 2005; Nelken and Bar-Yosef 2008; Niwa et al. 2012) and humans (Steinschneider et al. 1999, 2011; Steinschneider 2013). Encoding of voice onset time is nonlinear in PAC, such that voiced stops drive a single onset response, while unvoiced stops drive a double onset response (Steinschneider et al. 1999). The underlying mechanism appears to be refractory hyperpolarization: a second response is possible only for voice onset times that exceed a certain threshold (Steinschneider et al. 2003). However, this categorical representation of voice onset time boundary is not specific to speech sounds (Steinschneider et al. 2005), nor is it specific to humans (Steinschneider et al. 2003). This lack of specificity suggests that the nonlinear encoding of voice onset time does not reflect linguistic experience but rather a fundamental physiological limit of the auditory systems of mammalian species (Steinschneider 2013). The prevalence of stop voicing contrasts crosslinguistically may be predicated on this natural discontinuity.
In our study, we investigated the contrast between 2 vowels—[i] and [i]—that are immediately adjacent in formant space and are not commonly contrastive in the languages of the world (Crothers 1978). This implies that the boundary between them is more likely to be a function of linguistic experience and less likely to reflect any natural discontinuity arising from physiological properties of the auditory system.
A number of functional imaging studies have successfully reconstructed perceived speech sounds from neural activity in PAC (Formisano et al. 2008; Obleser et al. 2010; Bonte et al. 2014; Evans and Davis 2015; Zhang et al. 2016; Fisher et al. 2018). However, these studies do not bear directly on the question of whether phonemic encoding in PAC is warped by linguistic categories, because speech sounds can in principle be reconstructed based on acoustic differences between them. Indeed, encoding of speech sounds in PAC is scaffolded on tonotopic organization (Versnel and Shamma 1998; Mesgarani et al. 2014; Fisher et al. 2018). In one study, neural activity in early auditory areas was used to decode the perceived category of ambiguous speech sounds (Kilian-Hütten et al. 2011), suggesting a relatively earlier constructive perceptual process. However, this study used 3 different ambiguous stimuli, which were differentially perceived as one phoneme or the other; therefore, it cannot be excluded that successful classification depended on physical differences between the stimuli.
In our study, we showed that endpoint [i] and endpoint [i] could be readily discriminated based on neural data, consistent with previous decoding studies. However, our evidence for categorical encoding in PAC went beyond the ability of PAC to discriminate between adjacent phonemes based on acoustic characteristics.
Phonemic Representations May Emerge Earlier than Previously Demonstrated
Most previous studies that have investigated the neural basis of categorical perception have reported evidence for phonemic encoding in brain regions that are downstream from PAC. In particular, most studies have localized phonemic encoding to the lateral STG or the superior temporal sulcus (Boatman and Miglioretti 2005; Liebenthal et al. 2005; Zevin and McCandliss 2005; Uppenkamp et al. 2006; Joanisse et al. 2007; Obleser et al. 2007; Chang et al. 2010; Turkeltaub and Coslett 2010; Steinschneider et al. 2011; DeWitt and Rauschecker 2012; Bidelman et al. 2013; Leonard et al. 2016; Feng et al. 2018; Bouton et al. 2018). A wider network of frontal and parietal regions have also been implicated in categorical phonemic perception (Hasson et al. 2007; Joanisse et al. 2007; Raizada and Poldrack 2007; Myers et al. 2009; Lee et al. 2012; Chevillet et al. 2013; Du et al. 2014; Alho et al. 2016; Leonard et al. 2016), although some of these findings represent dishabituation effects, which may not be specific to phonemic representations (Zevin et al. 2010), or reflect overt perceptual tasks that depend on the dorsal stream (Hickok and Poeppel 2007).
The most unequivocal evidence for representations that are shaped by linguistic categories was reported by Chang et al. (2010). In that study, synthetic consonant–vowel syllables spanning a continuum from [ba] to [da] to [ga] were presented to patients undergoing surgery, while high-density electrocorticographic recordings were made over the lateral STG. Pairs of syllables could be discriminated only when they crossed a categorical boundary. Note that PAC, being located mostly within the Sylvian fissure, is not accessible to grid electrodes placed on the cortical surface.
Given the correlative nature of functional MRI as well as its low temporal resolution, it is not possible to conclude that computations in PAC itself are necessarily responsible for the nonlinear representations we observed. The categorical encoding in PAC may reflect feedback from higher-level downstream regions, either in superior temporal cortex or in the wider language network (Leonard et al. 2016).
Asymmetries Around the Categorical Boundary
Although we attempted to construct sequences of 4 vowels that would be symmetrical around the category boundary between [i] and [i], our stimuli turned out to be systematically asymmetrical, which was reflected in behavioral as well as neural data. Behaviorally, the near-boundary vowel [ib] was more often “mis-identified” than the near-boundary vowel [ie], within-category discrimination was better towards the [i] end of the continuum, and almost every participant who did not meet our behavioral criteria was excluded because [ib] was not reliably perceived as [i]. The reason that [ib] was too close to the boundary was that in every participant, the endpoint vowel [ie] was constrained by the [i] endpoint of the original 16-vowel continuum, in order to avoid encroaching on other phonemes such as [ɛ] or [e]. This entailed that it was not possible to space the 4 vowels far enough apart to reliably keep [ib] clear of the categorical boundary.
This asymmetry was reflected in the neural data, such that although our primary hypothesis was supported, the effect was driven mostly by lack of neural discrimination between [ie] and [ib], while neural discrimination between [ib] and [ie] was above chance, consistent with the behavioral perceptual data.
This asymmetry of discriminability among high front vowels closely resembles previous behavioral findings (Iverson and Kuhl 1995). The asymmetry raises the possibility that our results may reflect not only the presence of the categorical boundary between English [i] and [i], but also a potential broader pattern whereby discrimination might be better in the central part of vowel space and reduced at its periphery (Lindblom 1986; Polka and Bohn 2011). Future investigations with carefully selected vowel continua in different parts of vowel space, in languages with and without particular vowel contrasts, should be able to disentangle the effects of language-specific categorical boundaries and any universal gradients.
Localization of PAC
The localization of primary and secondary auditory regions in humans, and the correspondence of these regions to nonhuman primates, is incompletely understood (Moerel et al. 2014; Hackett 2015). We defined PAC as tonotopic voxels within Heschl’s gyrus. These bounds are conservative because it is likely that PAC extends onto the adjacent planum temporale and possibly even the lateral STG in humans. PAC is minimally comprised of areas A1 and R, which each contain a tonotopic gradient with a reversal between them. We observed these gradients, but they typically extended beyond our anatomical ROI. The narrow bounds of our PAC ROI strengthen our conclusion that PAC encoding reflects phonemic categories, since it is unlikely that any nonprimary areas were included in our conservative ROI.
We could not investigate phonemic encoding in the lateral STG (Chang et al. 2010) because we did not generally image the whole of the STG due to our narrow field of view and also because our study did not include a functional localizer to define appropriate ROIs in the STG, which contains numerous functionally distinct language regions (Wilson et al. 2018). Consistent with prior research, we found that tonotopic maps extended far beyond Heschl’s gyrus (Striem-Amit et al. 2011; Dick et al. 2012, 2017), but the interpretation of these maps in terms of underlying divisions between auditory regions was not clear.
Conclusion
Our findings indicate that neural encoding of vowels in PAC is not veridical but is shaped by linguistically relevant categories. Further research is warranted to determine whether this categorical encoding arises in PAC or reflects feedback from downstream regions, to clarify the extent to which these findings are shaped by a language-specific phonemic boundary versus broader discriminability gradients in vowel space, and to determine whether the nature of phonemic encoding varies across different functionally defined auditory regions.
Funding
National Institute on Deafness and Other Communication Disorders at the National Institutes of Health (R01 DC013270).
Notes
We gratefully acknowledge the assistance of Fred Dick, Julia Fisher, Allen Newton, Ram Ramachandran, Marty Sereno, Erika Skoe, Chris Stecker, and David Tovar, and we thank all of the individuals who participated in the study.
References
- Alho J, Green BM, May PJC, Sams M, Tiitinen H, Rauschecker JP, Jääskeläinen IP. 2016. Early-latency categorical speech sound representations in the left inferior frontal gyrus. Neuroimage. 129:214–223. [DOI] [PMC free article] [PubMed] [Google Scholar]
- Bidelman GM, Moreno S, Alain C. 2013. Tracing the emergence of categorical speech perception in the human auditory system. Neuroimage. 79:201–212. [DOI] [PubMed] [Google Scholar]
- Boatman DF, Miglioretti DL. 2005. Cortical sites critical for speech discrimination in normal and impaired listeners. J Neurosci. 25:5475–5480. [DOI] [PMC free article] [PubMed] [Google Scholar]
- Bonte M, Hausfeld L, Scharke W, Valente G, Formisano E. 2014. Task-dependent decoding of speaker and vowel identity from auditory cortical response patterns. J Neurosci. 34:4548–4557. [DOI] [PMC free article] [PubMed] [Google Scholar]
- Bouton S, Chambon V, Tyrand R, Guggisberg AG, Seeck M, Karkar S, van de Ville D, Giraud AL. 2018. Focal versus distributed temporal cortex activity for speech sound category assignment. Proc Natl Acad Sci U S A. 115:E1299–E1308. [DOI] [PMC free article] [PubMed] [Google Scholar]
- Brainard DH. 1997. The Psychophysics Toolbox. Spat Vis. 10:433–436. [PubMed] [Google Scholar]
- Chang EF, Rieger JW, Johnson K, Berger MS, Barbaro NM, Knight RT. 2010. Categorical speech representation in human superior temporal gyrus. Nat Neurosci. 13:1428–1432. [DOI] [PMC free article] [PubMed] [Google Scholar]
- Chevillet MA, Jiang X, Rauschecker JP, Riesenhuber M. 2013. Automatic phoneme category selectivity in the dorsal auditory stream. J Neurosci. 33:5208–5215. [DOI] [PMC free article] [PubMed] [Google Scholar]
- Cox RW. 1996. AFNI: software for analysis and visualization of functional magnetic resonance neuroimages. Comput Biomed Res. 29:162–173. [DOI] [PubMed] [Google Scholar]
- Crothers J. 1978. Typology and universals of vowel systems In: Greenberg JH, Ferguson CA, Moravcsik, editors. Universals of human language volume 2: Phonology. Stanford, California: Stanford University Press, pp. 93–152. [Google Scholar]
- Dale AM, Fischl B, Sereno MI. 1999. Cortical surface-based analysis. I. Segmentation and surface reconstruction. Neuroimage. 9:179–194. [DOI] [PubMed] [Google Scholar]
- Desikan RS, Ségonne F, Fischl B, Quinn BT, Dickerson BC, Blacker D, Buckner RL, Dale AM, Maguire RP, Hyman BT et al. 2006. An automated labeling system for subdividing the human cerebral cortex on MRI scans into gyral based regions of interest. Neuroimage. 31:968–980. [DOI] [PubMed] [Google Scholar]
- DeWitt I, Rauschecker JP. 2012. Phoneme and word recognition in the auditory ventral stream. Proc Natl Acad Sci USA. 109:E505–E514. [DOI] [PMC free article] [PubMed] [Google Scholar]
- Dick FK, Lehet MI, Callaghan MF, Keller TA, Sereno MI, Holt LL. 2017. Extensive tonotopic mapping across auditory cortex is recapitulated by spectrally directed attention and systematically related to cortical myeloarchitecture. J Neurosci. 37:12187–12201. [DOI] [PMC free article] [PubMed] [Google Scholar]
- Dick F, Tierney AT, Lutti A, Josephs O, Sereno MI, Weiskopf N. 2012. In vivo functional and myeloarchitectonic mapping of human primary auditory areas. J Neurosci. 32:16095–16105. [DOI] [PMC free article] [PubMed] [Google Scholar]
- Du Y, Buchsbaum BR, Grady CL, Alain C. 2014. Noise differentially impacts phoneme representations in the auditory and speech motor systems. Proc Natl Acad Sci USA. 111:7126–7131. [DOI] [PMC free article] [PubMed] [Google Scholar]
- Evans S, Davis MH. 2015. Hierarchical organization of auditory and motor representations in speech perception: evidence from searchlight similarity analysis. Cereb Cortex. 25:4772–4788. [DOI] [PMC free article] [PubMed] [Google Scholar]
- Fant G. 1968. Analysis and synthesis of speech processes In: Manual of phonetics. Amsterdam, North Holland, pp. 173–277. [Google Scholar]
- Feng G, Gan Z, Wang S, Wong PCM, Chandrasekaran B. 2018. Task-general and acoustic-invariant neural representation of speech categories in the human brain. Cereb Cortex. 28:3241–3254. [DOI] [PMC free article] [PubMed] [Google Scholar]
- Fisher JM, Dick FK, Levy DF, Wilson SM. 2018. Neural representation of vowel formants in tonotopic auditory cortex. Neuroimage. 178:574–582. [DOI] [PMC free article] [PubMed] [Google Scholar]
- Formisano E, De Martino F, Bonte M, Goebel R. 2008. “Who” is saying “what”? Brain-based decoding of human voice and speech. Science. 322:970–973. [DOI] [PubMed] [Google Scholar]
- Fritz J, Elhilali M, Shamma S. 2005. Active listening: task-dependent plasticity of spectrotemporal receptive fields in primary auditory cortex. Hear Res. 206:159–176. [DOI] [PubMed] [Google Scholar]
- Gerrits E, Schouten MEH. 2004. Categorical perception depends on the discrimination task. Percept Psychophys. 66:363–376. [DOI] [PubMed] [Google Scholar]
- Hackett TA. 2015. Anatomic organization of the auditory cortex. Handb Clin Neurol. 129:27–53. [DOI] [PubMed] [Google Scholar]
- Hasson U, Skipper JI, Nusbaum HC, Small SL. 2007. Abstract coding of audiovisual speech: beyond sensory representation. Neuron. 56:1116–1126. [DOI] [PMC free article] [PubMed] [Google Scholar]
- Hickok G, Poeppel D. 2007. The cortical organization of speech processing. Nat Rev Neurosci. 8:393–402. [DOI] [PubMed] [Google Scholar]
- Holt LL, Lotto AJ. 2010. Speech perception as categorization. Atten Percept Psychophys. 72:1218–1227. [DOI] [PMC free article] [PubMed] [Google Scholar]
- Iverson P, Kuhl PK. 1995. Mapping the perceptual magnet effect for speech using signal detection theory and multidimensional scaling. J Acoust Soc Am. 97:553–562. [DOI] [PubMed] [Google Scholar]
- Joanisse MF, Zevin JD, McCandliss BD. 2007. Brain mechanisms implicated in the preattentive categorization of speech sounds revealed using FMRI and a short-interval habituation trial paradigm. Cereb Cortex. 17:2084–2093. [DOI] [PubMed] [Google Scholar]
- Kilian-Hütten N, Valente G, Vroomen J, Formisano E. 2011. Auditory cortex encodes the perceptual interpretation of ambiguous sound. J Neurosci. 31:1715–1720. [DOI] [PMC free article] [PubMed] [Google Scholar]
- Klatt DH. 1980. Software for a cascade/parallel formant synthesizer. J Acoust Soc Am. 67:971–995. [Google Scholar]
- Kluender KR, Lotto AJ, Holt LL, Bloedel SL. 1998. Role of experience for language-specific functional mappings of vowel sounds. J Acoust Soc Am. 104:3568–3582. [DOI] [PubMed] [Google Scholar]
- Kong EJ, Edwards J. 2016. Individual differences in categorical perception of speech: cue weighting and executive function. J Phon. 59:40–57. [DOI] [PMC free article] [PubMed] [Google Scholar]
- Krishnan A, Gandour JT. 2009. The role of the auditory brainstem in processing linguistically-relevant pitch patterns. Brain Lang. 110:135–148. [DOI] [PMC free article] [PubMed] [Google Scholar]
- Lee YS, Turkeltaub P, Granger R, Raizada RDS. 2012. Categorical speech processing in Broca’s area: an fMRI study using multivariate pattern-based analysis. J Neurosci. 32:3942–3948. [DOI] [PMC free article] [PubMed] [Google Scholar]
- Leonard MK, Baud MO, Sjerps MJ, Chang EF. 2016. Perceptual restoration of masked speech in human cortex. Nat Commun. 7:13619. [DOI] [PMC free article] [PubMed] [Google Scholar]
- Liberman AM, Cooper FS, Shankweiler DP, Studdert-Kennedy M. 1967. Perception of the speech code. Psychol Rev. 74:431–461. [DOI] [PubMed] [Google Scholar]
- Liberman AM, Harris KS, Hoffman HS, Griffith BC. 1957. The discrimination of speech sounds within and across phoneme boundaries. J Exp Psychol. 54:358–368. [DOI] [PubMed] [Google Scholar]
- Liebenthal E, Binder JR, Spitzer SM, Possing ET, Medler DA. 2005. Neural substrates of phonemic perception. Cereb Cortex. 15:1621–1631. [DOI] [PubMed] [Google Scholar]
- Lindblom B. 1986. Phonetic universals in vowel systems In: Ohala JJ, Jaeger JJ, editors. Experimental phonology. Orlando (FL): Academic Press, pp. 13–44. [Google Scholar]
- Lopez-Zamora M, Luque JL, Alvarez CJ, Cobos PL. 2012. Individual differences in categorical perception are related to sublexical/phonological processing in reading. Sci Stud Read. 16:443–456. [Google Scholar]
- Massaro DW. 1989. Testing between the TRACE model and the fuzzy logical model of speech perception. Cogn Psychol. 21:398–421. [DOI] [PubMed] [Google Scholar]
- Mesgarani N, Cheung C, Johnson K, Chang EF. 2014. Phonetic feature encoding in human superior temporal gyrus. Science. 343:1006–1010. [DOI] [PMC free article] [PubMed] [Google Scholar]
- Moerel M, De Martino F, Formisano E. 2014. An anatomical and functional topography of human auditory cortical areas. Front Neurosci. 8:225. [DOI] [PMC free article] [PubMed] [Google Scholar]
- Myers EB, Blumstein SE, Walsh E, Eliassen J. 2009. Inferior frontal regions underlie the perception of phonetic category invariance. Psychol Sci. 20:895–903. [DOI] [PMC free article] [PubMed] [Google Scholar]
- Nelken I. 2008. Processing of complex sounds in the auditory system. Curr Opin Neurobiol. 18:413–417. [DOI] [PubMed] [Google Scholar]
- Nelken I, Bar-Yosef O. 2008. Neurons and objects: the case of auditory cortex. Front Neurosci. 2:107–113. [DOI] [PMC free article] [PubMed] [Google Scholar]
- Niwa M, Johnson JS, O’Connor KN, Sutter ML. 2012. Activity related to perceptual judgment and action in primary auditory cortex. J Neurosci. 32:3193–3210. [DOI] [PMC free article] [PubMed] [Google Scholar]
- Obleser J, Leaver AM, Vanmeter J, Rauschecker JP. 2010. Segregation of vowels and consonants in human auditory cortex: evidence for distributed hierarchical organization. Front Psychol. 1:232. [DOI] [PMC free article] [PubMed] [Google Scholar]
- Obleser J, Zimmermann J, Van Meter J, Rauschecker JP. 2007. Multiple stages of auditory speech perception reflected in event-related FMRI. Cereb Cortex. 17:2251–2257. [DOI] [PubMed] [Google Scholar]
- Ohl FW, Scheich H, Freeman WJ. 2001. Change in pattern of ongoing cortical activity with auditory category learning. Nature. 412:733–736. [DOI] [PubMed] [Google Scholar]
- Oosterhof NN, Connolly AC, Haxby JV. 2016. CoSMoMVPA: multi-modal multivariate pattern analysis of neuroimaging data in Matlab/GNU Octave. Front Neuroinform. 10:27. [DOI] [PMC free article] [PubMed] [Google Scholar]
- Pelli DG. 1997. The VideoToolbox software for visual psychophysics: transforming numbers into movies. Spat Vis. 10:437–442. [PubMed] [Google Scholar]
- Peterson GE, Barney HL. 1952. Control methods used in a study of the vowels. J Acoust Soc Am. 24:175–184. [Google Scholar]
- Pisoni DB, Luce PA. 1987. Acoustic-phonetic representations in word recognition. Cognition. 25:21–52. [DOI] [PMC free article] [PubMed] [Google Scholar]
- Polka L, Bohn OS. 2011. Natural referent vowel (NRV) framework: an emerging view of early phonetic development. J Phon. 39:467–478. [Google Scholar]
- Raizada RDS, Poldrack RA. 2007. Selective amplification of stimulus differences during categorical processing of speech.Neuron. 56:726–740. [DOI] [PubMed] [Google Scholar]
- Sachs MB, Young ED. 1979. Encoding of steady-state vowels in the auditory nerve: representation in terms of discharge rate. J Acoust Soc Am. 66:470–479. [DOI] [PubMed] [Google Scholar]
- Saenz M, Langers DRM. 2014. Tonotopic mapping of human auditory cortex. Neuroimaging. 307:42–52. [DOI] [PubMed] [Google Scholar]
- Sereno MI, Dale AM, Reppas JB, Kwong KK, Belliveau JW, Brady TJ, Rosen BR, Tootell RB. 1995. Borders of multiple visual areas in humans revealed by functional magnetic resonance imaging. Science. 268:889–893. [DOI] [PubMed] [Google Scholar]
- Steinschneider M. 2013. Phonemic representations and categories In: Cohen YE, Popper AN, Fay RR, editors. Neural correlates of auditory cognition. New York: Springer New York, pp. 151–191. [Google Scholar]
- Steinschneider M, Fishman YI, Arezzo JC. 2003. Representation of the voice onset time (VOT) speech parameter in population responses within primary auditory cortex of the awake monkey. J Acoust Soc Am. 114:307–321. [DOI] [PubMed] [Google Scholar]
- Steinschneider M, Nourski KV, Kawasaki H, Oya H, Brugge JF, Howard MA. 2011. Intracranial study of speech-elicited activity on the human posterolateral superior temporal gyrus. Cereb Cortex. 21:2332–2347. [DOI] [PMC free article] [PubMed] [Google Scholar]
- Steinschneider M, Volkov IO, Fishman YI, Oya H, Arezzo JC, Howard MA. 2005. Intracortical responses in human and monkey primary auditory cortex support a temporal processing mechanism for encoding of the voice onset time phonetic parameter. Cereb Cortex. 15:170–186. [DOI] [PubMed] [Google Scholar]
- Steinschneider M, Volkov IO, Noh MD, Garell PC, Howard MA. 1999. Temporal encoding of the voice onset time phonetic parameter by field potentials recorded directly from human auditory cortex. J Neurophysiol. 82:2346–2357. [DOI] [PubMed] [Google Scholar]
- Stelzer J, Chen Y, Turner R. 2013. Statistical inference and multiple testing correction in classification-based multi-voxel pattern analysis (MVPA): random permutations and cluster size control. Neuroimage. 65:69–82. [DOI] [PubMed] [Google Scholar]
- Striem-Amit E, Hertz U, Amedi A. 2011. Extensive cochleotopic mapping of human auditory cortical fields obtained with phase-encoding FMRI. PLoS One. 6:e17832. [DOI] [PMC free article] [PubMed] [Google Scholar]
- Turkeltaub PE, Coslett HB. 2010. Localization of sublexical speech perception components. Brain Lang. 114:1–15. [DOI] [PMC free article] [PubMed] [Google Scholar]
- Uppenkamp S, Johnsrude IS, Norris D, Marslen-Wilson W, Patterson RD. 2006. Locating the initial stages of speech-sound processing in human temporal cortex. Neuroimage. 31:1284–1296. [DOI] [PubMed] [Google Scholar]
- van Hessen AJ, Schouten ME. 1999. Categorical perception as a function of stimulus quality. Phonetica. 56:56–72. [DOI] [PubMed] [Google Scholar]
- Versnel H, Shamma SA. 1998. Spectral-ripple representation of steady-state vowels in primary auditory cortex. J Acoust Soc Am. 103:2502–2514. [DOI] [PubMed] [Google Scholar]
- Werker JF, Gilbert JHV, Humphrey K, Tees RC. 1981. Developmental aspects of cross-language speech perception. Child Dev. 52:349–355. [PubMed] [Google Scholar]
- Wilson SM, Bautista A, McCarron A. 2018. Convergence of spoken and written language processing in the superior temporal sulcus. Neuroimage. 171:62–74. [DOI] [PMC free article] [PubMed] [Google Scholar]
- Worsley KJ, Liao CH, Aston J, Petre V, Duncan GH, Morales F, Evans AC. 2002. A general statistical analysis for fMRI data. Neuroimage. 15:1–15. [DOI] [PubMed] [Google Scholar]
- Young ED. 2008. Neural representation of spectral and temporal information in speech. Philos Trans R Soc Lond B Biol Sci. 363:923–945. [DOI] [PMC free article] [PubMed] [Google Scholar]
- Zevin JD, McCandliss BD. 2005. Dishabituation of the BOLD response to speech sounds. Behav Brain Funct. 1:4. [DOI] [PMC free article] [PubMed] [Google Scholar]
- Zevin JD, Yang J, Skipper JI, McCandliss BD. 2010. Domain general change detection accounts for “dishabituation” effects in temporal-parietal regions in functional magnetic resonance imaging studies of speech perception. J. Neurosci. 30:1110–1117. [DOI] [PMC free article] [PubMed] [Google Scholar]
- Zhang Q, Hu X, Luo H, Li J, Zhang X, Zhang B. 2016. Deciphering phonemes from syllables in blood oxygenation level-dependent signals in human superior temporal gyrus. Eur. J. Neurosci. 43:773–781. [DOI] [PubMed] [Google Scholar]
- Zhao TC, Kuhl PK. 2018. Linguistic effect on speech perception observed at the brainstem. Proc Natl Acad Sci USA. 115:8716–8721. [DOI] [PMC free article] [PubMed] [Google Scholar]