

SUMMARY
Adenosine-to-inosine RNA editing is catalyzed by adenosine deaminase acting on RNA (ADAR) enzymes that deaminate adenosine to inosine. Although many RNA editing sites are known, few trans regulators have been identified. We perform BioID followed by mass spectrometry to identify trans regulators of ADAR1 and ADAR2 in HeLa and M17 neuroblastoma cells. We identify known and novel ADAR-interacting proteins. Using ENCODE data, we validate and characterize a subset of the novel interactors as global or site-specific RNA editing regulators. Our set of novel trans regulators includes all four members of the DZF-domain-containing family of proteins: ILF3, ILF2, STRBP, and ZFR. We show that these proteins interact with each ADAR and modulate RNA editing levels. We find ILF3 is a broadly influential negative regulator of editing. This work demonstrates the broad roles that RNA binding proteins play in regulating editing levels, and establishes DZF-domain-containing proteins as a group of highly influential RNA editing regulators.
Graphical Abstract

In Brief
RNA editing is an essential cellular process mediated by ADARs, but few trans regulators are known. Freund et al. use BioID to identify ADAR interactors, including all DZF-domain-containing proteins. One of these, ILF3, is shown to be a global negative regulator of editing, establishing this family as influential editing regulators.
INTRODUCTION
RNA editing is a widely conserved and pervasive method of mRNA modification in which the sequence of a mRNA is altered from that encoded by the DNA (Nishikura, 2016; Walkley and Li, 2017). In mammals, the most prevalent type of RNA editing is adenosine-to-inosine (A-to-I) RNA editing (Eisenberg and Levanon, 2018). After editing occurs, inosine is recognized by the cellular machinery as guanosine (G); therefore, the editing of a nucleotide can have a variety of effects, including altering RNA processing, changing splice sites, and expanding the coding capacity of the genome (Burns et al., 1997; Nishikura, 2010; Rueter et al., 1999). A-to-I editing is catalyzed by adenosine deaminase acting on RNA (ADAR) proteins, which are conserved in meta-zoans (Nishikura, 2016).
Humans have two catalytically active ADAR proteins, ADAR1 and ADAR2, that together are responsible for millions of RNA editing events across the transcriptome. ADAR1 primarily edits long, near-perfect double-stranded RNA (dsRNA) regions that are formed by inverted repeats, predominantly Alu elements (Athanasiadis et al., 2004; Bazak et al., 2014; Blow et al., 2004; Levanon et al., 2004). These editing events have been shown to play a role in self versus non-self RNA recognition in the innate immune response, and thus dysregulation of ADAR1 leads to immune-related diseases such as Aicardi-Goutières syndrome (AGS) (Blango and Bass, 2016; Liddicoat et al., 2015; Mannion et al., 2014; Pestal et al., 2015; Rice et al., 2012). ADAR1 levels also correlate with tumor aggressiveness, because increases in ADAR1 editing suppress the innate immune response in tumors; accordingly, ADAR1 ablation helps with cancer therapy (Bhate et al., 2019; Gannon et al., 2018; Ishizuka et al., 2019; Liu et al., 2019; Nemlich et al., 2018). Although the majority of ADAR1-regulated editing sites are found in repeat regions, ADAR2 is primarily responsible for editing adenosines found in non-repeat regions, particularly in the brain (Tan et al., 2017). ADAR2-regulated sites in non-repetitive regions include a number of editing events that alter the protein-coding sequences of neuronal RNAs, including GluR2, which encodes a glutamate receptor in which RNA editing is necessary for its proper function. Further demonstrating the important role of neuronal editing, dysregulation of human ADAR2 is associated with multiple neurological diseases, including amyotrophic lateral sclerosis, astrocytoma, and transient forebrain ischemia (Slotkin and Nishikura, 2013; Tran et al., 2019). Maintaining RNA editing levels is critical for human health, but how RNA editing levels are regulated at specific editing sites across tissues and development is poorly understood.
RNA sequence and structure are critical determinants of editing levels, but studies querying tissue-specific and developmental-stage-specific editing levels show that the level of editing at the same editing site can vary greatly between individuals and tissues. These changes do not always correlate with ADAR mRNA or protein expression, suggesting a complex regulation of editing events by factors other than ADAR proteins (Sapiro et al., 2019; Tan et al., 2017; Wahlstedt et al., 2009). Recently, an analysis of proteins with an RNA-binding domain profiled by Encyclopedia of DNA Elements (ENCODE) suggested that RNA binding proteins (RBPs) play a role in RNA editing regulation (Quinones-Valdez et al., 2019). In mammals, a small number of trans regulators of editing have been identified through functional experiments. Some of these trans regulators of editing are site specific, in that they affect editing levels at only a small subset of editing sites. These include RBPs, such as DHX15, HNRNPA2/B1, RPS14, TDP-43, Drosha, and Ro60 (Garncarz et al., 2013; Quinones-Valdez et al., 2019; Tariq et al., 2013). The recently identified ADAR binding partners, ELAVL1, DHX9, and SRSF9, have also been shown to affect the editing level of specific sites (Aktaş et al., 2017; Huang et al., 2018; Shanmugam et al., 2018; Stellos et al., 2016). In addition to site-specific regulators of editing, Pin1, WWP2, and AIMP2 have been shown to regulate editing through post-translational modification of the ADAR proteins (Behm et al., 2017; Marcucci et al., 2011; Tan et al., 2017). However, the complexity of editing level regulation across millions of editing sites in numerous tissues and developmental stages suggests that there are likely many other proteins that regulate editing.
Here, we take a unique approach to identify novel regulators of the ADAR proteins. We employ BioID, which facilitates the biotinylation and subsequent purification of proteins that both transiently and stably interact with bait proteins (Roux et al., 2012), to uncover proteins that interact with ADAR1 and ADAR2 in two human cell lines, HeLa and BE(2)-M17 cells. Together, these experiments facilitate the identification of 269 ADAR-interacting proteins, 15 of which had been previously reported, and many of which we further validate using publicly available RNA sequencing (RNA-seq) data. Interestingly, the top candidates for novel regulators of ADARs are a family of proteins that all contain a DZF domain: ILF3, ILF2, STRBP, and ZFR. These proteins interact with both ADAR1 and ADAR2 in an RNA-dependent manner. We further characterize ILF3 and find that it acts as a negative regulator of editing that binds RNA near editing sites. Furthermore, we demonstrate that the RNA binding domains of ILF3 are necessary for its editing regulation. In a concurrent work (Sapiro et al., 2020 [this issue of Cell Reports]), we further characterize ZFR and demonstrate that it is a regulator of RNA editing conserved in mammals and Drosophila. These results demonstrate the importance of this class of DZF-domain-containing proteins as a novel group of RNA editing regulators and demonstrate the utility of the BioID approach to systematically identify ADAR-interacting proteins that regulate RNA editing levels.
RESULTS
ADAR1 and ADAR2 BioID Identifies Known and Candidate Regulators of RNA Editing
RNA editing levels are dynamically regulated, but few proteins responsible for this regulation are known. We set out to identify novel regulators of the ADAR proteins by identifying the proteins that ADAR1 and ADAR2 interact with in the cell. We hypothesized that proteins that transiently interact with ADAR might compete with or recruit ADAR at only subsets of mRNA loci, making them good candidates for site-specific regulators of RNA editing. To identify these proteins, we utilized the BioID system (Roux et al., 2012). This method expands upon traditional immunoprecipitation (IP) and mass-spectrometry-based screening used to identify protein-protein interactions. Traditional IPs enrich for proteins that form a stable complex with the bait protein but are less effective at identifying transient interactions. The BioID protocol efficiently captures both this transiently interacting class of regulators and the more standard stable protein partners by covalently labeling factors as they come into close proximity (Ȉ10 nm) with a bait protein (Kim et al., 2014). These labeled proteins can then be immunoprecipitated and identified by mass spectrometry (Figure 1A). To utilize this system, we fused ADAR proteins with a mutated form of the BirA biotin ligase (R118G), denoted BirA* (Kwon et al., 2000; Roux et al., 2012), which promiscuously and irreversibly biotinylates proteins in a proximity-dependent manner.
Figure 1. BioID in Human Cells Identifies Known and Novel Regulators of ADAR1 and ADAR2.

(A) Schematic depicting BioID protocol for ADAR. A fusion of ADAR1 or ADAR2 with the BirA* enzyme was expressed in cells, and the media were supplemented with exogenous Biotin, allowing for the fusion protein to biotinylate proximal proteins. A streptavidin IP was then performed to isolate biotinylated proteins. The eluted proteins were then identified by mass spectrometry.
(B) Schematic of BioID experimental conditions. The experiment was performed with two different BioID fusion proteins, BirA*-ADAR1 and BirA*-ADAR2, and two negative controls, BirA*-GFP and untransfected cells with no BirA* expressed. Each fusion protein and control was assayed in HeLa and M17 cells for a total of eight experimental conditions, performed in triplicate.
(C) Pipeline depicting the analysis performed to determine and rank BioID hits. A series of filters was applied using each control condition to remove false positives. Median fold change over the GFP condition was used to rank the hits.
(D) Venn diagram depicting the hits from each BioID experiment. The hits from each BioID condition are indicated by differently colored ovals (pink: HeLa ADAR2, green: M17 ADAR2, yellow: M17 ADAR1, blue: HeLa ADAR1). The numbers indicate the number of hits that overlap between each condition, and the proteins denoted in bold are the BioID hits further characterized in this study.
We lentivirally integrated either BirA*-ADAR1 or BirA*-ADAR2 constructs into two human cell lines, neuroblastoma BE(2)-M17 (M17) cells and HeLa cells. By using two cell lines, we hoped to identify both tissue-specific and universal editing regulators. To first demonstrate that the constructs were expressed and localized to the correct cellular compartments, we performed immunofluorescence against FLAG in each cell line (Figure S1A). We then assessed editing levels at two editing sites to show that the constructs were functional. We observed an increase in editing at an ADAR1-specific site in PAICS upon expression of BirA*-ADAR1 and an increase in editing at an ADAR2-specific site in GRIA2 upon expression of BirA*-ADAR2 compared with a BirA*-GFP control (Figure S1B), demonstrating that the BirA*-ADAR constructs produce functional ADAR proteins.
After verifying the activity of the BirA*-ADAR proteins, we performed the BioID experiments. We produced three biological replicates in both M17 and HeLa cells for both BirA*-ADAR1 and BirA*-ADAR2, along with three replicates of two different negative controls: nuclear localized BirA*-GFP and cells with no transgene, and thus no BirA* expression (Figure 1B). The cells were incubated overnight with D-biotin to allow the fusion proteins to biotinylate interactors. We then performed a stringent denaturing pull-down with streptavidin agarose and analyzed the elution by mass spectrometry (see STAR Methods for details). To identify the putative ADAR1- and ADAR2-interacting proteins from our list of all proteins returned from the mass spectrometry, we utilized the following criteria: for each protein, we determined the fold change in peptide counts in the BirA*-ADAR condition compared with the BirA*-GFP condition and, separately, the fold change compared with the no BirA* condition. We required that both fold changes be >2 in at least two biological replicates in order for a protein to be defined as a hit (Figures 1C and S1C). Both raw and processed BioID mass spectrometry data are available in Table S1. In total, we identified 269 proteins as putative interactors of either ADAR1 and/or ADAR2 in HeLa and/or M17 cells. When comparing across all four conditions, we found hits unique to each condition: 26 proteins unique to ADAR1 and 201 unique to ADAR2, 127 proteins unique to HeLa cells and 118 unique to M17 cells, and 57 proteins shared across multiple conditions (Figures 1D, S1D, and S1E). Supporting the efficacy of this screening approach, we found many of the proteins previously reported to affect editing or interact with ADAR proteins. The ADAR-interacting proteins we identified included DHX15, RPS14, and ELAVL1, which were previously reported to regulate editing at specific sites, and SFPQ, HNRNPH1, and PTBP1, which are known post-transcriptional regulators of ADARs (Hirose et al., 2014; Yang et al., 2015). We also identified known ADAR-interacting protein CPSF6 and proteins involved in L1 Line element retrotransposition that were previously found in a complex with ADAR1: DHX15, SFPQ, NCL, TUBB, NONO, HSPA8, SF3B1, and HNRNPL (Binothman et al., 2017; Orecchini et al., 2017). Furthermore, we identified proteins that, like ADAR, bind the ACA11 transcript: SF3B1, PARP1, NCL, DDX21, and ILF3 (Figures 1D and S1E) (Chu et al., 2012).
Overall, we found many more candidates specific to ADAR2 than ADAR1, which is likely due to the fact that BirA*-ADAR2 was more highly expressed than BirA*-ADAR1; we found that overexpressed ADAR2 consistently accumulates to higher protein levels than overexpressed ADAR1, perhaps reflecting different mechanisms of regulation (data not shown). We also found a large number of cell-type-specific ADAR interactors (118 M17 versus 127 HeLa hits), which we hypothesized might be differentially expressed between the two cell types. To determine whether cell-type-specific interactors were more highly expressed in the cell type in which they were identified, we measured the expression level of our candidates in each cell line using RNA-seq. We found that candidates specific to M17 cells were more highly expressed in M17 cells than in HeLa cells (as measured by fragments per kilobase of exon model per million reads mapped [FPKM], Wilcoxon test, p < 0.001), but the reverse was not true, suggesting that differential mRNA expression does not fully explain the specificity of proteins interacting with ADARs in these two cell types (Figures S2A and S2B).
ADAR-Interacting Proteins Bind Near Editing Sites to Alter Editing Levels
Many proteins found in the BioID screen were RBPs and RNA-processing enzymes, suggesting enrichment for biologically relevant proteins. We utilized publicly available RNA-seq data from short hairpin RNA (shRNA) knockdowns performed in K562 cells by the ENCODE project (Sundararaman et al., 2016) to identify whether any of the RBPs identified in the BioID altered editing levels. We found that knockdown of 8 of the 19 proteins profiled by ENCODE resulted in increases or decreases in the editing levels of more than 100 sites, whereas the remaining 11 affected a smaller, more specific set of sites (Figures 2A and S2C). This was not due to changes in ADAR levels, because knockdown of these factors did not significantly alter ADAR1 or ADAR2 expression levels (Table S2). We hypothesized that RBPs that affected editing might bind RNA near editing sites and alter ADAR binding and, therefore, editing levels at those sites. To test whether this was true of these 19 candidate interactors, we utilized the publicly available enhanced crosslinking and immunoprecipitation followed by high-throughput sequencing (eCLIP-seq) data to identify the RNA binding sites of the 19 candidates profiled by ENCODE. We determined the proximity of each protein’s RNA binding sites to known editing sites. Of these 19 candidates, 4 showed evidence of binding at editing sites (Figure 2B), and 9 showed evidence of binding nearby, but not right at, editing sites (Figure 2C). This is consistent with the hypothesis that these RBPs might interfere with or recruit ADARs to these editing sites. The remaining six candidates did not show evidence of binding near editing sites (Figure 2D). Included in this last group is PTBP1, which has been shown to be a translational regulator of ADAR (Yang et al., 2015); this role may explain why it physically interacts with ADAR but does not bind near editing sites. For the 13 RBPs that bound RNA at or near editing sites, we compared the positions of their binding sites with the editing sites that they regulated to determine whether their knockdown affected editing levels specifically at the sites that were bound by the proteins. We found a statistical enrichment for 11 of the 13 candidates indicating that they changed editing levels at editing sites near where they bound RNA, suggesting a direct role in RNA editing (Figure 2E). Of those proteins, only U2AF2 and XRCC6 altered the majority of known editing sites in a single direction (Figures 2A and 2E), suggesting that RBP binding at or near editing sites does not necessarily lead to the same change in editing levels at every site.
Figure 2. RNA-Seq and eCLIP-Seq Analyses Identify Regulatory RNA Binding Proteins of RNA Editing.

(A) Scatterplots of pairwise comparison of editing levels between knockdown and control RNA-seq of eight regulatory RBPs. Red dots, Fisher’s exact test p < 0.05.
(B–D) Z scores showing the observed RBP binding strength around editing sites over the expected one, measured in standard deviations (see STAR Methods for details) for (B) RBPs that bind directly to editing sites in eCLIP-seq, (C) RBPs that bind nearby editing sites (non-overlapping) in eCLIP-seq, and (D) RBPs that show no enrichment of binding near editing sites in eCLIP-seq. (E) Comparison of editing profile differences in knockdowns between sites bound by RBPs (light blue) and the ones unbound (dark blue). CDED, cumulative distribution of editing level deviation, quantifies the accumulative editing level difference from the mean between controls and knockdowns (STAR Methods).
DZF-Domain-Containing Proteins Interact with ADAR1 and ADAR2 in an RNA-Dependent Manner
One group of proteins that we identified in the BioID were four related proteins, ILF2, ILF3, STRBP, and ZFR, which are the only four human proteins that contain a DZF domain. The function of the DZF domain (domain associated with zinc fingers) is poorly understood, but it has been shown to drive protein dimerization and facilitate RNA binding (Castello et al., 2016; Wolkowicz and Cook, 2012). Two of these DZF-domain-containing proteins, ILF3 and ZFR, were the only proteins identified as hits in all four BioID conditions (ADAR1 and ADAR2 interactors in both cell types). ILF3 has been shown previously to interact with ADAR1 in an RNA-dependent manner in the cytoplasm (Guan et al., 2008; Nie et al., 2005), and our results support that finding. Another DZF-domain-containing protein, STRBP, was identified in three out of four conditions (all except HeLa BirA*-ADAR1), and the fourth, ILF2, was identified in the M17 BirA*-ADAR1 condition, strongly suggesting that DZF-domain-containing proteins interact with ADAR proteins. In addition to a DZF domain, all three proteins except for ILF2 contain RNA binding domains, (Figure 3A). ILF3 and STRBP have two dsRBDs, similar to ADAR1 and ADAR2, whereas ZFR has three widely spaced zinc-finger domains, which are thought to mediate interaction with dsRNAs (Meagher et al., 1999). Intriguingly, ILF3’s dsRBDs have been shown to be structurally similar to those of ADAR2 and to compete for similar binding sites in vitro (Wolkowicz and Cook, 2012). In addition, ILF3 has been shown to regulate circular RNA biogenesis by binding near the highly edited Alu elements (Li et al., 2017). Because this entire class of proteins was highly enriched in the BioID and had been previously suggested to interact with ADAR1, we chose to further characterize this class of proteins to understand their regulation of RNA editing.
Figure 3. Co-immunoprecipitations (CoIPs) Demonstrate that DZF-Domain-Containing BioID Hits Interact with ADAR1 and ADAR2 in an RNA-Dependent Manner.
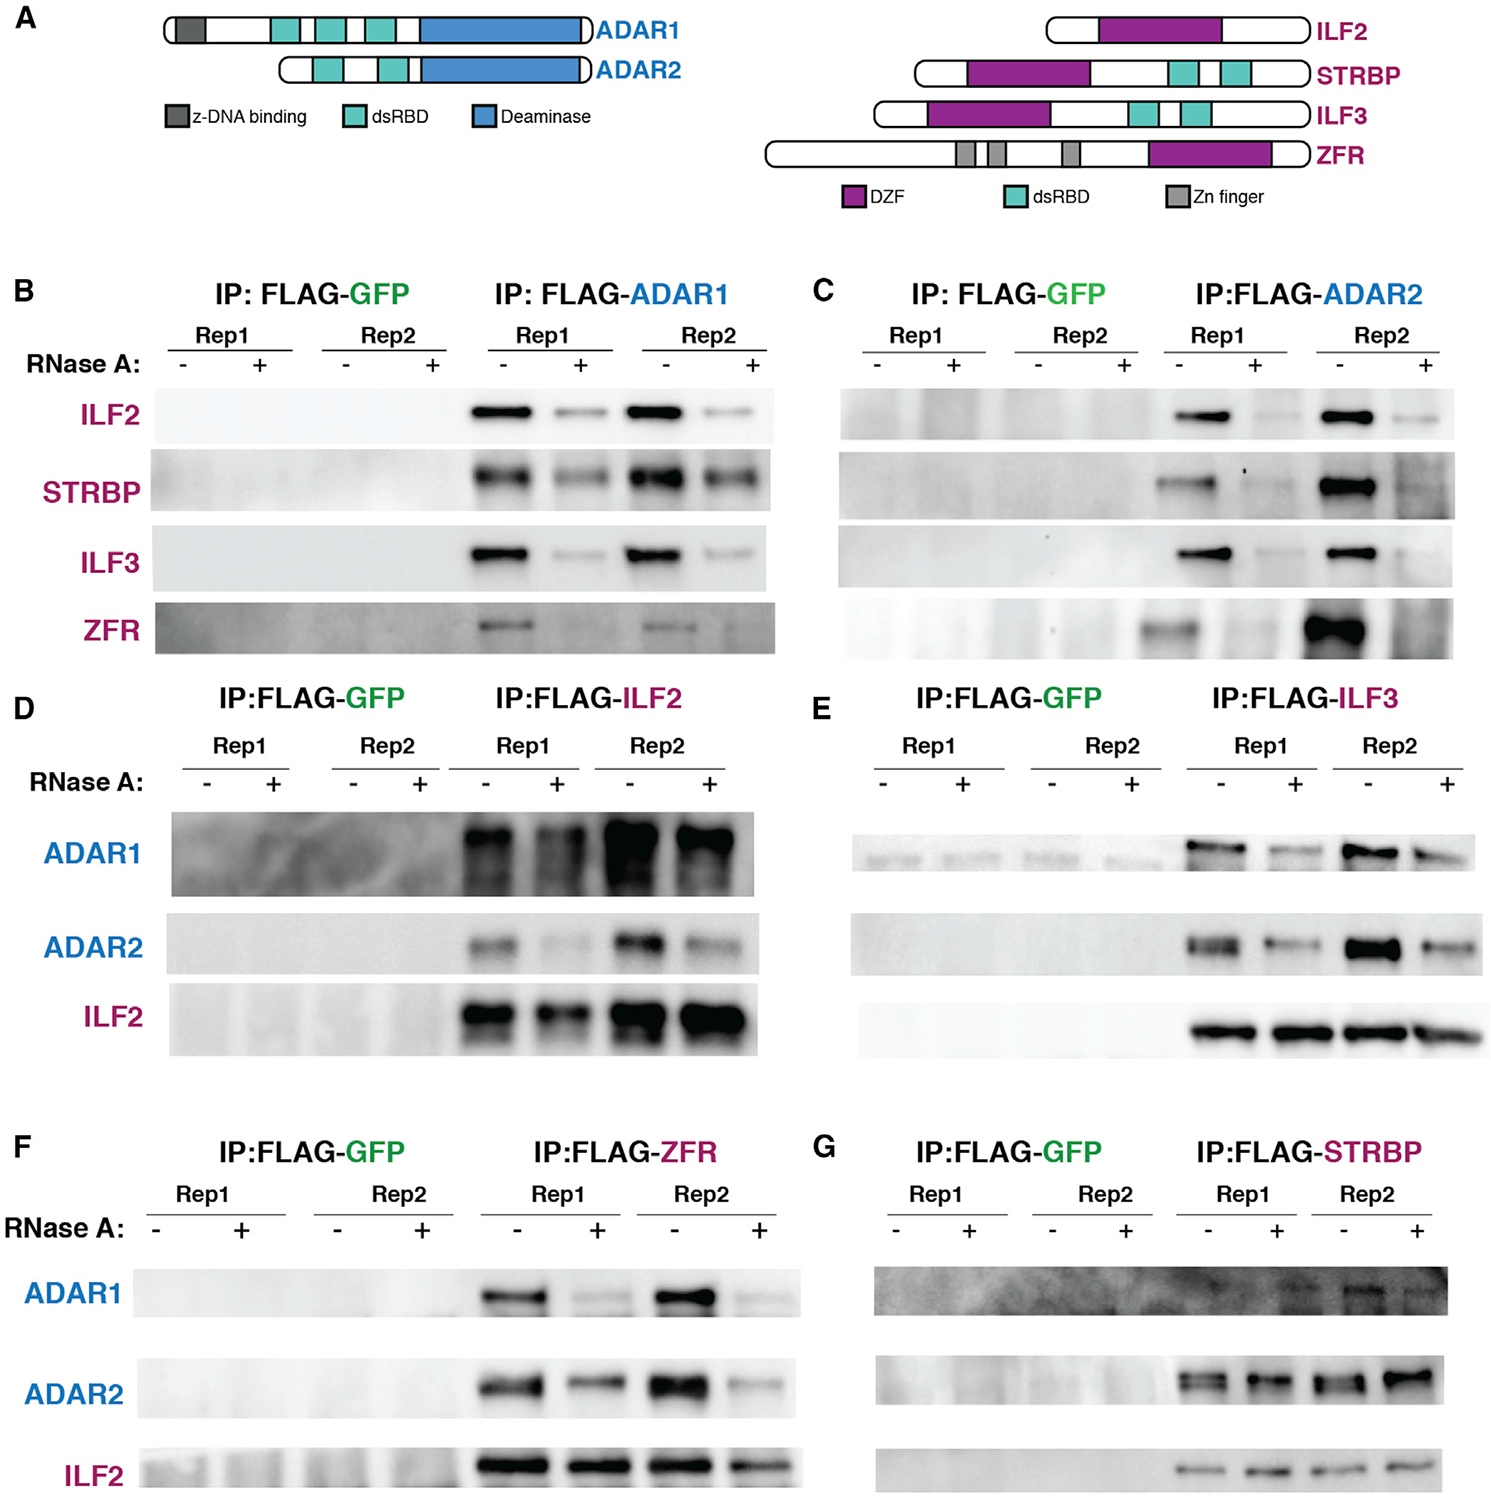
(A) Schematic depicting ADAR1, ADAR2, and DZF-domain-containing proteins ILF2, STRBP, ILF3, and ZFR. Conserved domains are indicated with different colors.
(B and C) Western blots of FLAG immunoprecipitation from M17 cells overexpressing either FLAG-GFP (negative control), (B) FLAG-ADAR1, or (C) FLAG-ADAR2. IPs were performed with or without the addition of RNase A to the lysates prior to IP, as indicated.
(D–G) Western blots of FLAG immunoprecipitation from M17 cells overexpressing ADAR2, as well as FLAG-GFP (negative control) or a FLAG-tagged version of each DZF-domain-containing protein, (D) ILF2, (E) ILF3, (F) ZFR, and (G) STRBP. IPs were performed with or without the addition of RNase A to the lysates prior to IP, as indicated. ILF2, which interacts with itself, ILF3, ZFR, and STRBP in an RNA-independent manner, was used as a positive control. All experiments were performed at least three times, and a representative result is shown.
To validate the interaction between ILF3, ZFR, STRBP, and ILF2 and each ADAR protein, we performed traditional co-immunoprecipitations in M17 cells. We transduced a FLAG-tagged ADAR1, ADAR2, or GFP as a negative control into M17 cells (Figures S3A and S3B) and performed an IP using an antibody against FLAG. To further determine whether the interaction between each ADAR and each DZF-domain-containing candidate was dependent on RNA, we treated half of each of the IPs with RNase A. Whereas FLAG-GFP did not immunoprecipitate any of the four candidates, FLAG-ADAR1 and FLAG-ADAR2 immunoprecipitated each DZF-domain-containing protein. In all cases, the interaction between each candidate and each ADAR was decreased upon addition of RNase A, suggesting that their interaction is at least partially RNA dependent, and that they do not form a stable complex independent of RNA (Figures 3B and 3C).
We also wanted to interrogate the reciprocal condition, the ability of each DZF-domain-containing protein to immunoprecipitate each ADAR protein; however, M17 and HeLa cells do not express high levels of ADAR2, making it difficult to analyze the interaction between endogenous ADAR2 and each candidate in these cells. To address this problem, we created an M17 cell line overexpressing ADAR2 by lentiviral transduction. We then stably expressed a FLAG-tagged version of each candidate, or FLAG-GFP as a negative control, in the ADAR2-overexpressing M17 cell line (M17-ADAR2-OE) (Figures S3C–S3F). We performed FLAG IPs with and without RNase A treatment in this cell line. We used pull-down of ILF2 as a positive control because previous work established that it binds each of the other DZF-domain-containing proteins in an RNA-independent manner, and thus we would expect to see that it binds each candidate protein with and without RNase A (Wolkowicz and Cook, 2012). As expected, ILF2, ILF3, and ZFR all bound ADAR1 and ADAR2 in an RNA-dependent manner and bound ILF2 independent of RNA (Figures 3D–3G). Unexpectedly, in contrast with the FLAG-ADAR2 IP, in the FLAG-STRBP IP we found an RNA-independent interaction between STRBP with ADAR2 (Figure 3G), which could indicate a different mode of interaction depending on the bait protein. Taken together, we validated that three of our top candidates biochemically interact with ADARs in an RNA-dependent manner.
DZF-Domain-Containing Proteins Affect A-to-I RNA Editing
Similar to the validation of other candidates that we performed with publicly available RNA-seq and eCLIP-seq data, we wanted to perform a more thorough analysis of the role of DZF-domain-containing proteins in A-to-I RNA editing. We transiently overexpressed ILF2, ILF3, and STRBP in HEK293T cells and in HEK293T cells stably overexpressing ADAR2 through lentiviral transduction (HEK293T-ADAR2-OE) (Figures 4A and 4B); as in M17 cells, ADAR1 is constitutively expressed in HEK293T cells, but ADAR2 is lowly expressed, thus requiring overexpression for analysis of ADAR2-controlled editing sites. We choose to perform these experiments in HEK293T cells both because, in contrast with M17 cells, they were suitable for transient transfection and it extended our findings to a third cell type. We first verified that each protein was overexpressed at the transcript level (Figures 4A and 4B) and protein level (Figures S3G and S3H). To examine the effects of the DZF-domain-containing proteins on editing levels, we used microfluidic multiplex PCR and sequencing (mmPCR-seq), in which we PCR-amplified cDNA at thousands of known editing sites for subsequent Illumina sequencing (Zhang et al., 2014). mmPCR-seq editing level measurements were highly reproducible between two biological replicates from each cell type (Figure S4A; Table S3). We compared the editing levels at these highly reproducible sites between the GFP-overexpressing control and the cells overexpressing DZF-domain-containing proteins in both HEK293T and HEK293T-ADAR2-OE backgrounds. Overexpression of ILF2 had a moderate effect in both HEK293T and HEK293TADAR2-OE cells (Figures 4C and 4D); 11 sites had reduced editing in HEK293T cells, whereas 15 sites showed increased editing, and 18 sites showed reduced editing in HEK293TADAR2-OE cells. This relatively weak and bidirectional effect on editing is consistent with ILF2’s identification in only one of the four BioID conditions (interacting with ADAR1 in M17 cells), suggesting that on its own it may not be a robust ADAR interactor. STRBP demonstrated a slightly stronger effect; 19 sites were reduced in HEK293T cells and 27 in HEK293T-ADAR2-OE cells, with only 7 and 3 sites increased in editing, respectively (Figures 4E and 4F). By far, ILF3 demonstrated the strongest effect; 39 sites were decreased in HEK293T cells and 47 in HEK293TADAR2-OE cells, with only 4 and 1 editing site showing increased editing levels, respectively (Figures 4G and 4H). To better understand the role of ILF3 in editing regulation, we performed RNA-seq on cells with ILF3 overexpression in both HEK293T and HEK293T-ADAR2-OE backgrounds. Similar to mmPCR-seq, editing level measurements were highly reproducible between two biological replicates from each cell type (Figure S4B; Table S4). This more expansive genome-wide analysis further revealed ILF3 to be a global regulator of editing, because almost the entire editing landscape was reduced when ILF3 was overexpressed. We observed 221 sites with a significantly reduced editing level (p < 0.05, Fisher’s exact test) compared with only 16 with an increased editing level in HEK293T cells, and we found 237 sites with a significantly reduced editing level compared with only 2 with an increased editing level in HEK293T-ADAR2-OE cells (Figure 4I). In addition, we calculated overall editing as the total number of edited G reads over the total number of A + G reads at all known editing sites combined as a global measure of ADAR activity (Tan et al., 2017). We found that in both HEK293T and HEK293T-ADAR2-OE cells, overall editing was significantly reduced, from 2.43% to 1.45% in HEK293T cells and from 4.56% to 2.45% in HEK293T-ADAR2-OE cells (Figure 4J; Table S4). Overall, our data showed that ILF3 and STRBP are both negative regulators of editing, but that ILF3 is a stronger global regulator of editing.
Figure 4. Overexpression of DZF-Domain-Containing Proteins Alters RNA Editing Levels.

(A and B) FPKMs of ILF2, STRBP, and ILF3 in (A) HEK293T and (B) HEK293T-ADAR2-overpression cells transiently transfected with GFP, ILF2, STRBP, or ILF3. Error bars represent standard deviation.
(C–H) Scatterplots comparing RNA editing levels assayed by mmPCR-seq in HEK293T cells (upper) and HEK293T cells stably overexpressing ADAR2 (lower). Plots compare editing levels in cells overexpressing GFP with editing levels in cells overexpressing a DZF-domain-containing protein ILF2 (C and D), STRBP (E and F), and ILF3 (G and H). Colored dots indicate sites that are significantly changed (p < 0.05, Fisher’s exact tests). The number of sites with significantly increased (top left) or significantly decreased (bottom right) editing levels are indicated on each graph.
(I and J) Scatterplots comparing RNA editing levels assayed by RNA-seq in HEK293T cells (I) and HEK293T cells stably overexpressing ADAR2 (J). Plot compares editing levels in cells overexpressing GFP with editing levels in cells overexpressing ILF3. Colored dots indicate sites that are significantly changed (p < 0.05, Fisher’s exact tests). The number of sites with significantly increased (top left) or significantly decreased (bottom right) editing levels is indicated on each graph. Bar graphs to the right of each scatterplot depict overall editing levels (percentage of edited reads at all sites combined) for GFP overexpression (gray) and ILF3 overexpression (red); error bars represent mean ± SEM.
One possible explanation for the effect of DZF-domain-containing proteins on RNA editing could be transcriptional or translational regulation of ADAR mRNA or protein levels. To test this hypothesis, we analyzed the mRNA and protein levels of ADAR1 and ADAR2 in ILF2-, ILF3-, and STRBP-overexpressing cells compared with GFP-overexpressing cells in HEK293T and HEK293T-ADAR2-OE cells. We found that ADAR1 mRNA and protein levels were largely unchanged (Figures S5A and S5B). ADAR2 transcript levels were reduced, which may account for some of the editing effects in HEK293T-ADAR2-OE cells (Figures S5A and S5B); however, the fact that there was a reduction in editing in HEK293T cells, which largely lack ADAR2 expression, and that ILF2 overexpression reduced ADAR2 protein without strongly affecting editing, suggested that regulation of ADAR2 levels cannot be the sole mechanism that DZF-domain-containing proteins use to repress editing.
RNA Binding Activity of ILF3 Is Necessary for Its Regulation of RNA Editing
Because changes in ADAR levels were not sufficient to explain the differences in editing that we observed, we hypothesized that the global regulator ILF3 and ADAR proteins compete for the same transcripts. This hypothesis is supported by previous work showing that ILF3 has structurally similar dsRBDs to ADAR2 (Wolkowicz and Cook, 2012). This mechanism would be consistent with our previously observed RNA-dependent interaction between ILF3 and the ADARs. In addition, we and others have shown that ILF3 binds near editing sites in K562 cells (see Figure 2B) (Quinones-Valdez et al., 2019). If ILF3 competes for RNA binding sites with ADAR proteins, then the ability of ILF3 to affect editing levels would be dependent on its ability to bind RNA. To test this hypothesis, we overexpressed a FLAG-tagged mutant of ILF3 that lacks its two dsRBDs (Δ402–572) in HEK293T and HEK293T-ADAR2-OE cells (Figures 5A, 5B, and S5A; Table S1). In both cases, ILF3-ΔdsRBD-OE did not induce a global reduction in editing (Figures 5C and S5B), suggesting that ILF3’s RNA binding ability is necessary for its regulation of editing levels. In addition, we performed a FLAG IP to pull down the mutant and wild-type version of ILF3, and found that only wild-type ILF3 interacts with ADAR1 and ADAR2 (Figure 5D). This result further supports the hypothesis that it is the ability of ILF3 to bind RNA and compete for substrates with ADARs that regulates editing levels.
Figure 5. ILF3 dsRNA-Binding Mutant Does Not Interact with ADAR or Affect Editing Levels.

(A) Schematic of ILF3 double-stranded RNA-binding domain (dsRBD mutant; dashed lines indicate the deleted region, which spans amino acids 402–572).
(B) Bar graphs depicting the FPKM of ILF3 in GFP and ILF3ΔdsRBD overexpression in HEK293T cells (left) and HEK293T cells stably overexpressing ADAR2 (right). Error bars represent standard deviation.
(C) Scatterplots comparing RNA editing levels assayed by mmPCR-seq in HEK293T cells (left) and HEK293T cells stably overexpressing ADAR2 (right). Plot compares editing levels in cells overexpressing GFP (negative control, x axis) with editing levels in cells overexpressing ILF3DdsRBD (y axis). Colored dots indicate sites that are significantly changed (p < 0.05, Fisher’s exact tests). Overexpression of the ILF3 dsRBD mutant does not affect editing levels.
(D) Western blots of FLAG immunoprecipitation of HEK293T cells overexpressing ADAR2 and either FLAG-GFP (negative control), FLAG-ILF3, or FLAG-ILF3ΔdsRBD. ILF3ΔdsRBD mutant does not interact with ADAR1 or ADAR2 but maintains its interaction with ILF2.
DISCUSSION
RNA editing is widely conserved and pervasive, leading to changes at the RNA level. It is catalyzed in mammals by two enzymatically active ADARs, ADAR1 and ADAR2. Expression levels of these ADAR enzymes do not correlate with the editing frequency of large classes of sites (Tan et al., 2017), which strongly suggests the presence of additional editing regulators. We performed a large-scale, unbiased assay to systematically identify editing regulators in humans by employing a biochemical-based screening approach, BioID. BioID labels proteins in proximity of a BirA*-tagged bait protein, thus allowing us to identify proteins that physically interact with ADARs transiently or stably. Because editing regulation is known to be cell type specific, we performed the BioID screen in two different cell types, HeLa and M17, using each ADAR as bait. This approach was highly successful in enriching for ADAR interactors, in that it identified most previously known ADAR binding partners and editing regulators. The small number of previously known ADAR interactors that were not found here probably interact with ADAR proteins in a cell-type-specific context that may not exist in our system. Although many proteins were found in multiple BioID conditions, supporting the reproducibility and robustness of this approach, we also uncovered numerous cell-type-specific and ADAR1- or ADAR2-specific interactors. Cell-type-specific hits may arise from differences in expression of those proteins between cell types; however, a similar explanation would not explain ADAR-specific hits. We cannot rule out that some of the proteins specific to each condition may be an artifact of the common variability seen in mass-spectrometry-based screens; however, the reproducibility of the data suggests strong biological signals in the dataset. This dataset is highly complementary to and greatly extends a recently published study of RNA editing regulators identified through analysis of the ENCODE RBP knockdown RNA-seq dataset (Quinones-Valdez et al., 2019). We have uncovered 269 proteins that interact with ADARs, many of which overlap with the recently identified RBPs that regulate editing, validating our approach. Our biochemical screen enabled us to identify additional regulators, many of which are potentially ADAR and cell type specific.
When we first set out to identify trans regulators of editing, we were investigating two major potential mechanisms that could account for the observed tissue-specific differences in editing. Trans regulators could act directly on ADAR proteins to modify their activity at all sites equally but be differentially expressed in different tissues. Alternatively, trans regulators could affect a subset of sites by only interacting with or regulating ADAR proteins at those sites. We used publicly available RNA-seq and eCLIP-seq data from the ENCODE project to determine that we had uncovered both global and site-specific RNA editing regulators. Specifically, we found that the majority of our hits profiled by the ENCODE project showed binding at or near editing sites, and knocking down those proteins resulted in changes in the editing levels specifically at the sites they bound. This finding suggests that many of the editing sites regulated in trans are controlled by proteins interacting with ADAR proteins at editing sites. In some cases, the primary function may not be to regu late editing, but they nevertheless alter ADAR binding and editing. For example, BioID recovered many of the proteins found in paraspeckles, a compartment ADAR1 had previously been found to be associated with (Anantharaman et al., 2016), highlighting the power of BioID to identify nearly all proteins found in a complex. We also found proteins that are ADAR interactors, but not regulators of editing. These proteins may help ADAR proteins perform their other known functions in the cell, such as microRNA (miRNA) regulation (Ota et al., 2013), or as yet unknown editing-independent functions of ADARs. They may also regulate the translation of ADARs, similar to PTBP1, which can activate the translation of ADAR-p110 through an internal ribosome entry site (IRES)-like element (Yang et al., 2015).
The most intriguing finding of the BioID screens was the identification of all four DZF-domain-containing proteins among the strongest hits. This finding suggests the importance of this class of proteins as ADAR interactors. These proteins largely interact with ADARs in an RNA-dependent fashion. ILF3 and STRBP appear to compete with ADAR to bind and edit dsRNAs because overexpression of these proteins led to decreased editing overall. In particular, ILF3 inhibited editing at a large number of sites, suggesting that it is a strong global suppressor of editing. This finding is consistent with a recent report that knockdown of ILF3 increases editing at specific sites in K562 cells (Quinones-Valdez et al., 2019). Because ILF3 and ADAR2 have structurally similar dsRBDs and are able to compete for substrates in a biochemical assay (Wolkowicz and Cook, 2012), we tested whether this mechanism held in cells. We overexpressed a mutant version of ILF3 that lacks both dsRNA binding domains and found that the mutant did not interact with either ADAR and did not suppress editing. Because we found that a number of RBPs bound RNA near the editing sites that they regulated, we further hypothesize that competing with ADAR for RNA binding is a prominent regulatory mechanism of RBPs on editing levels.
It will be interesting to more thoroughly explore the role of all DZF-domain-containing proteins, in interacting with ADARs and regulating editing. In concurrent work (Sapiro et al., 2020), we show that the fly homolog of ZFR, Zinc-finger protein at 72D (Zn72D), regulates over half of editing events in the fly brain, and that knockdown of ZFR leads to a decrease in a large number of editing events in mouse primary neurons. Zn72D also interacts with Drosophila ADAR (dADAR) in an RNA-dependent manner, suggesting a similar mechanism to ILF3 regulation of ADARs that we detail here, but ZFR appears to be a positive regulator of editing, in contrast with ILF3. ZFR regulates editing of primarily ADAR2 editing sites in mouse primary neurons, suggesting that ZFR may be a particularly important regulator of ADAR2 editing in the brain (Sapiro et al., 2020). Future work may explore whether STRBP has a similarly strong tissue-specific effect on editing, because it is highly expressed in the brain and testes. Together, our work suggests that DZF-domain-containing proteins as a class are critical for proper RNA editing, and future work is needed to further explore the mechanistic details and cell-type specificity of this role, including the potential role of the actual DZF domain in supporting a protein interaction with ADAR.
The BioID experiments uncovered a large number of novel ADAR interactors and putative RNA editing regulators. These hits can be further characterized for their roles in both RNA editing and/or non-canonical roles for ADAR in the cell. Such knowledge may enable the manipulation of editing levels at specific sites without the manipulation of ADAR proteins themselves, which may have therapeutic benefit for cancer, autoimmune diseases, neurological diseases, or other diseases in which ADARs play a role.
STAR★METHODS
RESOURCE AVAILABILITY
Lead Contact
Further information and requests for resources and reagents should be directed to and will be fulfilled by the Lead Contact, Jin Billy Li (jin.billy.li@stanford.edu).
Materials Availability
All unique/stable reagents generated in this study are available from the lead contact with a completed Materials Transfer Agreement.
Data and Code Availability
The high-throughput sequencing data utilized in this work, including the RNA-seq and mmPCR-seq libraries, have been deposited in the Gene Expression Omnibus (GEO) database, accession number GEO: GSE130771. R and python scripts used for data analysis are available upon request.
EXPERIMENTAL MODEL AND SUBJECT DETAILS
Cell Culture, Transfections and Viral Transductions
HeLa S3 and HEK293T cells were cultured in DMEM supplemented with 10% FBS and Pen/Strep. M17 cells were cultured in F12 media supplemented with 10% FBS and Penn/Strep. Lentivirus was generated using standard methods: briefly, HEK293T cells were transfected with 3rd generation packaging constructs and target plasmid for 8 hours, then media was changed and viral supernatant was collected at 24 and 48 hours later and filtered at 0.45 μM. Cells were transduced with 1X viral supernatants supplemented with 5 μg/mL polybrene. Media was changed 12–24 hours later and selection began with the appropriate antibiotics between days 3–7.
METHOD DETAILS
Recombinant DNA Cloning Strategy
BirA* constructs (BirA*-ADAR1, BirA*-ADAR2, BirA*-GFP) were created by subcloning the cDNA for each gene into the pCDH backbone containing a 3XFLAG tag, a nuclear localization sequence and the BirA* cDNA sequence upstream of the target gene, resulting in 3xFLAG-NLS-BirA*-ADAR1, 3xFLAG-NLS-BirA*-ADAR2, and 3xFLAG-NLS-BirA*-GFP constructs and, when translated, fusion proteins. These constructs were used to generate lentivirus, as described above.
FLAG-tagged constructs for ADARs (ADAR1 and ADAR2) and DZF-domain-containing proteins (ILF2, ILF3, STRBP, ZFR) were generated by subcloning the cDNA for each gene into the pCDH backbone containing an upstream (N-terminal) 3xFLAG. These constructs were used to generate lentivirus, as described above.
A non-tagged version of ADAR2 (for Figure 3) was generated by subcloning the ADAR2 cDNA into the pCDH backbone.
All transient transfection constructs were generated by subcloning the cDNA of interest into pCDNA 3.1–3xFLAG (GFP, ADAR1, ADAR2, ILF2, ILF3, STRBP). All transient transfections were performed with Lipofectamine 2000 according to manufacturer’s protocol.
ILF3 ΔdsRBD was generated by synthesizing an ILF3 cDNA lacking the nucleotides coding for amino acids 402–572 (inclusive) and subcloning it into pCDNA 3.1–3xFLAG and pCDH.
FLAG immunofluorescence
Cells were grown on chamber slides (Fisher, 12-565-7), fixed with 10% Formalin and permeabilized with 0.1% Triton X-100 in PBS. Slides were then incubated with primary antibody (rabbit anti-FLAG, Sigma F7425 at 1:1000) in 1% BSA (Jackson Immunoresearch, 001-000-161) for 1 hr at room temperature. Slides were washed 3x with PBS and incubated with secondary Alexa Fluor-conjugated antibodies (Jackson Immunoresearch, 625 ng/ml) in 1% BSA for 45 min at room temp. Slides were again washed 3x with PBS and mounted in ProLong Gold with DAPI (Thermo Fisher P36931).
BioID Experimental Procedure
Each of the three BirA constructs (ADAR1, ADAR2, and GFP) were stably expressed in HeLa and M17 cells via lentiviral transduction. Ten 150mm plates of confluent cells expressing each construct were grown overnight in media with a final concentration of 50 μM D-Biotin (Life Technologies, B-20656).
Nuclear Lysate Preparation
Cells were harvested, pelleted and washed once with 1 × PBS. A 10X pellet volume of ice-cold cytoplasmic extraction buffer (10 mM HEPES pH 7.5, 10 mM KCL, 1.5 mM MgCl2, 0.34 M Sucrose, 10% glycerol) with 1 mM DTT and protease inhibitors (cOmplete, Mini, EDTA-free Protease Inhibitor Cocktail Tablets, # 4693159001) was added and the pellet was gently resuspended. Cells were incubated on ice for 15 min. Triton X-100 was added to a final concentration of 0.1% and cells were vortexed for 10 s then incubated on ice for 5 min. Cells were spun down at 1300xg for 5 min at 4°C, and washed once with cytoplasmic extraction buffer, spun down again and the supernatant was discarded. The nuclei were lysed with 7X the volume of the original pellet with high salt NP-40 lysis buffer (25 mM HEPES pH 7.5, 420 mM NaCl, 1.5 mM MgCl2, 10% glycerol, 0.5% NP-40) and incubated on ice for 20 min with occasional vortexing. Lysate was then spun at > 20,000xg for 15 min at 4°C. Protein concentration was then measured by BCA (Pierce, 23227).
Preclear Lysate
1 mL of Agarose Control Resin (Pierce, 26150) slurry was added per sample to a 10 mL centrifuge column (Pierce, 89898), placed inside a 50 mL conical tube and spun at 1000xg for 1 min to remove storage buffer. The resin was washed once with 4X resin bed volume of high salt NP-40 lysis buffer, and spun at 1000xg for 1 min. Nuclear lysate was added to the washed resin and incubated at 4°C for > 2hrs, with rotation. The resin was placed in a new 50 mL conical, and spun at 1000xg for 1 min to collect the precleared lysate. Protein concentration was measured by BCA (Pierce, 23227).
Bind Biotinylated targets to Streptavidin beads
20 μL of High Capacity Streptavidin Agarose (Pierce, 20359) per 1 mg of lysate was added to a 10 mL centrifuge column placed inside a 50 mL conical tube. 6 volumes of high salt NP-40 lysis buffer was added to column and allowed to drain by gravity flow. Nuclear lysate was added to washed resin and incubated at 4°C overnight, with rotation.
Washing and Eluting
Eluate was collected by gravity flow and retained as the depleted fraction. The resin was then stringently washed twice with 10X volumes of the resin bed volume of high salt NP-40 lysis buffer with 0.3% SDS and then twice with high salt NP-40 lysis buffer with 1.0% SDS. The washed resin was resuspended in 900 μL of elution buffer (1XPBS, 5% SDS, 10 mM D-Biotin (Life technologies, B-20656), transferred to an eppendorf tube and boiled for 15 min. The resin was then placed in a 2 mL centrifuge column (Pierce, 89896) placed inside a 15 mL conical tube and spun at 1000xg for 1 min to collect the eluate. MeOH/Chloroform precipitation was used to concentrate the eluate. In brief, to 150 μL of eluate, 600 μL of methanol was added followed by 150 μL of chloroform and vortexed. 450 μL of ultrapure water was added and vortexed then centrifuged at 14,000 xg for 5 min. Upper aqueous phase was removed and 450 μL of methanol, 1 uL GlycoBlue was added and vortexed. The protein was pelleted by centrifuging at 14,000xg for 5 min and then methanol removed completely. Pellets were resuspended in 25 μL of 1x SDS-PAGE sample buffer then boiled at 95C for 5 min.
BioID Mass Spectrometry and Analysis
Reagents and Chemicals
Deionized water was used for all preparations. Buffer A consists of 5% acetonitrile 0.1% formic acid, buffer B consists of 80% acetonitrile 0.1% formic acid, and buffer C consists of 500 mM ammonium acetate 0.1% formic acid and 5% acetonitrile.
Sample Preparation
Proteins were precipitated in 23% TCA (Sigma-Aldrich, St. Louis, MO, Product number T-0699) at 4°C overnight. After 30 min centrifugation at 18000xg, protein pellets were washed 2 times with 500 μL ice-cold acetone. Air-dried pellets were dissolved in 8 M urea/ 100 mM Tris pH 8.5. Proteins were reduced with 5 mM Tris(2-carboxyethyl)phosphine hydrochloride (Sigma-Aldrich, St. Louis, MO, product C4706) and alkylated with 55 mM iodoacetamide (Sigma-Aldrich, St. Louis, MO, product I11490). Proteins were digested for 18 hr at 37°C in 2 M urea 100 mM Tris pH 8.5, 1 mM CaCl2 with 2 μg trypsin (Promega, Madison, WI, product V5111). Digest was stopped with formic acid, 5% final concentration. Debris was removed by centrifugation, 30 min 18000xg.
MudPIT Microcolumn
A MudPIT microcolumn(4) was prepared by first creating a Kasil frit at one end of an undeactivated 250 μm ID/360 mm OD capillary (Agilent Technologies, Inc., Santa Clara, CA). The Kasil frit was prepared by briefly dipping a 20 – 30 cm capillary in well-mixed 300 μL Kasil 1624 (PQ Corporation, Malvern, PA) and 100 μL formamide, curing at 100°C for 4 hr, and cutting the frit to ~2 mm in length. Strong cation exchange particles (SCX Luna, 5 μm dia., 125Å pores, Phenomenex, Torrance, CA) was packed in-house from particle slurries in methanol 2.5 cm. An additional 2.5 cm reversed phase particles (C18 Aqua, 3 μm dia., 125Å pores, Phenomenex) were then similarly packed into the capillary using the same method as SCX loading, to create a biphasic column. An analytical RPLC column was generated by pulling a 100 μm ID/360 mm OD capillary (Polymicro Technologies, Inc, Phoenix, AZ) to 5 μm ID tip. Reversed phase particles (Aqua C18, 3 μm dia., 125Å pores, Phenomenex, Torrance, CA) were packed directly into the pulled column at 800 psi until 12 cm long. The MudPIT microcolumn was connected to an analytical column using a zero-dead volume union (Upchurch Scientific (IDEX Health & Science), P-720–01, Oak Harbor, WA).
LC-MS/MS analysis was performed using an Eksigent nano lc pump and a Thermo LTQ-Orbitrap using an in-house built electro-spray stage. MudPIT experiments were performed where each step corresponds to 0, 20, 50 and 100% buffer C being run for 3 min at the beginning of each gradient of buffer B. Electrospray was performed directly from the analytical column by applying the ESI voltage at a tee (150 μm ID, Upchurch Scientific). Electrospray directly from the LC column was done at 2.5 kV with an inlet capillary temperature of 275°C. Data-dependent acquisition of MS/MS spectra with the LTQ-Orbitrap were performed with the following settings: MS/MS on the 10 most intense ions per precursor scan, 1 microscan, reject charge unassigned charge state; dynamic exclusion repeat count, 1, repeat duration, 30 s; exclusion list size 200; and exclusion duration, 15 s.
Data Analysis
Protein and peptide identification and protein quantitation were done with Integrated Proteomics Pipeline - IP2 (Integrated Proteomics Applications, Inc., San Diego, CA. http://www.integratedproteomics.com/). Tandem mass spectra were extracted from raw files using RawExtract 1.9.9(1) and were searched against Uniprot human database with reversed sequences using ProLuCID(2, 5). The search space included half- and fully-tryptic peptide candidates. Carbamidomethylation (+57.02146) of cysteine was considered as a static modification. Biotinylation of lysine (226.077598) was considered as a variable modification, Peptide candidates were filtered using DTASelect, with these parameters -p 2 -y 2–trypstat–pfp 0.01–extra–pI -DM 10–DB–dm -in -m 1 -t 1–brief–quiet.
Analysis of BioID hits
BirA*-ADAR1 and BirA*-ADAR2 experiments were analyzed separately. In both cases, peptide counts were summed to generate protein-level counts. For each biological replicate, the fold change of the ADAR condition versus the no-BirA* and GFP conditions were separately calculated (1 was added to all counts in order to avoid infinite fold changes). Proteins were then filtered according to the following criteria: for each replicate, in order to be retained, a protein was required to have a fold change > 2 versus both the no-BirA* and GFP conditions. A second level of filtering then required each protein to be retained in at least 2 out of the 3 biological replicates. These retained proteins were considered hits for that condition. For heatmaps, log2 fold change for the ADAR condition was calculated by determining the median log2 fold change versus the GFP condition across all three replicates.
Immunoprecipitation
FLAG-tagged proteins were immunoprecipitated from 2 mg of HEK293T or M17 cells using anti-FLAG M2 affinity gel (Sigma A2220). Lysates were prepared in NP40 buffer (see western blotting). 40 μL of the anti-FLAG M2 affinity resin was washed three times with 1 mL of lysis buffer then added to the 2 mg of protein extract diluted to 500 ul in NP-40 lysis buffer and incubated for 2 hours at 4°C with rotation. The resin was then washed 4 times for 5 minutes each with 1 mL NP-40 lysis buffer at 4°C with rotation. For further analysis the resin was resuspended with 30 μL 2x SDS-PAGE sample buffer, then incubated at 95°C for 5 min to elute bound proteins.
Western Blotting
Cells were lysed in NP-40 buffer (25 mM HEPES-KOH, 150 mM KCl, 1.5 mM MgCl2, 0.5% NP40, 10% Glycerol [pH 7.5]) supplemented with protease inhibitors (cOmplete, Mini, EDTA-free Protease Inhibitor Cocktail Tablets, # 4693159001) Lysates were clarified by spinning for 10 min at 13,000 rpm at 4°C, and the protein content was measured by BCA (Pierce, 23225). 10 μg of protein was separated by SDS-PAGE, transferred onto nitrocellulose membrane, and blotted according to standard protocols. Chemiluminescence was imaged using a BioRad ChemiDoc imaging system.
Antibodies
ILF2: Bethyl laboratories NF45 Antibody, cat: A303–147A (1:1000)
ILF3: Bethyl laboratories NF90 Antibody, cat: A303–651A (1:1000)
ZFR: Abcam Anti-ZFR antibody ab90865 (1:500)
STRBP: Abcam Anti-STRBP antibody cat: ab111567 (1:500)
ADAR1: Santa Cruz ADAR1 Antibody (15.8.6) cat: sc-73408 (1:500)
ADAR2: Genetex ADAR2 antibody cat: GTX114237(1:500)
FLAG: Sigma Monoclonal ANTI-FLAG® M2-Peroxidase (HRP) (1:5000)
mmPCR-seq of samples
The mmPCR–seq was performed as described in Zhang et al. (2014). Briefly, total RNA is extracted from cells using a QIAGEN Micro or Mini RNeasy kit (QIAGEN cat:74004 or 74104) and reverse transcribed using iScript Advanced reverse transcriptase (Bio-Rad). The cDNAs were purified using Ampure XP Beads (Beckman Coulter), with an elution volume of 10 μL. 250 ng of cDNA was used in a preamplification reaction and amplified cDNA was purified using Ampure XP beads and eluted in 10 μL. 50 ng of pre-amplified cDNA was loaded into each well of an Access Array microfluidic chip (Fluidigm). The PCR reactions were performed on the Access Array System (Fluidigm) using KAPA2G 5X Fast Multiplex PCR Mix (Kapa Biosystems). Barcodes were added in a second round of PCR using Phusion DNA polymerase (NEB cat: M0531S). Samples were sequenced with 76 base-pair paired-end reads using an Illumina NextSeq (Illumina, San Diego, CA).
RNA-seq library preparation
Total RNA was extracted from cells using QIAGEN Micro or Mini RNeasy kit (QIAGEN cat:74004 or 74104). rRNA was depleted from total RNA following RNase H-based protocols adopted from Adiconis et al. (2013) and Morlan et al. (2012). We mixed approximately 250 ng of RNA with 61.54 pmoles of pooled DNA oligos designed antisense to rRNA (gift from J. Salzman lab at Stanford) in a 5 μL reaction with 1 μL of 5X RNase H(−)Mg buffer (500 mM Tris-HCl pH 7.4, 1 M NaCl) and 0.25 mL 1mM EDTA. We annealed rRNA antisense oligos to total RNA samples for 2 minutes at 95°C, slowly reduced the temperature to 45°C and then added 5 μL of RNase H mix (1.7 μL water, 1 ul 5X RNase H(−)Mg buffer, 0.2 ul 1 M MgCl2, 0.1ul RiboLock RNase Inhibitor (40 U/μL) (ThermoFisher EO038), 2 μL of Hybridase Thermostable RNase H (Epicenter, Madison, WI: Lucigen H39500) to make 10 μL total and incubated for 30 minutes at 45°C. rRNA-depleted RNA was then purified using 2.2X reaction volume of Agencourt RNAClean XP beads (Beckman Coulter: A63987), treated with TURBO DNase (Invitrogen: AM1907), and then purified with RNAClean XP beads again. rRNA-depleted RNA was used as input to the KAPA HyperPrep RNA-seq Kit (Kapa Biosystems: KK8540). All libraries were sequenced with 76 base-pair paired-end reads using an Illumina NextSeq (Illumina, San Diego, CA).
Sanger Sequencing of RNA levels
To determine editing levels at PAICS and GRIA2 editing sites, RNA was extracted from M17 cells expressing BirA*-GFP, BirA*-ADAR1, and BirA*-ADAR2 using the Zymo Quick RNA kit. RNA was treated with TURBO DNase and then cDNA was synthesized using Bio-Rad iScript Advanced cDNA synthesis kit. PCR was performed using the following to amplify around the editing site in each gene, PAICS FWD: 5-TCAATCCACCCTTTTCCAAG, REV: 5-TGATAAAAACGTGGGCCTTC and GRIA2 FWD: 5-CAGCAGATTTAGCCCCTACG REV: 5-AGATGAGATGTGTGCCAACG) with NEB Phusion for 40 cycles, and amplicons were gel purified with QIAGEN QIAquick Gel Extraction kit (Cat 28115) and sent for Sanger sequencing. Two replicates were performed for each group of cells.
QUANTIFICATION AND STATISTICAL ANALYSIS
Analysis of mmPCR-seq and RNA-seq
mmPCR-seq and RNA-seq reads were mapped to the human genome (hg19) using STAR (Dobin et al., 2013) version 2.4.2a using the parameters (–outFilterMultimapNmax 20–outFilterMismatchNmax 999–outFilterMismatchNoverReadLmax 0.1–alignIntronMin 20–alignIntronMax 1000000–alignMatesGapMax 1000000–alignSJoverhangMin 8–alignSJDBoverhangMin 1–sjdbScore 1–twopassMode Basic). For editing analysis we used the Samtools (version 0.1.16) (Li et al., 2009) mpileup command to count A and G counts at known editing sites (Tan et al., 2017), RADAR version 2 (Ramaswami and Li, 2014). For RNA-seq, only bases with quality scores > 20 were used. For both RNA-seq and mmPCR-seq, combined A and G counts from two replicates of each condition were compared to GFP overexpression reads using Fisher’s exact test with a Benjimini-Hochberg multiple hypothesis testing correction in R (Benjamini and Hochberg, 1995).
For both RNA-seq and mmPCR-seq analysis, any variability between replicates could arise for a number of reasons, e.g., low expression or inefficient primer-based amplification, so for all subsequent analyses we only assessed sites with high coverage (50X in mmPCR-seq and 20X in RNA-seq) that were < 20% different between replicates (Figures S4A and S4B).
For gene expression analysis, FPKMs were calculated using RSEM 1.2.21 (Li and Dewey, 2011). To compare global expression differences of cell-type-specific BioID hits in M17 and HeLa cells, we used Wilcoxon matched-pairs signed ranked test performed by Graphpad PRISM 7.
ENCODE data analysis
We downloaded the mapped BAM files (HG38 version) of RNA-seq data generated following RBP knockdown or control shRNA transfection from the ENCODE data portal (encodeproject.org). For the RNA-seq data, we used the same pipeline as described in the Analysis of mmPCR-seq and RNA-seq section to quantify editing levels. As reported (Quinones-Valdez et al., 2019), we also found batch effects in the editing level measurements from the RNA-seq data. However, in this paper we only performed editing level comparisons between RBP knockdown and the matched control shRNA transfection within the same batch, so it was not necessary to remove the batch effects that only affected editing level measurements of samples from different batches. To compare the collective effects of RBP KD on editing levels for sites bound and unbound by the RBP (determined by the corresponding eCLIP data), we quantified the editing level deviation (average KD editing level - average control editing level) for each site and calculated the cumulative distribution for all sites tested in each condition ranking from the lowest to the highest. Then each distribution was scaled to [0,1] so that it was comparable between different editing site groups, which we called CDED: cumulative distribution of editing level deviation. Finally, we applied Mann-Whitney U test to the CDED of bound and unbound sites of each RBP to obtain statistical difference.
To determine where the RBPs bind on the RNA, we analyzed the eCLIP-seq data from ENCODE. We downloaded the BED files (HG38 version) of the called CLIP peaks for each eCLIP-seq data and used shifted z-score method to test how the strength of association between the RBP binding and the editing sites would change if the peak was shifted from its original position (Gel et al., 2016). The z-scores were calculated as the distance between the expected binding value and the observed one, measured in standard deviations. We shifted the peaks 50bp stepwise within the 1.2kb up- and down-stream windows of the editing site to obtain the corresponding z-score values.
Supplementary Material
KEY RESOURCES TABLE
| REAGENT or RESOURCE | SOURCE | IDENTIFIER |
|---|---|---|
| Antibodies | ||
| Rabbit anti-ILF2 | Bethyl laboratories NF45 | Cat#A303–147A; RRID:AB_10895652 |
| Rabbit anti-ILF3 | Bethyl laboratories NF90 | Cat#A303–651A; RRID:AB_11204576 |
| Rabbit anti-ZFR | Abcam Anti-ZFR | Cat#ab90865; RRID:AB_2218986 |
| Rabbit anti-STRBP | Abcam Anti-STRBP | Cat#ab111567; RRID:AB_10862729 |
| Mouse anti-ADAR1 | Santa Cruz ADAR1 | Cat#sc-73408; RRID:AB_2222767 |
| Rabbit anti-ADAR2 | Genetex ADAR2 | Cat#GTX114237; RRID:AB_2616090 |
| Monoclonal ANTI-FLAG® M2-Peroxidase (HRP) | Sigma | Cat#A8592; RRID:AB_439702 |
| Rabbit anti-FLAG | Sigma | Cat#F7425; RRID:AB_439867 |
| Bacterial and Virus Strains | ||
| One Shot Stbl3 Cells | Thermo Fisher | Cat#C737303 |
| Critical Commercial Assays | ||
| KAPA HyperPrep RNA-seq Kit | Kapa Biosystems | KK8540 |
| iScript Advanced reverse transcriptase | Bio-Rad | 1708840 |
| KAPA Stranded RNA-seq Kit | KAPA Biosystems | Cat#KK8400 |
| Hybridase Thermostable RNase H | Lucigen (Epicenter) | Cat#H39500 |
| KAPA SYBR Fast | KAPA Biosystems | Cat#KK4601 |
| Deposited Data | ||
| RNaseq and mmPCRseq Data | This Paper | GEO: GSE130771 |
| Experimental Models: Cell Lines | ||
| Human: HeLA S3 | ATCC | CCL-2.2 |
| Human: 293T | This Paper | N/A |
| Human: BE(2)-M17 | ATCC | CRL-2267 |
| Oligonucleotides | ||
| Primers for PAICS see STAR Methods | This paper | N/A |
| Primers for GRIA2 see STAR Methods | This paper | N/A |
| rRNA DNA oligos | This paper | Gift from J. Salzman Lab |
| Recombinant DNA | ||
| pCDH-BirA*−3XFLAG | This paper | Roux et. al., 2012 |
| pCDH-ADAR2 | Transomic Technologies | N/A |
| pCDH-BirA*-ADAR1–3XFLAG | This paper | N/A |
| pCDH-BirA*-ADAR2–3XFLAG | This paper | |
| pCDH-BirA*-GFP-3XFLAG | This paper | N/A |
| pCDH/pCDNA3.1-GFP-3XFLAG | This paper | N/A |
| pCDH/pCDNA3.1-ADAR1–3XFLAG | Transomic Technologies | Cat#BC038227 |
| pCDH/pCDNA3.1-ADAR2–3XFLAG | Transomic Technologies | Cat#BC065545 |
| pCDH/pCDNA3.1-ILF2–3XFLAG | Transomic Technologies | Cat#BC000382 |
| pCDH/pCDNA3.1-ILF3–3XFLAG | GE Healthcare Dharmacom | CloneId:6503234 |
| pCDH/pCDNA3.1-STRBP-3XFLAG | GE Healthcare Dharmacom | CloneId:3914088 |
| pCDH/pCDNA3.1-ZFR-3XFLAG | Trasomic | Cat#BC137084 |
| pCDNA3.1-ILF3ΔdsRBD –3XFLAG | This paper | N/A |
| Software and Algorithms | ||
| Integrated Proteomics Pipeline – IP2 | Integrated Proteomics Applications | http://www.integratedproteomics.com/ |
| STAR v2.54b | Dobin et al., 2013 | RRID:SCR_015899; |
| Samtools v1.9 | Li et al., 2009 | RRID:SCR_002105;http://samtools.sourceforge.net/ |
| RSEM V1.2.30 | Li and Dewey, 2011 | RRID:SCR_013027;http://deweylab.github.io/RSEM/ |
| Other | ||
| Agarose Control Resin | Pierce | Cat#26150 |
| High Capacity Streptavidin Agarose | Pierce | Cat#20359 |
| 10 mM D-Biotin | Life technologies | Cat#B-20656 |
| 10 mL centrifuge column | Pierce | Cat#89898 |
| 2 mL centrifuge column | Pierce | Cat#89896 |
| anti-FLAG M2 affinity gel | Sigma | Cat#A2220 |
Highlights.
BioID identifies novel ADAR interactors, including regulators of A-to-I RNA editing
Interactors include all DZF-domain-containing proteins: ILF2, ILF3, STRBP, and ZFR
DZF-domain-containing proteins bind ADAR in an RNA-dependent manner
ILF3 is a broadly influential negative regulator of editing
ACKNOWLEDGMENTS
We thank Adam Freund and all members of the Li Lab, especially Tao Sun, for useful discussions and comments on this paper. We would also like to thank Julia Salzman for her generous donation of the oligos used for rRNA depletion in the RNA-seq library preparation. This work was supported by American Heart Association Postdoctoral grant 16POST27700036 (to E.C.F.); National Center for Research Resources grant 5P41RR011823 (to J.J.M. and J.R.Y.); National Science Foundation Graduate Research Fellowship DGE-114747 (to A.L.S.); NIH Training Grant NIH-NIGMS T32 GM007790 (to A.L.S.); NIH grants R01-GM102484 (to J.B.L.), R01-GM124215 (to J.B.L.), and R01-MH115080 (to J.B.L.); and American Heart Association Postdoctoral grant 17IFUNP33820059 (to Q.L.)
Footnotes
DECLARATION OF INTERESTS
The authors declare no competing interests.
SUPPLEMENTAL INFORMATION
Supplemental Information can be found online at https://doi.org/10.1016/j.celrep.2020.107656
REFERENCES
- Adiconis X, Borges-Rivera D, Satija R, DeLuca DS, Busby MA, Berlin AM, Sivachenko A, Thompson DA, Wysoker A, Fennell T, et al. (2013). Comparative analysis of RNA sequencing methods for degraded or low-input samples. Nat. Methods 10, 623–629. [DOI] [PMC free article] [PubMed] [Google Scholar]
- Aktaş T, Avşar IIık İ, Maticzka D, Bhardwaj V, Pessoa Rodrigues C, Mittler G, Manke T, Backofen R, and Akhtar A (2017). DHX9 suppresses RNA processing defects originating from the Alu invasion of the human genome. Nature 544, 115–119. [DOI] [PubMed] [Google Scholar]
- Anantharaman A, Jadaliha M, Tripathi V, Nakagawa S, Hirose T, Jantsch MF, Prasanth SG, and Prasanth KV (2016). Paraspeckles modulate the intranuclear distribution of paraspeckle-associated Ctn RNA. Sci. Rep 6, 34043. [DOI] [PMC free article] [PubMed] [Google Scholar]
- Athanasiadis A, Rich A, and Maas S (2004). Widespread A-to-I RNA editing of Alu-containing mRNAs in the human transcriptome. PLoS Biol. 2, e391. [DOI] [PMC free article] [PubMed] [Google Scholar]
- Bazak L, Levanon EY, and Eisenberg E (2014). Genome-wide analysis of Alu editability. Nucleic Acids Res. 42, 6876–6884. [DOI] [PMC free article] [PubMed] [Google Scholar]
- Behm M, Wahlstedt H, Widmark A, Eriksson M, and Öhman M (2017). Accumulation of nuclear ADAR2 regulates adenosine-to-inosine RNA editing during neuronal development. J. Cell Sci 130, 745–753. [DOI] [PubMed] [Google Scholar]
- Benjamini Y, and Hochberg Y (1995). Controlling the False Discovery Rate: A Practical and Powerful Approach to Multiple Testing. J. R. Stat. Soc. B 57, 289–300. [Google Scholar]
- Bhate A, Sun T, and Li JB (2019). ADAR1: A New Target for Immunooncology Therapy. Mol. Cell 73, 866–868. [DOI] [PubMed] [Google Scholar]
- Binothman N, Hachim IY, Lebrun J-J, and Ali S (2017). CPSF6 is a Clinically Relevant Breast Cancer Vulnerability Target: Role of CPSF6 in Breast Cancer. EBioMedicine 21, 65–78. [DOI] [PMC free article] [PubMed] [Google Scholar]
- Blango MG, and Bass BL (2016). Identification of the long, edited dsRNAome of LPS-stimulated immune cells. Genome Res. 26, 852–862. [DOI] [PMC free article] [PubMed] [Google Scholar]
- Blow M, Futreal PA, Wooster R, and Stratton MR (2004). A survey of RNA editing in human brain. Genome Res. 14, 2379–2387. [DOI] [PMC free article] [PubMed] [Google Scholar]
- Burns CM, Chu H, Rueter SM, Hutchinson LK, Canton H, Sanders-Bush E, and Emeson RB (1997). Regulation of serotonin-2C receptor G-protein coupling by RNA editing. Nature 387, 303–308. [DOI] [PubMed] [Google Scholar]
- Castello A, Fischer B, Frese CK, Horos R, Alleaume A-M, Foehr S, Curk T, Krijgsveld J, and Hentze MW (2016). Comprehensive Identification of RNA-Binding Domains in Human Cells. Mol. Cell 63, 696–710. [DOI] [PMC free article] [PubMed] [Google Scholar]
- Chu L, Su MY, Maggi LB Jr., Lu L, Mullins C, Crosby S, Huang G, Chng WJ, Vij R, and Tomasson MH (2012). Multiple myeloma-associated chromosomal translocation activates orphan snoRNA ACA11 to suppress oxidative stress. J. Clin. Invest 122, 2793–2806. [DOI] [PMC free article] [PubMed] [Google Scholar]
- Dobin A, Davis CA, Schlesinger F, Drenkow J, Zaleski C, Jha S, Batut P, Chaisson M, and Gingeras TR (2013). STAR: ultrafast universal RNA-seq aligner. Bioinformatics 29, 15–21. [DOI] [PMC free article] [PubMed] [Google Scholar]
- Eisenberg E, and Levanon EY (2018). A-to-I RNA editing - immune protector and transcriptome diversifier. Nat. Rev. Genet 19, 473–490. [DOI] [PubMed] [Google Scholar]
- Gannon HS, Zou T, Kiessling MK, Gao GF, Cai D, Choi PS, Ivan AP, Buchumenski I, Berger AC, Goldstein JT, et al. (2018). Identification of ADAR1 adenosine deaminase dependency in a subset of cancer cells. Nat. Commun 9, 5450. [DOI] [PMC free article] [PubMed] [Google Scholar]
- Garncarz W, Tariq A, Handl C, Pusch O, and Jantsch MF (2013). A high-throughput screen to identify enhancers of ADAR-mediated RNA-editing. RNA Biol. 10, 192–204. [DOI] [PMC free article] [PubMed] [Google Scholar]
- Gel B, Díez-Villanueva A, Serra E, Buschbeck M, Peinado MA, and Malinverni R (2016). regioneR: an R/Bioconductor package for the association analysis of genomic regions based on permutation tests. Bioinformatics 32, 289–291. [DOI] [PMC free article] [PubMed] [Google Scholar]
- Guan D, Altan-Bonnet N, Parrott AM, Arrigo CJ, Li Q, Khaleduzzaman M, Li H, Lee C-G, Pe’ery T, and Mathews MB (2008). Nuclear factor 45 (NF45) is a regulatory subunit of complexes with NF90/110 involved in mitotic control. Mol. Cell. Biol 28, 4629–4641. [DOI] [PMC free article] [PubMed] [Google Scholar]
- Hirose T, Virnicchi G, Tanigawa A, Naganuma T, Li R, Kimura H, Yokoi T, Nakagawa S, Bénard M, Fox AH, and Pierron G (2014). NEAT1 long noncoding RNA regulates transcription via protein sequestration within subnu-clear bodies. Mol. Biol. Cell 25, 169–183. [DOI] [PMC free article] [PubMed] [Google Scholar]
- Huang H, Kapeli K, Jin W, Wong YP, Arumugam TV, Koh JH, Srimasorn S, Mallilankaraman K, Chua JJE, Yeo GW, and Soong TW (2018). Tissue-selective restriction of RNA editing of CaV1.3 by splicing factor SRSF9. Nucleic Acids Res. 46, 7323–7338. [DOI] [PMC free article] [PubMed] [Google Scholar]
- Ishizuka JJ, Manguso RT, Cheruiyot CK, Bi K, Panda A, Iracheta-Vellve A, Miller BC, Du PP, Yates KB, Dubrot J, et al. (2019). Loss of ADAR1 in tumours overcomes resistance to immune checkpoint blockade. Nature 565, 43–48. [DOI] [PMC free article] [PubMed] [Google Scholar]
- Kim DI, Birendra KC, Zhu W, Motamedchaboki K, Doye V, and Roux KJ (2014). Probing nuclear pore complex architecture with proximity-dependent biotinylation. Proc. Natl. Acad. Sci. USA 111, E2453–E2461. [DOI] [PMC free article] [PubMed] [Google Scholar]
- Kwon K, Streaker ED, Ruparelia S, and Beckett D (2000). Multiple disordered loops function in corepressor-induced dimerization of the biotin repressor. J. Mol. Biol 304, 821–833. [DOI] [PubMed] [Google Scholar]
- Levanon EY, Eisenberg E, Yelin R, Nemzer S, Hallegger M, Shemesh R, Fligelman ZY, Shoshan A, Pollock SR, Sztybel D, et al. (2004). Systematic identification of abundant A-to-I editing sites in the human transcriptome. Nat. Biotechnol 22, 1001–1005. [DOI] [PubMed] [Google Scholar]
- Li B, and Dewey CN (2011). RSEM: accurate transcript quantification from RNA-Seq data with or without a reference genome. BMC Bioinformatics 12, 323. [DOI] [PMC free article] [PubMed] [Google Scholar]
- Li H, Handsaker B, Wysoker A, Fennell T, Ruan J, Homer N, Marth G, Abecasis G, and Durbin R; 1000 Genome Project Data Processing Subgroup (2009). The Sequence Alignment/Map format and SAMtools. Bioinformatics 25, 2078–2079. [DOI] [PMC free article] [PubMed] [Google Scholar]
- Li X, Liu C-X, Xue W, Zhang Y, Jiang S, Yin Q-F, Wei J, Yao R-W, Yang L, and Chen L-L (2017). Coordinated circRNA Biogenesis and Function with NF90/NF110 in Viral Infection. Mol. Cell 67, 214–227.e7. [DOI] [PubMed] [Google Scholar]
- Liddicoat BJ, Piskol R, Chalk AM, Ramaswami G, Higuchi M, Hartner JC, Li JB, Seeburg PH, and Walkley CR (2015). RNA editing by ADAR1 prevents MDA5 sensing of endogenous dsRNA as nonself. Science 349, 1115–1120. [DOI] [PMC free article] [PubMed] [Google Scholar]
- Liu H, Golji J, Brodeur LK, Chung FS, Chen JT, deBeaumont RS, Bullock CP, Jones MD, Kerr G, Li L, et al. (2019). Tumor-derived IFN triggers chronic pathway agonism and sensitivity to ADAR loss. Nat. Med 25, 95–102. [DOI] [PubMed] [Google Scholar]
- Mannion NM, Greenwood SM, Young R, Cox S, Brindle J, Read D, Nellåker C, Vesely C, Ponting CP, McLaughlin PJ, et al. (2014). The RNA-editing enzyme ADAR1 controls innate immune responses to RNA. Cell Rep. 9, 1482–1494. [DOI] [PMC free article] [PubMed] [Google Scholar]
- Marcucci R, Brindle J, Paro S, Casadio A, Hempel S, Morrice N, Bisso A, Keegan LP, Del Sal G, and O’Connell MA (2011). Pin1 and WWP2 regulate GluR2 Q/R site RNA editing by ADAR2 with opposing effects. EMBO J. 30, 4211–4222. [DOI] [PMC free article] [PubMed] [Google Scholar]
- Meagher MJ, Schumacher JM, Lee K, Holdcraft RW, Edelhoff S, Disteche C, and Braun RE (1999). Identification of ZFR, an ancient and highly conserved murine chromosome-associated zinc finger protein. Gene 228, 197–211. [DOI] [PubMed] [Google Scholar]
- Morlan JD, Qu K, and Sinicropi DV (2012). Selective depletion of rRNA enables whole transcriptome profiling of archival fixed tissue. PLoS ONE 7, e42882. [DOI] [PMC free article] [PubMed] [Google Scholar]
- Nemlich Y, Baruch EN, Besser MJ, Shoshan E, Bar-Eli M, Anafi L, Barshack I, Schachter J, Ortenberg R, and Markel G (2018). ADAR1-mediated regulation of melanoma invasion. Nat. Commun 9, 2154. [DOI] [PMC free article] [PubMed] [Google Scholar]
- Nie Y, Ding L, Kao PN, Braun R, and Yang J-H (2005). ADAR1 interacts with NF90 through double-stranded RNA and regulates NF90-mediated gene expression independently of RNA editing. Mol. Cell. Biol 25, 6956–6963. [DOI] [PMC free article] [PubMed] [Google Scholar]
- Nishikura K (2010). Functions and regulation of RNA editing by ADAR deaminases. Annu. Rev. Biochem 79, 321–349. [DOI] [PMC free article] [PubMed] [Google Scholar]
- Nishikura K (2016). A-to-I editing of coding and non-coding RNAs by ADARs. Nat. Rev. Mol. Cell Biol 17, 83–96. [DOI] [PMC free article] [PubMed] [Google Scholar]
- Orecchini E, Frassinelli L, and Michienzi A (2017). Restricting retrotranspo-sons: ADAR1 is another guardian of the human genome. RNA Biol. 14, 1485–1491. [DOI] [PMC free article] [PubMed] [Google Scholar]
- Ota H, Sakurai M, Gupta R, Valente L, Wulff B-E, Ariyoshi K, Iizasa H, Davuluri R, and Nishikura K (2013). ADAR1 Forms a Complex with Dicer to Promote MicroRNA Processing and RNA-Induced Gene Silencing. Cell 153, 575–589. [DOI] [PMC free article] [PubMed] [Google Scholar]
- Pestal K, Funk CC, Snyder JM, Price ND, Treuting PM, and Stetson DB (2015). Isoforms of RNA-Editing Enzyme ADAR1 Independently Control Nucleic Acid Sensor MDA5-Driven Autoimmunity and Multi-organ Development. Immunity 43, 933–944. [DOI] [PMC free article] [PubMed] [Google Scholar]
- Quinones-Valdez G, Tran SS, Jun H-I, Bahn JH, Yang E-W, Zhan L, Brümmer A, Wei X, Van Nostrand EL, Pratt GA, et al. (2019). Regulation of RNA editing by RNA-binding proteins in human cells. Commun. Biol 2, 19. [DOI] [PMC free article] [PubMed] [Google Scholar]
- Ramaswami G, and Li JB (2014). RADAR: a rigorously annotated database of A-to-I RNA editing. Nucleic. Acids Res 42, D109–D113. [DOI] [PMC free article] [PubMed] [Google Scholar]
- Rice GI, Kasher PR, Forte GMA, Mannion NM, Greenwood SM, Szynkiewicz M, Dickerson JE, Bhaskar SS, Zampini M, Briggs TA, et al. (2012). Mutations in ADAR1 cause Aicardi-Goutières syndrome associated with a type I interferon signature. Nat. Genet 44, 1243–1248. [DOI] [PMC free article] [PubMed] [Google Scholar]
- Roux KJ, Kim DI, Raida M, and Burke B (2012). A promiscuous biotin ligase fusion protein identifies proximal and interacting proteins in mammalian cells. J. Cell Biol 196, 801–810. [DOI] [PMC free article] [PubMed] [Google Scholar]
- Rueter SM, Dawson TR, and Emeson RB (1999). Regulation of alternative splicing by RNA editing. Nature 399, 75–80. [DOI] [PubMed] [Google Scholar]
- Sapiro AL, Shmueli A, Henry GL, Li Q, Shalit T, Yaron O, Paas Y, Billy Li J, and Shohat-Ophir G (2019). Illuminating spatial A-to-I RNA editing signatures within the Drosophila brain. Proc. Natl. Acad. Sci. USA 116, 2318–2327. [DOI] [PMC free article] [PubMed] [Google Scholar]
- Sapiro AL, Freund EC, Restrepo L, Qiao H-H, Bhate A, Ni J-Q, Mosca TJ, and Li JB (2020). Zinc finger RNA binding protein Zn72D regulates ADAR-mediated RNA editing in neurons. Cell Rep. 31, Published online May 19, 2020. 10.1016/j.celrep.2020.107654. [DOI] [PMC free article] [PubMed] [Google Scholar]
- Shanmugam R, Zhang F, Srinivasan H, Charles Richard JL, Liu KI, Zhang X, Woo CWA, Chua ZHM, Buschdorf JP, Meaney MJ, and Tan MH (2018). SRSF9 selectively represses ADAR2-mediated editing of brain-specific sites in primates. Nucleic Acids Res. 46, 7379–7395. [DOI] [PMC free article] [PubMed] [Google Scholar]
- Slotkin W, and Nishikura K (2013). Adenosine-to-inosine RNA editing and human disease. Genome Med. 5, 105. [DOI] [PMC free article] [PubMed] [Google Scholar]
- Stellos K, Gatsiou A, Stamatelopoulos K, Perisic Matic L, John D, Lunella FF, Jaé N, Rossbach O, Amrhein C, Sigala F, et al. (2016). Aden-osine-to-inosine RNA editing controls cathepsin S expression in atherosclerosis by enabling HuR-mediated post-transcriptional regulation. Nat. Med 22, 1140–1150. [DOI] [PubMed] [Google Scholar]
- Sundararaman B, Zhan L, Blue SM, Stanton R, Elkins K, Olson S, Wei X, Van Nostrand EL, Pratt GA, Huelga SC, et al. (2016). Resources for the Comprehensive Discovery of Functional RNA Elements. Mol. Cell 61, 903–913. [DOI] [PMC free article] [PubMed] [Google Scholar]
- Tan MH, Li Q, Shanmugam R, Piskol R, Kohler J, Young AN, Liu KI, Zhang R, Ramaswami G, Ariyoshi K, et al. ; GTEx Consortium; Laboratory, Data Analysis &Coordinating Center (LDACC)—Analysis Working Group; Statistical Methods groups—Analysis Working Group; Enhancing GTEx (eGTEx) groups; NIH Common Fund; NIH/NCI; NIH/NHGRI; NIH/NIMH; NIH/NIDA; Biospecimen Collection Source Site—NDRI; Biospecimen Collection Source Site—RPCI; Biospecimen Core Resource—VARI; Brain Bank Repository— University of Miami Brain Endowment Bank; Leidos Biomedical—Project Management; ELSI Study; Genome Browser Data Integration &Visualization—EBI; Genome Browser Data Integration &Visualization—UCSC Genomics Institute, University of California Santa Cruz (2017). Dynamic landscape and regulation of RNA editing in mammals. Nature 550, 249–254. [DOI] [PMC free article] [PubMed] [Google Scholar]
- Tariq A, Garncarz W, Handl C, Balik A, Pusch O, and Jantsch MF (2013). RNA-interacting proteins act as site-specific repressors of ADAR2-mediated RNA editing and fluctuate upon neuronal stimulation. Nucleic Acids Res. 41, 2581–2593. [DOI] [PMC free article] [PubMed] [Google Scholar]
- Tran SS, Jun H-I, Bahn JH, Azghadi A, Ramaswami G, Van Nostrand EL, Nguyen TB, Hsiao YE, Lee C, Pratt GA, et al. (2019). Widespread RNA editing dysregulation in brains from autistic individuals. Nat. Neurosci 22, 25–36. [DOI] [PMC free article] [PubMed] [Google Scholar]
- Wahlstedt H, Daniel C, Ensterö M, and Ohman M (2009). Large-scale mRNA sequencing determines global regulation of RNA editing during brain development. Genome Res. 19, 978–986. [DOI] [PMC free article] [PubMed] [Google Scholar]
- Walkley CR, and Li JB (2017). Rewriting the transcriptome: adenosine-toinosine RNA editing by ADARs. Genome Biol. 18, 205. [DOI] [PMC free article] [PubMed] [Google Scholar]
- Wolkowicz UM, and Cook AG (2012). NF45 dimerizes with NF90, Zfr and SPNR via a conserved domain that has a nucleotidyltransferase fold. Nucleic Acids Res. 40, 9356–9368. [DOI] [PMC free article] [PubMed] [Google Scholar]
- Yang B, Hu P, Lin X, Han W, Zhu L, Tan X, Ye F, Wang G, Wu F, Yin B, et al. (2015). PTBP1 induces ADAR1 p110 isoform expression through IRES-like dependent translation control and influences cell proliferation in gliomas. Cell. Mol. Life Sci 72, 4383–4397. [DOI] [PMC free article] [PubMed] [Google Scholar]
- Zhang R, Li X, Ramaswami G, Smith KS, Turecki G, Montgomery SB, and Li JB (2014). Quantifying RNA allelic ratios by microfluidic multiplex PCR and sequencing. Nat. Methods 11, 51–54. [DOI] [PMC free article] [PubMed] [Google Scholar]
Associated Data
This section collects any data citations, data availability statements, or supplementary materials included in this article.
Supplementary Materials
Data Availability Statement
The high-throughput sequencing data utilized in this work, including the RNA-seq and mmPCR-seq libraries, have been deposited in the Gene Expression Omnibus (GEO) database, accession number GEO: GSE130771. R and python scripts used for data analysis are available upon request.