Supplemental Digital Content is available in the text.
Keywords: biomarkers, odds ratio, intracranial arteriosclerosis, magnetic resonance imaging, stroke
Background and Purpose:
Intracranial atherosclerosis is one of the main causes of stroke, and high-resolution magnetic resonance imaging provides useful imaging biomarkers related to the risk of ischemic events. This study aims to evaluate differences in histogram features between culprit and nonculprit intracranial atherosclerosis using high-resolution magnetic resonance imaging.
Methods:
Two hundred forty-seven patients with intracranial atherosclerosis who underwent high-resolution magnetic resonance imaging sequentially between January 2015 and December 2016 were recruited. Quantitative features, including stenosis, plaque burden, minimum luminal area, intraplaque hemorrhage, enhancement ratio, and dispersion of signal intensity (coefficient of variation), were analyzed based on T2-, T1-, and contrast-enhanced T1-weighted images. Step-wise regression analysis was used to identify key determinates differentiating culprit and nonculprit plaques and to calculate the odds ratios (ORs) with 95% CIs.
Results:
In total, 190 plaques were identified, of which 88 plaques (37 culprit and 51 nonculprit) were located in the middle cerebral artery and 102 (57 culprit and 45 nonculprit) in the basilar artery. Nearly 90% of culprit lesions had a degree of luminal stenosis of <70%. Multiple logistic regression analyses showed that intraplaque hemorrhage (OR, 16.294 [95% CI, 1.043–254.632]; P=0.047), minimum luminal area (OR, 1.468 [95% CI, 1.032–2.087]; P=0.033), and coefficient of variation (OR, 13.425 [95% CI, 3.987–45.204]; P<0.001) were 3 significant features in defining culprit plaques in middle cerebral artery. The enhancement ratio (OR, 9.476 [95% CI, 1.256–71.464]; P=0.029), intraplaque hemorrhage (OR, 2.847 [95% CI, 0.971–10.203]; P=0.046), and coefficient of variation (OR, 10.068 [95% CI, 2.820–21.343]; P<0.001) were significantly associated with plaque type in basilar artery. Coefficient of variation was a strong independent predictor in defining plaque type for both middle cerebral artery and basilar artery with sensitivity, specificity, and accuracy being 0.79, 0.80, and 0.80, respectively.
Conclusions:
Features characterized by high-resolution magnetic resonance imaging provided complementary values over luminal stenosis in defined lesion type for intracranial atherosclerosis; the dispersion of signal intensity in histogram analysis was a particularly effective predictive parameter.
Ischemic stroke is one of the leading killers and the first cause of disability in the world.1 Recently, intracranial atherosclerosis (ICAS) has been recognized as the most common cause of ischemic stroke worldwide, accounting for ≈9% to 33% of all ischemic strokes.2–4 The incidence rate in the Chinese population is particularly high, where ICAS accounts for 30% to 50% of ischemic strokes.5 It has been shown that culprit lesions usually have specific structural features, which cannot be captured by angiography methods such as magnetic resonance angiography or computed tomography angiography, such as a relatively large lipid-rich core with an inflamed thin fibrous cap.6,7 Therefore, visualization of lesion morphological and compositional features is essential for the risk assessment of ICAS.
High-resolution magnetic resonance imaging (hrMRI) is capable of identifying lesion morphology and different atherosclerotic components8 including vessel wall remodeling, intraplaque hemorrhage (IPH), and plaque enhancement if a contrast medium is provided.9 These detailed lesion characteristics predict future cerebrovascular events.10 hrMRI can provide a direct visualization of atherosclerosis not only in large arteries, for example, carotid artery, but also in small intracranial arteries, including middle cerebral artery (MCA) and basilar artery (BA).11–13 Both MCA and BA have been shown to contain a large proportion of ICAS plaques, for instance in a study by Qiao et al,13 in which 32.2% ICAS plaques were located in the MCA and 40% in the BA.
Previous studies have mostly focused on lesion morphological and compositional features. The distribution of signal intensity, which is defined as the number of pixels with signal intensity in a certain categorical range, might also provide clinically relevant information, particularly in relation to the brain and cancer.14 Pilot studies have reported that signal heterogeneity in hrMRI has potential in differentiating stable and unstable lesions.11,12 The distribution of signal intensity is often visualized by a histogram, a graphical representation of a frequency distribution. It has been reported that parameters derived from histograms on MR images are useful for the prediction of histological type and grade in head and neck malignancy, as well as differentiating prostate cancer from normal tissues.15 However, the characteristics of signal histograms in ICAS have not been widely investigated. In this retrospective study, a histogram analysis was performed to identify potential quantitative biomarkers for ICAS as visualized by hrMRI, and associated complementary values over lesion morphological and compositional features were also quantified.
Methods
Data Availability
Anonymized data not published within this article can be provided upon request by the corresponding author.
Study Population
Data from 247 consecutive patients with suspected acute stroke/transient ischemic attack who underwent hrMRI between January 2015 and December 2016 in Changhai Hospital (Shanghai, China) was used for analysis. This study was approved by the Institutional Review Board of Changhai Hospital with all patients having provided written informed consent. The inclusion and exclusion criteria are described in the Data Supplement.
MRI Acquisition
The hrMRI was performed in one of two 3T whole body systems (GE Signa 3.0T HDxt, GE Healthcare, Waukesha; and Skyra Siemens Healthcare, Erlangen, Germany). The purpose and protocols of hrMRI scanning are described in the Data Supplement.
Image Analysis
All atherosclerotic plaque images were analyzed by 2 radiologists (one radiology resident with 7 years’ experience and one senior radiologist with >15 years’ experience in the diagnostics of neuroradiology) who were not involved in statistical analyses. If there was marked eccentric or focal wall-thickening with plaque burden >40%,11 we considered a plaque was present. Each detected plaque was classified as culprit or nonculprit with the consideration of patient clinical presentations and findings in brain magnetic resonance imaging ([diffusion-weighted imaging (DWI) and fluid-attenuated inversion recovery (FLAIR)]). A culprit plaque was identified as a lesion arising on the ipsilateral side to a fresh infarction on the DWI images with accompanying clinical symptoms, while a plaque was considered to be nonculprit when it occurred in asymptomatic patients. If more than one plaque was present in the same vascular territory, the most stenotic lesion was chosen for analysis. Any disagreements were resolved by consensus, having further assessed other image features such as enhancement ratio. The imaging assessments are described in the Data Supplement.
The histogram of a region of interest is a function showing a frequency distribution of signal intensity in that area. Skewness, kurtosis, and coefficient of variation (CV) are commonly used to characterize the statistical information of a histogram. The skewness describes the skew in the shape of the distribution. A skewed distribution histogram is one that is asymmetrical in shape. The kurtosis describes the peak and/or flatness of the curve peak; a more acute peak has higher kurtosis, and a more flattened peak has lower kurtosis. The CV describes the dispersion of signal intensity.16 These 3 parameters are defined below.
 |
 |
Where x is the signal intensity value of each pixel within the region of interest;  and
and  are the mean and standard deviation (SD) of x, respectively; n is the pixel number. The histogram features were analyzed by 2 experienced reviewers using Image J (National Institutes of Health, Bethesda, MD).17 The same region of interest was used for all sequences for the same patient and was adjusted accordingly if misalignment was found between differently weighted images because of motion.
Statistical Analysis
Statistical analyses were performed using SPSS 24.0 (IBM). Normality testing was performed to assess the variable distribution. Univariate analysis (t-test or Mann-Whitney U test where appropriate for the comparison of continuous variables, and χ2 for the categorical variables) was used to assess the association of parameter with plaque type (culprit or nonculprit). Multivariate logistic regression analysis was subsequently performed, which included variables with P<0.10 in univariate tests. The odds ratios (ORs) with 95% CIs were calculated by a logistic regression model. The diagnostic performance was described using receiver operating characteristic curves and area under curve (AUC) values. The reproducibility of continuous variables was evaluated using the intraclass coefficient with a 2-way random-effects model, and the Kappa value was determined for the categorical variables.
Results
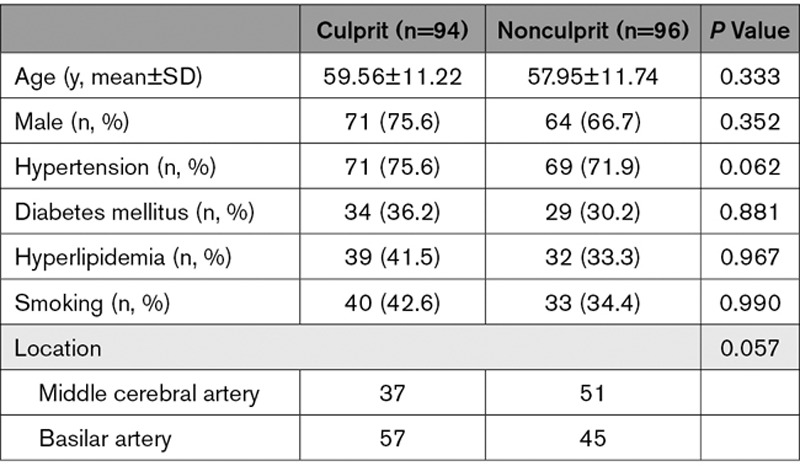
A total of 247 patients were recruited and data from 57 patients were excluded because of intracranial aneurysm (n=22), dissection (n=11), ≥30% stenosis in extracranial carotid arteries (n=10), Moya-Moya disease (n=7), vasculitis (n=4), and poor image quality (n=3). One hundred ninety patients with ICAS (94 culprit and 96 nonculprit) were included in the final analysis. Eighty-eight lesions were located at MCA (Figure 1A and 1B) and 102 at BA (Figure 1C and 1D). Detailed patient demographics are listed in Table 1.
Figure 1.
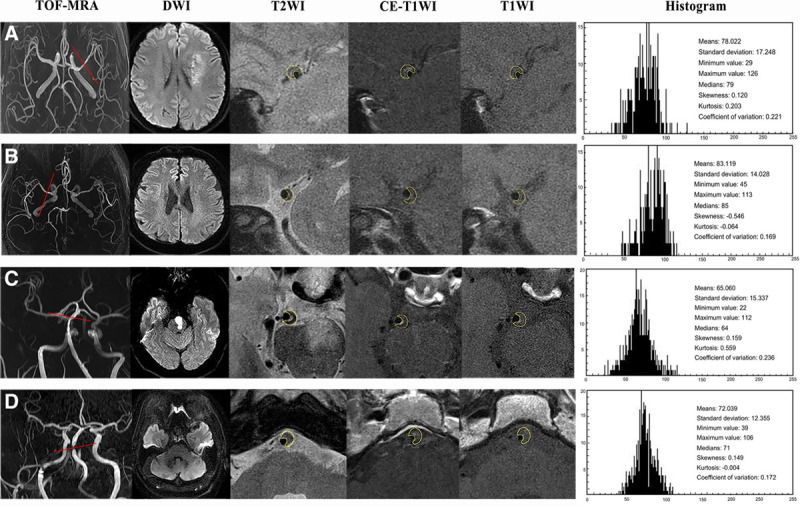
High-resolution magnetic resonance imaging (hrMRI) images and histogram showing atherosclerotic plaques in middle cerebral artery (MCA) and basilar artery (BA). A, A 64-year-old man with acute ischemic stroke on the left cerebrum. TOF-magnetic resonance angiography (MRA) demonstrated the stenosis located on the left MCA, and DWI showed a sheet acute infarcts. hrMRI images including T2W, T1W, and CE-T1W at the most stenotic site visualized the plaque and the quantitative histogram parameters based on T1W were shown on the right. B, A 59-year-old woman without any neuro symptom. TOF-MRA demonstrated the stenosis on the right MCA, and DWI showed no acute infarct. hrMRI images including T2W, T1W, and CE-T1W at the most stenosis site visualized the plaque and the quantitative parameters based on T1W were on the right. C, A 56-year-old man with acute ischemic stroke. TOF-MRA demonstrated the stenosis in BA, and DWI showed an acute infarction within the left brain stem. hrMRI images including T2W, T1W, and CE-T1W at the most stenotic site visualized the plaque and the quantitative histogram parameters based on T1W were shown on the right. D, A 62-year-old man without any neuro symptom. TOF-MRA demonstrated the stenosis in BA, and DWI showed no acute infarct with the posterior circulation territory. hrMRI images including T2W, T1W, and CE-T1W at the most stenosis site visualized the plaque and the quantitative parameters based on T1W were on the right (histogram plot: x-axis represents the count of the pixel and y-axis represents the intensity of the plaque).
Table 1.
Patient Demographics
hrMRI Characteristics of ICAS
The hrMRI characteristics of the intracranial atherosclerotic plaques are summarized in Table 2. It can be seen that the stenosis category was not associated with lesion type for either MCA or BA, as nearly 90% of culprit lesions had a degree of luminal stenosis of <70%. hrMRI identified that IPH (P=0.015), minimum luminal area (MLA; P=0.001), and plaque burden (PB; P=0.011) were associated with culprit plaques at MCA. IPH (P=0.009) and enhancement ratio in contrast enhanced T1-weighted (CE-T1W; P=0.006) were the only 2 significant features differentiating culprit and nonculprit plaques at BA.
Table 2.
Comparison of hrMRI Characteristics Between Culprit and Nonculprit Plaques
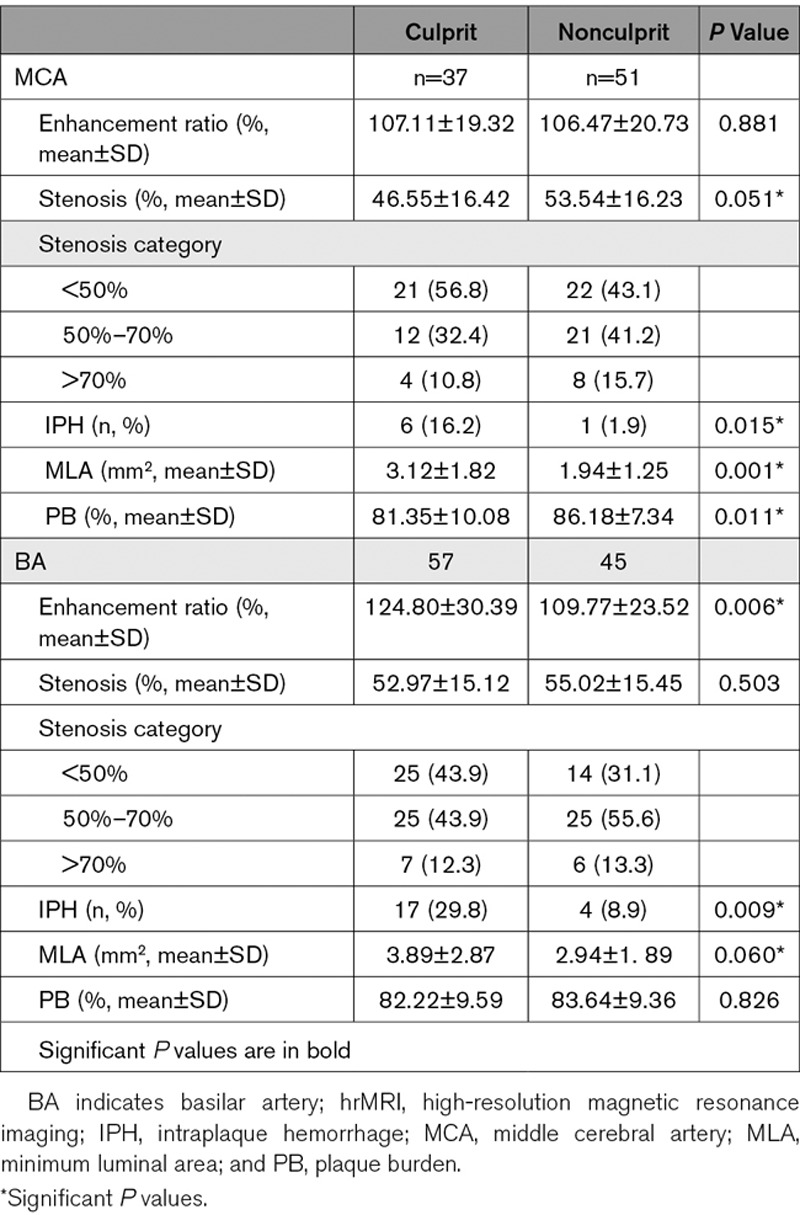
When data from MCA and BA was pooled, it showed that 3 hrMRI characteristics, IPH (P<0.001), MLA (P<0.001), and PB (P=0.059), were associated with plaque type. Patient demographics including hypertension, diabetes mellitus, and hyperlipidemia, stenosis category, and enhancement ratio in CE-T1W were not significantly different between culprit and nonculprit plaques (P>0.10).
Histogram Analysis for ICAS
Histogram characteristics of the intracranial atherosclerotic plaques are summarized in Table 3 with representative cases shown in Figure 1. Univariate analysis showed that SD (P<0.001), minimum value (P<0.001), maximum value (P=0.037), and CV (P<0.001) were significantly different between culprit and nonculprit lesions in the MCA on T1W images. However, no significant difference was observed in both T2W and CE-T1W images. Similarly, minimum value (P=0.003) and CV (P=0.001) were associated with plaque type in the BA on T1W images whereas no significant difference was found in features on T2W and CE-T1W images.
Table 3.
Histogram Features of Atherosclerotic Plaques on MCA and BA
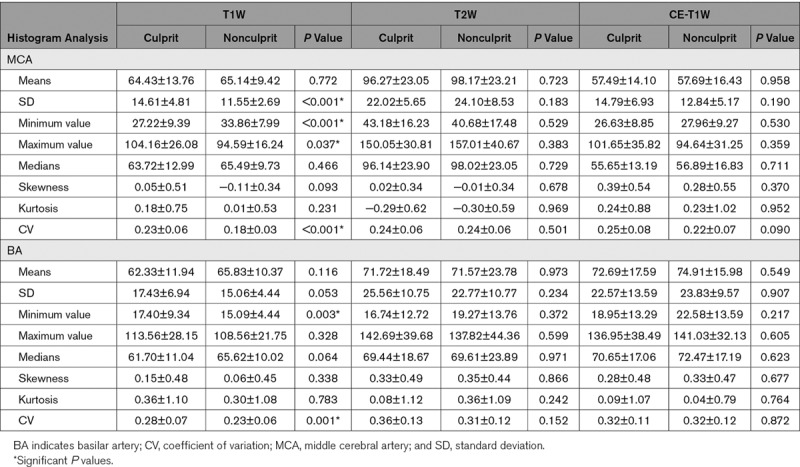
When data from both MCA and BA were pooled, area (P=0.002), SD (P<0.001), minimum value (P<0.001), maximum value (P=0.014), and CV (P<0.001) were all significantly different between culprit and nonculprit lesions on T1W images and no significant difference was found in both T2W and CE-T1W images. No significant difference was found in term of either skewness or kurtosis.
Univariate and Multivariate Logistic Regression Analysis
Potential predictive parameters listed in Tables 2 and 3 with P<0.1 were included in the regression analyses (Table 4). The univariate logistic regression analysis shown that luminal stenosis, IPH, MLA, PB, histogram parameters, including SD, minimum value, maximum value and CV, were significantly different between culprit and nonculprit plaques in the MCA, and enhancement ratios in CE-T1, IPH, MLA, area, minimum value and CV were significantly different between culprit and nonculprit lesions in the BA. Multiple logistic regression analyses showed that IPH (OR, 16.294v[95% CI, 1.043–254.632]; P=0.047), MLA (OR, 1.468 [95% CI, 1.032–2.087]; P=0.033), and CV (OR, 13.425 [95% CI, 3.987–45.204]; P<0.001) were 3 significant features associated with plaque type in the MCA. The AUC values of IPH, MLA, and CV were 0.571, 0.712, and 0.800, respectively (Figure 2A). The combination of these 3 features improved the AUC to 0.861 with sensitivity and specificity being 0.83 and 0.80, respectively. Except for IPH, MLA- and CV-defined AUC were both significantly higher than the one based on luminal stenosis (AUC=0.609).
Table 4.
Logistic Regression of the Significant Characteristics on Intracranial Atherosclerotic Plaques
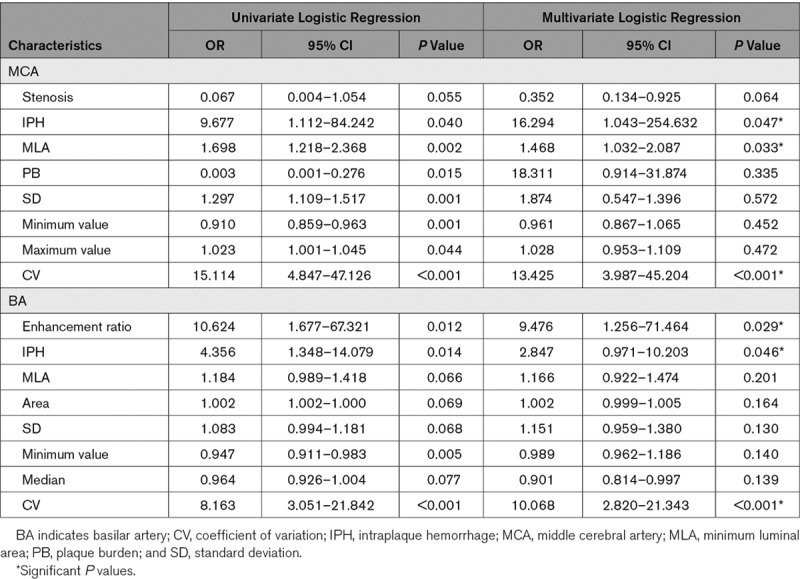
Figure 2.
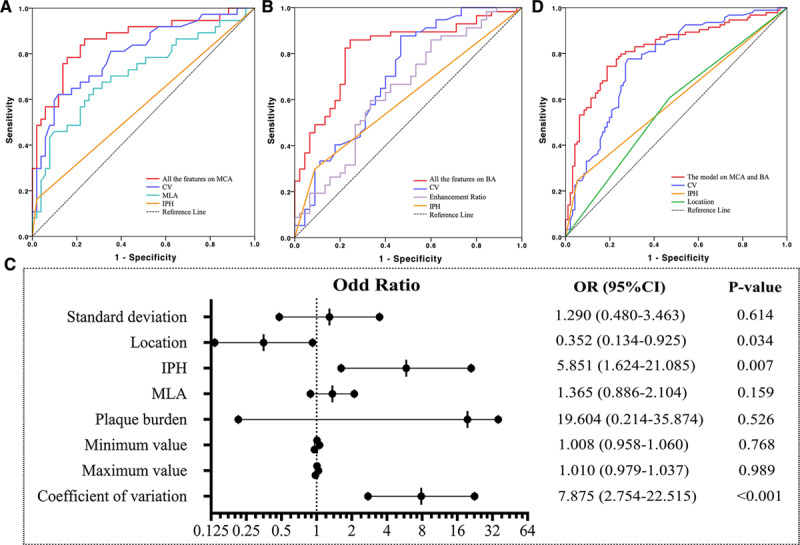
Receiver operating characteristic curves to differentiate culprit and nonculprit plaques, and odds ratio (OR) and 95% CI on the basis of multivariable logistic regression for each parameter. A, For middle cerebral artery (MCA); (B) for basilar artery (BA); (C) pooled data from both MCA and BA; and (D) OR and 95% CI on the basis of multivariable logistic regression.
The enhancement ratio in CE-T1W (OR, 9.476 [95% CI, 1.256–71.464]; P=0.029), IPH (OR, 2.847 [95% CI, 0.971–10.203]; P=0.046), and CV (OR, 10.068 [95% CI, 2.820–21.343]; P<0.001) were significantly associated with the plaque type for lesions in BA. Their AUC of receiver operating characteristic curves were 0.643, 0.605, and 0.708, respectively (Figure 2B). The combination of these three features improved the AUC to 0.804 with sensitivity and specificity being 0.79 and 0.77, respectively. In BA, compared with stenosis (AUC=0.546), IPH and enhancement did not improve AUC significantly, while CV did (P=0.033).
When data from both MCA and BA were pooled for the multiple logistic regression analysis (Figure 2C), the location where plaque was present (OR, 0.352 [95% CI, 0.134–0.925]; P=0.034), IPH (OR, 5.851 [95% CI, 1.624–21.085]; P=0.007), and CV (OR, 7.875; 95% CI, 2.754–22.515; P<0.001) were significant factors in differentiating plaque type with AUC of receiver operating characteristic curves being 0.569, 0.596, and 0.766, respectively (Figure 2D). When these 3 features were combined, the AUC was improved to 0.831 with sensitivity and specificity being 0.76 and 0.77, respectively. However, it was not significantly higher than the one of CV (P=0.362) whose sensitivity was 0.79, the specificity 0.80, and the accuracy 0.80 (Table I in the Data Supplement).
Reproducibility of Measurements
The reliability of hrMRI for the identification of morphological and compositional features in ICAS was assessed through the intra- and inter-observer agreement analysis, as listed in Table II in the Data Supplement.
Discussion
This study demonstrated that compared with the traditional assessment criterion (luminal stenosis), hrMRI-defined features provided a significant added value in differentiating culprit and nonculprit lesions in both the MCA and BA. Moreover, compared with conventional hrMRI-defined parameters, including IPH, MLA, and PB, histogram analysis further improved the accuracy for the lesion type differentiation. Histogram-defined signal dispersion, CV, was a strong predictor for the differentiation of lesion type for both MCA and BA. Compared with CV, the combination of other parameters, including IPH, MLA, and enhancement ratio did not improve the predictive power significantly.
Assessing the difference of hrMRI-defined plaque characteristics between culprit and nonculprit lesions is important, and it is also important to quantify the power of specific lesion characteristics in differentiating culprit and nonculprit lesions. Most previous studies were designed to identify higher risk hrMRI-defined features associated with patient symptoms. It has been suggested that compared with nonculprit plaques, culprit plaques are thicker with a larger wall area, volume, and greater PB and higher prevalence of expansive remodeling3,18 and symptomatic patients tended to have a lesion with an irregular lumen surface.18 Qiao et al13 reported that although positive remodeling was marginally associated with downstream stroke presence, arterial remodeling may provide insight into stroke risk. Several articles have reported that the imaging intensity features such as IPH and plaque enhancement had a significant association with recent infarction in the territory of the culprit plaque in ICAS.19 In our study, 9/37 (24.3%) of culprit plaques and 16/51 (31.4%) of nonculprit plaques showed enhancement in MCA (P=0.633), where enhancement is defined by a signal intensity increase of at least 15% compared with the precontrast image. In BA, 34/57 (59.6%) of culprit plaques and 15/45 (33.3%) of nonculprit plaques showed enhancement (P=0.01). The results obtained indicate that enhancement ratio was predictive for BA, which agreed with a previous study which found that enhancement was independently associated with culprit plaques in BA,12 whereas the enhancement ratio was not significantly different for lesions in MCA. A previous study also pointed out that more culprit lesions showed enhancement than nonculprit ones in MCA. However, adding enhancement did not significantly improve the diagnostic accuracy.11
Histogram analysis has previously been performed with coronary computed tomography angiology and carotid B-mode sonography.17,20,21 Obtained results demonstrated that histogram-defined parameters could discriminate symptomatic from asymptomatic plaques.22,23 This study has demonstrated its capacity in differentiating lesion type for ICAS. As shown in Table 3, CV was capable of differentiating culprit and nonculprit lesions only in T1W images, not in T2W or CE-T1W images. Compared with nonculprit lesions, culprit lesions had a larger CV as a consequence of a larger difference between the minimum and maximum intensity value and/or smaller mean intensity value in T1W images. Although the exact mechanism is unclear, it may be related to atherosclerotic inclusions in the lesion. According to in vivo studies with atherosclerotic plaques from the carotid artery24 and ex vivo studies with lesions from MCA,6 hrMRI provides contrasts which could differentiate various atherosclerotic components in the lesion. For instance, hyperintensity in T1W images may be associated with high risk recent IPH or lipid core.25 Because of their deep location and small size, it is hard to segment the components of intracranial atherosclerotic plaque. However, it could be rational to hypothesize that the wider signal intensity dispersion in T1W images indicates more types of components that might have been well known, for example, lipid, IPH, calcium and fibrous tissue, or which may not have been widely reported previously. For example, a recent study showed that the main chemical structure of advanced glycation end-products was a better candidate molecular imaging probe to identify vulnerable plaques on T1W than T2W images.26
Results obtained from this study suggest that TOF and T1W sequences might be sufficient in characterising the risk of intracranial atherosclerotic plaques based on the following facts: (1) both stenosis and MLA can be quantified by either TOF or T1W image; (2) the combination of TOF and T1W sequence can reliably identify IPH27; and (3) histogram-defined CV on T1W image can differentiate lesion type with high sensitivity and specificity. Although enhancement ratio is predictive for BA, excluding this factor only reduced AUC to 0.720. The imaging protocol with only TOF and T1W sequence is therefore beneficial for patients who are contraindicated with contrast agents. However, future follow-up studies are necessary to validate the predictive power of this scanning protocol in predicting subsequent ischemic events.
This study confirmed that IPH was associated with lesion type in both MCA and BA (Tables 2 and 4). Xu et al19 reported that hrMRI-defined IPH was observed more often in culprit MCA plaques than in nonculprit plaques. A recent study showed that IPH was the strongest independent marker of symptomatic status in patents with atherosclerotic plaque in BA.28 IPH is mostly attributed to fragile and leaky neovascularities with endothelial disruption and large local deformation.29 It is one of the key factors leading to plaque progression30 and therefore clinical symptoms.31 It is clear that IPH has a long-term effect on plaque progression. However, the duration until the clinical event remains unclear as patients with lesions with IPH may remain asymptomatic for as long as 54 months.31 Early identification of IPH might prove invaluable in optimizing management to minimize the risk of future adverse events, but future studies are needed to decide when aggressive treatments are truly required.
This study revealed that lesions in MCA and BA had common and distinct features (Table 4). MLA was predictive for MCA, but not for BA, and enhancement ratio was predictive for BA, but not for MCA. Multivariate regression analysis with data from both MCA and BA showed that location (MCA or BA) was an independent factor implying the difference between lesions from these 2 locations (Figure 2C). Such location-dependent features have been reported previously—compared with anterior circulation plaques, posterior circulation plaques had a larger plaque burden, higher remodeling ratio, and more often exhibited positive remodeling.13 Postmortem studies showed that plaques in BA tended to be concentric as opposed to eccentric as in the anterior circulation with higher incidence of IPH and tended to have a higher proportion of internal elastic lamina and less elastin.32 Such location-dependent features might be because of the differences in local arterial configuration and therefore the local hemodynamic environment.
Despite interesting findings, there are limitations to this study. First, this study is limited to Chinese populations. Second, our analysis was performed using 2-dimensional (2D) imaging data—its application is limited by low spatial resolution in the slice-select direction, long required acquisition times, and the difficulty of positioning 2D slices in one scan to capture multiple intracranial vessels with varying orientations. It is possible that the use of 3D imaging data could better characterize plaque features for improved histogram analysis. Moreover, limited by the imaging resolution, only lesions in large arteries, for example, MCA and BA, are visible as results most of studies are focused on large intracranial arteries. However, lesions in smaller arteries which cannot be pictured by current hrMRI techniques might also cause infarction. The development on this aspect is urgently needed. Finally, the results obtained from the retrospective analysis in this study need to be further confirmed by prospective studies including different ethnic populations to determine whether this model can be used for diagnosis of the vulnerability of atherosclerotic plaques by TOF and T1W images alone.
Acknowledgments
Drs Shi and Li contributed to the study concept and design, analysis and interpretation of data, drafting/revising the manuscript for content, and statistical analysis. Dr Zhao was involved in analysis and interpretation of data. Dr Peng contributed to the study concept and design and manuscript revision. Z. Meddings participated in manuscript revision. Drs Jiang and Liu performed analysis and interpretation of data. Dr Teng took part in the study concept and design, analysis, and interpretation of data. Dr Lu contributed to the study concept and design and revising the manuscript for content.
Sources of Funding
This study was supported in part by the National Natural Science Foundation of China (No. 81670396, No. 81270413, and No. 31470910), the Youth Foundation of Changhai Hospital (2018QNB009) and British Heart Foundation (PG/18/14/33562).
Disclosures
Dr Zhongzhao Teng is the chief scientist in Tenoke Ltd., Cambridge, UK and Nanjing Jingsan Medical Science and Technology, Ltd., Nanjing, China. Other authors do not have any conflict of interest to declare.
Supplementary Material
Footnotes
Drs Shi and Li contributed equally.
For Sources of Funding and Disclosures, see page 2168.
The Data Supplement is available with this article at https://www.ahajournals.org/doi/suppl/10.1161/STROKEAHA.120.029062.
References
- 1.Go AS, Mozaffarian D, Roger VL, Benjamin EJ, Berry JD, Blaha MJ, Dai S, Ford ES, Fox CS, Franco S, et al. American Heart Association Statistics Committee and Stroke Statistics Subcommittee. Executive summary: heart disease and stroke statistics–2014 update: a report from the American Heart Association. Circulation. 2014;129:399–410. doi: 10.1161/01.cir.0000442015.53336.12. doi: 10.1161/01.cir.0000442015.53336.12. [DOI] [PubMed] [Google Scholar]
- 2.Bos D, Portegies ML, van der Lugt A, Bos MJ, Koudstaal PJ, Hofman A, Krestin GP, Franco OH, Vernooij MW, Arfan Ikram M. Intracranial carotid artery atherosclerosis and the risk of stroke in whites: the Rotterdam Study. JAMA Neurol. 2014;71:405–411. doi: 10.1001/jamaneurol.2013.6223. doi: 10.1001/jamaneurol.2013.6223. [DOI] [PubMed] [Google Scholar]
- 3.Wang Y, Zhao X, Liu L, Soo YO, Pu Y, Pan Y, Wang Y, Zou X, Leung TW, Cai Y, et al. CICAS Study Group. Prevalence and outcomes of symptomatic intracranial large artery stenoses and occlusions in China: the Chinese Intracranial Atherosclerosis (CICAS) Study. Stroke. 2014;45:663–669. doi: 10.1161/STROKEAHA.113.003508. doi: 10.1161/STROKEAHA.113.003508. [DOI] [PubMed] [Google Scholar]
- 4.Homburg PJ, Plas GJ, Rozie S, van der Lugt A, Dippel DW. Prevalence and calcification of intracranial arterial stenotic lesions as assessed with multidetector computed tomography angiography. Stroke. 2011;42:1244–1250. doi: 10.1161/STROKEAHA.110.596254. doi: 10.1161/STROKEAHA.110.596254. [DOI] [PubMed] [Google Scholar]
- 5.Zhao DL, Deng G, Xie B, Gao B, Peng CY, Nie F, Yang M, Ju S, Teng G. Wall characteristics and mechanisms of ischaemic stroke in patients with atherosclerotic middle cerebral artery stenosis: a high-resolution MRI study. Neurol Res. 2016;38:606–613. doi: 10.1179/1743132815Y.0000000088. doi: 10.1179/1743132815Y.0000000088. [DOI] [PubMed] [Google Scholar]
- 6.Jiang Y, Zhu C, Peng W, Degnan AJ, Chen L, Wang X, Liu Q, Wang Y, Xiang Z, Teng Z, et al. Ex-vivo imaging and plaque type classification of intracranial atherosclerotic plaque using high resolution MRI. Atherosclerosis. 2016;249:10–16. doi: 10.1016/j.atherosclerosis.2016.03.033. doi: 10.1016/j.atherosclerosis.2016.03.033. [DOI] [PMC free article] [PubMed] [Google Scholar]
- 7.Chung GH, Kwak HS, Hwang SB, Noh SJ. Magnetic resonance imaging of intracranial atherosclerosis: comparison of ex vivo 3T MRI and histologic findings. Eur J Radiol. 2017;97:110–114. doi: 10.1016/j.ejrad.2017.10.013. doi: 10.1016/j.ejrad.2017.10.013. [DOI] [PubMed] [Google Scholar]
- 8.Dieleman N, van der Kolk AG, Zwanenburg JJ, Harteveld AA, Biessels GJ, Luijten PR, Hendrikse J. Imaging intracranial vessel wall pathology with magnetic resonance imaging: current prospects and future directions. Circulation. 2014;130:192–201. doi: 10.1161/CIRCULATIONAHA.113.006919. doi: 10.1161/CIRCULATIONAHA.113.006919. [DOI] [PubMed] [Google Scholar]
- 9.Mandell DM, Mossa-Basha M, Qiao Y, Hess CP, Hui F, Matouk C, Johnson MH, Daemen MJAP, Vossough A, Edjlali M, et al. Vessel Wall Imaging Study Group of the American Society of Neuroradiology. Intracranial Vessel Wall MRI: principles and Expert Consensus Recommendations of the American Society of Neuroradiology. AJNR Am J Neuroradiol. 2017;38:218–229. doi: 10.3174/ajnr.A4893. doi: 10.3174/ajnr.A4893. [DOI] [PMC free article] [PubMed] [Google Scholar]
- 10.Qiao Y, Guallar E, Suri FK, Liu L, Zhang Y, Anwar Z, Mirbagheri S, Xie YYJ, Nezami N, Intrapiromku J, et al. MR imaging measures of intracranial atherosclerosis in a population-based study. Radiology. 2016;280:860–868. doi: 10.1148/radiol.2016151124. doi: 10.1148/radiol.2016151124. [DOI] [PMC free article] [PubMed] [Google Scholar]
- 11.Teng Z, Peng W, Zhan Q, Zhang X, Liu Q, Chen S, Tian X, Chen L, Brown AJ, Graves MJ, et al. An assessment on the incremental value of high-resolution magnetic resonance imaging to identify culprit plaques in atherosclerotic disease of the middle cerebral artery. Eur Radiol. 2016;26:2206–2214. doi: 10.1007/s00330-015-4008-5. doi: 10.1007/s00330-015-4008-5. [DOI] [PMC free article] [PubMed] [Google Scholar]
- 12.Shi Z, Zhu C, Degnan AJ, Tian X, Li J, Chen L, Zhang X, Peng W, Chen C, Lu J, et al. Identification of high-risk plaque features in intracranial atherosclerosis: initial experience using a radiomic approach. Eur Radiol. 2018;28:3912–3921. doi: 10.1007/s00330-018-5395-1. doi: 10.1007/s00330-018-5395-1. [DOI] [PMC free article] [PubMed] [Google Scholar]
- 13.Qiao Y, Anwar Z, Intrapiromkul J, Liu L, Zeiler SR, Leigh R, Zhang Y, Guallar E, Wasserman B. Patterns and implications of intracranial arterial remodeling in stroke patients. Stroke. 2016;47:434–440. doi: 10.1161/STROKEAHA.115.009955. doi: 10.1161/STROKEAHA.115.009955. [DOI] [PMC free article] [PubMed] [Google Scholar]
- 14.Just N. Improving tumour heterogeneity MRI assessment with histograms. Br J Cancer. 2014;111:2205–2213. doi: 10.1038/bjc.2014.512. doi: 10.1038/bjc.2014.512. [DOI] [PMC free article] [PubMed] [Google Scholar]
- 15.Fujima N, Homma A, Harada T, Shimizu Y, Tha KK, Kano S, Mizumachi T, Li R, Kudo K, Shirato H. The utility of MRI histogram and texture analysis for the prediction of histological diagnosis in head and neck malignancies. Cancer Imaging. 2019;19:5. doi: 10.1186/s40644-019-0193-9. doi: 10.1186/s40644-019-0193-9. [DOI] [PMC free article] [PubMed] [Google Scholar]
- 16.King AD, Chow KK, Yu KH, Mo FK, Yeung DK, Yuan J, Bhatia KS, Vlantis AC, Ahuja A. Head and neck squamous cell carcinoma: diagnostic performance of diffusion-weighted MR imaging for the prediction of treatment response. Radiology. 2013;266:531–538. doi: 10.1148/radiol.12120167. doi: 10.1148/radiol.12120167. [DOI] [PubMed] [Google Scholar]
- 17.Schlett CL, Maurovich-Horvat P, Ferencik M, Alkadhi H, Stolzmann P, Scheffel H, Seifarth H, Nakano M, Do S, Vorpahl M, et al. Histogram analysis of lipid-core plaques in coronary computed tomographic angiography: ex vivo validation against histology. Invest Radiol. 2013;48:646–653. doi: 10.1097/RLI.0b013e31828fdf9f. doi: 10.1097/RLI.0b013e31828fdf9f. [DOI] [PubMed] [Google Scholar]
- 18.Chung GH, Kwak HS, Hwang SB, Jin GY. High resolution MR imaging in patients with symptomatic middle cerebral artery stenosis. Eur J Radiol. 2012;81:4069–4074. doi: 10.1016/j.ejrad.2012.07.001. doi: 10.1016/j.ejrad.2012.07.001. [DOI] [PubMed] [Google Scholar]
- 19.Xu WH, Li ML, Gao S, Ni J, Yao M, Zhou LX, Peng B, Feng F, Jin ZY, Cui L. Middle cerebral artery intraplaque hemorrhage: prevalence and clinical relevance. Ann Neurol. 2012;71:195–198. doi: 10.1002/ana.22626. doi: 10.1002/ana.22626. [DOI] [PubMed] [Google Scholar]
- 20.Huang X, Zhang Y, Qian M, Meng L, Xiao Y, Niu L, Zheng R, Zheng H. Classification of carotid plaque echogenicity by combining texture features and morphologic characteristics. J Ultrasound Med. 2016;35:2253–2261. doi: 10.7863/ultra.15.09002. doi: 10.7863/ultra.15.09002. [DOI] [PubMed] [Google Scholar]
- 21.Marwan M, Taher MA, El Meniawy K, Awadallah H, Pflederer T, Schuhbäck A, Ropers D, Daniel WG, Achenbach S. In vivo CT detection of lipid-rich coronary artery atherosclerotic plaques using quantitative histogram analysis: a head to head comparison with IVUS. Atherosclerosis. 2011;215:110–115. doi: 10.1016/j.atherosclerosis.2010.12.006. doi: 10.1016/j.atherosclerosis.2010.12.006. [DOI] [PubMed] [Google Scholar]
- 22.Kakkos SK, Nicolaides AN, Kyriacou E, Daskalopoulou SS, Sabetai MM, Pattichis CS, Geroulakos G, Griffin MB, Thomas D. Computerized texture analysis of carotid plaque ultrasonic images can identify unstable plaques associated with ipsilateral neurological symptoms. Angiology. 2011;62:317–328. doi: 10.1177/0003319710384397. doi: 10.1177/0003319710384397. [DOI] [PubMed] [Google Scholar]
- 23.Mougiakakou SG, Golemati S, Gousias I, Nicolaides AN, Nikita KS. Computer-aided diagnosis of carotid atherosclerosis based on ultrasound image statistics, laws’ texture and neural networks. Ultrasound Med Biol. 2007;33:26–36. doi: 10.1016/j.ultrasmedbio.2006.07.032. doi: 10.1016/j.ultrasmedbio.2006.07.032. [DOI] [PubMed] [Google Scholar]
- 24.den Hartog AG, Bovens SM, Koning W, Hendrikse J, Luijten PR, Moll FL, Pasterkamp G, de Borst G. Current status of clinical magnetic resonance imaging for plaque characterisation in patients with carotid artery stenosis. Eur J Vasc Endovasc Surg. 2013;45:7–21. doi: 10.1016/j.ejvs.2012.10.022. doi: 10.1016/j.ejvs.2012.10.022. [DOI] [PubMed] [Google Scholar]
- 25.Yuan C, Mitsumori LM, Ferguson MS, Polissar NL, Echelard D, Ortiz G, Small R, Davies JW, Kerwin WS, Hatsukami T. In vivo accuracy of multispectral magnetic resonance imaging for identifying lipid-rich necrotic cores and intraplaque hemorrhage in advanced human carotid plaques. Circulation. 2001;104:2051–2056. doi: 10.1161/hc4201.097839. doi: 10.1161/hc4201.097839. [DOI] [PubMed] [Google Scholar]
- 26.Eto A, Sakata N, Nagai R, Shirakawa JI, Inoue R, Kiyomi F, Nii K, Aikawa H, Iko M, Tsutsumi M, et al. Nε-(carboxymethyl)lysine concentration in debris from carotid artery stenting correlates independently with signal intensity on T1-weighted black-blood magnetic resonance images. J Stroke Cerebrovasc Dis. 2017;26:1341–1348. doi: 10.1016/j.jstrokecerebrovasdis.2017.02.005. doi: 10.1016/j.jstrokecerebrovasdis.2017.02.005. [DOI] [PubMed] [Google Scholar]
- 27.Chu B, Kampschulte A, Ferguson MS, Kerwin WS, Yarnykh VL, O’Brien KD, Polissar NL, Hatsukami TS, Yuan C. Hemorrhage in the atherosclerotic carotid plaque: a high-resolution MRI study. Stroke. 2004;35:1079–1084. doi: 10.1161/01.STR.0000125856.25309.86. doi: 10.1161/01.STR.0000125856.25309.86. [DOI] [PubMed] [Google Scholar]
- 28.Zhu C, Tian X, Degnan AJ, Shi Z, Zhang X, Chen L, Teng Z, Saloner D, Lu J, Liu Q. Clinical significance of intraplaque hemorrhage in low- and high-grade basilar artery stenosis on high-resolution MRI. AJNR Am J Neuroradiol. 2018;39:1286–1292. doi: 10.3174/ajnr.A5676. doi: 10.3174/ajnr.A5676. [DOI] [PMC free article] [PubMed] [Google Scholar]
- 29.Teng Z, He J, Degnan AJ, Chen S, Sadat U, Bahaei NS, Rudd JHF, Gillard J. Critical mechanical conditions around neovessels in carotid atherosclerotic plaque may promote intraplaque hemorrhage. Atherosclerosis. 2012;223:321–326. doi: 10.1016/j.atherosclerosis.2012.06.015. doi: 10.1016/j.atherosclerosis.2012.06.015. [DOI] [PMC free article] [PubMed] [Google Scholar]
- 30.Takaya N, Yuan C, Chu B, Saam T, Polissar NL, Jarvik GP, Isaac C, McDonough J, Natiello C, Small R, et al. Presence of intraplaque hemorrhage stimulates progression of carotid atherosclerotic plaques: a high-resolution magnetic resonance imaging study. Circulation. 2005;111:2768–2775. doi: 10.1161/CIRCULATIONAHA.104.504167. doi: 10.1161/CIRCULATIONAHA.104.504167. [DOI] [PubMed] [Google Scholar]
- 31.Sun J, Underhill HR, Hippe DS, Xue Y, Yuan C, Hatsukami TS. Sustained acceleration in carotid atherosclerotic plaque progression with intraplaque hemorrhage: a long-term time course study. JACC Cardiovasc Imaging. 2012;5:798–804. doi: 10.1016/j.jcmg.2012.03.014. doi: 10.1016/j.jcmg.2012.03.014. [DOI] [PMC free article] [PubMed] [Google Scholar]
- 32.Roth W, Morgello S, Goldman J, Mohr JP, Elkind MS, Marshall RS, Gutierrez J. Histopathological differences between the anterior and posterior brain arteries as a function of aging. Stroke. 2017;48:638–644. doi: 10.1161/STROKEAHA.116.015630. doi: 10.1161/STROKEAHA.116.015630. [DOI] [PMC free article] [PubMed] [Google Scholar]
Associated Data
This section collects any data citations, data availability statements, or supplementary materials included in this article.
Supplementary Materials
Data Availability Statement
Anonymized data not published within this article can be provided upon request by the corresponding author.


