

Abstract
Fenebrutinib is a CYP3A substrate and time‐dependent inhibitor, as well as a BCRP and OATP1B transporter inhibitor in vitro. Physiologically‐based pharmacokinetic (PBPK) modeling strategies with the ultimate goal of understanding complex drug‐drug interactions (DDIs) and proposing doses for untested scenarios were developed. The consistency in the results of two independent approaches, PBPK simulation and endogenous biomarker measurement, supported that the observed transporter DDI is primarily due to fenebrutinib inhibition of intestinal BCRP, rather than hepatic OATP1B. A mechanistic‐absorption model accounting for the effects of excipient complexation with fenebrutinib was used to rationalize the unexpected observation of itraconazole‐fenebrutinib DDI (maximum plasma concentration (Cmax) decreased, and area under the curve (AUC) increased). The totality of the evidence from sensitivity analysis and clinical and nonclinical data suggested that fenebrutinib is likely a sensitive CYP3A substrate. This advanced PBPK application allowed the use of model‐informed approach to facilitate the development of concomitant medication recommendations for fenebrutinib without requiring additional clinical DDI studies.
Study Highlights.
WHAT IS THE CURRENT KNOWLEDGE ON THE TOPIC?
☑ Model‐informed drug development (MIDD) has become an important approach to improve clinical trial efficiency, optimize drug dosing, and propose drug labeling in the absence of dedicated trials. Experiences from PBPK MIDD for drugs with complex drug‐drug interactions are desired to build up confidence in using the approach and increase the probability of regulatory success.
WHAT QUESTION DID THIS STUDY ADDRESS?
☑ Can we use PBPK mechanistic modeling strategy with incorporation of nonclinical (e.g., drug‐excipient complexation effect) data, and in combination with clinical (e.g., endogenous biomarker) data to rationalize clinical observation of complex DDI results and ultimately use PBPK MIDD to inform the comedication strategy in example with fenebrutinib?
WHAT DOES THIS STUDY ADD TO OUR KNOWLEDGE?
☑ The study indicates that fenebrutinib‐excipient complexation is the cause of an unexpected result of DDI between itraconazole and fenebrutinib, and the totality of evidences from PBPK simulation and other clinical studies suggest that fenebrutinib is likely a sensitive CY3A4 substrate. It also suggests that the transporter inhibition DDI caused by fenebrutinib is mainly due to its inhibition in gut BCRP rather than hepatic OATP1B.
HOW MIGHT THIS CHANGE DRUG DISCOVERY, DEVELOPMENT, AND/OR THERAPEUTICS?
☑ This study uncovered an important role of physical drug‐excipient complexation and how it can affect interpretation of metabolic DDIs observed in clinical studies. The mechanistic PBPK absorption model with incorporation of drug‐excipient complexation effect can explain confounding DDI results between a CYP3A substrate (i.e., fenebrutinib) and a strong inhibitor (i.e., itraconazole), and ultimately confirm the fm,CYP3A4 without conducting additional dedicated DDI studies. The combined PBPK modeling and endogenous biomarker approach can be used to increase our confidence in understanding clinical DDI involving multiple transporters. This work has provided an example of the PBPK model‐informed drug development approach.
Fenebrutinib, an orally administered, potent, and selective reversible antagonist of Bruton’s tyrosine kinase is being developed as a potential therapy for autoimmune diseases. 1 Phase I clinical studies have been conducted to characterize fenebrutinib disposition in humans. 2 The in vitro data indicated that fenebrutinib is both a substrate and a time‐dependent inhibitor of cytochrome P450 3A (CYP3A). Fenebrutinib also inhibits organic‐anion‐transporting polypeptides (OATP1B1/3), breast cancer resistance protein (BCRP), and P‐glycoprotein (P‐gp) transporters. 3 To assess the clinical drug‐drug interaction (DDI) risk, a physiologically‐based pharmacokinetic (PBPK) model was developed to predict the magnitude of DDI between fenebrutinib and CYP3A substrates (midazolam and simvastatin), fenebrutinib and a BCRP and OATP1B substrate (rosuvastatin), and fenebrutinib and strong CYP3A inhibitor (itraconazole). Although these prospective PBPK simulations predicted the clinically observed DDI (i.e., fenebrutinib as an inhibitor of CYP3A and transporter substrates), a further mechanistic understanding of the unexpected effect of itraconazole on fenebrutinib pharmacokinetics (PKs), as well as the DDI caused by fenebrutinib BCRP and OATP1B transporter inhibition is required in order to use the model to predict untested scenarios and inform labeling.
Prospective PBPK simulations predicted increases in both fenebrutinib maximum plasma concentration (Cmax) and area under the curve (AUC) in the presence of itraconazole, however, in the DDI study, while multiple doses of 200 mg itraconazole solution increased fenebrutinib AUC, there was an unexpected decrease in Cmax and a delay in time to reach the Cmax (Tmax). Understanding the cause of clinical observation using mechanistic modeling with a hypothesis supported by in vitro and in vivo data is ultimately important to determine CYP3A contribution (f m,CYP3A) to fenebrutinib clearance, and subsequently the DDI between fenebrutinib and other CYP3A inhibitors.
In the clinical DDI study between fenebrutinib and rosuvastatin, increase in rosuvastatin exposure in the presence of fenebrutinib was observed, and, as expected from prospective PBPK simulations, the increase in rosuvastatin Cmax was larger than AUC, likely due to stronger inhibition of BCRP compared with OATP1B by fenebrutinib. Confirmation of the relative contribution of OATP1B vs. BCRP inhibition by fenebrutinib to the total observed DDI using PBPK simulation and other clinical data is desired in order to increase confidence in predicting fenebrutinib DDI with other OATP1B substrates that may be co‐administered with fenebrutinib.
Here, we present two integrated approaches to support PBPK model‐informed fenebrutinib drug development: (i) using a mechanistic absorption PBPK model, incorporating the effect of excipient from itraconazole solution (i.e., hydroxypropyl‐β‐cyclodextrin (H‐β‐CD)–fenebrutinib complexation), to rationalize the observed clinical DDI between itraconazole and fenebrutinib, and thereafter determine fenebrutinib f m,CYP3A through retrospective simulations and verification using additional clinical data; and (ii) using combined PBPK simulations and endogenous biomarker measurements for a better mechanistic understanding of a clinical DDI (i.e., between fenebrutinib and rosuvastatin) involving multiple transporters. Ultimately, with increased confidence through better mechanistic understanding, these PBPK model‐based approaches may facilitate development of clinical recommendations around concomitant medication use for fenebrutinib, without requiring additional clinical DDI studies.
METHODS
Preclinical in vitro and in vivo data
In vitro studies 3 to assess fenebrutinib as CYP3A substrate, transporter, and CYP3A enzyme inhibitor are presented in the Supplementary Material.
To evaluate the complexation interaction between fenebrutinib and H‐β‐CD, an excipient in itraconazole solution, the in vitro experiments were conducted using a Madin‐Darby Canine Kidney (MDCK) cell monolayer system, and the effect on apparent fenebrutinib permeability (Papp) at various concentrations of H‐β‐CD were measured. Moreover, PK study in pentagastrin‐pretreated dogs with fenebrutinib tablets administered orally, with and without H‐β‐CD, was conducted, and the effect of H‐β‐CD on fenebrutinib absorption was assessed. Details of these studies are described elsewhere (manuscript in preparation).
Clinical DDI study
A phase I DDI study 3 was conducted in healthy subjects to evaluate the effect of fenebrutinib on the PKs of midazolam, rosuvastatin, and simvastatin; and the effect of itraconazole on the PK of fenebrutinib (Supplementary Material).
Fenebrutinib PBPK model
The overall PBPK modeling strategy is presented in Figure 1 . The fenebrutinib model was built using in vitro and preclinical absorption, distribution, metabolism, elimination (ADME) data, and further refined and verified based on phase I PK data. The prospective DDI simulations for fenebrutinib as a CYP3A substrate and inhibitor, and an OATP1B and BCRP transporter inhibitor were conducted prior to clinical DDI study. As the clinical DDI data became available, retrospective mechanistic PBPK analysis was conducted to verify the assumptions used in the prediction and rationalize the unexpected clinical observations.
Figure 1.
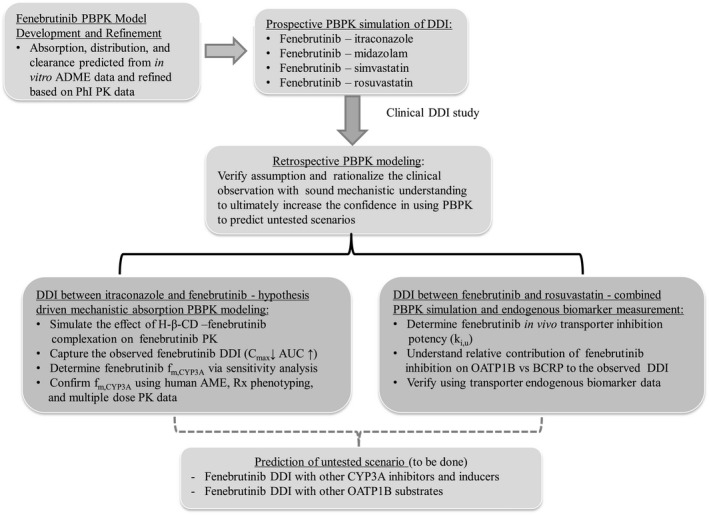
Overall physiologically‐based pharmacokinetic (PBPK) model‐informed fenebrutinib development strategy. ADME, absorption, distribution, metabolism, elimination; AME, absorption, metabolism, and excretion; AUC, area under the concentration‐time curve; BCRP, breast cancer resistance protein; Cmax, maximum plasma concentration; DDI, drug‐drug interaction; fm,CYP3A, contribution of CYP3A to fenebriutinib clearance; K i,u, unbound transporter inhibition constant; OATP, organic anion‐transporting polypeptide; PKs, pharmacokinetics.
The Simcyp Population‐based ADME Simulator (version 16; Sheffield, UK) with a healthy volunteer population (“Sim – Healthy Volunteers”) was used to build the fenebrutinib PBPK model. Models describing fenebrutinib absorption, distribution, and elimination are summarized below:
Absorption: The Advanced Dissolution, Absorption, and Metabolism (ADAM) model was used to describe the absorption of fenebrutinib tablet. The cumulative absorption was predicted based on measured pH‐solubility data and dissolution profile predicted by the model. The human jejunum effective permeability (Peff, man) was predicted from measured MDCK data (Table 1 ).
Distribution: Volume of distribution at steady‐state (V ss) was predicted using tissue composition equations 4 in the model. The Simcyp minimal PBPK (which treats all organs other than the intestine and liver as a single compartment 5 plus a single adjusting compartment (SAC)) distribution model was selected to best describe the multiphasic fenebrutinib PK profile. Final values of apparent volume of SAC, rate constant from systemic compartment to SAC (Kin), and rate constant from SAC to the systemic compartment (Kout) were determined from simulations that best describe the shape of the observed PK profile.
Elimination: Preclinical data indicated hepatic metabolism predominantly through CYP3A4 as the main clearance pathway for fenebrutinib. Therefore, in the fenebrutinib elimination model, the total clearance (CL) estimated based on phase I PK was assigned to major hepatic clearance primarily through CYP3A4 and minor renal clearance.
Table 1.
Key parameters for final fenebrutinib PBPK model
| Parameters | Value | Methods/references |
|---|---|---|
| MW | 664.8 | |
| logP | 3.3 | Measured |
| pK a1, pK a2 | 5, 3.7 | Diprotic base |
| f u,p | 0.197 | Measured |
| B/P | 0.61 | Measured |
| Absorption | ADAM absorption model | |
| MDCK, 10−6 cm/s | 15.1 | Measured |
| Peff‐man, 10−4 cm/s | 7.56 | Simcyp predicted using MDCK‐Papp with scalar of 3.9 calculated from references (Model 1) |
|
Peff‐man, 10‐4 cm/s Duodenum/jejunum I/jejunum II/ileum I/ileum II/ileum III/ileum IV/colon |
0.088/0.22/0.15/1.13/1.13/1.1/1.1/0.588 | Simcyp MechPeff model predicted regional Peff, with manually reduced Peff (30×) in duodenum, jejunum I, and jejunum II (Model 2) |
| pH solubility profile 2.3/2.6/3.0/3.8/5.0/6.1/6.9/7.7/9.2 | 35.9/5.67/1.44/0.032/0.001/0.001……. | Measured |
| CSR | 100 | Best fit |
| PRC, 1/hour | 1 | Best fit |
| Dissolution | Predicted | Based on in vitro biopharmaceutical data (solubility, permeability, FaSSIF and FeSSIF, particle size) |
| Log K m:w neutral | 5.35 | Model calculated based on measured FaSSIF and FeSSIF |
| Distribution | Minimal + SAC PBPK model | |
| V ss, L/kg | 5.23 | Simcyp method 2 (Rodgers and Rowland, 2006), Kp scalar 0.315 |
| V sac, L/kg | 3.25 | Best fit |
| K in/K out, 1/hour | 0.015/0.05 | Best fit |
| Elimination | Enzyme kinetics (Recombinant) | |
| CLint‐CYP3A4, pmol/min/pmol of isoform | 0.4/0.51/0.64/0.695/0.74/0.82 | Corresponding to f m,CYP3A4 of 0.5/0.6/0.75/0.8/0.85/0.9, account for 50 /60/75/80/85/90% of total CL |
| Additional liver CLint‐hep, µL/min/106 | 17.5/12.5/07.1/5.5/4.4/2.4 | |
| CL‐Renal, L/hour | 1.1 | Account for ~ 5% of total CL, based on human AME data |
| CYP inhibition | ||
| CYP3A TDI K I/K inact, µM, 1/hour | 7.9/0.684 | Measured |
| f u,mic | 0.5 | Optimized to best capture observed DDI (Simcyp model predicted to be 0.97) |
| Transporter inhibition | ||
| K i,u‐OATP1B1, µM | 0.1379 | Measured IC50/2*0.014 (lumped scaling factor) |
| K i,u‐OATP1B3, µM | 0.05005 | |
| K i,u‐BCRP, µM | 0.0658 | |
| K i,u‐P‐gp, µM | 0.2121 |
ADAM, advanced dissolution, absorption, and metabolism; BCRP, breast cancer resistance protein; B/P ratio, blood/plasma partition ratio; CL, clearance; CLint, intrinsic clearance; CSR, critical supersaturation ratio; f a, fraction absorbed; FaSSIF, fasted state simulated intestinal fluid; FeSSIF, fed state simulated intestinal fluid; f u,mic, free fraction in liver microsome; f u,p, free fraction in plasma; IC50, half‐maximal inhibitory concentration; k a, absorption rate constant; K I, concentration at 50% of K inact; K i,u, unbound transporter inhibition constant; k in, rate constant from systemic compartment to SAC; K inact, maximum enzyme inactivation; k out, rate constant from SAC compartment to the systemic compartment; LogK m:w, logarithm of bile micelle: buffer partition coefficients; LogP, octanol‐water partition co‐efficient; MW, molecular weight; OATP, organic anion‐transporting polypeptide; Papp, apparent fenebrutinib permeability; PBPK, physiologically‐based pharmacokinetics; Peff, effective permeability; Peff‐man, human jejunum effective permeability; P‐gp, P‐glycoprotein; PRC, precipitation rate constant; pK a, acid dissociation constant; V sac, volume of the single adjusted compartment; V ss, volume of distribution at steady state.
Simulations of fenebrutinib PK were performed using 10 virtual trials of 10 healthy volunteers per trial, aged 20–50 years, and a 1:1 female‐to‐male ratio. In phase I PK studies, fenebrutinib was administered as solution, capsule (single and multiple‐day dose), 2 and tablet (200 mg relative bioavailability study; unpublished data) dosage forms. Because the DDI studies used tablet form, the PBPK absorption model was developed to describe PK of fenebrutinib tablet, and model’s performance was evaluated by overlaying the simulated mean concentration‐time profiles with clinical data.
Prospective simulation of fenebrutinib DDI
To assess DDI risk for fenebrutinib as CYP3A substrate or inhibitor, or BCRP and OATP1B1/3 transporter inhibitor, PBPK simulations were conducted prior to DDI studies to predict the magnitude of DDI between itraconazole and fenebrutinib, fenebrutinib and midazolam, fenebrutinib and simvastatin, and fenebrutinib and rosuvastatin. The default PBPK models for midazolam, simvastatin, and rosuvastatin available in Simcyp (version 16) compound library were used. The itraconazole and its metabolite hydroxy‐itraconazole models in Simcyp compound library were modified based on our previous work. 6 Key parameters for rosuvastatin and itraconazole are presented in Tables S1 and S2 .
To predict DDI with fenebrutinib as perpetrator, fenebrutinib in vitro time‐dependent CYP3A inhibition kinetic data (K I, concentration at 50% of K inact and K inact, maximum enzyme inactivation), and transporter inhibition K i (inhibition constant) for OATP1B1/3 and BCRP were entered into the fenebrutinib model. For fenebrutinib as a victim, in prospective simulation of DDI between itraconazole and fenebrutinib, 3 scenarios with f mCYP3A as 50%, 75%, and 90% were simulated because the f mCYP3A of fenebrutinib could not be confirmed solely based on in vitro data before clinical DDI and human mass balance study data became available. The simulations were performed using a Simcyp virtual population, as described earlier.
Retrospective PBPK analysis for mechanistic understanding of complex DDI
After clinical DDI study data became available, retrospective PBPK simulations were conducted to rationalize clinical observation and further refine the model with better mechanistic understanding before applying the model to simulate DDI to inform fenebrutinib concomitant medication strategy.
The overall approach of retrospective PBPK analysis (Figure 1 ) includes: (i) using mechanistic absorption model incorporating hypothesized H‐β‐CD excipient effect to explain the unexpected change in fenebrutinib PK when co‐administered with itraconazole, and determining and verifying f mCYP3A in fenebrutinib clearance using all existing clinical data; and (ii) performing sensitivity analysis on fenebrutinib OATP1B1/3 and BCRP inhibition K i,u (unbound K i), and scenario simulations of fenebrutinib‐rosuvastatin DDI to understand the relative contribution of fenebrutinib inhibition on OATP1B vs. BCRP to the observed DDI and verification using endogenous transporter biomarker data.
RESULTS
Preclinical in vitro and in vivo data
Fenebrutinib inhibited the OATP1B1 and OATP1B3‐mediated uptake (half‐maximal inhibitory concentration (IC50) 19.7 µM and 7.15 µM, respectively); BCRP‐mediated efflux (IC50 9.40 µM), and CYP3A enzyme (k inact and apparent K I of 0.0114 min−1 and 7.9 μM, respectively). 3 In vitro reaction phenotyping study indicated that CYP3A is the major enzyme responsible for the metabolism of fenebrutinib.
Fenebrutinib Papp decreased in the presence of H‐β‐CD in a concentration‐dependent manner in the MDCK assay. At the molar ratio of H‐β‐CD (8 g) to fenebrutinib (100 mg) estimated in the DDI study (46:1) in which itraconazole solution was administered, an ~ 15‐fold decrease in fenebrutinib Papp was observed, relative to that without H‐β‐CD. Results from a dog PK study indicated that upon co‐administration, the apparent rate and extent of fenebrutinib absorption were substantially decreased in the presence of H‐β‐CD (manuscript in preparation).
Fenebrutinib PBPK model
The final fenebrutinib PBPK model parameters are shown in Table 1 . A scalar of tissue plasma partition coefficient (Kp) of 0.3 was applied to match the predicted V ss with the observed value estimated based on phase I PK data (V ss/F ~ 13.4 L/kg). Total clearance estimated from phase I PK data (CL/F ~ 80 L/hour) was assigned to hepatic (~ 95%) and renal clearance (~ 5%) in the model describing fenebrutinib elimination. This initial assumption of hepatic metabolism playing a predominant role in fenebrutinib elimination was confirmed later by human mass balance study results. The hepatic clearance was further assigned to CYP3A pathway with the input of intrinsic CYP3A clearance (CLint‐CYP3A) that will result in a f m,CYP3A of 50−90% of CL (Table 1 ). Figure 2 shows the observed and simulated mean plasma concentration‐time profiles of fenebrutinib (200 mg tablet) in the fasted and fed states. The ADAM model described the observed PK after oral administration; and the mini‐PBPK distribution model captured the multi‐exponential disposition PK profile of fenebrutinib.
Figure 2.
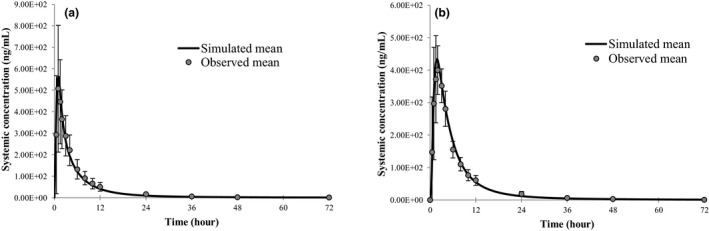
Observed and simulated plasma concentration‐time profiles of fenebrutinib after oral administration of fenebrutinib. (a) Administered 200 mg tablet under fasted and (b) 200 mg under fed state in healthy subjects.
Prediction of fenebrutinib DDI
For fenebrutinib as victim, the prospective simulation predicted increases in both Cmax and AUC of fenebrutinib when co‐administered with itraconazole. In the range of assumed f m,CYP3A from 0.5–0.9 (unknown in the prospective DDI simulation), the fenebrutinib AUC was predicted to increase by 2.2 to 9.3‐fold and Cmax by 1.6 to 2.8‐fold, and no change in Tmax, in the presence of itraconazole. However, in the clinical DDI study, multiple doses of 200 mg itraconazole solution (once daily × 8 days) resulted in an increase in fenebrutinib AUC0‐t (AUC over the dosing interval, 2.28‐fold) and, unexpectedly, a decrease in Cmax (~ 11%) and a delay in Tmax (Figure S1 ).
To predict DDI in which fenebrutinib is a CYP3A time‐dependent inhibitor, the in vitro K I (7.9 µM), K inact (0.684 hour−1), and f u,mic (unbound fraction in microsomal incubation, 0.97 to correct K I) were entered into the fenebrutinib model. Table 2 showed the comparisons of predicted vs. observed DDI between fenebrutinib and midazolam, and fenebrutinib and simvastatin. In the clinical DDI study, multiple doses of fenebrutinib affected the PK of midazolam and simvastatin, with a Cmax and AUC ratios of 1.74 and 1.99 for midazolam, respectively, and 1.93 and 2.48 for simvastatin, respectively. 3 The predicted DDI is within 1.5‐fold of the observed data for both midazolam and simvastatin, with a trend of underprediction. The f u,mic (0.97) used in prospective simulation was predicted 7 because there were no experimental data available. Retrospectively, when the f u,mic value adjusted from 0.97 to 0.5, the model simulations could more closely capture the observed DDI for both midazolam and simvastatin (Table 2 ).
Table 2.
Predicted vs. observed DDI for fenebrutinib as a CYP3A enzyme and OATP1B and BCRP transporter inhibitor
| Prospective simulation | Retrospective simulation | Observed | ||||
|---|---|---|---|---|---|---|
| CmaxR | AUCR | CmaxR | AUCR | CmaxR | AUCR | |
| Fenebrutinib as CYP3A TDI | ||||||
| 200 mg b.i.d. × 8 days, midazolam (2 mg) on day 7 | 1.28 (1.25–1.31) | 1.57 (1.48–1.66) | 1.49 (1.44–1.54) | 2.18 (1.97–2.42) | 1.74 (1.58–1.91) | 1.99 (1.80–2.22) |
| 200 mg b.i.d. × 8 days, simvastatin (40 mg) on day 7 | 1.59 (1.53–1.65) | 1.78 (1.68–1.88) | 2.17 (2.03–2.31) | 2.68 (2.43–2.97) | 1.93 (1.63–2.28) | 2.48 (2.01–3.07) |
| Fenebrutinib as OATP1B1/3 and BCRP inhibitor | ||||||
| 200 mg b.i.d. × 10 days, rosuvastatin on day 7 | 1.95 (1.85–2.06) | 1.10 (1.10–1.11) | 5.08 (4.84–5.34) | 1.63 (1.58–1.68) | 4.99 (3.90–6.40) | 2.66 (2.37–2.98) |
| 200 mg b.i.d. × 10 days, rosuvastatin on day 7 (scenario simulation‐no BCRP inhibition) | 1.56 (1.50–1.62) | 1.36 (1.32–1.40) | ||||
AUCR, area under the curve ratio (geometric mean, 90% confidence interval); CmaxR, maximum plasma concentration ratio (geometric mean, 90% confidence interval); DDI, drug‐drug interaction; TDI, time‐dependent inhibitor.
To predict transporter DDI, the fenebrutinib transporter inhibition K i,u values (BCRP = 0.926 µM, OATP1B1 = 1.94 µM, and OATP1B3 = 0.704 µM) were entered into the PBPK model under gut and liver transporter interaction. The inhibition K i,u was estimated using in vitro measured IC50/2 and then corrected by f u,p (unbound fraction in plasma) because no measured value of unbound fraction in transporter incubation (f u,inc) is available. Table 2 showed the comparisons of predicted vs. observed DDI between fenebrutinib and rosuvastatin. In the clinical DDI study, multiple doses of fenebrutinib (200 mg twice daily dose for 10 days) affected the PK of rosuvastatin, with Cmax and AUC0–t increasing by ~ 5‐fold and 2.6‐fold, respectively. 3 While the prospective DDI simulation captured the trend in the observed DDI data, increase in Cmax was about twice that of AUC, the absolute magnitude of the DDI was underpredicted by ~ 2‐fold.
Retrospective PBPK analysis for mechanistic understanding of complex DDI
Itraconazole–fenebrutinib DDI
To understand the unexpected decrease in fenebrutinib Cmax in the presence of itraconazole, the effect of complexation between fenebrutinib and H‐β‐CD on the absorption of fenebrutinib was considered. Data from the in vitro permeability experiment and an in vivo dog PK study supported the hypothesis that, in the presence of H‐β‐CD, formation of fenebrutinib‐H‐β‐CD complex could result in less amount of free fenebrutinib available permeating the intestinal membrane, and subsequently decreasing the absorption in the upper gastrointestinal (GI) tract. 8
Therefore, to retrospectively simulate the DDI between fenebrutinib and itraconazole in the presence of H‐β‐CD, two absorption models were used: model 1 to simulate fenebrutinib PK dose alone (without H‐β‐CD effect) and model 2 to simulate fenebrutinib co‐administered with itraconazole (with H‐β‐CD effect). Model 1 has the ADAM absorption model with a lumped Peff predicted from MDCK permeability data (previously described in the Methods section), whereas model 2 has the ADAM absorption model with GI regional Peff predicted from mechanistic permeability module (MechPeff), and the regional Peff at the upper GI tract (duodenum, jejunum I, and jejunum II) was manually reduced to mimic the effect of H‐β‐CD–fenebrutinib complexation on fenebrutinib absorption. All other model parameters are the same between two models (Table 1 ).
The simulated DDI with and without H‐β‐CD effect showed that the increase in fenebrutinib Cmax caused by itraconazole CYP3A inhibition can be offset by the reduced absorption of fenebrutinib due to H‐β‐CD—fenebrutinib complexation (Figure 3 a,c). The observed net changes to fenebrutinib Cmax (11% decrease) and AUC (~ 2.3‐fold increase) in the presence of itraconazole depend on both the extent of H‐β‐CD effect on fenebrutinib absorption and the magnitude of itraconazole CYP3A inhibition in the gut and liver for fenebrutinib, and the extent of latter is determined by the contribution of CYP3A (f m,CYP3A) in fenebrutinib clearance. Therefore, the sensitivity analysis on f m,CYP3A values (0.5–0.95) in the presence and absence of itraconazole, with and without consideration of the H‐β‐CD effect was performed. As shown in Table 3 , without considering the H‐β‐CD effect, none of the DDI simulations with fenebrutinib f m,CYP3A ranging from 0.5–0.95 was able to capture both the observed Cmax and AUC changes correctly. If the H‐β‐CD effect was not accounted for, at f m,CYP3A 0.5–0.6, the model simulation could capture the observed AUC ratio (AUCR) but overpredicted the Cmax ratio (CmaxR). On the other hand, simulations with consideration of H‐β‐CD effect was able to capture both Cmax and AUC changes at a fenebrutinib f m,CYP3A value of 0.8–0.85 (Table 3 , Figure 3 ). Furthermore, a sensitivity analysis of the extent of H‐β‐CD effect with regard to the fenebrutinib f m,CYP3A value and the CmaxR and AUCR in the presence of itraconazole was conducted. In a range of Peff reduction (caused by H‐β‐CD effect) from 0–100‐fold at a given f m,CYP3A4 ranging from 0.5–0.95, the observed CmaxR and AUCR were both closely captured only at the f m,CYP3A of ~ 0.8–0.85 (Figure 4 ).
Figure 3.
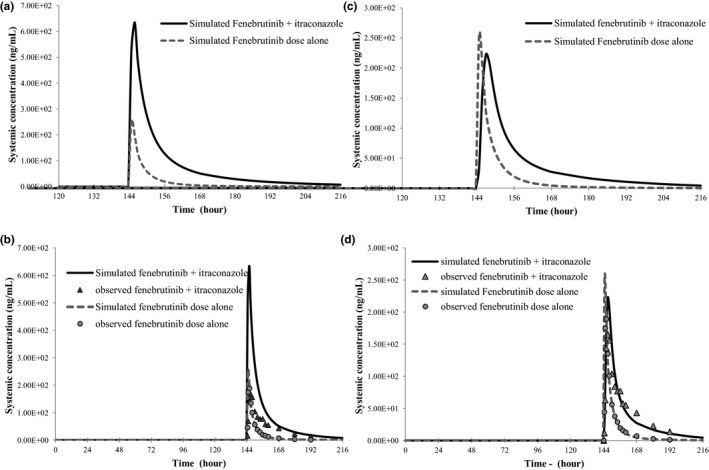
Observed and simulated fenebrutinib (100 mg tablet, on day 7) pharmacokinetics in the presence and absence of CYP3A inhibitor itraconazole (200 mg solution, q.d. × 8 day). (a, b) No consideration of H‐β‐CD effect; (c, d) with consideration of H‐β‐CD effect.
Table 3.
Simulated fenebrutinib CmaxR and AUCR in the presence and absence of itraconazole and with and without consideration of H‐β‐CD effect
| Fenebrutinib f m,CYP3A | Without H‐β‐CD effect | With H‐β‐CD effect | ||
|---|---|---|---|---|
| CmaxR | AUC(0‐T)R | CmaxR | AUC(0‐T)R | |
| 0.5 | 1.57 | 2.06 | ||
| 0.6 | 1.82 | 2.72 | 0.62 | 1.25 |
| 0.75 | 2.19 | 4.10 | 0.79 | 1.80 |
| 0.8 | 2.36 | 4.90 | 0.88 | 2.12 |
| 0.85 | 2.51 | 5.65 | 0.95 | 2.45 |
| 0.95 | 3.22 | 11.4 | 1.03 | 3.36 |
| Observed | 0.89 | 2.28 | 0.89 | 2.28 |
CmaxR, maximum plasma concentration ratio (geometric mean); AUCR, area under the curve ratio (geometric mean)
Figure 4.
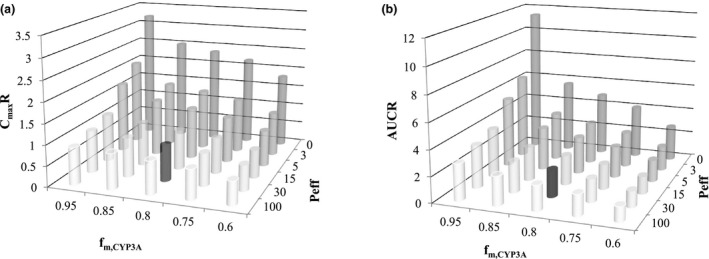
Sensitivity analysis of f m,CYP3A and the extent of H‐β‐CD complexation effect with regard to CmaxR (a) (AUCR (b) for fenebrutinib in the presence and absence of itraconazole.
Finally, the f m,CYP3A 0.8–0.85 determined from PBPK simulation of the observed DDI with consideration of H‐β‐CD effect was further confirmed using other clinical data. Based on the human mass balance study (data available post‐DDI study), fenebrutinib is eliminated predominantly (> 90%) through metabolic pathway with oxidative related metabolites accounting for ~ 80% of CL. In vitro phenotyping study revealed that CYP3A enzyme is predominantly responsible for oxidative metabolite formation. In addition, because fenebrutinib is a CYP3A substrate as well as a time‐dependent CYP3A inhibitor, some degree of auto‐inhibition (and subsequent accumulation) could occur after multiple doses of fenebrutinib (based on PK terminal half‐life at steady‐state, accumulation is not expected). 2 As demonstrated by the PBPK simulations (Figure S2 ) as compared with the clinical PK data (200 mg b.i.d. ×10 days), the observed accumulation of fenebrutinib can be closely captured by the model at fenebrutinib fm,CYP3A4 value of 0.8–0.85.
Fenebrutinib – rosuvastatin DDI
Retrospective analyses were conducted to understand the impact of K i,u on the predicted DDI. Although the trend of the observed DDI (i.e., CmaxR > AUCR) was captured in the prospective model simulation, the magnitude of DDI was underpredicted by ~ 2‐fold. In the prospective simulation of fenebrutinib transporter DDI, the K i,u for both BCRP and OATP1B1/3 were calculated using f u,inc = f u,p (0.197) because there is no experimentally measured f u,inc value available. Retrospectively, the sensitivity analysis indicated that when the K i,u values for BCRP and OATP1B are ~ 15× lower than that used in the prospective model, or a lumped scaling factor of 0.014 was applied, the simulated DDI can more accurately capture the observed data (Table 2 ). The trend of underprediction of AUC in the retrospective analysis is more likely associated with the rosuvastatin model (Supplementary Material).
Underprediction of transporter inhibition DDI has been reported. The discrepancy between in vitro and in vivo K i,u is believed to be mainly due to the uncertainties associated with the in vitro system and assay conditions, and translation of inhibition potency from in vitro to in vivo 9 , 10 ; and a scaling factor (> 10) is often used. Our observation in the current work is consistent with the findings reported by others, a much lower in vivo K i,u value needs to be used to recover the clinically observed DDI. Continued effort to understand the discrepancy between in vitro and in vivo is needed.
To further confirm the relative contribution of fenebrutinib OATP1B vs. BCRP inhibition to the total observed DDI, the PBPK model simulation in combination with the endogenous biomarker measurement was implemented. The scenario simulations were conducted by turning off the BCRP inhibition in the DDI panel. The results indicated that without BCRP inhibition by fenebrutinib, rosuvastatin Cmax and AUC would only increase by ~ 1.6 and 1.4‐fold, respectively, when co‐administered with fenebrutinib. The decrease in the rosuvastatin Cmax ratio (from 5‐fold to < 2‐fold) is much more pronounced than the corresponding decrease in the rosuvastatin AUC, indicating that the main contributor to the observed DDI with rosuvastatin is gut BCRP inhibition by fenebrutinib. Furthermore, the limited involvement of OATP1B inhibition in the observed clinical DDI was confirmed by the measured level of coproporphyrin I (CP‐I) and CP‐III, endogenous substrates of OATP1B transporters but not the BCRP transporter, in the presence and absence of fenebrutinib. The effect of multiple doses of fenebrutinib on the plasma concentration‐time profiles of CP‐I and CP‐III was comparable following co‐administration of rosuvastatin and fenebrutinib, compared with rosuvastatin alone. 3 These results indicate that the main mechanism of the observed fenebrutinib‐rosuvastatin DDI was the inhibition of intestinal BCRP, rather than OATP1B, by fenebrutinib.
DISCUSSION
To characterize fenebrutinib DDI potential and recommend concomitant medication strategy, a PBPK model‐informed drug development strategy was implemented. An integrated approach using PBPK simulations and endogenous biomarker measurements enabled a better mechanistic understanding of fenebrutinib‐rosuvastatin clinical DDI involving multiple transporters. The hypothesis‐driven analysis using a mechanistic absorption PBPK model supported by in vitro and nonclinical in vivo data provided a sound rationale for the observed DDI between fenebrutinib and itraconazole with and without accounting for the effect of H‐β‐CD–fenebrutinib complexation. The deconvolution of the observed DDI data using mechanistic PBPK modeling, together with other clinical and nonclinical data, allowed confirmation of relative contribution of transporter inhibition by fenebrutinib as well as determination of f m,CYP3A in fenebrutinib clearance, without requiring additional clinical DDI studies.
Available data from nonclinical and clinical studies support that CYP3A is a major enzyme responsible for hepatic clearance, and the metabolic pathway accounting for > 90% of fenebrutinib elimination. Therefore, the observed DDI for fenebrutinib in the presence of strong CYP3A inhibitor itraconazole, specifically the absence of an increase in fenebrutinib Cmax (observed in 12 of 14 subjects in the clinical study) could not be explained without considering other mechanisms that could reduce fenebrutinib exposure in the presence of itraconazole. Various hypotheses have been considered and tested via PBPK modeling to attempt to explain the observed Cmax decrease, including fenebrutinib CYP3A gut metabolism, fenebrutinib interacting concentration in the gut, itraconazole and hydroxy‐itraconazole concentrations in the DDI study, and inhibition of P‐gp by itraconazole. The outcome of these evaluations showed that none of these hypothesis‐driven PBPK simulations could explain the observed DDI data in which fenebrutinib Cmax decreased and AUC increased in the presence of itraconazole. For example, the exposure of itraconazole and hydroxy‐itraconazole measured in the DDI study was consistent with published data, 11 , 12 and the concentration‐time profiles of both itraconazole and hydroxy‐itraconazole PK (including accumulation after multiple doses) were well‐captured by the PBPK model in the DDI simulation (Figure S3 ). In addition, inhibition of P‐gp by itraconazole would only increase the Cmax of fenebrutinib (a less sensitive P‐gp substrate), rather than decrease it.
Previous works indicated that while cyclodextrin is used as an excipient to increase solubility of a drug, it can also decrease the concentration of free drug available to permeate the intestinal membrane, due to the formation of complex between a drug and cyclodextrin. 13 , 14 , 15 Further, high concentrations of cyclodextrin can reduce a drug’s apparent permeability and in situ rat jejunal effective permeability, leading to longer Tmax and reduced Cmax, thus resulting in decreased bioavailability in rats. 8 In the fenebrutinib DDI study with itraconazole, fenebrutinib was exposed to H‐β‐CD introduced from the itraconazole solution (~ 8 g of H‐β‐CD/dose of itraconazole). The in vitro study confirmed the strong molecular complexation between fenebrutinib and H‐β‐CD (evidenced by a high complex constant, Kcomplex) and reduced apparent permeability, and an in vivo dog PK showed decreased rate and extent of fenebrutinib absorption when co‐administered with H‐β‐CD. These observations are consistent with existing knowledge, and support our approach of incorporating the hypothesis into PBPK model to explain the observed DDI between itraconazole and fenebrutinib.
To further quantitatively describe the H‐β‐CD effect on fenebrutinib PK, we explored the recently developed Simcyp’s cyclodextrin binding model (version 18.2) that correlates the reduction of Peff (predicted by MechPeff model) with a decreased unbound fraction of a drug in the presence of cyclodextrin along the GI tract. With the input parameters of high Kcomplex (2.7 × 10⁴ M−1) for fenebrutinib with H‐β‐CD (estimated from in vitro experiment) and the amount of H‐β‐CD (8 g) administered (with itraconazole solution in the DDI study), fenebrutinib PK in the presence of H‐β‐CD was simulated using the cyclodextrin binding model that mechanistically accounted for the H‐β‐CD effect on Peff. Figure S4 shows that a decrease in fenebrutinib absorption (by ~ 48%) was predicted, with decreases in Cmax and AUC by ~ 3.5‐fold and 2.0‐fold, respectively, and a delay in Tmax by ~ 1 hour, which is comparable to the simulated H‐β‐CD effect on fenebrutinib PK using the MechPeff model with manually reduced Peff (model 2). Unfortunately, to simulate the effect of H‐β‐CD on fenebrutinib PK using cyclodextrin binding model, cyclodextrin needs to be in the inhibitor position, therefore, the simulation of itraconazole–fenebrutinib DDI cannot be conducted at the same time (because itraconazole and OH‐itraconazole both need to be in inhibitor positions). To inform parameterization of H‐β‐CD effect for future predictions of other drugs, it will be more effective to simulate the dynamic interaction among substrate, itraconazole, and H‐β‐CD using a further developed model.
The f m,CYP3A estimate is a key parameter that enables the use of the fenebrutinib PBPK model for DDI prediction with other CYP3A inhibitors and inducers. All available nonclinical and clinical data were used in support of f m,CYP3A determination and verification, including: (i) retrospective PBPK simulation of the observed DDI between fenebrutinib and itraconazole, including sensitivity analyses; (ii) human mass balance study results confirming the major clearance pathway by metabolism (f m > 90%); (iii) in vitro phenotyping data indicating CYP3A as the primary metabolizing enzyme for fenebrutinib; and (iv) multiple‐dose fenebrutinib PK data with accumulation caused by auto‐inhibition of CYP3A, which is captured well by PBPK simulation at the estimated f m,CYP3A. The totality of evidence supports the classification of fenebrutinib as a sensitive CYP3A substrate, and the results of the integrated analyses suggest that fenebrutinib has an f m,CYP3A value ≥ 0.8. The consistency of the data analysis provided confidence that the current PBPK model can be used to predict DDIs between fenebrutinib and other CYP3A perpetrators.
From a clinical risk perspective, the estimate of f m,CYP3A 0.8–0.85 likely represents the worst case DDI scenario for fenebrutinib when co‐administered with a strong CYP3A inhibitor, such as itraconazole (CmaxR ~ 2.4 and AUCR ~ 5.0). The exclusion of strong CYP3A perpetrators would likely be recommended if warranted by the therapeutic window of fenebrutinib, regardless of whether fenebrutinib is considered a sensitive or a moderately sensitive CYP3A substrate (e.g., f m,CYP3A 0.6 or 0.8–0.85). However, in the presence of moderate CYP3A inhibitors, dose adjustment (if needed) could be similar under these two scenarios (i.e., f m,CYP3A 0.6 or 0.8), because the difference in the magnitude of DDI with moderate inhibitors is much less pronounced (Table S3 ).
In conclusion, the results from our combined approach confirmed that the observed clinical DDI between fenebrutinib and rosuvastatin is primarily due to the inhibition of intestinal BCRP rather than hepatic OATP1B, which supports the proposal to use the PBPK prediction with endogenous biomarker measurements to inform recommendations around the concomitant use of fenebrutinib with other OATP1B substrates. Mechanistic PBPK modeling based on sound scientific rationale explained the clinically observed DDI between fenebrutinib and itraconazole. The totality of the evidence from PBPK sensitivity analysis and nonclinical and clinical data indicated that fenebrutinib is likely a sensitive CYP3A substrate. The consistency of the model‐based analyses and the accumulated in vitro and in vivo data qualifies the PBPK model for subsequent predictions of untested scenarios for DDI between fenebrutinib and other CYP3A inhibitors and inducers.
Funding
No funding was received for this work.
Conflict of Interest
All authors declared no competing interests for this work.
Author Contributions
Y.C., F.M., N.J., K.Y., T.C., M.D., M.W., J.Y.J., and L.C. wrote the manuscript. Y.C., F.M., and L.C. designed the research. Y.C., F.M., N.J., T.C., M.D., and L.C. performed the research. Y.C., F.M., N.J., K.Y., T.C., M.D., and L.C. analyzed the data.
Supporting information
Figure S1
Figure S2
Figure S3
Figure S4
Supplementary Material
Supplementary Material
Supplementary Material
Supplementary Material
Supplementary Material
Supplementary Material
Acknowledgments
The authors thank Christine Bowman, Lin Pan, and Marcel Hop for sharing their knowledge and contributions to the valuable discussion.
References
- 1. Crawford, J.J. et al Discovery of GDC‐0853: a potent, selective, and noncovalent Bruton's tyrosine kinase inhibitor in early clinical development. J. Med. Chem. 61, 2227–2245 (2018). [DOI] [PubMed] [Google Scholar]
- 2. Herman, A.E. et al Safety, pharmacokinetics, and pharmacodynamics in healthy volunteers treated with GDC‐0853, a selective reversible Bruton's tyrosine kinase inhibitor. Clin. Pharmacol. Ther. 103, 1020–1028 (2018). [DOI] [PubMed] [Google Scholar]
- 3. Jones, N.S. et al Complex DDI by fenebrutinib and the use of transporter endogenous biomarkers to elucidate the mechanism of DDI. Clin. Pharmacol. Ther. 107, 269–277 (2020). [DOI] [PMC free article] [PubMed] [Google Scholar]
- 4. Rodgers, T. & Rowland, M. Physiologically based pharmacokinetic modelling 2: predicting the tissue distribution of acids, very weak bases, neutrals and zwitterions. J. Pharm. Sci. 95, 1238–1257 (2006). [DOI] [PubMed] [Google Scholar]
- 5. Rowland Yeo, K. , Jamei, M. , Yang, J. , Tucker, G.T. & Rostami‐Hodjegan, A. Physiologically based mechanistic modelling to predict complex drug‐drug interactions involving simultaneous competitive and time‐dependent enzyme inhibition by parent compound and its metabolite in both liver and gut ‐ the effect of diltiazem on the time‐course of exposure to triazolam. Eur. J. Pharm. Sci. 39, 298–309 (2010). [DOI] [PubMed] [Google Scholar]
- 6. Chen, Y. et al Development of a physiologically based pharmacokinetic model for itraconazole pharmacokinetics and drug‐drug interaction prediction. Clin. Pharmacokinet. 55, 735–749 (2016). [DOI] [PubMed] [Google Scholar]
- 7. Austin, R.P. , Barton, P. , Cockroft, S.L. , Wenlock, M.C. & Riley, R.J. The influence of nonspecific microsomal binding on apparent intrinsic clearance, and its prediction from physicochemical properties. Drug Metab. Dispos. 30, 1497–1503 (2002). [DOI] [PubMed] [Google Scholar]
- 8. Dahan, A. , Miller, J.M. , Hoffman, A. , Amidon, G.E. & Amidon, G.L. The solubility‐permeability interplay in using cyclodextrins as pharmaceutical solubilizers: mechanistic modeling and application to progesterone. J. Pharm. Sci. 99, 2739–2749 (2010). [DOI] [PubMed] [Google Scholar]
- 9. Duan, P. , Zhao, P. & Zhang, L. Physiologically based pharmacokinetic (PBPK) modeling of pitavastatin and atorvastatin to predict drug‐drug interactions (DDIs). Eur. J. Drug Metab. Pharmacokinet. 42, 689–705 (2017). [DOI] [PubMed] [Google Scholar]
- 10. Taskar, K. et al PBPK models for evaluating membrane transporter mediated DDIs: Current capabilities, case studies, future opportunities and recommendations. Clin. Pharmacol. Ther. 107, 1082–1115 (2019). [DOI] [PMC free article] [PubMed] [Google Scholar]
- 11. Barone, J.A. et al Enhanced bioavailability of itraconazole in hydroxypropyl‐beta‐cyclodextrin solution versus capsules in healthy volunteers. Antimicrob. Agents Chemother. 42, 1862–1865 (1998). [DOI] [PMC free article] [PubMed] [Google Scholar]
- 12. Barone, J.A. et al Food interaction and steady‐state pharmacokinetics of itraconazole oral solution in healthy volunteers. Pharmacotherapy 18, 295–301 (1998). [PubMed] [Google Scholar]
- 13. Rao, V.M. & Stella, V.J. When can cyclodextrins be considered for solubilization purposes? J. Pharm. Sci. 92, 927–932 (2003). [DOI] [PubMed] [Google Scholar]
- 14. Loftsson, T. , Jarho, P. , Masson, M. & Jarvinen, T. Cyclodextrins in drug delivery. Expert Opin. Drug Deliv. 2, 335–351 (2005). [DOI] [PubMed] [Google Scholar]
- 15. Loftsson, T. , Vogensen, S.B. , Brewster, M.E. & Konradsdottir, F. Effects of cyclodextrins on drug delivery through biological membranes. J. Pharm. Sci. 96, 2532–2546 (2007). [DOI] [PubMed] [Google Scholar]
Associated Data
This section collects any data citations, data availability statements, or supplementary materials included in this article.
Supplementary Materials
Figure S1
Figure S2
Figure S3
Figure S4
Supplementary Material
Supplementary Material
Supplementary Material
Supplementary Material
Supplementary Material
Supplementary Material