

Abstract
Creatinine is the most common clinical biomarker of renal function. As a substrate for renal transporters, its secretion is susceptible to inhibition by drugs, resulting in transient increase in serum creatinine and false impression of damage to kidney. Novel physiologically based models for creatinine were developed here and (dis)qualified in a stepwise manner until consistency with clinical data. Data from a matrix of studies were integrated, including systems data (common to all models), proteomics‐informed in vitro–in vivo extrapolation of all relevant transporter clearances, exogenous administration of creatinine (to estimate endogenous synthesis rate), and inhibition of different renal transporters (11 perpetrator drugs considered for qualification during creatinine model development and verification on independent data sets). The proteomics‐informed bottom‐up approach resulted in the underprediction of creatinine renal secretion. Subsequently, creatinine‐trimethoprim clinical data were used to inform key model parameters in a reverse translation manner, highlighting best practices and challenges for middle‐out optimization of mechanistic models.
Study Highlights.
WHAT IS THE CURRENT KNOWLEDGE ON THE TOPIC?
☑ Administration of certain drugs can cause inhibition of renal transporters, leading to transient elevated serum creatinine in the absence of declining renal function. Candidate transporters for mediating such effects have been proposed. However, a unique mechanistic model for creatinine clearance with ability to predict all interactions is currently lacking.
WHAT QUESTION DID THIS STUDY ADDRESS?
☑ Can a mechanistic creatinine model predict its renal disposition and transporter interactions?
WHAT DOES THIS STUDY ADD TO OUR KNOWLEDGE?
☑ Quantitative translation of in vitro data generated in transporter‐transfected cell lines, accounting for transporter protein abundance differences between systems, led to the underprediction of creatinine secretion using the novel mechanistic creatinine model. Parameters were subsequently informed by reverse translation using clinical data; existing knowledge gaps in creatinine renal disposition have been identified.
HOW MIGHT THIS CHANGE DRUG DISCOVERY, DEVELOPMENT, AND/OR THERAPEUTICS?
☑ A novel mechanistic kidney model for creatinine, describing roles of transporters and passive permeability, was developed. The process outlined here provides a framework for the further refinement of a creatinine physiologically based model involving complex transporter interactions and their interplay.
Creatinine is an endogenous metabolite and substrate for multiple transporters expressed in the proximal tubule cells of the kidney. 1 Creatinine plasma concentration can be transiently elevated through transporter inhibition by particular drugs and raise concerns in clinical practice and drug development if misinterpreted as a decline in actual renal function, e.g., drug‐induced kidney injury. 2 Although roles for specific transporters have been elucidated at a qualitative level, quantitative understanding of the contribution of individual transporters to creatinine renal disposition is still incomplete. As such, attempts at in vitro–in vivo extrapolation (IVIVE)–based prediction of creatinine–drug interactions had limited success 2 , 3 , 4 , 5 despite extending our knowledge on this matter.
Physiologically‐based pharmacokinetic (PBPK) modeling is a useful approach to simulate pharmacokinetics in untested scenarios. 6 , 7 In particular, PBPK modeling is increasingly used to inform drug labeling on drug–drug interactions mediated by cytochrome P450 enzymes. 8 However, confidence in PBPK predictions of transporter‐mediated disposition/drug–drug interactions, 9 , 10 particularly kidney related, is not as high, in part because of the deficiencies of IVIVE methodology. 11 , 12 , 13 Further work is therefore needed to improve availability of protein abundance data and account for the rate‐determining steps in transporter disposition. 13 , 14 , 15 , 16 Both “top‐down” and “middle‐out” approaches, in which clinical data are used to inform some model parameters, are applied to refine PBPK models when IVIVE is not feasible or performs poorly. 9 , 17 , 18 , 19 A potential limitation is that conventional plasma concentration‐time data may not always provide sufficient information to distinguish effects of particular transporters. 13 , 20
The current study aimed to develop a physiologically based kidney model for creatinine, accounting for multiple processes occurring in the proximal tubule. Multiple transporters involved in creatinine renal elimination were considered in the model, assuming either unidirectional or bidirectional transport via organic cation transporter 2 (OCT2; driven by electrochemical gradient). The present article focuses on the stepwise development of the mechanistic creatinine model, including the exploration of model variants, and the parameterization of models using bottom‐up and middle‐out approaches. Challenges related to the identifiability of parameters and multiobjective optimization are highlighted. Furthermore, pharmacokinetic models describing plasma concentration‐time profiles of 11 drugs inhibiting renal transporters relevant for creatinine renal elimination are included. A companion article evaluates the performance of the developed creatinine models in predicting elevated serum creatinine concentration (SCr) resulting from renal transporter inhibition and highlights the current status in the understanding of creatinine renal disposition. 21
METHODS
Clinical data collection
The SCr time data, drug plasma concentration‐time data, and fraction unbound in plasma (f u,p) data for 11 selected transporter inhibitor drugs were collated from the literature and US Food and Drug Administration Clinical Pharmacology and Biopharmaceutics Review documents for approved drugs (www.fda.gov/drugsatfda). In cases where precise sampling time information was missing, it was assumed that samples for creatinine measurements were taken 2 hours after drug administration. Where necessary, graphical data were extracted using the GetData Graph‐Digitizer version 2.26.0.20 (http://getdata‐graph‐digitizer.com/). Only data obtained for subjects with normal baseline renal function were collated, as evaluated by measured or estimated 22 , 23 glomerular filtration rate or creatinine renal excretory clearance (CLR) >80 mL/minute. The cut‐off of > 80 mL/minute, rather than the currently used > 90 mL/minute threshold, enabled inclusion of studies using the former. 24 The percent of changes in SCr in clinical studies were calculated using measurements taken before drug administration as baseline values.
Development of mechanistic creatinine models
The creatinine models were developed in a stepwise manner (Figure 1 ), beginning with a one‐compartment turnover model to evaluate the synthesis rate. The model was expanded to describe the processes involved in creatinine renal disposition mechanistically, which was not considered in previous modeling studies. 3 , 4 Two alternative model structures were initially evaluated, one assuming that OCT2 acts as an uptake only transporter, and the other model considered OCT2 as a bidirectional transporter (details provided in “Structure of physiologically based kidney models for creatinine”, below). In addition to OCT2, organic anion transporter 2 (OAT2), multidrug and toxin extrusion transporter 1 (MATE1) and multidrug and toxin extrusion transporter 1 (MATE2‐K) were incorporated in the model.
Figure 1.
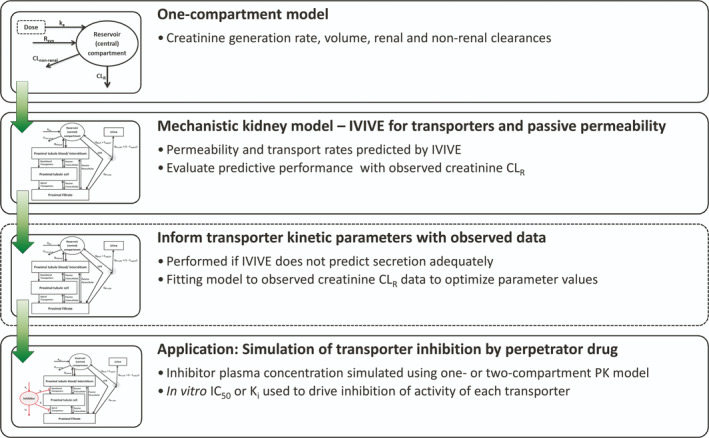
Workflow of the development of a mechanistic kidney model for creatinine. Prior to implementation of the mechanistic model, a one‐compartment model was used to evaluate systemic (plasma) parameters, including creatinine endogenous generation rate and volume of distribution, using creatinine kinetics data following administration of exogenous creatinine. The mechanistic kidney model was initially developed using in vitro–in vivo extrapolation (IVIVE) to inform parameters such as transporter intrinsic clearances and apparent permeability. Two variant models were developed that assumed the organic cation transporter 2 (OCT2) acted either as an uptake transporter, or as a bidirectional transporter. To recover the observed creatinine renal excretion clearance (CLR), the transporter intrinsic clearance parameters needed refining using the clinical data as a result of the underprediction by IVIVE. For prediction of creatinine–drug interactions, changes in creatinine transporter activity were driven by the half maximal inhibitory concentration (IC50) or inhibitory constant (K i) and plasma concentration of the perpetrator. Plasma concentrations of perpetrators were simulated using one‐compartment or two‐compartment pharmacokinetic (PK) models. CL, clearance; CLnon‐renal, non renal clearance; Freab,DT, fraction reabsorbed in distal tubule; GFR, glomerular filtration rate; ka, absorption rate constant; QPT,blood, blood flow to proximal tubule; QPT‐U,filt, filtrate flow rate from proximal tubule; Rsyn, synthesis rate.
Initial parameter verification using one‐compartment turnover model
The one‐compartment turnover model was expanded to describe first‐order absorption following the exogenous oral administration of creatinine (Eqs. 1 and 2). Parameter values are in Table S1 and were verified by comparison with creatinine concentration‐time profile data following the oral administration of creatinine tablets or a cooked meat meal. Complete bioavailability was assumed. Simulations were performed for a nominal duration (96 hours) to ensure steady‐state SCr in simulation before administration of exogenous creatinine.
| (1) |
| (2) |
Parameter descriptions are listed in Table 1 . Creatinine CLR for subjects with normal renal function was calculated as the sum of glomerular filtration rate (7.5 L/hour) and net creatinine tubular secretion (0.7 L/hour) for this population. 25 , 26
Table 1.
Fixed parameters in mechanistic kidney model for creatinine a
| Parameter | Description | Units | Value | Comment |
|---|---|---|---|---|
| V 2 | Volume of distribution of central (reservoir) compartment | L | 43.5 | |
| V 3 | Proximal tubule blood and interstitium water volume | L | 0.0818 | |
| V 4 | Proximal tubule intracellular water volume | L | 0.0661 | |
| V 5 | Proximal tubule filtrate/luminal volume | L | 0.0535 | |
| Q PT,blood | Blood flow rate to proximal tubule | L/hour | 58.45 | |
| GFR | Glomerular filtration rate | L/hour | 7.5 | — |
| Q PT‐U,filt | Filtrate flow rate exiting the proximal tubule | L/hour | 2.7 | |
| k a | Absorption rate constant | h−1 | 1 | Assumed value to recover rapid absorption |
| R syn | Endogenous creatinine synthesis rate | mg/hour | 70.8 | Representing synthesis (generation) from creatine |
| CLnonrenal | Nonrenal creatinine clearance | L/hour | 0.17 | Measured in kidney disease patients, assumed not to change with renal function |
| Z | Valence of cation | — | +1 | Monoprotic base |
| pKa | Creatinine pKa | — | 4.74 | See Supplemental Material, Section 3 |
| ΦPTC | Membrane potential | V | −0.07 | Across sinusoidal membrane of proximal tubule cells |
| F | Faraday’s constant | C/mol | 96,490 | — |
| R | Gas constant | J/mol/K | 8.314 | — |
| T | Absolute temperature | K | 310 | — |
| pHplasma | pH of blood plasma | — | 7.4 | — |
| pHPTC | pH of proximal tubule cell | — | 7.2 |
Structure of physiologically based kidney models for creatinine
The mechanistic kidney model for creatinine (Figure 2 ) aimed to integrate available physiological (system) information and describe the specific processes relevant to creatinine tubular secretion. The proximal tubule of the nephron was represented by compartments for (i) the blood/interstitium, (ii) epithelial cells, and (iii) tubular filtrate. Transporter activities were expressed as intrinsic clearance (CLint; L/hour), as were creatinine passive permeability by the transcellular (CLPD,trans; L/hour) and paracellular (CLPD,para; L/hour) routes.
Figure 2.
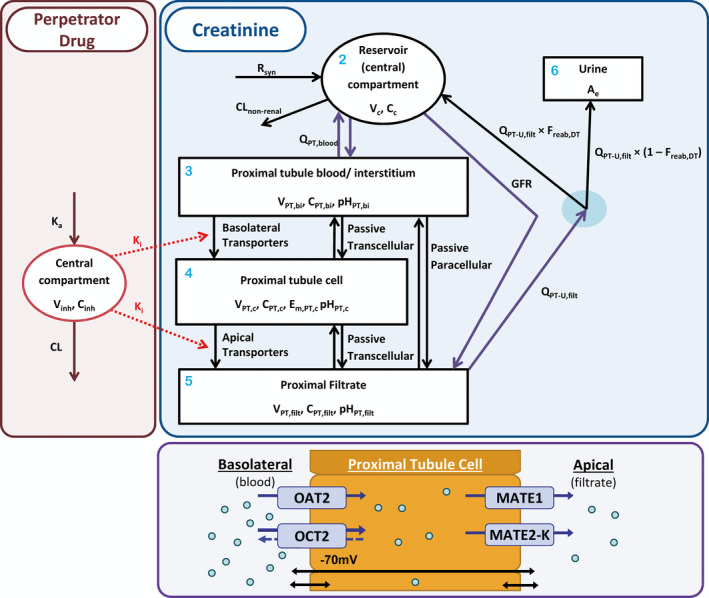
Compartmental structure of model used for simulation of creatinine–drug interactions. Blue shaded area presents schematic of creatinine mechanistic kidney model, with compartment numbers in light blue (see Eqs. (13), (14), (15), (16)). The concentration (C x (mg/L)) in each x th compartment is a model state, Vx representing the volume of each xth compartment, with the amount excreted in urine (Eq. 17; A e) also representing a state. The central (reservoir) compartment (Eq. 13; subscript c), which represents the blood plasma, receives the input function representing creatinine synthesis rate (R syn (mg/hour)) and orally absorbed dose (Eq. 12; not shown). Nonrenal clearance (CLnonrenal) represents a minor elimination route from the central compartment. The central compartment is linked with the proximal tubule blood/interstitium compartment (Eq. 14; subscript PT,bi) through the proximal tubule blood flow (QPT,blood (L/hour)) and to the proximal filtrate (Eq. 16; subscript PT, filt) via glomerular filtration rate (GFR (L/hour)). Filtrate flow out of the proximal filtrate is described with a flow rate parameter (Q PT‐U,filt (L/hour)). Passive permeability of creatinine in nonproximal nephron regions (loop of Henle, distal tubule, and collecting ducts) are described under assumption of first‐order reabsorption using “fraction reabsorbed in distal tubule” (F reab,DT) parameter. In proximal tubule cells (Eq. 15; subscript PT,c), the roles of passive permeability (transcellular and paracellular) and transporters expressed on the basolateral (organic anion transporter 2 (OAT2) and organic cation transporter 2 (OCT2)) and apical (multidrug and toxin extrusion protein (MATE) 1 and 2‐K) membranes are presented in the purple shaded area. OCT2 was modeled as either an uptake transporter or as a bidirectional transporter in variant creatinine models. As a bidirectional transporter, net flux by OCT2 is a function of the electro‐chemical gradient of creatinine and the membrane potential (E m,PT,c (70 mV)) (see Eqs. 9 and 11). The red shaded area shows a one‐compartment model used to simulate the plasma concentration of the perpetrator (inhibitor) drug (subscript inh), with oral absorption rate constant (k a) and elimination clearance (CL). The plasma concentration of perpetrator drug, along with its half maximal inhibitory concentration (IC50) or inhibitory constant (K i), is used to drive inhibition of transporter activity in the creatinine model (Eq. 23).
Fixed values were used for physiological model parameters based on literature data in healthy subjects (Table 1 ). CLPD,para and CLPD,trans were predicted from in vitro apparent permeability data (P app; cm/second × 10−6), as per Eqs. (3), (4), (5), (6). 27 Membrane permeability (P mem; cm/second × 10−6) was calculated from the P app after assuming resistance across the cell is sum of resistances across each membrane and that apical and basolateral membranes had equal permeability. P mem and paracellular permeability (Ppara) were scaled by proximal tubule surface area (SAPT; cm2) to calculate the respective CLPD.
| (3) |
| (4) |
| (5) |
| (6) |
where f Trans is the fraction of passive permeability occurring via the transcellular route.
Fraction reabsorbed in distal tubule regions (F reab,DT) was predicted using regional CLPD and midpoint filtrate flow rates. 28
OAT2 and OCT2 on basolateral membrane and MATE1 and MATE2‐K on apical membrane of proximal tubule cells were considered in the model. OAT2 localization on the apical membrane was not included in the model, as the existing evidence (immunohistochemistry data) was considered equivocal. For OAT2 (uptake) and MATE1 and MATE2‐K (efflux), unidirectional transport was implemented based on the understanding of their transport driving forces. In contrast, OCT2 was assumed to function either as an uptake transporter (“uptake OCT2” model) or as a bidirectional transporter (“bidirectional OCT2” model) using variant models. In the bidirectional OCT2 model, the net permeation rate was driven by the electrochemical gradient, assuming only transport of cationic species of creatinine by OCT2 (Eq. 7).
| (7) |
where f cation,x and pHx are the cationic fraction of creatinine and pH of the x th compartment, with subscript x indicating inside the cell (i) or outside the cell (o).
Mathematical description of the electrochemical gradient‐driven bidirectional transport by OCT2 was adapted from previous metformin reports; 16 , 29 details are provided in the Supplemental Material , Section 3 . The in vitro CLint data measured in OCT2 transfected human embryonic kidney (HEK)293 cells, defined here as apparent CLint (CLint,OCT2,app), were corrected for the impact of the membrane potential (Φ) to calculate an intermediate parameter, “CLint of OCT2 without effects of membrane potential” (CLint,OCT2,preMP) using Eq. 8 and 9. The in vitro data were assumed to be generated under sink conditions, and a membrane potential of −26 mV was used for the HEK293 cells.
| (8) |
| (9) |
where CLint,OCT2,preMP is the CLint of OCT2 without effects of membrane potential, and the subscript a refers to either HEK293 cells (i.e., NHEK293 or ΦHEK293) or proximal tubule cells (i.e., NPTC or ΦPTC, see Eq. 10); the remaining parameters are defined in Table 1 .
The effects of membrane potential on CLint,OCT2 and the net permeation for the uptake OCT2 and bidirectional OCT2 model are described by Eq. 10 and Eq. 11, respectively.
| (10) |
| (11) |
where J o→i is the net flux (pmol/minute; being positive when flux is in extracellular‐to‐intracellular direction) and C i and C o are intracellular and extracellular concentrations of creatinine.
Although MATE transport is proton‐gradient driven, this was not considered in the current model because of the lack of (i) data on proximal tubule filtrate pH and (ii) data supporting specific equations to mechanistically describe the effect of proton gradient on MATE transport.
Differential equations for the bidirectional OCT2 model (Figure 2 ) are listed in Eqs. (12), (13), (14), (15), (16), (17), and the corresponding equations for the uptake‐only OCT2 model are listed in Eqs. S18 – S23:
Oral depot (compartment 1):
| (12) |
Central/reservoir (compartment 2):
| (13) |
Proximal tubule blood and interstitium (compartment 3):
| (14) |
Proximal tubule cell (compartment 4):
| (15) |
Proximal tubule filtrate (compartment 5):
| (16) |
Urine (compartment 6):
| (17) |
Initial conditions for all compartments were zero.
Steady‐state creatinine CLR was calculated using Eq. 18.
| (18) |
In vitro–in vivo extrapolation of creatinine transporter intrinsic clearance
In vitro CLint literature data were scaled using physiological parameters to predict creatinine CLR (Table 2 ). Two alternative scaling approaches (scenario 1, Eq. 19; and scenario 2, Eq. 20) were applied to address the uncertainty in renal‐scaling factors (i.e., use of cellularity and protein content of tissue) and in physiological data. 11 Criteria for selecting in vitro data were availability of kinetic data from single‐transporter transfected cell lines for OAT2, OCT2, MATE1, and MATE2‐K and protein content or cellularity of the in vitro system.
| (19) |
| (20) |
where CLint,i and CLint,i,in vitro are predicted in vivo (L/hour) and measured in vitro (µL/minute/mg protein) CLint of the i th transporter, respectively, and REFi (unit less) is the relative expression factor of the i th transporter (Eq. 21). Units of remaining parameters are protein content of kidney cortex (mg protein/g kidney cortex), protein content of HEK293 cells (mg protein/million cells), proximal tubule cellularity (million proximal tubule cells/g kidney cortex), and kidney cortex weight (g kidney cortex/person).
Table 2.
Scaling factors used for in vitro–in vivo extrapolation of transporter intrinsic clearance data for creatinine
| Transporter | In vitro transporter abundance a (pmol/mg native membrane protein) | Kidney transporter abundance (pmol/mg total membrane protein) | Relative expression factor | Scenario 1 only b | Scenario 2 only b | Kidney cortex weight (g) f | |
|---|---|---|---|---|---|---|---|
| Total protein content (kidney cortex) c (mg/g kidney) | Protein content (HEK293 cells) d (mg/million cells) | PTC cellularity e (million cells/g kidney cortex) | |||||
| OAT2 (SLC22A7) | 54.1 | 0.93 g | 0.017 | 89.1 | 0.93 | 60 | 217.0 |
| OCT2 (SLC22A2) | 58.7 | 7.42 g | 0.126 | 89.1 | 0.93 | 60 | 217.0 |
| MATE1 (SLC47A1) | 329 | 5.06 g | 0.015 | 89.1 | 0.93 | 60 | 217.0 |
| MATE2‐K (SLC47A2) | 18.6 | 0.94 h | 0.051 | 89.1 | 0.93 | 60 | 217.0 |
HEK293, human embryonic kidney 293; MATE1, multidrug and toxin extrusion transporter 1; MATE2‐K, multidrug and toxin extrusion transporter 2‐K; OAT2, organic anion transporter 2; OCT2, organic cation transporter 2; PTC, proximal tubule cell.
Ref. 30.
Protein content of kidney cortex homogenate. 47
Ref. 16.
Ref. 48.
Assuming kidney weight of 4.5 g/kg body weight, 49 cortex fraction of kidney (by weight) of 0.68, 47 , 50 and body weight of 70 kg.
Ref. 31.
REFi were calculated using transporter protein abundance data from relevant transporter‐transfected cell lines (Expressioni,in vitro; pmol transporter protein/mg native membrane protein) 30 and in human kidney (Expressioni,in vivo; pmol transporter protein/mg total membrane protein) and measured using liquid chromatography coupled to tandem mass spectrometry (Eq. 21). 11 The human kidney protein expression data were based on mean data reported for 41 kidneys, 31 with the exception of MATE2‐K for which the expression data came from pooled samples. 32
| (21) |
Estimation of transporter intrinsic clearance parameters
As a result of the underprediction of steady‐state creatinine CLR using the proteomics‐informed IVIVE approach, CLint parameters were estimated to recover the steady‐state creatinine CLR. Observed creatinine CLR was calculated as the glomerular filtration rate for a typical adult male plus average difference (i.e., net secretion) between creatinine CLR and inulin clearance in subjects with normal renal function. 25 , 26 Optimization was performed by minimizing the squared residual between simulated and observed (8.2 L/hour) creatinine CLR using the Nelder‐Mead simplex search method 33 as an efficient minimization algorithm. To ensure the identifiability of the parameters, the relative contributions (i.e., fraction transported; ft,i) (Eq. 22) of transporters calculated using IVIVE were maintained during CLint estimation.
| (22) |
Simulation of creatinine–drug interactions
Plasma concentration‐time profiles of 11 perpetrator drugs following intravenous or oral administration were described by either one‐compartment or two‐compartment models (Supplemental Material , Section 5 ). Perpetrator models were considered fit for purpose if simulated plasma concentrations were not inconsistent with the observed data collated. Observed pharmacokinetic data were collated from creatinine–drug interaction studies or from other pharmacokinetic studies with similar dosing to that of the creatinine–drug interaction studies.
The effect of the j th perpetrator drug on the creatinine transport activity of the it h transporter (simulated dynamically over time (t)) is described by Eq. 23, adapted from ref. 7. Following simulation for the nominal duration of 96 hours to achieve steady‐state SCr, creatinine–drug interactions were simulated following the study designs described in respective literature studies.
| (23) |
where CLint, i ,inh(t) is the CLint of the i th transporter at time t after accounting for inhibition, CLint, i is the baseline CLint of the i th transporter (Eqs. (14), (15), (16)), Cp,j(t) is the plasma concentration of perpetrator j at time t, fu,p,j is the fraction unbound in plasma for perpetrator j, and IC50, i,j is the unbound concentration of perpetrator j causing 50% inhibition of transporter i.
Simultaneous estimation of transporter intrinsic clearance and apparent permeability parameters
The transporter CLint and apparent permeability parameters were simultaneously estimated by fitting the creatinine–drug interaction model to observed creatinine CLR and observed interaction data for trimethoprim. Trimethoprim was selected considering the rich data set of reported interactions with creatinine (six studies with daily dosing ranging 200–1,600 mg). Two options were explored to address the optimization problem (Supplemental Material , Section 6 ). First, the parameters were estimated by minimizing the sum of squared residuals between simulated and observed interaction data (i.e., the objective function) subject to a nonlinear constraint, defined as steady‐state creatinine CLR of 8.2 L/hour. Second, a multiobjective optimization problem was defined, with squared residual for CLR as one objective function and observed interaction data as another objective function. The weighted sum multiobjective optimization 34 was selected as the most appropriate for use in current study (Eqs. (24), (25), (26)).
| (24) |
| (25) |
| (26) |
where wi are the scalar weights applied to the objective functions (F i), β are the parameters to be estimated, and α are the fixed model parameters; P pred,j,k and P obs,j,k are the predicted and observed percent change in SCr for the k th timepoint (tk) of the j th study, respectively; uk are the inputs associated with the j th study design; Nj are the number of subjects in the j th study; and CLR,pred and CLR,obs are the predicted and observed steady‐state creatinine CLR, respectively.
The weights w 1 = 1 and w 2 = 10,000 were selected to ensure sufficiently precise recovery of CLR while ensuring that the minimization algorithm was not restricted into finding only local minima. Minimization was performed using the Nelder‐Mead simplex search method with transformation of parameters to allow bound constraints; 35 lower bounds of 0 were used for both parameters (see Supplemental Material , Section 6 , for further details relevant to multiobjective optimization vs. single objective with nonlinear constraint optimization, suitability of various minimization algorithms for nonsmooth objective functions, and weighting of objective function).
Sensitivity analysis
Local sensitivity analysis was performed by calculating normalized sensitivity coefficients for each of the fixed model parameters against either simulated steady‐state SCr or creatinine CLR (Supplemental Material , Section 7 ). Although there are implications related to the intercorrelation of parameters, 17 , 36 no information was available on such intercorrelations for many of the system parameters relevant to the kidney model.
Software
Models of creatinine and perpetrator drugs, described as systems of ordinary differential equations, were implemented in Simulink, version 8.9 (R2017a; MathsWorks, Inc, Natick, MA) using a variable‐step numerical solver. The solver was automatically selected by the Simulink software, but was either ode45 (Runge‐Kutta, Dormand‐Prince 4 , 5 pair) or, for problems that were stiff, ode15s (numerical differentiation formulas). Solver settings were not changed from the default values, with the exception that relative tolerance was set from the default of 1/1,000 to 1/100,000 to reduce model noise (see Supplemental Material , Section 6 ). Simulation data were exported to Matlab (R2017a, MathsWorks, Inc) for statistical analyses, calculation and minimization of objective functions, and generation of figures.
RESULTS
Collation of clinical data
Pharmacokinetic and in vitro transporter inhibition data were collated for 11 drugs, namely, trimethoprim, cimetidine, DX‐619, cobicistat, dolutegravir, pyrimethamine, famotidine, ranolazine, rilpirivine, indomethacin, and ranitidine; these drugs are associated with different extents of renal transporter inhibition and clinical changes in SCr (Table S5 ).
Stepwise development of creatinine model
Initial turnover model for creatinine was modified to describe the kinetics of creatinine following oral administration of exogenous creatinine (Figure 3 ), thereby verifying the volume of distribution and Rsyn. Subsequently, the model was expanded to mechanistically describe renal disposition of creatinine. Initially, bottom‐up proteomics‐informed IVIVE was used to implement permeability and transporter kinetic parameters in the mechanistic creatinine model. In vitro apparent permeability data collated from the literature (Table S6 ) were used to predict the paracellular (0.245 L/hour) and transcellular membrane (0.0369 L/hour) permeability clearances for proximal tubule and fraction reabsorbed in distal tubule regions (0.0167).
Figure 3.
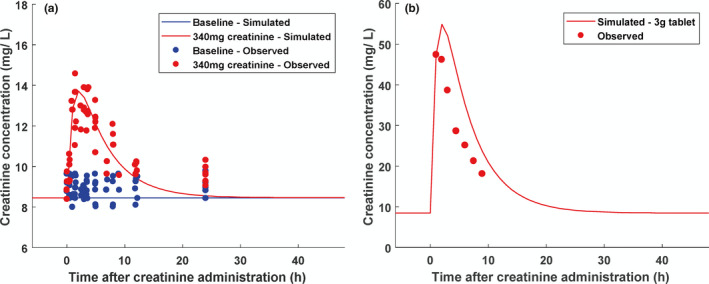
Creatinine kinetics in plasma simulated using one‐compartment model following oral administration of either a cooked meat meal estimated to contain (a) 340 mg creatinine 45 or (b) a 3 g creatinine tablet 46 and compared with observed creatinine concentration data.
Creatinine was reported to be in vitro substrate of a number of kidney transporters, 2 , 21 , 30 namely, OAT2 and OCT2 on the basolateral membrane and MATE1 and MATE2‐K on the apical membrane. Reported Michaelis constant (K m) values for these transporters (> 795 µM, Table S7 ) exceed the reported SCr in subjects with normal renal function (~100 µM), and therefore nonsaturable (first‐order) kinetics was assumed for all transporters.
The predicted CLint mediated via OAT2, OCT2, MATE1, and MATE2‐K are listed in Table 3 . Overall, both IVIVE scenarios resulted in predicted in vivo CLint for uptake transporters at least 20‐fold greater than corresponding values for efflux transporters. After accounting for the difference in membrane potential between HEK293 cells and proximal tubule cells, OCT2 (54%) and OAT2 (46%) were predicted to have similar contributions in creatinine uptake into proximal tubule cells (Table 3 ). Ignoring the effects of membrane potential would have resulted in OAT2 having the largest (60%) predicted contribution.
Table 3.
Intrinsic clearance (CLint) values calculated for OAT2, OCT2, MATE1, and MATE2‐K transporters using in vitro–in vivo extrapolation (IVIVE) and optimized from fitting creatinine models to data
| Source | OAT2 | OCT2 | MATE1 | MATE2‐K |
|---|---|---|---|---|
| 1. In vitro–in vivo extrapolation of CLint | ||||
| In vitro a (µL/minute/mg total protein) | 13.5 | 1.18 (0.754) g | 0.114 | 0.113 |
| Scaled to kidney protein b (µL/minute/mg total protein) | 0.233 | 0.095 h | 0.0018 | 0.0057 |
| In vivo, IVIVE scenario 1 c (L/hour) | 0.270 | 0.111 (0.312) i | 0.002 | 0.0066 |
| In vivo, IVIVE scenario 2 d (L/hour) | 0.169 | 0.0692 (0.196) i | 0.0013 | 0.0041 |
| 2. Optimized parameters fitted using creatinine CLR only | ||||
| In vivo, uptake OCT2 model (L/hour) | 0.994 | 1.14 j | 0.0075 | 0.0244 |
| In vivo, bidirectional OCT2 model (L/hour) | 2.86 | 1.17k | 0.0216 | 0.0703 |
| 3. Optimized parameters fitted using creatinine–trimethoprim interaction data | ||||
| In vivo, uptake OCT2 model e (L/hour) | 20.8 | 23.9 j | 0.157 | 0.510 |
| In vivo, bidirectional OCT2 model f (L/hour) | 21.5 | 8.75 k | 0.162 | 0.527 |
CLint,OCT2,app, apparent OCT2 intrinsic clearance; CLint,OCT2,preMP, intrinsic clearance of OCT2 without effects of membrane potential; CLPD,para, creatinine passive permeability by the paracellular route; CLPD,trans, creatinine passive permeability by the transcellular route; f cation,pH7.4, cationic fraction of creatinine at pH 7.4; HEK293, human embryonic kidney 293; MATE1, multidrug and toxin extrusion transporter 1; MATE2‐K, multidrug and toxin extrusion transporter 2‐K; OAT2, organic anion transporter 2; OCT2, organic cation transporter 2; P app, apparent permeability data; REF, relative expression factor.
Average of values at 41.2 µM and 123.5 µM, extracted from Figure 2 in Shen et al. 30 using GetData Graph Digitizer, transporter transfected HEK293 cell uptake data corrected for uptake by mock‐transfected cells.
After accounting for REF.
As per Eq. 19.
As per Eq. 20.
Estimated P app = 28.9 cm/s × 10‐6 , CLPD,trans = 0.89 L/hour, CLPD,para = 5.9 L/hour.
Estimated P app = 14.0 cm/s × 10‐6 , CLPD,trans = 0.43 L/hour, CLPD,para = 2.87 L/hour.
Value for OCT2 represents CLint,OCT2,app, value in parentheses represents CLint,OCT2,preMP·f cation,pH7.4 (see Eqs. 7 and 8).
Proteomic‐informed IVIVE underpredicted creatinine CLR (Figure S22), possibly because of the different proteomics methods applied to the cellular systems and kidney tissue. 30 , 31 Although the magnitude of underprediction appears small, the contribution of net secretion to creatinine CLR (8.2 L/hour) is minor compared with glomerular filtration (7.5 L/hour); therefore the relative underprediction of the secretion component is actually substantial. Because of the current challenges in proteomic‐informed IVIVE for transporters, IVIVE was also attempted without consideration of expression differences (i.e., assuming REF = 1); however, the models then over‐predicted the creatinine CLR by a large margin (data not shown).
As a result of the inadequate prediction of creatinine secretion using IVIVE, transporter CLint were optimized to recover the observed creatinine CLR; relative contributions of each transporter (i.e., ft,i; Eq. 22) were as noted previously (Table 3 ) to avoid any identifiability issues. The optimized CLint were 4‐fold and 11‐fold higher using the uptake and bidirectional OCT2 models, respectively, when compared with IVIVE scenario 1 predictions, or 6‐fold and 17‐fold compared with IVIVE scenario 2 predictions, respectively (Table 3 ).
Refinement of the model using creatinine–trimethoprim interaction data
To assess the robustness of creatinine models, the magnitude of creatinine–drug interactions with 11 different perpetrator drugs (28 studies in total) was predicted following optimization of the creatinine CLint. Pharmacokinetic model parameters for these perpetrators are listed in Table S3 . Substantial overall underprediction of the magnitude of interactions for both the uptake and bidirectional OCT2 models was apparent. Therefore, creatinine models were further refined by estimating apparent permeability and CLint using creatinine–trimethoprim interaction data from six studies (total of 44 subjects, daily dose ranging 200–1,600 mg). The models were fitted to creatinine CLR and creatinine–trimethoprim interaction data simultaneously using only the steady‐state or maximal percent change in SCr from each study and fixed relative contributions (i.e., ft,i) of the transporters. The best fit estimates of apparent permeability and CLint (Table 3 ) were higher than the corresponding values predicted using IVIVE by 24‐fold and 77‐fold for the uptake OCT2 model and 12‐fold and 80‐fold for the bidirectional OCT2 model, respectively. The refined models described creatinine–trimethoprim interactions in agreement with observed data from the six literature studies (Figure 4 ). The ratios of simulated steady‐state concentrations in proximal tubule cells and plasma (accounting also for passive permeability) were 19 and 11 for the uptake OCT2 and bidirectional OCT2 models, respectively (Table S8 ). Sensitivity analysis was performed for the fixed parameters of these refined creatinine models (Supplemental Material , Section 7 ). Glomerular filtration rate, proximal tubule filtrate flow rate (Q PT‐U,filt), R syn, membrane potential in proximal tubuel cell (φPTC) (bidirectional OCT2 model only), and pH in proximal tubule cells (pHPTC; bidirectional OCT2 model only) and blood (pHblood) had the largest impact on steady‐state SCr.
Figure 4.
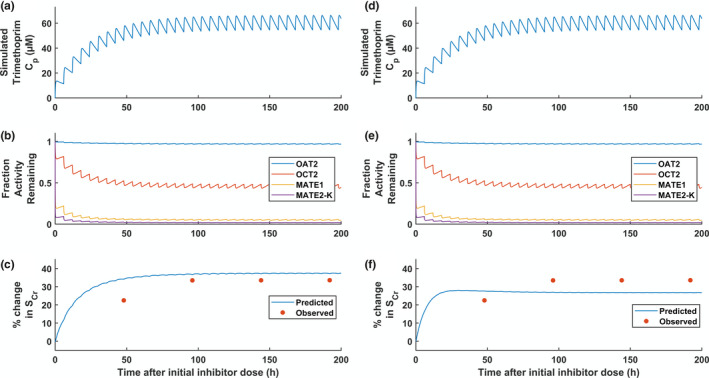
Simulation of creatinine–trimethoprim interaction following oral administration of 400 mg trimethoprim every 6 hours (i.e., 20 mg/kg/day) using the uptake OCT2 model (a–c) or bidirectional OCT2 model (d–f) with optimized apparent permeability data and intrinsic clearance. a,d: Simulated trimethoprim plasma concentrations. d,e: Simulated fraction activity remaining. c,f: Simulated and observed percentage change in serum creatinine. C p, plasma concentration; MATE1, multidrug and toxin extrusion transporter 1; MATE2‐K, multidrug and toxin extrusion transporter 2‐K; OAT2, organic anion transporter 2; OCT2, organic cation transporter 2; SCr, serum creatinine concentration.
DISCUSSION
In the current study, physiologically based models of creatinine renal disposition were developed for the first time. These models were developed systematically following PBPK best practices. 7 , 11 , 13 , 20 Given the uncertainty of scaling factors for kidney transporters 11 and ongoing debates concerning best practices and the consistency of proteomics data, 37 proteomic‐informed IVIVE was attempted using different approaches. However, each resulted in the underestimation of creatinine CLR (predicted value was < 88% of the observed regardless of the scenario investigated). Underprediction of transporter‐mediated clearance is not uncommon and is often resolved by drug‐specific empirical scaling factors to recover clinical observations. 17 , 38 From the initial quantitative translational efforts it was unclear if the transporter CLint might be underpredicted or whether additional transporters might be involved that were not included in the model (e.g., organic cation transporter 3 (OCT3)).
Benefits and limitations of proteomics‐informed IVIVE
The use of the conventional equation to describe OCT2‐mediated transport (i.e., uptake OCT2 model) resulted in a different set of estimated CLint compared with transport driven by electrochemical gradient (i.e., bidirectional OCT2 model), consistent with previous PBPK modeling of the metformin–cimetidine interaction. 15 , 16 Implementation of equations to describe the role of membrane potential and electrochemical gradient is expanding within mechanistic/PBPK models. 15 , 16 , 29 , 39 Although experimental evidence for OCT2 efflux of creatinine is not reported, the concept of bidirectionality of the OCT2 transport is supported by in vitro data for tetraethylammonium. 40 Creatinine is largely uncharged (as ampholyte) at pH 7.4, yet creatinine transport by OCT2 is affected by changes in membrane potential, 41 supporting the inclusion of electrochemical gradient‐driven transport in the bidirectional OCT2 model.
Distinguishing the quantitative contributions of multiple processes to a single net observed effect represents a challenge to ensure the “identifiability” of a model. 6 In general, problems with model identifiability can be overcome in various ways, including simplification or reparameterization of the model or simultaneous use of different data that either (i) inform different states of the model or (ii) are associated with specific perturbations to model parameter(s). 42 For example, to optimize creatinine transporter CLint, proteomic‐based information was used to inform the relative contributions of each transporter to creatinine renal disposition. Confidence in proteomic‐based transporter IVIVE is generally not high, and an abundance‐function relationship has yet to be established for transporters. 6 , 8 , 9 , 13 However, without these prior data, the CLint parameters for four transporters would have been nonidentifiable. The proteomics‐based IVIVE predicted similar contributions of OCT2 and OAT2 to the basolateral uptake of creatinine in contrast to previous reports of a larger contribution by OAT2. 4 Furthermore, overall transport clearances via the basolateral transporters OAT2 and OCT2 were much larger compared with MATE1 and MATE2‐K. Simulated steady‐state proximal tubule cell‐plasma concentration ratios were lower than anticipated solely from the relative ratio of the transport clearances because of the role of passive permeability (Table S8 ). This concentration ratio was even lower in the bidirectional OCT2 model because of bidirectional transport assumption.
Model assumptions relating to creatinine membrane permeability
Initial evaluation of the mechanistic models resulted in a general underprediction of the magnitude of creatinine–drug interactions, signifying an incorrect assumption of the creatinine model. IVIVE predictions of permeability clearance parameters suggested low F reab (< 10%) for creatinine. In a previous study, IVIVE of reabsorption of 45 diverse drugs was least accurate for basic compounds, 28 whereas another study required empirical scalar to overcome uncertainty toward the microvilli expansion of effective membrane surface area. 43 Therefore, simultaneous estimation of permeability and transporter CLint parameters was performed using data associated with specific perturbations (i.e., creatinine–trimethoprim interaction data). The relevance of the estimated permeability within the context of biological understanding of creatinine disposition is discussed in a companion article. 21 The availability of concentration data within specific organs using imaging technologies would provide additional information to distinguish uptake and efflux rates, although limited examples have been reported to date for liver. 13 , 44 The simultaneous estimation of P app and CLint presented additional model optimization challenges, including multiobjective optimization and model noise leading to nonsmooth objective functions. These were explored in a pragmatic manner (details in Supplemental Material , Section 6 ). Expanding the application of PBPK models within the reverse translation paradigm illustrated here emphasizes the need for further work to determine more efficient approaches to these complex problems.
In conclusion, mechanistic creatinine models were developed, accounting for the first time for passive permeability and multiple transporter‐mediated processes in proximal tubule cells. Equations describing bidirectional transport by OCT2 driven by electrochemical gradient were implemented in the models. Challenges in quantitative translation of in vitro transporter kinetics data were highlighted; the identification of knowledge gaps is a valuable benefit of employing mechanistic models that is often ignored. This mechanistic framework allows investigation of the interplay of transporter processes, and provides opportunity to update models with new data that address knowledge gaps. Multiobjective optimization enabled reverse translation to inform/refine transporter kinetic parameters of the complex mechanistic models by clinical data. Evaluation of the performance of the model for the prediction of creatinine–drug interactions, accounting also for intraindividual variability in SCr, is reported in a companion article. 21
Funding
Daniel Scotcher was supported in part by an appointment to the Research Participation Program at the Centre for Drug Evaluation and Research, administered by the Oak Ridge Institute for Science and Education through an interagency agreement between the US Department of Energy and the US Food and Drug Administration.
Conflict of Interest
As an Associate Editor for Pharmacometrics & Systems Pharmacology, P.Z. was not involved in the review or decision process for this article. All other authors declared no conflicts of interest.
Author Contributions
D.S., V.A., X.Y., P.Z., L.Z., S.‐M.H., A.G., and A.R.‐H. wrote the manuscript. D.S., V.A., X.Y., P.Z., L.Z., S.‐M.H., A.G., and A.R.‐H. designed the research. D.S. performed the research. D.S. analyzed the data.
Supporting information
Supplementary Material
Model Code and Data
Acknowledgments
The authors wish to acknowledge Howard Burt of Simcyp (a Certara company), Sheffield, UK, for a useful discussion on the electrochemical gradient driving force of organic cation transporter 2 transport. The opinions expressed is this article are those of the authors and should not be interpreted as the position of the US Food and Drug Administration.
References
- 1. Chu, X. et al Clinical probes and endogenous biomarkers as substrates for transporter drug‐drug interaction evaluation: perspectives from the International Transporter Consortium. Clin. Pharmacol. Ther. 104, 836–864 (2018). [DOI] [PubMed] [Google Scholar]
- 2. Mathialagan, S. , Rodrigues, A.D. & Feng, B. Evaluation of renal transporter inhibition using creatinine as a substrate in vitro to assess the clinical risk of elevated serum creatinine. J. Pharm. Sci. 106, 2535–2541 (2017). [DOI] [PubMed] [Google Scholar]
- 3. Nakada, T. , Kudo, T. , Kume, T. , Kusuhara, H. & Ito, K. Estimation of changes in serum creatinine and creatinine clearance caused by renal transporter inhibition in healthy subjects. Drug Metab. Pharmacokinet. 34, 233–238 (2019). [DOI] [PubMed] [Google Scholar]
- 4. Nakada, T. , Kudo, T. , Kume, T. , Kusuhara, H. & Ito, K. Quantitative analysis of elevation of serum creatinine via renal transporter inhibition by trimethoprim in healthy subjects using physiologically‐based pharmacokinetic model. Drug Metab. Pharmacokinet. 33, 103–110 (2018). [DOI] [PubMed] [Google Scholar]
- 5. Chu, X. , Bleasby, K. , Chan, G.H. , Nunes, I. & Evers, R. The complexities of interpreting reversible elevated serum creatinine levels in drug development: does a correlation with inhibition of renal transporters exist? Drug Metab. Dispos. 44, 1498–1509 (2016). [DOI] [PubMed] [Google Scholar]
- 6. Shebley, M. et al Physiologically based pharmacokinetic model qualification and reporting procedures for regulatory submissions: a consortium perspective. Clin. Pharmacol. Ther. 104, 88–110 (2018). [DOI] [PMC free article] [PubMed] [Google Scholar]
- 7. Gertz, M. et al Cyclosporine inhibition of hepatic and intestinal CYP3A4, uptake and efflux transporters: application of PBPK modeling in the assessment of drug‐drug interaction potential. Pharm Res. 30, 761–780 (2013). [DOI] [PubMed] [Google Scholar]
- 8. Grimstein, M. et al Physiologically based pharmacokinetic modeling in regulatory science: an update from the U.S. Food and Drug Administration's Office of Clinical Pharmacology. J. Pharm. Sci. 108, 21–25(2019). [DOI] [PubMed] [Google Scholar]
- 9. Galetin, A. , Zhao, P. & Huang, S.M. Physiologically based pharmacokinetic modeling of drug transporters to facilitate individualized dose prediction. J. Pharm. Sci. 106, 2204–2208 (2017). [DOI] [PubMed] [Google Scholar]
- 10. Yoshida, K. et al In vitro–in vivo extrapolation of metabolism‐and transporter‐mediated drug‐drug interactions—overview of basic prediction methods. J. Pharm. Sci. 106, 2209–2213 (2017). [DOI] [PubMed] [Google Scholar]
- 11. Scotcher, D. , Jones, C. , Posada, M. , Rostami‐Hodjegan, A. & Galetin, A. Key to opening kidney for in vitro‐in vivo extrapolation entrance in health and disease: Part I: In vitro systems and physiological data. AAPS J. 18, 1067–1081 (2016). [DOI] [PubMed] [Google Scholar]
- 12. Scotcher, D. , Jones, C. , Posada, M. , Galetin, A. & Rostami‐Hodjegan, A. Key to opening kidney for in vitro‐in vivo extrapolation entrance in health and disease: part II: mechanistic models and in vitro‐in vivo extrapolation. AAPS J. 18, 1082–1094 (2016). [DOI] [PubMed] [Google Scholar]
- 13. Guo, Y. et al Advancing predictions of tissue and intracellular drug concentrations using in vitro, imaging and physiologically based pharmacokinetic modeling approaches. Clin. Pharmacol. Ther. 104, 865–889 (2018). [DOI] [PMC free article] [PubMed] [Google Scholar]
- 14. Kumar, V. et al The importance of incorporating OCT2 plasma membrane expression and membrane potential in IVIVE of metformin renal secretory clearance. Drug Metab. Dispos. 46, 1441–1445 (2018). [DOI] [PMC free article] [PubMed] [Google Scholar]
- 15. Nishiyama, K. , Toshimoto, K. , Lee, W. , Ishiguro, N. , Bister, B. & Sugiyama, Y. Physiologically‐based pharmacokinetic modeling analysis for quantitative prediction of renal transporter‐mediated interactions between metformin and cimetidine. CPT Pharmacometrics Syst. Pharmacol. 8, 396–406 (2019). [DOI] [PMC free article] [PubMed] [Google Scholar]
- 16. Burt, H. et al Metformin and cimetidine: physiologically based pharmacokinetic modelling to investigate transporter mediated drug–drug interactions. Eur. J. Pharm. Sci. 88, 70–82 (2016). [DOI] [PubMed] [Google Scholar]
- 17. Gertz, M. , Tsamandouras, N. , Sall, C. , Houston, J.B. & Galetin, A. Reduced physiologically‐based pharmacokinetic model of repaglinide: impact of OATP1B1 and CYP2C8 genotype and source of in vitro data on the prediction of drug‐drug interaction risk. Pharm. Res. 31, 2367–2382 (2014). [DOI] [PubMed] [Google Scholar]
- 18. Tsamandouras, N. , Rostami‐Hodjegan, A. & Aarons, L. Combining the ‘bottom up’ and ‘top down’ approaches in pharmacokinetic modelling: fitting PBPK models to observed clinical data. Br. J. Clin. Pharmacol. 79, 48–55 (2015). [DOI] [PMC free article] [PubMed] [Google Scholar]
- 19. Rostami‐Hodjegan, A. Reverse translation in PBPK and QSP: going backwards in order to go forward with confidence. Clin. Pharmacol. Ther. 103, 224–232 (2018). [DOI] [PMC free article] [PubMed] [Google Scholar]
- 20. Scotcher, D. , Jones, C.R. , Galetin, A. & Rostami‐Hodjegan, A. Delineating the role of various factors in renal disposition of digoxin through application of physiologically based kidney model to renal impairment populations. J. Pharmacol. Exp. Ther. 360, 484–495 (2017). [DOI] [PMC free article] [PubMed] [Google Scholar]
- 21. Scotcher, D. , Arya, V. , Yang, X. , Zhao, P. , Zhang, L. , Huang, S.‐M. et al. Mechanistic models as framework for understanding biomarker disposition: prediction of creatinine‐drug interactions. Clin. Pharmacol. Ther. (in Press). 10.1002/psp4.12508 [DOI] [PMC free article] [PubMed] [Google Scholar]
- 22. Levey, A.S. et al Using standardized serum creatinine values in the modification of diet in renal disease study equation for estimating glomerular filtration rate. Ann. Intern. Med .145, 247–254 (2006). [DOI] [PubMed] [Google Scholar]
- 23. Cockcroft, D.W. & Gault, M.H. Prediction of creatinine clearance from serum creatinine. Nephron 16, 31–41 (1976). [DOI] [PubMed] [Google Scholar]
- 24. US Food Drug Administration . Drug approval package: RANEXATM (Ranolazine) [US Food Drug Administration application no. (NDA) 021526] (US Food Drug Administration, Silver Spring, MD, 2005). [Google Scholar]
- 25. Soveri, I. et al Measuring GFR: a systematic review. Am. J. Kidney Dis. 64, 411–424 (2014). [DOI] [PubMed] [Google Scholar]
- 26. Valentin, J. Basic anatomical and physiological data for use in radiological protection: reference values: ICRP publication 89. Ann ICRP 32, 1–277 (2002). [PubMed] [Google Scholar]
- 27. Matsuzaki, T. , Scotcher, D. , Darwich, A.S. , Galetin, A. & Rostami‐Hodjegan, A. Towards further verification of physiologically‐based kidney models: predictability of the effects of urine‐flow and urine‐pH on renal clearance. J. Pharmacol. Exp. Ther. 368, 157–168 (2019). [DOI] [PubMed] [Google Scholar]
- 28. Scotcher, D. , Jones, C. , Rostami‐Hodjegan, A. & Galetin, A. Novel minimal physiologically‐based model for the prediction of passive tubular reabsorption and renal excretion clearance. Eur. J. Pharm. Sci. 94, 59–71 (2016). [DOI] [PMC free article] [PubMed] [Google Scholar]
- 29. Chien, H.C. et al Rapid method to determine intracellular drug concentrations in cellular uptake assays: application to metformin in organic cation transporter 1‐transfected human embryonic kidney 293 cells. Drug Metab. Dispos. 44, 356–364 (2016). [DOI] [PMC free article] [PubMed] [Google Scholar]
- 30. Shen, H. et al Characterization of organic anion transporter 2 (SLC22A7): a highly efficient transporter for creatinine and species‐dependent renal tubular expression. Drug Metab. Dispos. 43, 984–993 (2015). [DOI] [PubMed] [Google Scholar]
- 31. Prasad, B. et al Abundance of drug transporters in the human kidney cortex as quantified by quantitative targeted proteomics. Drug Metab. Dispos. 44, 1920–1924 (2016). [DOI] [PMC free article] [PubMed] [Google Scholar]
- 32. Nakamura, K. et al Large‐scale multiplex absolute protein quantification of drug‐metabolizing enzymes and transporters in human intestine, liver, and kidney microsomes by SWATH‐MS: Comparison with MRM/SRM and HR‐MRM/PRM. Proteomics 16, 2106–2117 (2016). [DOI] [PubMed] [Google Scholar]
- 33. Lagarias, J.C. , Reeds, J.A. , Wright, M.H. & Wright, P.E. Convergence properties of the Nelder‐Mead simplex method in low dimensions. SIAM J. Optim. 9, 112–147 (1998). [Google Scholar]
- 34. Marler, R.T. & Arora, J.S. The weighted sum method for multi‐objective optimization: new insights. Struct. Multidiscipl. Optim. 41, 853–862 (2010). [Google Scholar]
- 35. D'Errico, J. Bound constrained optimization using fminsearch "fminsearchbnd" (version 1.4.0.0) (Matlab function code) <https://ukmathworkscom/matlabcentral/fileexchange/8277‐fminsearchbnd‐fminsearchcon> (2012). Accessed December 3, 2018.
- 36. Melillo, N. , Darwich, A.S. , Magni, P. & Rostami‐Hodjegan, A. Accounting for inter‐correlation between enzyme abundance: a simulation study to assess implications on global sensitivity analysis within physiologically‐based pharmacokinetics. J. Pharmacokinet. Pharmacodyn. 46, 137–154 (2019). [DOI] [PubMed] [Google Scholar]
- 37. Prasad, B. et al Towards a consensus on applying quantitative LC‐MS/MS Proteomics in translational pharmacology research: a White Paper. Clin. Pharmacol. Ther. 106, 525–543 (2019). [DOI] [PMC free article] [PubMed] [Google Scholar]
- 38. Posada, M.M. et al Prediction of renal transporter mediated drug‐drug interactions for pemetrexed using physiologically based pharmacokinetic modeling. Drug Metab. Dispos. 43, 325–334 (2015). [DOI] [PubMed] [Google Scholar]
- 39. Ghosh, A. , Scott, D.O. & Maurer, T.S. Towards a unified model of passive drug permeation I: origins of the unstirred water layer with applications to ionic permeation. Eur. J. Pharm. Sci. 52, 109–124 (2014). [DOI] [PubMed] [Google Scholar]
- 40. Urakami, Y. , Akazawa, M. , Saito, H. , Okuda, M. & Inui, K. cDNA cloning, functional characterization, and tissue distribution of an alternatively spliced variant of organic cation transporter hOCT2 predominantly expressed in the human kidney. J. Am. Soc. Nephrol. 13, 1703–1710 (2002). [DOI] [PubMed] [Google Scholar]
- 41. Urakami, Y. , Kimura, N. , Okuda, M. & Inui, K. Creatinine transport by basolateral organic cation transporter hOCT2 in the human kidney. Pharm. Res. 21, 976–981 (2004). [DOI] [PubMed] [Google Scholar]
- 42. Cheung, S.Y. , Yates, J.W. & Aarons, L. The design and analysis of parallel experiments to produce structurally identifiable models. J. Pharmacokinet. Pharmacodyn. 40, 93–100 (2013). [DOI] [PubMed] [Google Scholar]
- 43. Huang, W. & Isoherranen, N. Development of a dynamic physiologically based mechanistic kidney model to predict renal clearance. CPT Pharmacometrics Syst. Pharmacol. 7, 593–602 (2018). [DOI] [PMC free article] [PubMed] [Google Scholar]
- 44. Kenna, J.G. et al. Noninvasive preclinical and clinical imaging of liver transporter function relevant to drug‐induced liver injury In Drug‐Induced Liver Toxicity(eds. Chen M. & Will Y.) 627–651 (Springer, New York, NY, 2018). [Google Scholar]
- 45. Mayersohn, M. , Conrad, K.A. & Achari, R. The influence of a cooked meat meal on creatinine plasma concentration and creatinine clearance. Br. J. Clin. Pharmacol. 15, 227–230 (1983). [DOI] [PMC free article] [PubMed] [Google Scholar]
- 46. Lundholm, L. & Svedmyr, N. The comparative absorption of creatinine from "gitter" tablets and control tablets. Acta Pharmacol. Toxicol. (Copenh) 20, 65–72 (1963). [DOI] [PubMed] [Google Scholar]
- 47. Scotcher, D. et al Microsomal and cytosolic scaling factors in dog and human kidney cortex and application for in vitro‐in vivo extrapolation of renal metabolic clearance. Drug Metab. Dispos. 45, 556–568 (2017). [DOI] [PMC free article] [PubMed] [Google Scholar]
- 48. Neuhoff, S. et al. Accounting for transporters in renal clearance: towards a mechanistic kidney model (Mech KiM) In Transporters in Drug Development (eds. Sugiyama Y. & Steffansen B.) 155–177 (Springer, New York, NY, 2013). [Google Scholar]
- 49. Gill, K.L. , Houston, J.B. & Galetin, A. Characterization of in vitro glucuronidation clearance of a range of drugs in human kidney microsomes: comparison with liver and intestinal glucuronidation and impact of albumin. Drug Metab. Dispos. 40, 825–835 (2012). [DOI] [PMC free article] [PubMed] [Google Scholar]
- 50. Lerman, L. , Flickinger, A. , Sheedy, P. 2nd & Turner, S. Reproducibility of human kidney perfusion and volume determinations with electron beam computed tomography. Invest Radiol. 31, 204–210 (1996). [DOI] [PubMed] [Google Scholar]
Associated Data
This section collects any data citations, data availability statements, or supplementary materials included in this article.
Supplementary Materials
Supplementary Material
Model Code and Data