We agree with Hornung et al 1 that studying blood microbiome is a major technical challenge with potential artefacts. At least three important challenges must be tackled:
Low amount of bacterial DNA in blood.2
High amounts of PCR inhibitors.
Bacterial DNA contaminants from environment, reagents and consumables.
Measuring, reducing and controlling bacterial contaminants are key elements of optimisations made on the molecular pipeline used in our study3 as well as eight published studies on blood microbiome.2 4–7 The studies from Salter et al 8 and Laurence et al 9 are useful to understand the burden of bacterial contaminants when working with low bacterial abundance samples. In former publications,2 10 we have described our procedure and the controls performed to address such contamination. One must be careful when using a fixed list of bacterial contaminants, as each experiment has its own contamination burden. Therefore, two different experiments done under different conditions, will not have the same contaminants. What is essential, as pointed out by Hornung et al, is to include and analyse negative controls in each experiment. Although not explicitly mentioned before, our study3 included the following negative controls:
Extraction negative controls (water at DNA extraction step).
PCR negative controls (water at first PCR step).
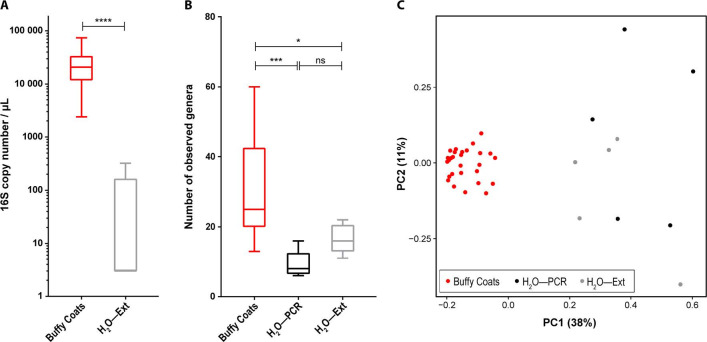
We now present data from these control experiments. Abundance of 16S ribosomal RNA genes measured by quantitative PCR (qPCR) shows over 1000-fold difference between blood samples and extraction negative controls (figure 1A). Blood samples also exhibit significantly higher genus richness (figure 1B) and distinct microbiome compositions (figure 1C) compared with negative controls. Therefore, the technical contamination would have only a marginal impact in this study. Though we cannot exclude that a small fraction of the measured bacterial DNA corresponds to contamination, the contaminants are low and relatively homogenous between samples and should not influence the statistical tests performed.
Figure 1.
(A) qPCR-based 16S rRNA gene abundances are significantly higher in buffy coat samples than negative controls (H2O—Ext) based on Mann-Whitney U test. Median 20 800 versus 3 copies/µL; mean 24 160 versus 67.2 copies/µL. (B) Buffy coat samples exhibit significantly higher genus richness than negative controls (H2O—PCR and H2O—Ext) based on Kruskal-Wallis test followed by Dunn’s post hoc tests. (C) Principal coordinate analysis of the 16S rRNA gene sequencing data using Bray-Curtis dissimilarity measure shows clear separation of buffy coat samples from negatives controls (H2O—PCR and H2O—Ext). H2O—Ext: molecular grade water added in an empty tube, extracted and analysed (qPCR and/or sequencing) at the same time as the samples. H2O—PCR: molecular grade water added in an empty tube and amplified and sequenced at the same time as the extracted DNA of the samples. Statistical significance—*p<0.05; ***p<0.001; ****p<0.0001. qPCR, quantitative PCR; rRNA, ribosomal RNA.
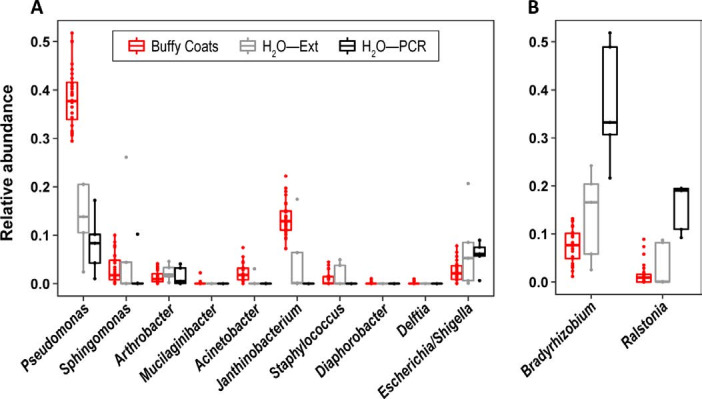
Among the nine bacterial genera listed by Hornung et al as potential contaminants based on the literature, the negative control sequencing data clearly show that eight of them were not contaminants in our study (figure 2A). These were either absent from negative controls or present in significantly lower relative proportions than in blood samples. The remaining genus, Arthrobacter, with similar relative abundance in samples/controls (figure 2A), could be considered a contaminant. When working with compositional data, it is important to note that relative abundance of contaminants in negative controls will be exaggerated. It should always be interpreted together with quantitative data, such as qPCR abundances (figure 1A). Therefore, it is disputable whether Arthrobacter is a real contaminant given our data, but still possible. Additionally, we also found that Escherichia/Shigella relative abundance could suggest that it is a contaminant, but it is not uncommon to find it in blood. Consequently, we did not exclude Arthrobacter and Escherichia/Shigella, but they did not show clinically meaningful correlations and therefore were not discussed in our report.3 Two other taxa (Bradyrhizobium and Ralstonia) were present in higher proportions in negative controls compared with samples (figure 2B), and thus were considered as likely contaminants and not considered further.3
Figure 2.

Comparison of bacterial genus relative abundances in buffy coat samples and negative controls (H2O—PCR and H2O—Ext). (A) Bacterial genera listed in the letter of Hornung et al as potential contaminants, and Escherichia/Shigella. (B) Two bacterial genera that were considered as likely contaminants and discarded from our previous letter. H2O—Ext: molecular grade water added in an empty tube, extracted and analysed (qPCR and/or sequencing) at the same time as the samples. H2O—PCR: molecular grade water added in an empty tube and amplified and sequenced at the same time as the extracted DNA of the samples. qPCR, quantitative PCR.
Finally, contamination by skin bacteria is indeed a major challenge when using small volume of blood (20 µL) taken by skin puncture. However, in this study, 40 mL of blood was withdrawn. Moreover, portal, hepatic and atrial blood were collected using catheters not in contact with skin. Therefore, contamination from the skin is negligible in our study.
Overall, we second the concerns raised by Hornung et al, and through this letter highlight the important controls required in blood microbiome research.
Footnotes
Contributors: Conceptualisation, methodology, investigation and writing—original draft: RS, CA-S, FS, JT, BL and MA. Formal analysis: CA-S, FS, JT, BL and MA. Resources and visualisation: CA-S, FS, BL and MA. Data curation: BL. Supervision: JT, BL and MA.
Funding: The authors were supported by grants from European Union’s Horizon 2020 research and innovation programme’s MICROB-PREDICT study (No 825694), the Deutsche Forschungsgemeinschaft (SFB TRR57), Cellex Foundation and Novo Nordisk Foundation (NNF10CC1016515 and NNF16CC0020896). The study was supported by Challenge Grant ‘MicrobLiver’ grant number NNF15OC0016692 from the Novo Nordisk Foundation. The funders had no influence on study design, data collection and analysis, decision to publish or preparation of the manuscript.
Competing interests: FS and BL are employees of Vaiomer.
Provenance and peer review: Not commissioned; internally peer reviewed.
Patient consent for publication: Not required.
References
- 1. Hornung BVH, Zwittink RD, Ducarmon QR, et al. Response to: ’Circulating microbiome in blood of different circulatory compartments' by Schierwagen et al . Gut 2020;69:789–90. 10.1136/gutjnl-2019-318601 [DOI] [PubMed] [Google Scholar]
- 2. Païssé S, Valle C, Servant F, et al. Comprehensive description of blood microbiome from healthy donors assessed by 16S targeted metagenomic sequencing. Transfusion 2016;56:1138–47. 10.1111/trf.13477 [DOI] [PubMed] [Google Scholar]
- 3. Schierwagen R, Alvarez-Silva C, Madsen MSA, et al. Circulating microbiome in blood of different circulatory compartments. Gut 2018;68:578–80. 10.1136/gutjnl-2018-316227 [DOI] [PubMed] [Google Scholar]
- 4. Lelouvier B, Servant F, Païssé S, et al. Changes in blood microbiota profiles associated with liver fibrosis in obese patients: A pilot analysis. Hepatology 2016;64:2015–27. 10.1002/hep.28829 [DOI] [PubMed] [Google Scholar]
- 5. Alvarez-Silva C, Schierwagen R, Pohlmann A, et al. Compartmentalization of immune response and microbial translocation in decompensated cirrhosis. Front Immunol 2019;10:69 10.3389/fimmu.2019.00069 [DOI] [PMC free article] [PubMed] [Google Scholar]
- 6. Shah NB, Allegretti AS, Nigwekar SU, et al. Blood microbiome profile in CKD : a pilot study. Clin J Am Soc Nephrol 2019;14:692–701. 10.2215/CJN.12161018 [DOI] [PMC free article] [PubMed] [Google Scholar]
- 7. Lelouvier B, Servant F, Delobel P, et al. Identification by highly sensitive 16S metagenomic sequencing of an unusual case of polymicrobial bacteremia. J Infect 2017;75:278–80. 10.1016/j.jinf.2017.05.005 [DOI] [PubMed] [Google Scholar]
- 8. Salter SJ, Cox MJ, Turek EM, et al. Reagent and laboratory contamination can critically impact sequence-based microbiome analyses. BMC Biol 2014;12:87 10.1186/s12915-014-0087-z [DOI] [PMC free article] [PubMed] [Google Scholar]
- 9. Laurence M, Hatzis C, Brash DE. Common contaminants in next-generation sequencing that hinder discovery of low-abundance microbes. PLoS One 2014;9:e97876 10.1371/journal.pone.0097876 [DOI] [PMC free article] [PubMed] [Google Scholar]
- 10. Lluch J, Servant F, Païssé S, et al. the characterization of novel tissue microbiota using an optimized 16S Metagenomic sequencing pipeline. PLoS One 2015;10:e0142334 10.1371/journal.pone.0142334 [DOI] [PMC free article] [PubMed] [Google Scholar]


