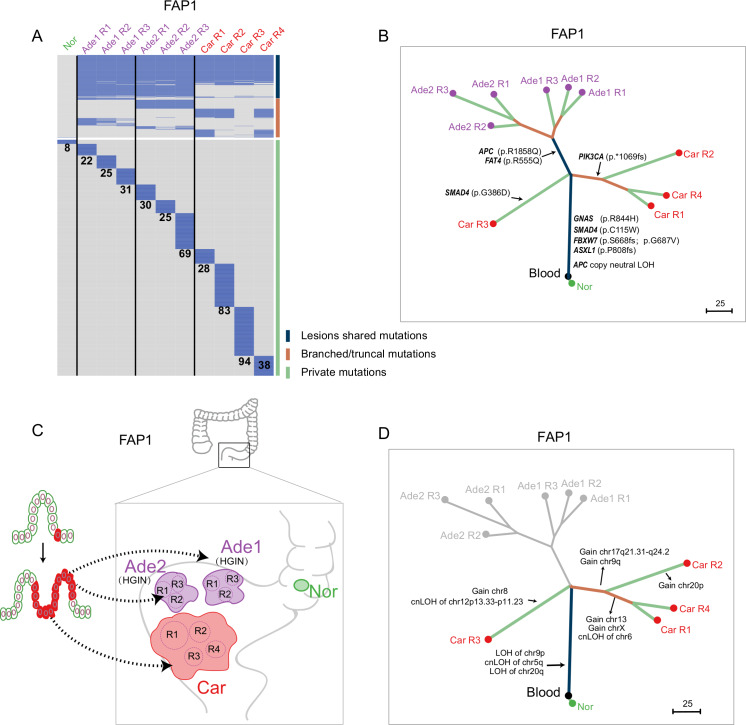
Figure 2.
Clonal architectures of lesions at different evolutionary stages from FAP1. (A) Heatmap showing the regional distribution of somatic mutations in all samples from FAP1. All mutations were classified into three types: lesion-shared mutations (dark blue), branched/truncal mutations (deep orange) and private mutations (light green). The number of private mutations for each sample is shown. Samples from different lesions are separated by a black line. (B) Phylogenetic tree of lesions at different evolutionary stages from FAP1 by using maximum parsimony algorithm. The colours of the lines in the phylogenetic tree correspond to the mutation types as mentioned previously. Potential driver mutations and cnLOH of APC genes are shown. (C) Schematic diagram indicating that all the lesions of FAP1 originated from the same cell. (D) Clonal or individual CNAs and cnLOHs were presented on the phylogenetic tree of lesions from FAP1 constructed from somatic mutations. Ade, adenoma; APC, adenomatous polyposis coli; Car, carcinoma; cnLOH, copy neutral loss of heterogeneity; FAP, familial adenomatous polyposis; HGIN, high-grade intra-epithelial neoplasia; Nor, adjacent normal tissue; R, region.

