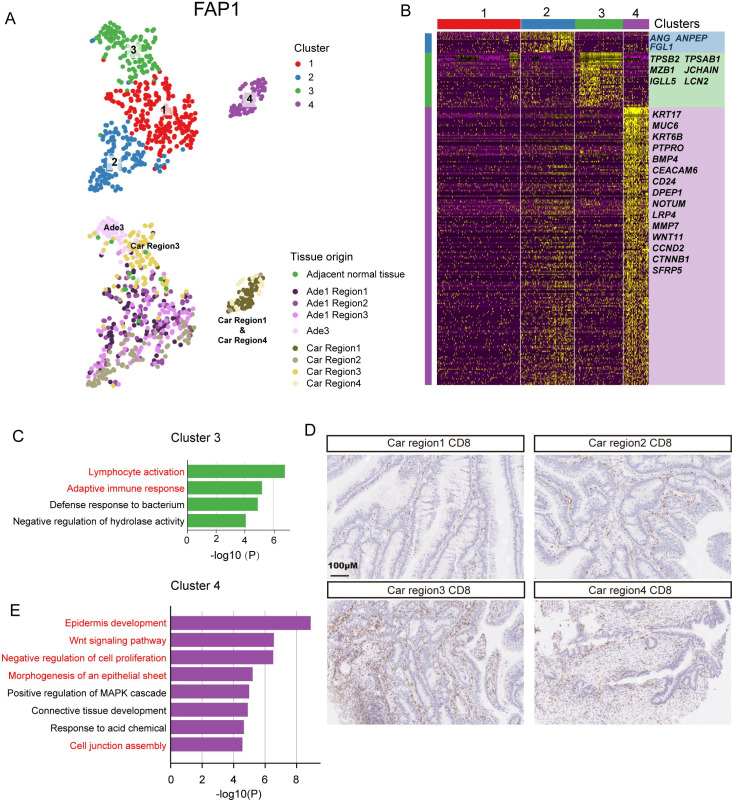
Figure 4.
Transcriptome heterogeneity of lesions at different evolutionary stages from FAP1. (A) Clustering analysis of all epithelial cells from FAP1 by using tSNE. Four clusterswere identified (top) and the tissue origin for each single cell was indicated (bottom). (B) Heatmap showing the specifically highly expressed genes in each cluster. (C) GO analysis of genes highly expressed in cluster 3. (D) Immumohistochemical staining of CD8 in four regions of carcinomas from FAP1. Scale bar, 100 µm. (E) GO analysis of genes highly expressed in cluster 4. Car, carcinoma; Ade, adenoms; FAP, familial adenomatous polyposis; GO, gene ontology; MAPK, mitogen-activated protein kinase.

