

Abstract
Background
The pandemic of coronavirus disease 2019 (COVID‐19) caused by severe acute respiratory syndrome coronavirus 2 (SARS‐CoV‐2) infection has made widespread impact recently. We aim to investigate the clinical characteristics of COVID‐19 children with different severities and allergic status.
Methods
Data extracted from the electronic medical records, including demographics, clinical manifestations, comorbidities, laboratory and immunological results, and radiological images of 182 hospitalized COVID‐19 children, were summarized and analyzed.
Results
The median age was 6 years, ranging from 3 days to 15 years, and there were more boys (male‐female ratio about 2:1) within the studied 182 patients. Most of the children were infected by family members. Fever (43.4%) and dry cough (44.5%) were common symptoms, and gastrointestinal manifestations accounted for 11.0%, including diarrhea, abdominal discomfort, and vomiting. 71.4% had abnormal chest computed tomography (CT) scan images, and typical signs of pneumonia were ground‐glass opacity and local patchy shadowing on admission. Laboratory results were mostly within normal ranges, and only a small ratio of lymphopenia (3.9%) and eosinopenia (29.5%) were observed. The majority (97.8%) of infected children were not severe, and 24 (13.2%) of them had asymptomatic infections. Compared to children without pneumonia (manifested as asymptomatic and acute upper respiratory infection), children with pneumonia were associated with higher percentages of the comorbidity history, symptoms of fever and cough, and increased levels of serum procalcitonin, alkaline phosphatase, and serum interleukins (IL)‐2, IL‐4, IL‐6, IL‐10, and TNF‐α. There were no differences in treatments, duration of hospitalization, time from first positive to first negative nucleic acid testing, and outcomes between children with mild pneumonia and without pneumonia. All the hospitalized COVID‐19 children had recovered except one death due to intussusception and sepsis. In 43 allergic children with COVID‐19, allergic rhinitis (83.7%) was the major disease, followed by drug allergy, atopic dermatitis, food allergy, and asthma. Demographics and clinical features were not significantly different between allergic and nonallergic groups. Allergic patients showed less increase in acute phase reactants, procalcitonin, D‐dimer, and aspartate aminotransferase levels compared with all patients. Immunological profiles including circulating T, B, and NK lymphocyte subsets, total immunoglobulin and complement levels, and serum cytokines did not show any difference in allergic and pneumonia groups. Neither eosinophil counts nor serum total immunoglobulin E (IgE) levels showed a significant correlation with other immunological measures, such as other immunoglobulins, complements, lymphocyte subset numbers, and serum cytokine levels.
Conclusion
Pediatric COVID‐19 patients tended to have a mild clinical course. Patients with pneumonia had higher proportion of fever and cough and increased inflammatory biomarkers than those without pneumonia. There was no difference between allergic and nonallergic COVID‐19 children in disease incidence, clinical features, and laboratory and immunological findings. Allergy was not a risk factor for developing and severity of SARS‐CoV‐2 infection and hardly influenced the disease course of COVID‐19 in children.
Keywords: allergy, children, COVID‐19, lymphocyte subsets, pneumonia, SARS‐CoV‐2
There is no difference between allergic and nonallergic children in clinical features and laboratory/immunological findings, and allergy is not a risk factor for COVID‐19. The majority (97.8%) of infected children were not severe, and 24 (13.2%) of them had asymptomatic infections. Laboratory results were mostly within normal ranges, and only a small ratio of lymphopenia (3.9%) and eosinopenia (29.5%) was observed. Higher proportion of patients with pneumonia have fever, cough, comorbidities, and increased inflammatory biomarkers (procalcitonin, alkaline phosphatase and serum interleukins (IL)‐2, IL‐4, IL‐6, IL‐10, and TNF‐α) than those without pneumonia. Abbreviations: AD, atopic dermatitis; AR, allergic rhinitis; AST, aspartate aminotransferase, AURI, acute upper respiratory infection; COVID‐19, coronavirus disease 2019; DA, drug allergy; FA, food allergy; PCT, procalcitonin; SARS‐CoV‐2, severe acute respiratory syndrome coronavirus 2; TNF, tumor necrosis factor.

Abbreviations
- AD
atopic dermatitis
- AR
allergic rhinitis
- AST
aspartate aminotransferase, AURI, acute upper respiratory infection
- COVID‐19
coronavirus disease 2019
- DA
drug allergy
- FA
food allergy
- PCT
procalcitonin
- SARS‐CoV‐2
severe acute respiratory syndrome coronavirus 2
- TNF
tumor necrosis factor
1. INTRODUCTION
On December 12, 2019, 27 pneumonia cases of unknown cause emerged in Wuhan, Hubei, China. 1 The etiological agent was identified as a novel coronavirus and later renamed as severe acute respiratory syndrome coronavirus 2 (SARS‐CoV‐2) by the International Committee on Taxonomy of Viruses (ICTV). 2 , 3 , 4 Community transmission is now evident, and it is clear that SARS‐CoV‐2 is a highly contagious virus. 5 Until May 9, 2020, the coronavirus disease 2019 (COVID‐19) has wreaked havoc in 210 countries and territories, affected more than 3.8 million cases, and caused 265,862 deaths around the world. 6 SARS‐CoV‐2 infection induces pneumonia, acute respiratory distress syndrome, and death, particularly in vulnerable populations such as elderly adults and those with chronic medical conditions, such as cardiovascular diseases, diabetes, respiratory diseases, hypertension, and malignancy. 7 Knowledge on SARS‐CoV‐2 infection in children is still yet to be fully developed, and only limited studies on pediatric patients are currently available. 8 , 9 , 10 , 11 , 12
According to the Chinese expert consensus on the diagnosis, treatment, and prevention of SARS‐CoV‐2 infection in children (2nd Version), pediatric COVID‐19 cases are classified to five clinical types with different severities: (a) asymptomatic infection; (b) acute upper respiratory infection (AURI); (c) mild pneumonia; (d) severe pneumonia; and (e) critical pneumonia. 13 In contrast to infected adults, most infected children appear to have a milder clinical course. 8 Asymptomatic infections are not uncommon. Despite that the clinical features of COVID‐19 pediatric patients have been established so far, the difference between children with pneumonia and without pneumonia (asymptomatic and AURI), in aspects of clinical features, laboratory findings, immunological changes, and outcomes, was not reported. In addition, the allergy status and the information of the allergic diseases‐related laboratory findings of these patients have not been reported yet. Allergic diseases are common and with increasing prevalence in children. 14 , 15 , 16 Previous studies showed virus infection is one of the triggers for the exacerbation of asthma. 17 However, there was limited information about the association between asthma and coronaviruses infection, especially SARS‐CoV and Middle East respiratory syndrome coronavirus (MERS‐CoV). 18 , 19 Most animal models established for the research of SARS‐CoV and MERS‐CoV are also found less relevant to asthma. 20 On the other hand, atopic sensitization had no effect on the severity of viral pneumonia in children, as shown in a multicenter prospective study, but the history of allergic diseases such as atopic dermatitis, food allergy, and drug allergy was associated with severe pneumonia. 21 In a previous study on 140 adult COVID‐19 cases, allergic diseases and asthma showed much less prevalence compared with population levels, suggesting that allergy is not a predisposing factor for SARS‐CoV‐2 infection. 22
This study aimed to investigate the clinical and laboratory characteristics of hospitalized COVID‐19 pediatric patients, and to reveal the relationship between SARS‐CoV‐2 infection, immune response, and allergic status, with a special focus on disease severity and allergy in patients.
2. METHODS
2.1. Patients' enrollment and data collection
This retrospective study involved hospitalized children with SARS‐CoV‐2 infection, and they were admitted to the Wuhan Children's Hospital from January 28 to February 28, 2020, which was the only designated hospital for treating COVID‐19 patients under 16 years in Wuhan. Children who contacted with confirmed or suspected COVID‐19 cases have undergone confirmatory SARS‐CoV‐2 nucleic acid real‐time reverse transcription‐polymerase chain reaction (RT‐PCR) testing. All of the individuals enrolled in this study were tested positive. The clinical courses and outcomes were followed up until April 30. In consideration of the possible secondary literature and statistical studies that can be performed in the future, 23 it should be noted that part of our cases had been reported concisely in a previous correspondence paper about the main clinical, laboratory, and radiological findings. 8 This study was approved by the institutional ethics board of the Wuhan Children's Hospital (Approval No. WHCH 2 020 003).
Data comprised of demographic information, clinical presentation, medical history and comorbidities, chest computed tomography (CT) images, laboratory results, treatments (medications and oxygen therapy), and outcomes were obtained from the medical records system and checked by two independent researchers. The duration of hospitalization, and the time of RT‐PCR conversion (days from the first positive result to the first negative result of RT‐PCR assays for SARS‐CoV‐2 nucleic acid), were also calculated. In particular, the information of previously diagnosed allergic diseases or related diseases, including allergic rhinitis (AR), asthma, atopic dermatitis (AD), urticaria, and food/drug allergy, and known allergens was collected and reconfirmed by telephone enquiries.
The severity of COVID‐19 was also recorded according to the Chinese expert consensus on the diagnosis, treatment, and prevention of SARS‐CoV‐2 infection in children (2nd Version). 13 Severe cases were identified when meeting one of the following criteria: (a) shortness of breath with increased respiratory rate (RR) except for the influence of fever and crying (RR ≥ 60 breaths per minute for those younger than 2 months, RR ≥ 50 breaths per minute for those aged between 2 and 12 months, RR ≥ 40 breaths per minute for those aged between 1 and 5 years, and RR ≥ 30 breaths per minute for those older than 5 years); (b) oxygen saturation ≤92% at rest; (c) hypoxia with accessory respiration (groaning, flaring of nares, three concave sign), cyanosis, and intermittent apnea; (d) disturbance of consciousness with somnolence and convulsions; (e) food refusal or feeding difficulty, with signs of dehydration; and (f) high‐resolution CT showing bilateral or multilobe involvement, with rapid aggressiveness or pleural effusion. Critical type patients should meet one of the following conditions and admit to intensive care unit (ICU): (a) respiratory failure with mechanical ventilation required; (b) shock; and (c) complications with other organ failures. Patients who only had mild symptoms without pneumonia changes in chest CT images were referred to as the acute upper respiratory infection (AURI) type, and those who had COVID‐19 pneumonia not meeting the above criteria of severe cases were referred to as the mild type. Individuals only positive for SARS‐CoV‐2, without any symptoms or changes in chest CT images, were defined as asymptomatic (inapparent) infection.
2.2. Laboratory testing
Specimens of nasopharyngeal swabs from children younger than 2 years old and throat swabs from children 2 years or older were obtained for detection of SARS‐CoV‐2 nucleic acid using RT‐PCR assay. The testing was performed in the clinical laboratory of the Wuhan Children's Hospital, and the detailed protocol had been described previously. 8
Some routine laboratory results were collected from the clinical testing reports, including the complete blood count (CBC), and serum levels of biomarkers such as inflammatory indicators of C‐reactive protein (CRP) and procalcitonin (PCT), the coagulation index of D‐dimer, the myocardial injury marker of creatine kinase (CK)‐MB, the liver function of alanine aminotransferase (ALT), aspartate aminotransferase (AST) and alkaline phosphatase (ALP), and the renal function of serum creatinine and blood urea nitrogen (BUN). Coinfections were indicated by available detection results of other pathogens, including serological measurements of mycoplasma pneumoniae (MP) and chlamydia pneumoniae (ChP), immunoglobulin M (IgM) against Epstein‐Barr virus (EBV), cytomegalovirus (CMV) and adenovirus (AdV), and nucleic acid testing of influenza A and B viruses in specimens from pharyngeal swabs. Besides, immunological parameters were collected in detail, including total immunoglobulins (IgG, IgA, IgM, and IgE), complements (C3 and C4), peripheral blood CD4+ and CD8+ T, B, and NK lymphocyte subset count, and concentration of serum cytokines including interleukin (IL)‐2, interleukin‐4, interleukin‐6, and interleukin‐10, tumor necrosis factor (TNF)‐α, and interferon (IFN)‐γ.
2.3. Statistical analyses
Continuous variables were described through median and interquartile range (IQR) values, and categorical variables were presented as frequencies and percentages (%). Two‐tailed t test and Mann‐Whitney U test were used, as appropriate, to compare the data from two groups. The rates of categorical parameters in two different groups were compared by the chi‐square test and Fisher's exact test, as appropriate. Spearman's correlation test was applied for calculation of the correlation coefficients between different variables. A test with p value of less than 0.05 was considered statistically significant. All statistical analyses were performed by GraphPad Prism 8 (GraphPad Software Company).
3. RESULTS
3.1. Demographics and clinical characteristics
A total of 182 hospitalized pediatric COVID‐19 patients with confirmed RT‐PCR assays and available data were included in this study, and the demographics and clinical features are summarized in Table 1. The median age was 6 years, ranging from 3 days‐15 years. About the half (48.4%) were preschool children, and the majority (83.5%) were 10 years and younger. There were more boys who got infected, with the male‐female ratio of nearly 2:1. Most of the children were infected through family members, such as parents and/or grandparents. Forty‐three children had the history of allergic diseases, including AR, asthma, AD, food allergy, drug allergy, and urticaria. Other preexisting diseases included repetitive or annual pneumonia, frequent colds, adenoid hypertrophy, and tonsillitis (Table 2).
Table 1.
Demographics and clinical features of pediatric patients with COVID‐19
|
All patients (n = 182) |
Allergic patients (n = 43) |
Nonallergic patients (n = 139) |
P value | |
|---|---|---|---|---|
| Age | ||||
| Median (range), years | 6.00 (0.01‐15.00) | 7.00 (0.23‐15.00) | 6.00 (0.01‐15.00) | .072 |
| Age groups, No. (%) | ||||
| <1 y | 30 (16.5) | 3 (7.0) | 27 (19.4) | .135 |
| 1‐5 y | 58 (31.9) | 14 (32.6) | 44 (31.7) | ‐ |
| 6‐10 y | 64 (35.2) | 17 (39.5) | 47 (33.8) | ‐ |
| 11‐15 y | 30 (16.5) | 9 (20.9) | 21 (15.1) | ‐ |
| Sex, No. (%) | ||||
| Female | 62 (34.1) | 12 (27.9) | 50 (36.0) | .330 |
| Male | 120 (65.9) | 31 (72.1) | 89 (64.0) | ‐ |
| Contact history, No. (%) | ||||
| Family cluster | 178 (97.8) | 42 (97.7) | 136 (97.8) | .948 |
| Unidentified source of infection | 4 (2.2) | 1 (2.3) | 3 (2.2) | ‐ |
| Medical history except allergic diseases, No. (%) | 32 (17.6) | 8 (18.6) | 24 (17.3) | .840 |
| Symptom, No. (%) | ||||
| Fever | 79 (43.4) | 18 (41.9) | 61 (43.9) | .815 |
| Cough | 81 (44.5) | 16 (37.2) | 65 (46.8) | .271 |
| Chest tightness | 3 (1.6) | 2 (4.7) | 1 (0.7) | .139 |
| Short of breath | 2 (1.1) | 0 (0) | 2 (1.4) | 1.000 |
| Fatigue | 5 (2.7) | 1 (2.3) | 4 (2.9) | 1.000 |
| Gastrointestinal symptoms | 20 (11.0) | 3 (7.0) | 17 (12.2) | .415 |
| Diarrhea | 9 (4.9) | 1 (2.3) | 8 (5.8) | .688 |
| Abdominal pain/discomfort | 7 (3.8) | 1 (2.3) | 6 (4.3) | 1.000 |
| Vomiting | 7 (3.8) | 1 (2.3) | 6 (4.3) | 1.000 |
| No symptom | 55 (30.2) | 17 (39.5) | 38 (27.3) | .128 |
| Chest CT images, No. (%) | ||||
| Normal | 52 (28.6) | 11 (25.6) | 41 (29.5) | .619 |
| Abnormal | 130 (71.4) | 32 (74.4) | 98 (70.5) | ‐ |
| Bilateral lung | 57 (31.3) | 13 (30.2) | 44 (31.7) | .672 |
| Unilateral lung | 73 (40.1) | 19 (44.2) | 54 (38.8) | ‐ |
| Type of lesions | ||||
| GGO | 51 (28.0) | 16 (37.2) | 35 (25.2) | .125 |
| Patchy shadowing | 50 (27.5) | 15 (34.9) | 35 (25.2) | .213 |
| Stripe shadowing | 7 (3.8) | 3 (7.0) | 4 (2.9) | .358 |
| Consolidation | 3 (1.6) | 1 (2.3) | 2 (1.4) | .557 |
| Interstitial abnormalities | 2 (1.1) | 0 (0) | 2 (1.4) | 1.000 |
| Bronchitis | 1 (0.5) | 0 (0) | 1 (0.7) | 1.000 |
| Pleural effusion | 1 (0.5) | 0 (0) | 1 (0.7) | 1.000 |
| Treatment, No. (%) | ||||
| Inhalation of interferon‐α | 178 (97.8) | 42 (97.7) | 136 (97.8) | .948 |
| Ganciclovir | 4 (2.2) | 3 (7.0) | 1 (0.7) | .042 |
| Arbidol | 3 (1.6) | 2 (4.7) | 1 (0.7) | .139 |
| Oseltamivir | 1 (0.5) | 0 (0) | 1 (0.7) | 1.000 |
| Ribavirin | 1 (0.5) | 0 (0) | 1 (0.7) | 1.000 |
| Antibiotic | 39 (21.4) | 7 (16.3) | 32 (23.0) | .346 |
| Budesonide inhalation | 4 (2.2) | 0 (0) | 4 (2.9) | .574 |
| Supplemental oxygen | 5 (2.7) | 1 (2.3) | 4 (2.9) | 1.000 |
| Intravenous immunoglobulin | 3 (1.6) | 0 (0) | 3 (2.2) | 1.000 |
| Systemic glucocorticoid | 3 (1.6) | 0 (0) | 3 (2.2) | 1.000 |
| Montelukast | 2 (1.1) | 2 (4.7) | 0 (0) | .055 |
| Oral traditional Chinese medicine | 12 (6.6) | 1 (2.3) | 11 (7.9) | .299 |
| Severity, No. (%) | ||||
| Asymptomatic infection | 24 (13.2) | 7 (16.3) | 17 (12.2) | .512 |
| AURI type | 30 (16.5) | 4 (9.3) | 26 (18.7) | ‐ |
| Mild type | 124 (68.1) | 31 (72.1) | 93 (66.9) | ‐ |
| Severe and critical type | 4 (2.2) | 1 (2.3) | 3 (2.2) | ‐ |
| Outcome, No. (%) | ||||
| Recovery | 181 (99.5) | 43 (100) | 138 (99.3) | .577 |
| Death | 1 (0.5) | 0 (0) | 1 (0.7) | ‐ |
| Duration of hospitalization, Median (IQR), days | 12 (9‐15) | 12 (8‐15) | 12 (9‐15) | .333 |
| Days from positive to negative RT‐PCR assays, Median (IQR), days | 7 (5‐11) | 6 (5‐10) | 7 (5‐11) | .578 |
Abbreviations: AURI, acute upper respiratory infection; COVID‐19, coronavirus disease 2019; GGO, ground‐glass opacity; IQR, interquartile range; P values denote the comparison between allergic and nonallergic subgroups; RT‐PCR, real‐time reverse transcription‐polymerase chain reaction.
P values in bold font are less than 0.05, with statistically significant.
Table 2.
Comorbidities and medical history of pediatric patients with COVID‐19 in detail
| Allergic patients (n = 43) | Nonallergic patients (n = 139) | ||
|---|---|---|---|
| Allergic diseases, No. (%) | Medical history, No. (%) | 24 (17.3) | |
| Allergic rhinitis (AR) | 28 (65.1) | Pneumonia | 2 (1.4) |
| Atopic dermatitis (AD) | 3 (7.0) | Wheezing | 2 (1.4) |
| Drug allergy | 3 (7.0) | Acute lymphocytic leukemia | 2 (1.4) |
| AR + drug allergy | 5 (11.6) | Fatty liver | 2 (1.4) |
| AR + AD | 1 (2.3) | Pneumonia, wheezing | 1 (0.7) |
| AR + food allergy | 1 (2.3) | Frequent upper respiratory infections, wheezing | 1 (0.7) |
| AR + food allergy + drug allergy | 1 (2.3) | Tonsillitis | 1 (0.7) |
| Asthma + urticaria +drug allergy | 1 (2.3) | Adenoid hypertrophy and adenoidectomy; otitis media | 1 (0.7) |
| Tonsillectomy and adenoidectomy | 1 (0.7) | ||
| Reported allergen, No. (%) | Appendicitis and appendectomy | 1 (0.7) | |
| Dust mite | 1 (2.3) | Palatoschisis | 1 (0.7) |
| Egg | 1 (2.3) | Kidney disease | 1 (0.7) |
| Mango | 1 (2.3) | Cerebral palsy | 1 (0.7) |
| Penicillin | 10 (23.3) | Febrile convulsion | 1 (0.7) |
| Febrile convulsion, wheezing | 1 (0.7) | ||
| Other medical history, No. (%) | 8 (18.6) | Nodal tachycardia | 1 (0.7) |
| Repetitive or annual pneumonia | 4 (9.3) | Atrial septal defect cured by intervention | 1 (0.7) |
| Frequent upper respiratory infections | 2 (4.7) | Traumatic brain injury | 1 (0.7) |
| Adenoid hypertrophy | 1 (2.3) | Intestinal pneumatosis and effusion | 1 (0.7) |
| Adenoid hypertrophy, otitis media | 1 (2.3) | Herpesviral encephalitis and secondary epilepsy | 1 (0.7) |
Abbreviation: COVID‐19, coronavirus disease 2019.
Although the common symptoms in pediatric COVID‐19 patients were fever (43.4%) and dry cough (44.5%), almost one third (30.2%) of these children were asymptomatic. In addition, gastrointestinal symptoms accounted for a perceptible proportion (11.0%), such as diarrhea, abdominal discomfort, and vomiting. The most (97.8%) of pediatric infections were not severe. Besides the essential supportive care, inhalation of interferon‐α was the most common treatment. Systemic antiviral agents, such as ganciclovir and arbidol, were much less used. In 39 (21.4%) cases, antibiotics such as cephalosporins and azithromycin were employed. Few severe/critical patients received intravenous immunoglobulin (1.6%), systemic glucocorticoids (1.6%), and supplemental oxygen (2.7%). Three critically ill patients were also received mechanical ventilation. All the hospitalized children with COVID‐19 had recovered except one death. The median duration of hospitalization was 12 days, and that the time from first positive to first negative RT‐PCR was 7 days. Both the duration of hospitalization and the time of RT‐PCR negative conversion were not significantly different between the different subgroups, such as allergic vs nonallergic patients, pneumonia vs no pneumonia, and younger vs older children (Figure 1).
Figure 1.
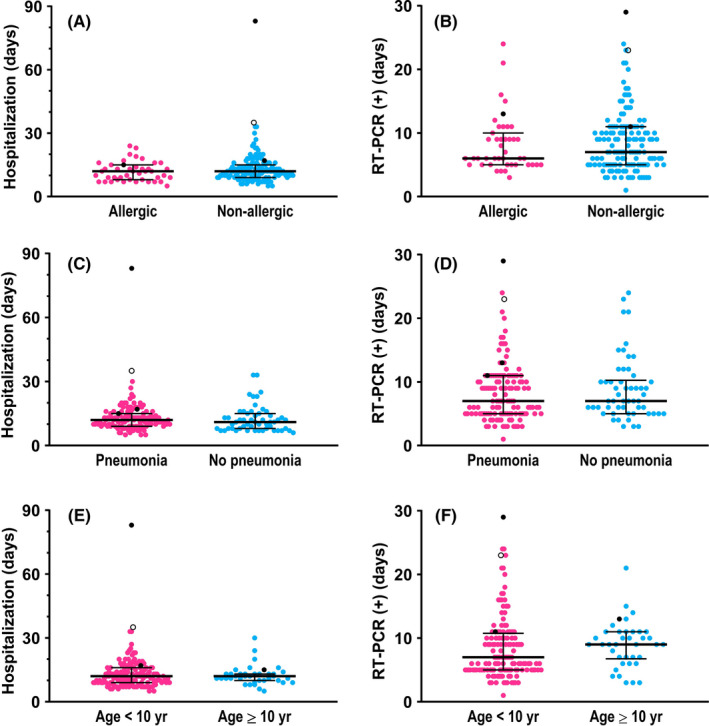
The comparisons in the duration of hospitalization and the time of negative conversion of RT‐PCR assays for SARS‐CoV‐2 nucleic acid, respectively, between the following COVID‐19 subgroups: (A, B), allergic and nonallergic patients; (C, D), no pneumonia and mild pneumonia patients; and (E, F), patients aged <10 years and ≥10 years. In each graph, the dots denote each of the numerical values, the middle long lines denote medians, and bilateral short lines denote interquartile ranges. In particular, the black dots denote the numerical values of three severe/critical cases, and the hollow black dot denotes those of one dead case. Details of these four severe or critically ill patients are presented in Table 7. All of the comparisons were not significantly different (P > .05). RT‐PCR, real‐time reverse transcription‐polymerase chain reaction. (+), positive
3.2. Radiological and laboratory findings
The chest CT results of all involved children were obtained on admission, and 130 (71.4%) had abnormal images, of which 57 (43.8%) appeared in both lungs, and the rest (56.2%) in unilateral lung. The common signs of pneumonia in chest CT scans were ground‐glass opacities (GGO) and local patchy shadowing (Figure 2), with the incidence of 28.0% and 27.5%, respectively, whereas the pulmonary consolidation was much less (1.6%). It was worth noting that there were also 52 (28.6%) infected children without any changes in chest CT images. Thus, the concurrence of normal chest CT scan and no symptom contributed to 24 cases of asymptomatic infection, in the ratio of 13.2% (Table 1).
Figure 2.
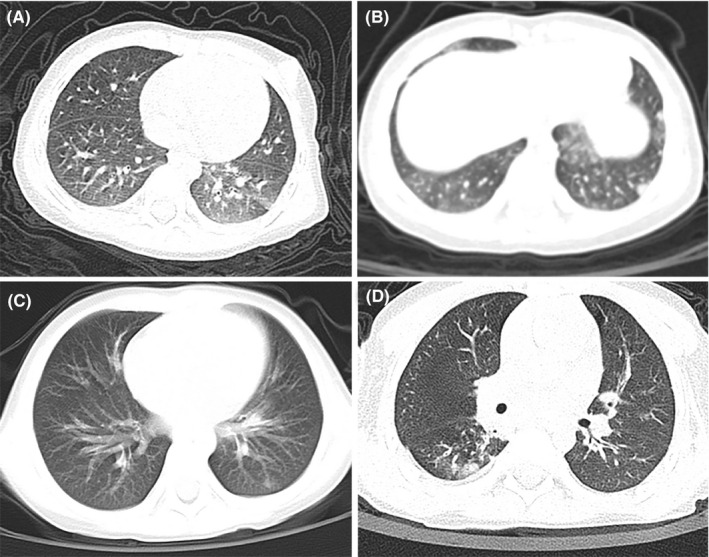
Typical chest CT images of pediatric COVID‐19 patients. A, A 11‐month‐old nonallergic female, with chest CT showing ground‐glass opacity in left lower lobe; B, a 1‐year‐old nonallergic male, with chest CT showing bilateral ground‐glass opacities and subpleural nodular consolidation; C, a 4‐year‐old boy with a history of allergic rhinitis, and his chest CT showed patchy opacities in left lower lobe; D, a 3‐year‐old boy with a history of allergic rhinitis and recurrent wheezing, and his chest CT showed patchy opacity distributed around the bronchovascular bundle in right lower lobe
The median values of laboratory results were mostly within normal ranges, and the details are listed in Tables 3 and 4. The rates of decreased count and percentage of lymphocytes were 3.9% and 34.6%, respectively; those of eosinophils were 29.5% and 18.8%, respectively. Other findings in differential of white blood cells included increased and decreased neutrophil percentage (27.4% and 24.0%), and increased monocyte percentage (33.3%). Although the levels of PCT and CK‐MB elevated in almost the half (both 47.5%), they changed slightly and had no clinical significance. The majority (33/39, 84.6%) of identified possible coinfected pathogen was mycoplasma pneumoniae (MP), and the other tested pathogens were much less identified. With a further analysis of the subgroup of possible coinfection with MP, GGO in chest CT images was less found (21.1% vs 31.5%, P = .025), azithromycin was more used (12.1% vs 1.3%, P = .01), and decreased monocyte count was more common (26.1% vs 5.2%, P = .005). Possible MP coinfection had no influence on serum levels of inflammatory indicators, such as CRP, PCT and D‐dimer. In addition, there was no difference in the prevalence of allergic diseases between children possibly coinfected with MP or not (Tables S1 and S2).
Table 3.
Laboratory results of pediatric patients with COVID‐19
|
All patients (n = 182) |
Allergic patients (n = 43) |
Nonallergic patients (n = 139) |
P value | |
|---|---|---|---|---|
| Blood cells count (Unit; reference range) | ||||
| Leukocytes (×10^9/L; <3 y, 5.5‐12.0; ≥3 y, 4.0‐10.5) | 6.52 (5.38‐8.09) | 6.14 (5.38‐7.87) | 6.60 (5.38‐8.40) | .383 |
| Increased | 12/182 (6.6) | 4/43 (9.3) | 8/139 (5.8) | .482 |
| Decreased | 17/182 (9.3) | 3/43 (7.0) | 14/139 (10.1) | .766 |
| Neutrophils (×10^9/L; 1.08‐5.90) | 2.37 (1.83‐3.60) | 2.55 (2.00‐3.34) | 2.30 (1.74‐3.65) | .489 |
| Increased | 14/179 (7.8) | 2/43 (4.7) | 12/136 (8.8) | .523 |
| Decreased | 12/179 (6.7) | 1/43 (2.3) | 11/136 (8.1) | .298 |
| Neutrophil percentage (%; 31.0‐52.0) | 42.8 (32.4‐53.1) | 44.6 (34.9‐51.9) | 41.6 (29.7‐54.7) | .402 |
| Increased | 49/179 (27.4) | 10/43 (23.3) | 39/136 (28.7) | .487 |
| Decreased | 43/179 (24.0) | 7/43 (16.3) | 36/136 (26.5) | .173 |
| Lymphocytes (×10^9/L; 1.15‐6.00) | 2.87 (2.10‐4.28) | 2.69 (1.95‐3.38) | 2.94 (2.14‐4.53) | .237 |
| Increased | 18/179 (10.1) | 5/43 (11.6) | 13/136 (9.6) | .772 |
| Decreased | 7/179 (3.9) | 1/43 (2.3) | 6/136 (4.4) | 1.000 |
| Lymphocyte percentage (%; 40.0‐70.0) | 46.1 (35.9‐58.1) | 44.7 (35.2‐55.8) | 47.5 (36.0‐58.8) | .314 |
| Increased | 22/179 (12.3) | 4/43 (9.3) | 18/136 (13.2) | .494 |
| Decreased | 62/179 (34.6) | 16/43 (37.2) | 46/136 (33.8) | .684 |
| Monocytes (×10^9/L; 0.26‐2.40) | 0.45 (0.35‐0.65) | 0.45 (0.33‐0.63) | 0.45 (0.36‐0.69) | .836 |
| Increased | 1/138 (0.7) | 1/43 (2.3) | 0/95 (0) | .312 |
| Decreased | 12/138 (8.7) | 4/43 (9.3) | 8/95 (8.4) | 1.000 |
| Monocyte percentage (%; 2.0‐8.8) | 7.0 (5.9‐9.9) | 6.8 (5.2‐9.5) | 7.0 (6.1‐10.0) | .568 |
| Increased | 46/138 (33.3) | 13/43 (30.2) | 33/95 (34.7) | .603 |
| Decreased | 1/138 (0.7) | 0/43 (0) | 1/95 (1.1) | 1.000 |
| Eosinophils (×10^9/L; 0.05‐0.50) | 0.10 (0.04‐0.20) | 0.06 (0.03‐0.11) | 0.11 (0.05‐0.22) | .020 |
| Increased | 6/112 (5.4) | 2/43 (4.7) | 4/69 (5.8) | 1.000 |
| Decreased | 33/112 (29.5) | 16/43 (37.2) | 17/69 (24.6) | .156 |
| Eosinophil percentage (%; 0.5‐5.0) | 1.5 (0.6‐2.8) | 1.1 (0.4‐2.1) | 1.7 (0.7‐3.3) | .057 |
| Increased | 5/112 (4.5) | 1/43 (2.3) | 4/69 (5.8) | .647 |
| Decreased | 21/112 (18.8) | 11/43 (25.6) | 10/69 (14.5) | .144 |
| Platelets (×10^9/L; 100‐378) | 267.5 (211.0‐337.3) | 242.0 (207.0‐304.0) | 270.0 (212.0‐342.0) | .301 |
| Increased | 24/182 (13.2) | 2/43 (4.7) | 22/139 (15.8) | .058 |
| Decreased | 2/182 (1.1) | 0/43 (0) | 2/139 (1.4) | 1.000 |
| Biochemical parameters (Unit; reference range) | ||||
| C‐reactive protein (mg/L; 0.0‐8.0) | 1.00 (0.75‐5.00) | 1.00 (0.75‐4.20) | 1.00 (0.75‐5.00) | .361 |
| Increased | 25/178 (14.0) | 6/43 (14.0) | 19/135 (14.1) | .984 |
| Procalcitonin (ng/ml; 0.00‐0.05) | 0.05 (0.04‐0.08) | 0.05 (0.03‐0.06) | 0.06 (0.04‐0.08) | .035 |
| Increased | 75/158 (47.5) | 14/38 (36.8) | 61/120 (50.8) | .132 |
| D‐dimer (mg/L; 0.00‐0.55) | 0.190 (0.123‐0.328) | 0.150 (0.100‐0.210) | 0.210 (0.150‐0.355) | <.001 |
| Increased | 11/144 (7.6) | 0/35 (0) | 11/109 (10.1) | .066 |
| Alanine aminotransferase (U/L; 9‐60) | 14.0 (11.0‐22.75) | 13.0 (10.0‐21.0) | 15.0 (11.0‐24.0) | .273 |
| Increased | 9/180 (5.0) | 2/43 (4.7) | 7/137 (5.1) | 1.000 |
| Aspartate aminotransferase (U/L; 10‐50) | 30.0 (24.0‐41.0) | 25.0 (23.0‐33.0) | 30.0 (24.0‐43.0) | .032 |
| Increased | 24/180 (13.3) | 3/43 (7.0) | 21/137 (15.3) | .160 |
| Alkaline phosphatase (U/L; 108‐317) | 194.0 (159.0‐247.0) | 192.0 (164.0‐234.0) | 198.0 (158.0‐250.0) | .916 |
| Increased | 11/174 (6.3) | 2/43 (4.7) | 9/131 (6.9) | 1.000 |
| Creatine kinase‐MB (U/L; 0‐25) | 24.0 (18.0‐36.0) | 24.0 (19.0‐34.0) | 25.0 (18.0‐37.0) | .485 |
| Increased | 84/177 (47.5) | 17/41 (41.5) | 67/136 (49.3) | .381 |
| Creatinine (μmol/L; <1 y, 18.0‐35.0; ≥ 1 y, 27.0‐62.0) | 33.1 (25.9‐42.0) | 35.6 (28.0‐42.2) | 32.2 (25.7‐42.0) | .301 |
| Increased | 9/178 (5.1) | 2/43 (4.7) | 7/135 (5.2) | 1.000 |
| Blood urea nitrogen (mmol/L; 2.9‐7.1) | 4.29 (3.30‐4.91) | 4.50 (3.71‐5.17) | 4.12 (3.20‐4.90) | .056 |
| Increased | 4/178 (2.2) | 1/43 (2.3) | 3/135 (2.2) | 1.000 |
| Coinfection with other pathogens | 39/175 (22.3) | 11/43 (25.6) | 28/132 (21.2) | .550 |
| Mycoplasma pneumoniae | 33/175 (18.9) | 8/43 (18.6) | 25/132 (18.9) | .961 |
| Chlamydia pneumoniae | 0/175 (0) | 0/43 (0) | 0/132 (0) | ‐ |
| Epstein‐Barr virus | 2/175 (1.1) | 0/43 (0) | 2/132 (1.5) | 1.000 |
| Cytomegalovirus | 6/175 (3.4) | 3/43 (7.0) | 3/132 (2.3) | .159 |
| Adenovirus | 1/175 (0.6) | 1/43 (2.3) | 0/132 (0) | .246 |
| Influenza A virus | 0/175 (0) | 0/43 (0) | 0/132 (0) | – |
| Influenza B virus | 1/175 (0.6) | 0/43 (0) | 1/132 (0.8) | 1.000 |
Measurements of laboratory parameters are shown as median (IQR), and proportions of changes are shown as fractions and percentages, that is, No./total available No. (%).
Abbreviations: COVID‐19, coronavirus disease 2019; IQR, interquartile range; P values denote the comparison between allergic and nonallergic subgroups.
P values in bold font are less than 0.05, with statistically significant.
Table 4.
Immunological parameters of pediatric patients with COVID‐19
|
All patients (n = 182) |
Allergic patients (n = 43) |
Nonallergic patients (n = 139) |
P value | |
|---|---|---|---|---|
| Immunological parameters (Unit; reference range) | ||||
| IgE (IU/L; <1 y, 0‐15; 1‐3 y, 0‐60; 3‐10 y, 0‐90; >10 y, 0‐200) | 32.90 (11.90‐122.00) | 46.30 (17.35‐213.50) | 28.75 (11.15‐102.30) | .048 |
| Increased | 48/149 (32.2) | 14/33 (42.4) | 34/116 (29.3) | .155 |
| IgG (g/L; <1 y, 3.58‐10.69; 1‐5 y, 4.00‐10.39; 5‐10 y, 5.00‐10.60; >10 y, 5.96‐13.64) | 8.95 (6.65‐11.00) | 9.35 (7.84‐11.00) | 8.73 (5.95‐11.00) | .186 |
| Increased | 30/161 (18.6) | 7/36 (19.4) | 23/125 (18.4) | .887 |
| Decreased | 14/161 (8.7) | 2/36 (5.6) | 12/125 (9.6) | .737 |
| IgA (g/L; <1 y, 0.11‐1.06; 1‐5 y, 0.28‐1.08; 5‐10 y, 0.36‐1.72;> 10 y , 0.33‐1.78) | 1.07 (0.49‐1.69) | 1.21 (0.83‐1.72) | 0.96 (0.38‐1.69) | .082 |
| Increased | 39/161 (24.2) | 9/36 (25) | 30/125 (24) | .902 |
| Decreased | 5/161 (3.1) | 1/36 (2.8) | 4/125 (3.2) | 1.000 |
| IgM (g/L; <1 y , 0.33‐1.26; 1‐5 y , 0.42‐1.73; 5‐10 y , 0.44‐2.07;> 10 y , 0.52‐2.42) | 0.95 (0.64‐1.22) | 1.07 (0.84‐1.31) | 0.90 (0.62‐1.20) | .094 |
| Increased | 1/161 (0.6) | 0/36 (0) | 1/125 (0.8) | 1.000 |
| Decreased | 6/161 (3.7) | 0/36 (0) | 6/125 (4.8) | .339 |
| Complement C3 (g/L; < 5 y , 0.70‐1.12; ≥ 5 y , 0.80‐1.26) | 0.90 (0.81‐1.05) | 0.89 (0.82‐1.02) | 0.90 (0.79‐1.06) | .980 |
| Increased | 20/161 (12.4) | 7/36 (19.4) | 13/125 (10.4) | .158 |
| Decreased | 30/161 (18.6) | 5/36 (13.9) | 25/125 (20) | .407 |
| Complement C4 (g/L; < 5 y , 0.10‐0.38; ≥5 y , 0.10‐0.40) | 0.20 (0.14‐0.28) | 0.21 (0.13‐0.26) | 0.20 (0.14‐0.28) | .776 |
| Increased | 6/161 (3.7) | 2/36 (5.6) | 4/125 (3.2) | .616 |
| Decreased | 7/161 (4.3) | 2/36 (5.6) | 5/125 (4.0) | .654 |
| Lymphocyte subsets | ||||
| T cells (/μL; 805‐4459) | 2206 (1732‐3142) | 2056 (1864‐2826) | 2280 (1717‐3434) | .292 |
| Increased | 15/142 (10.6) | 2/35 (5.7) | 13/107 (12.1) | .359 |
| Decreased | 3/142 (2.1) | 0/35 (0) | 3/107 (2.8) | 1.000 |
| T‐cell percentage (%; 38.56‐70.06) | 68.87 (66.12‐73.98) | 69.34 (67.19‐75.57) | 68.82 (65.91‐73.92) | .282 |
| Increased | 61/142 (43.0) | 16/35 (45.7) | 45/107 (42.1) | .704 |
| Decreased | 2/142 (1.4) | 0/35 (0) | 2/107 (1.9) | 1.000 |
| CD4+ T cells (/μL ; 345‐2350) | 1102 (763‐1691) | 1066 (731‐1368) | 1143 (802‐1767) | .273 |
| Increased | 16/142 (11.3) | 2/35 (5.7) | 14/107 (13.1) | .357 |
| Decreased | 3/142 (2.1) | 0/35 (0) | 3/107 (2.8) | 1.000 |
| CD4+ T‐cell percentage (%; 14.21‐36.99) | 34.92 (31.71‐38.60) | 34.39 (32.28‐37.63) | 35.10 (31.07‐39.84) | .595 |
| Increased | 52/142 (36.6) | 9/35 (25.7) | 43/107 (40.2) | .123 |
| Decreased | 2/142 (1.4) | 0/35 (0) | 2/107 (1.9) | 1.000 |
| CD8+ T cells (/μL ; 314‐2080) | 995 (688‐1280) | 1018 (733‐1248) | 971 (680‐1281) | .813 |
| Increased | 8/142 (5.6) | 2/35 (5.7) | 6/107 (5.6) | 1.000 |
| Decreased | 3/142 (2.1) | 0/35 (0) | 3/107 (2.8) | 1.000 |
| CD8+ T‐cell percentage (%; 13.24‐38.53) | 28.27 (23.99‐32.78) | 30.21 (25.77‐34.92) | 26.96 (23.18‐32.39) | .050 |
| Increased | 11/142 (7.7) | 4/35 (11.4) | 7/107 (6.5) | .465 |
| Decreased | 1/142 (0.7) | 0/35 (0) | 1/107 (0.9) | 1.000 |
| B cells (/μL ; 240‐1317) | 576 (369‐828) | 553 (362‐696) | 599 (379‐891) | .238 |
| Increased | 17/142 (12.0) | 1/35 (2.9) | 16/107 (15.0) | .072 |
| Decreased | 7/142 (4.9) | 0/35 (0) | 7/107 (6.5) | .194 |
| B‐cell percentage (%; 10.86‐28.03) | 18.7 (13.99‐23.10) | 18.15 (14.02‐20.86) | 18.75 (13.88‐23.33) | .527 |
| Increased | 6/142 (4.2) | 0/35 (0) | 6/107 (5.6) | .336 |
| Decreased | 9/142 (6.3) | 2/35 (5.7) | 7/107 (6.5) | 1.000 |
| NK cells (/μL ; no reference range) | 276 (186‐469) | 262 (204‐381) | 286 (175‐507) | .525 |
| NK cell percentage (%; no reference range) | 9.08 (5.68‐14.76) | 9.08 (5.97‐11.85) | 9.07 (5.40‐15.17) | .982 |
| Cytokines | ||||
| IL‐2 (pg/mL; 0.0‐11.4) | 1.46 (1.24‐1.67) | 1.42 (1.24‐1.67) | 1.46 (1.23‐1.70) | .813 |
| Increased | 0/117 (0) | 0/29 (0) | 0/88 (0) | – |
| IL‐4 (pg/mL; 0.0‐12.9) | 2.66 (2.17‐3.51) | 2.72 (2.23‐3.71) | 2.65 (2.12‐3.37) | .752 |
| Increased | 1/117 (0.9) | 0/29 (0) | 1/88 (1.1) | 1.000 |
| IL‐6 (pg/mL; 0.0‐20.9) | 3.74 (2.95‐6.24) | 3.53 (2.66‐5.24) | 3.78 (2.99‐6.83) | .177 |
| Increased | 7/117 (6.0) | 0/29 (0) | 7/88 (8.0) | .191 |
| IL‐10 (pg/mL; 0.0‐5.9) | 3.79 (3.28‐5.24) | 3.60 (3.25‐4.71) | 3.84 (3.29‐5.60) | .253 |
| Increased | 22/117 (18.8) | 2/29 (6.9) | 20/88 (22.7) | .058 |
| TNF‐α (pg/mL; 0.0‐5.5) | 1.70 (1.23‐2.05) | 1.73 (1.25‐2.00) | 1.66 (1.22‐2.07) | .705 |
| Increased | 5/117 (4.3) | 1/29 (3.4) | 4/88 (4.5) | 1.000 |
| Interferon‐γ (pg/mL; 0.0‐17.3) | 3.11 (2.40‐4.50) | 3.17 (2.64‐4.21) | 3.06 (2.21‐4.54) | .729 |
| Increased | 5/117 (4.3) | 0/29 (0) | 5/88 (5.7) | .330 |
Measurements of laboratory parameters are shown as median (IQR), and proportions of changes are shown as fractions and percentages, that is, No./total available No. (%).
Abbreviations: CD, cluster of differentiation; COVID‐19, coronavirus disease 2019; Ig, immunoglobulin; IL, interleukin; IQR, interquartile range; NK, natural killer (cells); P values denote the comparison between allergic and nonallergic subgroups; TNF, tumor necrosis factor.
3.3. Allergic and immune status of children with SARS‐CoV‐2 infection
As shown in Table 2, the most common allergic disease was allergic rhinitis (36, 83.7%), followed by atopic dermatitis, food allergy, asthma, and urticaria. Only one child, a 13‐year‐old boy, was previously diagnosed with asthma. Ten (23.3%) children had self‐reported allergy to drugs, all of which were penicillin. Among allergic children, 9 (20.9%) had more than one kind of allergic diseases. Other few reported allergens included dust mites, eggs, and mangos, each in one child.
In comparison with COVID‐19–related measurements between allergic and nonallergic children, no statistical difference was found in the demographics, clinical features, and disease course (Table 1). Blood cell counts and biochemical results were mostly similar between two groups, except that eosinophils counts, and serum levels of PCT, D‐dimer and AST were lower in allergic group (P < .05), but these measurements were all in normal ranges, without clinical relevance (Table 3).
Serum total IgE level of allergic children was higher than that of nonallergic individuals (median, 46.30 vs 28.75, unit of IU/mL, P = .048), and allergic children had greater percentage of increased IgE (42.4% vs 29.3%, P = .155) without statistical difference. In general, all of the tested immunological parameters were not different between these two groups (P > .05), including immunoglobulins, complements, and cytokines (Table 4).
The lymphocyte subsets were not found significantly different between the allergic and nonallergic COVID‐19 children (Table 4), as well as between patients with and without pneumonia (Table 6). The results of correlation analysis between immunological parameters are displayed in Figure 3. There appeared three clusters of correlations. The first one is lymphocyte, total T cells, CD4+ and CD8+ T cells, and B cells and NK cells. This correlation was relatively strong in all patients including the allergic group and pneumonia group. The second correlation was in total IgG, IgM, IgA, IgE, C3, and C4 levels. It was relatively stronger in the pneumonia group, whereas the correlations within this cluster decreased in the allergy group. Immunoglobulin levels and lymphocyte subsets showed a negative correlation within all patients and pneumonia group. The third cluster was between the analyzed cytokines, which showed a stronger correlation between each other in pneumonia group. In addition, the duration of hospitalization was positively correlated with the time of RT‐PCR conversion, but these two temporal indices had no significant correlation with immunological and inflammatory measurements, except for the slightly negative correlation between the duration of hospitalization and the level of IFN‐γin patients with pneumonia (r = −0.276) (Figure 4).
Table 6.
Laboratory and immunological results of pediatric COVID‐19 patients without pneumonia and with pneumonia (mild)
|
No pneumonia (n = 54) |
Mild pneumonia (n = 124) |
P value | |
|---|---|---|---|
| Blood cells count (Unit; reference range) | |||
| Leukocytes (×109/L; < 3 y , 5.5‐12.0; ≥3 y , 4.0‐10.5) | 6.14 (5.34‐7.56) | 6.72 (5.39‐8.81) | .217 |
| Increased | 3/54 (5.6) | 9/124 (7.3) | 1.000 |
| Decreased | 3/54 (5.6) | 13/124 (10.5) | .398 |
| Neutrophils (×109/L; 1.08‐5.90) | 2.26 (1.89‐3.21) | 2.49 (1.83‐3.72) | .449 |
| Increased | 5/53 (9.4) | 8/122 (6.6) | .537 |
| Decreased | 4/53 (7.5) | 6/122 (4.9) | .493 |
| Neutrophil percentage (%; 31.0‐52.0) | 39.4 (32.7‐51.0) | 44.2 (30.5‐53.9) | .410 |
| Increased | 13/53 (24.5) | 35/122 (28.7) | .571 |
| Decreased | 11/53 (20.8) | 31/122 (25.4) | .508 |
| Lymphocytes (×10^9/L; 1.15‐6.00) | 2.88 (2.37‐3.45) | 2.81 (1.93‐4.47) | .653 |
| Increased | 3/52 (5.8) | 15/123 (12.2) | .201 |
| Decreased | 1/52 (1.9) | 5/123 (4.1) | .671 |
| Lymphocyte percentage (%; 40.0‐70.0) | 48.3 (38.8‐58.8) | 45.3 (35.2‐57.1) | .283 |
| Increased | 5/52 (9.6) | 16/123 (13.0) | .528 |
| Decreased | 13/52 (25.0) | 47/123 (38.2) | .092 |
| Monocytes (×10^9/L; 0.26‐2.40) | 0.39 (0.28‐0.60) | 0.55 (0.38‐0.69) | .007 |
| Increased | 0/39 (0) | 1/95 (1.1) | 1.000 |
| Decreased | 6/39 (15.4) | 4/95 (4.2) | .063 |
| Monocyte percentage (%; 2.0‐8.8) | 6.8 (5.5‐8.7) | 8.1 (6.2‐10.5) | .053 |
| Increased | 9/39 (23.1) | 36/95 (37.9) | .099 |
| Decreased | 0/39 (0) | 0/95 (0) | ‐ |
| Eosinophils (×10^9/L; 0.05‐0.50) | 0.10 (0.04‐0.22) | 0.10 (0.03‐0.15) | .396 |
| Increased | 3/38 (7.9) | 3/72 (4.2) | .414 |
| Decreased | 10/38 (26.3) | 22/72 (30.6) | .642 |
| Eosinophil percentage (%; 0.5‐5.0) | 1.7 (0.7‐3.0) | 1.4 (0.5‐2.7) | .400 |
| Increased | 3/38 (7.9) | 2/72 (2.8) | .338 |
| Decreased | 4/38 (10.5) | 16/72 (22.2) | .130 |
| Platelets (×10^9/L; 100‐378) | 274.0 (231.0‐353.0) | 262.5 (205.0‐331.3) | .282 |
| Increased | 8/54 (14.8) | 16/124 (12.9) | .731 |
| Decreased | 1/54 (1.9) | 0/124 (0) | .303 |
| Biochemical parameters (Unit; reference range) | |||
| C‐reactive protein (mg/L; 0.0‐8.0) | 0.75 (0.75‐4.00) | 1.00 (0.75‐5.00) | .096 |
| Increased | 3/54 (5.6) | 20/120 (16.7) | .053 |
| Procalcitonin (ng/ml; 0.00‐0.05) | 0.05 (0.04‐0.05) | 0.06 (0.04‐0.08) | .043 |
| Increased | 11/48 (22.9) | 62/107 (57.9) | <.001 |
| D‐dimer (mg/L; 0.00‐0.55) | 0.180 (0.105‐0.215) | 0.190 (0.125‐0.350) | .185 |
| Increased | 2/45 (4.4) | 9/97 (9.3) | .503 |
| Alanine aminotransferase (U/L; 9‐60) | 13.0 (11.0‐17.0) | 15.0 (11.0‐25.3) | .229 |
| Increased | 2/54 (3.7) | 6/122 (4.9) | 1.000 |
| Aspartate aminotransferase (U/L; 10‐50) | 25.0 (23.8‐32.3) | 31.0 (24.0‐44.3) | .026 |
| Increased | 3/54 (5.6) | 20/122 (16.4) | .054 |
| Alkaline phosphatase (U/L; 108‐317) | 187.5 (156.0‐216.5) | 203.0 (159.0‐262.8) | .102 |
| Increased | 0/52 (0) | 11/120 (9.2) | .035 |
| Creatine kinase‐MB (U/L; 0‐25) | 22.5 (19.3‐36.0) | 25.0 (18.0‐35.5) | .442 |
| Increased | 21/52 (40.4) | 60/121 (49.6) | .266 |
| Creatinine (μmol/L; <1 y , 18.0‐35.0; ≥1 y , 27.0‐62.0) | 35.6 (26.9‐42.1) | 31.1 (25.4‐41.5) | .148 |
| Increased | 2/53 (3.8) | 4/121 (3.3) | 1.000 |
| Blood urea nitrogen (mmol/L; 2.9‐7.1) | 4.43 (3.70‐5.05) | 4.14 (3.03‐4.85) | .058 |
| Increased | 2/53 (3.8) | 0/121 (0) | .092 |
| Coinfection with other pathogens | 15/50 (30.0) | 24/121 (19.8) | .150 |
| Mycoplasma pneumoniae | 13/50 (26.0) | 20/121 (16.5) | .153 |
| Chlamydia pneumoniae | 0/50 (0) | 0/121 (0) | – |
| Epstein‐Barr virus | 0/50 (0) | 2/121 (1.7) | 1.000 |
| Cytomegalovirus | 2/50 (4.0) | 4/121 (3.3) | 1.000 |
| Adenovirus | 0/50 (0) | 1/121 (0.8) | 1.000 |
| Influenza A virus | 0/50 (0) | 0/121 (0) | – |
| Influenza B virus | 1/50 (2.0) | 0/121 (0) | .292 |
| Immunological parameters (Unit; reference range) | |||
| IgE (IU/L; <1 y , 0‐15; 1‐3 y , 0‐60; 3‐10 y , 0‐90;> 10 y , 0‐200) | 38.40 (18.60‐110.00) | 28.05 (10.45‐138.80) | .474 |
| Increased | 14/47 (29.8) | 32/100 (32.0) | .787 |
| IgG (g/L; <1 y , 3.58‐10.69; 1‐5 y , 4.00‐10.39; 5‐10 y , 5.00‐10.60;> 10 y , 5.96‐13.64) | 9.26 (8.24‐11.40) | 8.66 (5.79‐10.70) | .032 |
| Increased | 16/52 (30.8) | 14/106 (13.2) | .008 |
| Decreased | 2/52 (3.8) | 11/106 (10.4) | .223 |
| IgA (g/L; <1 y , 0.11‐1.06; 1‐5 y , 0.28‐1.08; 5‐10 y , 0.36‐1.72;> 10 y , 0.33‐1.78) | 1.21 (0.74‐1.73) | 0.94 (0.38‐1.58) | .067 |
| Increased | 14/52 (26.9) | 24/106 (22.6) | .554 |
| Decreased | 2/52 (3.8) | 3/106 (2.8) | .664 |
| IgM (g/L; <1 y , 0.33‐1.26; 1‐5 y , 0.42‐1.73; 5‐10 y , 0.44‐2.07;> 10 y , 0.52‐2.42) | 1.00 (0.68‐1.47) | 0.95 (0.62‐1.17) | .144 |
| Increased | 1/52 (1.9) | 0/106 (0) | .329 |
| Decreased | 1/52 (1.9) | 4/106 (3.8) | 1.000 |
| Complement C3 (g/L; <5 y , 0.70‐1.12; ≥5 y , 0.80‐1.26) | 0.89 (0.75‐1.04) | 0.91 (0.82‐1.08) | .302 |
| Increased | 6/52 (11.5) | 14/106 (13.2) | .767 |
| Decreased | 15/52 (28.8) | 12/106 (11.3) | .006 |
| Complement C4 (g/L; <5 y , 0.10‐0.38; ≥5 y , 0.10‐0.40) | 0.18 (0.12‐0.23) | 0.23 (0.15‐0.32) | 0.002 |
| Increased | 1/52 (1.9) | 5/106 (4.7) | .664 |
| Decreased | 4/52 (7.7) | 3/106 (2.8) | .219 |
| Lymphocyte subsets | |||
| T cells (/μL ; 805‐4459) | 2268 (1877‐2871) | 2206 (1678‐3458) | .852 |
| Increased | 4/46 (8.7) | 11/93 (11.8) | .773 |
| Decreased | 0/46 (0) | 2/93 (2.2) | 1.000 |
| T‐cell percentage (%; 38.56‐70.06) | 71.17 (67.17‐75.71) | 68.17 (65.97‐73.37) | .052 |
| Increased | 25/46 (54.3) | 36/93 (38.7) | .080 |
| Decreased | 0/46 (0) | 0/93 (0) | – |
| CD4 + T cells (/μL ; 345‐2350) | 1096 (850‐1605) | 1130 (733‐1743) | .800 |
| Increased | 4/46 (8.7) | 12/93 (12.9) | .465 |
| Decreased | 0/46 (0) | 2/93 (2.2) | 1.000 |
| CD4 + T‐cell percentage (%; 14.21‐36.99) | 36.21 (32.58‐39.91) | 34.61 (31.26‐38.43) | .269 |
| Increased | 21/46 (45.7) | 31/93 (33.3) | .158 |
| Decreased | 0/46 (0) | 1/93 (1.1) | 1.000 |
| CD8 + T cells (/μL ; 314‐2080) | 999 (767‐1278) | 1009 (664‐1285) | .644 |
| Increased | 3/46 (6.5) | 5/93 (5.4) | 1.000 |
| Decreased | 0/46 (0) | 2/93 (2.2) | 1.000 |
| CD8 + T‐cell percentage (%; 13.24‐38.53) | 30.07 (24.98‐33.50) | 26.94 (23.49‐32.84) | .108 |
| Increased | 5/46 (10.9) | 6/93 (6.5) | .505 |
| Decreased | 0/46 (0) | 0/93 (0) | – |
| B cells (/μL ; 240‐1317) | 562 (397‐723) | 643 (352‐936) | .620 |
| Increased | 5/46 (10.9) | 12/93 (12.9) | .731 |
| Decreased | 1/46 (2.2) | 6/93 (6.5) | .425 |
| B‐cell percentage (%; 10.86‐28.03) | 17.09 (14.17‐20.58) | 19.46 (13.26‐23.33) | .500 |
| Increased | 1/46 (2.2) | 3/93 (3.2) | 1.000 |
| Decreased | 2/46 (4.3) | 7/93 (7.5) | .718 |
| NK cells (/μL ; no reference range) | 248 (148‐479) | 308 (207‐469) | .093 |
| NK cell percentage (%; no reference range) | 7.36 (4.21‐13.24) | 9.55 (6.09‐16.05) | .094 |
| Cytokines | |||
| IL‐2 (pg/mL; 0.0‐11.4) | 1.31 (1.19‐1.54) | 1.50 (1.34‐1.72) | .002 |
| Increased | 0/40 (0) | 0/74 (0) | – |
| IL‐4 (pg/mL; 0.0‐12.9) | 2.32 (2.10‐3.31) | 2.86 (2.16‐3.71) | .046 |
| Increased | 0/40 (0) | 1/74 (1.4) | 1.000 |
| IL‐6 (pg/mL; 0.0‐20.9) | 3.10 (2.23‐3.98) | 4.11 (3.24‐7.14) | <.001 |
| Increased | 0/40 (0) | 5/74 (6.8) | .160 |
| IL‐10 (pg/mL; 0.0‐5.9) | 3.26 (3.08‐3.64) | 4.40 (3.48‐6.09) | <.001 |
| Increased | 0/40 (0) | 20/74 (27.0) | <.001 |
| TNF‐α (pg/mL; 0.0‐5.5) | 1.41 (1.13‐1.82) | 1.74 (1.34‐2.15) | .008 |
| Increased | 0/40 (0) | 5/74 (6.8) | .160 |
| Interferon‐γ (pg/mL; 0.0‐17.3) | 2.74 (2.00‐3.30) | 3.52 (2.60‐4.79) | .002 |
| Increased | 0/40 (0) | 5/74 (6.8) | .160 |
Measurements of laboratory parameters are shown as median (IQR), and proportions of changes are shown as fractions and percentages, that is, No./total available No. (%).
Abbreviations: CD, cluster of differentiation; COVID‐19, coronavirus disease 2019; Ig, immunoglobulin; IL, interleukin; IQR, interquartile range; NK, natural killer (cells); p values denote the comparison between the subgroup without pneumonia and the subgroup with mild pneumonia; TNF, tumor necrosis factor.
P values in bold font are less than 0.05, with statistically significant.
Figure 3.
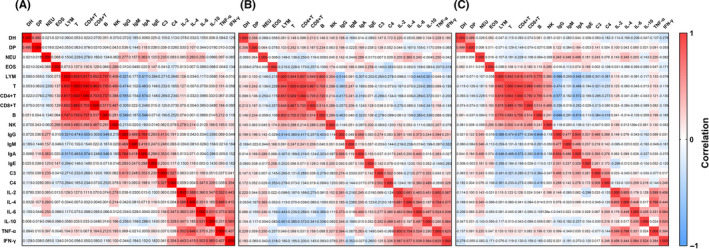
Heatmap of correlation matrix between duration of hospitalization (DH), duration of RT‐PCR conversion (DP, time from first positive to first negative RT‐PCR results), blood cell counts and immunological parameters of pediatric patients with COVID‐19 in (A) total cases (n = 182), (B) allergic cases (n = 43), and (C) mild pneumonia cases (n = 124), respectively. Analyzed variables included numbers of immune cells, serum levels of immunoglobulins (Igs), complements, and cytokines: NEU (neutrophil count, ×109/L), EOS (eosinophil count, ×109/L), LYM (lymphocyte count, ×109/L), T (T‐cell count,/μL), CD4+ and CD 8+ T (CD4+ and CD8+ T‐cell count,/μL), B (B‐cell count,/μL), NK (natural killer cell count,/μL), IgG, IgA, and IgM (concentration, g/L), IgE (concentration, IU/mL), C3 and C4 (complements C3 and C4 concentration, g/L), IL‐2, IL‐4, IL‐6, and IL‐10 (interleukin concentration, pg/mL), TNF‐α (tumor necrosis factor‐α concentration, pg/mL), and IFN‐γ (interferon‐γ, pg/mL). The values of Spearman's correlation coefficients are shown in each cell of the graph. Red and blue backgrounds stand for positive and negative correlations, respectively, and the shades of color reflect the strength of correlation
Figure 4.
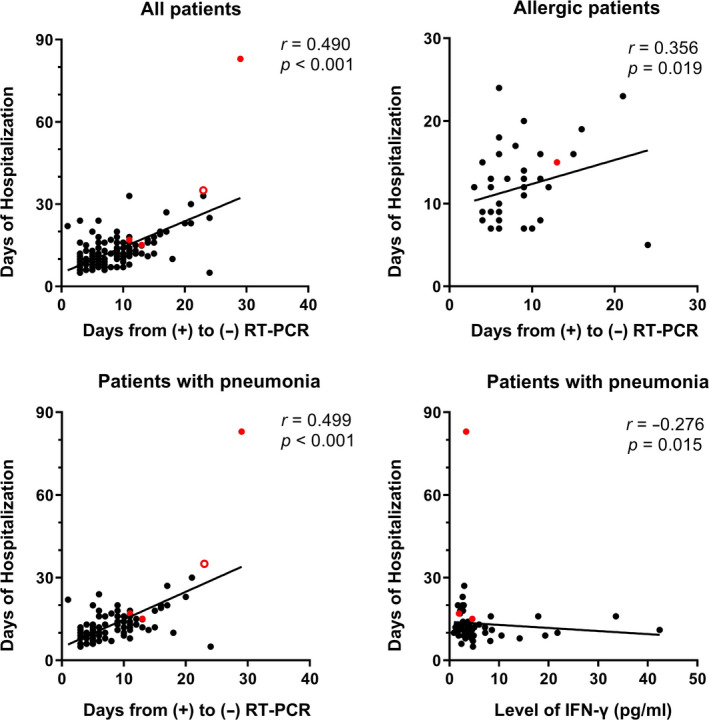
Correlations between the duration of hospitalization and the time of RT‐PCR conversion in pediatric COVID‐19 patients: (A) all patients, (B) allergic patients, (C) patients with pneumonia, (D) the significantly negative correlation between the duration of hospitalization and the level of IFN‐γ in patients with pneumonia. Spearman's correlation test was used, with a calculation of correlation coefficient (r). The red dots denote the numerical values of three severe/critical cases, and the hollow red dot denotes those of one dead case. RT‐PCR, real‐time reverse transcription‐polymerase chain reaction. (+), positive; (−), negative
3.4. The severity of COVID‐19 and comparison between pediatric patients with and without pneumonia
Fifty‐four infected children did not develop pneumonia, including 24 asymptomatic infections and 30 cases with AURI, and they were compared to patients with mild pneumonia (Table 5 and 6). The prevalence of allergic diseases showed no difference between children without pneumonia and those with mild pneumonia (20.4% vs 25.0%, P = .504). When compared to asymptomatic/AURI types, COVID‐19 pneumonia, though mild, occurred more in children with other past medical history (21.0% vs 7.4%, P = .046), manifested more as fever (50.0% vs 27.8%, P = .006) and cough (52.4% vs 29.6%, P = .005), and caused more increased levels of PCT (57.9% vs 22.9%, P < .001), ALP (9.2% vs 0%, P = .035) and IL‐10 (27.0% vs 0%, P < .001), and less decreased level of complement C3 (11.3% vs 28.8%, P = .006). The monocyte count, levels of PCT, AST, and complement C4, and all the levels of tested cytokines (IL‐2, IL‐4, IL‐6, and IL‐10, TNF‐α, and IFN‐γ) were higher, and the level of IgG was lower, in the mild pneumonia group than those in the nonpneumonia group (P < .05), though most of them were in normal ranges. Other clinical and laboratory parameters were not found different between the two groups.
Table 5.
Demographics and clinical features of pediatric patients with COVID‐19 in the group without pneumonia and the group with mild pneumonia
|
No pneumonia (n = 54) |
Mild pneumonia (n = 124) |
P value | |
|---|---|---|---|
| Age | |||
| Median (range), years | 7.00 (0.01‐13.91) | 5.42 (0.16‐15.00) | .246 |
| Age groups, No. (%) | |||
| <1 y | 4 (7.4) | 25 (20.2) | .097 |
| 1‐5 y | 19 (35.2) | 38 (30.6) | – |
| 6‐10 y | 24 (44.4) | 39 (31.5) | – |
| 11‐15 y | 7 (13.0) | 22 (17.7) | – |
| Sex, No. (%) | |||
| Female | 24 (44.4) | 37 (29.8) | .059 |
| Male | 30 (55.6) | 87 (70.2) | – |
| Contact history, No. (%) | |||
| Family cluster | 53 (98.1) | 122 (98.4) | .909 |
| Unidentified source of infection | 1 (1.9) | 2 (1.6) | – |
| Comorbidities and medical history, No. (%) | |||
| Allergic diseases | 11 (20.4) | 31 (25.0) | .504 |
| Other medical history | 4 (7.4) | 26 (21.0) | .026 |
| Symptom, No. (%) | |||
| Fever | 15 (27.8) | 62 (50.0) | .006 |
| Cough | 16 (29.6) | 65 (52.4) | .005 |
| Chest tightness | 0 (0) | 2 (1.6) | 1.000 |
| Short of breath | 0 (0) | 1 (0.8) | 1.000 |
| Fatigue | 0 (0) | 5 (4.0) | .325 |
| Gastrointestinal symptoms | 7 (13.0) | 11 (8.9) | .405 |
| Diarrhea | 1 (1.9) | 7 (5.6) | .438 |
| Abdominal pain/discomfort | 3 (5.6) | 4 (3.2) | .435 |
| Vomiting | 4 (7.4) | 2 (1.6) | .070 |
| No symptom | 25 (46.3) | 30 (24.2) | .003 |
| Treatment, No. (%) | |||
| Inhalation of interferon‐α | 52 (96.3) | 123 (99.2) | .167 |
| Ganciclovir | 0 (0) | 4 (3.2) | .316 |
| Arbidol | 0 (0) | 3 (2.4) | .554 |
| Oseltamivir | 0 (0) | 1 (0.8) | 1.000 |
| Ribavirin | 0 (0) | 1 (0.8) | 1.000 |
| Antibiotic | 8 (14.8) | 29 (23.4) | .195 |
| Budesonide inhalation | 2 (3.7) | 2 (1.6) | .586 |
| Supplemental oxygen | 0 (0) | 1 (0.8) | 1.000 |
| Intravenous immunoglobulin | 0 (0) | 2 (1.6) | 1.000 |
| Systematic glucocorticoid | 0 (0) | 1 (0.8) | 1.000 |
| Montelukast | 0 (0) | 2 (1.6) | 1.000 |
| Oral traditional Chinese medicine | 3 (5.6) | 9 (7.3) | 1.000 |
| Duration of hospitalization, Median (IQR), days | 11 (8‐15) | 12 (9‐14) | .260 |
| Days from positive to negative RT‐PCR assays, Median (IQR), days | 7 (5‐10.25) | 7 (5‐10.75) | .398 |
Abbreviations: COVID‐19, coronavirus disease 2019; P values denote the comparison between the subgroup without pneumonia and the subgroup with mild pneumonia; RT‐PCR, real‐time reverse transcription‐polymerase chain reaction.
P values in bold font are less than 0.05, with statistically significant.
There were only one severe case and three critically ill cases, which are individually described in Table 7. Three of them were male, and one was female. Patient 1 was a 13‐year‐and‐5‐month‐old boy, who had a close contact with confirmed COVID‐19 family members, his mother, and grandparents. He was allergic to penicillin. He presented with chest congestion and polypnea. The patient recovered after oxygen supplement and antiviral treatment (inhalation of interferon‐α). Patient 2 was a 13‐month‐old boy, who presented with vomiting, diarrhea, and polypnea. He was complicated with septic shock, multiple organ dysfunction syndrome (MODS), kidney stone, and hydronephrosis. He received mechanical ventilation and treatment with antiviral, antibiotics, and intravenous immunoglobulin (IVIG), and his symptoms were improved. This patient had been elaborated in a Case Report in Chinese. 24 Patient 3 was a 10‐month‐old girl with intussusception, who had intestinal necrosis, septic shock, and multiorgan failure, and died 4 weeks after admission. She was mentioned in a previous literature. 8 We included these patients here for the integrity of the data. Patient 4, an 8‐year‐old boy, got infected by his family members and was found in the COVID‐19 screening during the hospitalization for treating acute lymphoblastic leukemia. On the 24th day of hospitalization, he was transferred to ICU due to respiratory failure and accepted mechanical ventilation (February 18); although with difficulty in weaning, he finally recovered. It was evident that the levels of acute phase inflammatory indicators (CRP and PCT) and cytokines (IL‐6 and IL‐10) dramatically increased in three critically ill cases (Patients 2, 3, and 4).
Table 7.
Clinical and laboratory data of four severe or critical cases with COVID‐19
| Patient 1 | Patient 2 | Patient 3 | Patient 4 | |
|---|---|---|---|---|
| Age | 13 y, 5 mon | 1 y, 1 mon | 10 mon | 8 y |
| Sex | Male | Male | Female | Male |
| Medical history | Drug allergy (penicillin) | None | None | Acute lymphoblastic leukemia |
| Duration from illness onset to diagnosis (d) | 1 | 15 | 6 | 12 |
| Severity | Severe | Critical | Critical | Critical |
| Symptoms | Chest tightness, polypnea | Fever, polypnea, nausea/vomiting, diarrhea | Nausea/vomiting | Fever, cough, polypnea |
| Complications | None | Septic shock, MODS, hydronephrosis | Intussusception, intestinal necrosis, septic shock, MODS, DIC | Respiratory failure, convulsions |
| Chest CT scans | ||||
| On admission | Unilateral patchy shadowing, GGO | Unilateral patchy shadowing, GGO | Normal | Bilateral patchy shadowing |
| Progression | None | Multiple patchy shadowing, GGO | Bilateral patchy shadowing, consolidation, pleural effusion | Bilateral patchy shadowing, GGO, “white lung” |
| Treatment | Antiviral (inhalation of interferon‐α), supplemental oxygen | Antiviral (inhalation of interferon‐α), antibiotic, IVIG, systematic glucocorticoid, mechanical ventilation and supplemental oxygen | Antiviral (inhalation of interferon‐α), antibiotic, mechanical ventilation and supplemental oxygen | Antiviral (inhalation of interferon‐α), antibiotic, systematic glucocorticoid, mechanical ventilation and supplemental oxygen |
| Clinical outcome | Recovered | Recovered | Dead | Recovered |
| Days of hospitalization | 15 | 17 | 35 | 83 |
| Days from positive to negative RT‐PCR assays | 13 | 11 | 23 | 29 |
| Laboratory results (Unit)—the result on admission; the second result if available | ||||
| Leukocytes count (×10^9/L) | 6.88; 6.23 | 11.96; 12.18 | 5.68; 2.29 | 0.75; 7.68 |
| Neutrophils count (×10^9/L) | 3.34; 3.94 | 7.77; 8.98 | 0.98; 1.46 | 0.35; 7.05 |
| Lymphocytes count (×10^9/L) | 2.96; 1.80 | 2.48; 2.40 | 4.57; 0.52 | 0.18; 0.36 |
| Eosinophils count (×10^9/L) | 0.20; 0.14 | NA | 0; 0 | 0.20; 0 |
| C‐reactive protein (mg/L) | 0.5; < 0.75 | 24.8; < 0.75 | 13.8; 57.9 | 6.48; 38.3 |
| Procalcitonin (ng/ml) | 0.05; 0.04 | 0.43; 0.05 | NA; 100 | 0.25; NA |
| Lactate dehydrogenase (U/L) | 187; 171 | 361; NA | 430; 1563 | 264; 451 |
| Creatine kinase (U/L) | 77; 88 | 115; NA | 48; 7522 | 49; 19 |
| Creatine kinase‐MB (U/L) | 15; 14 | 62; NA | 39; 532 | 35; NA |
| Alanine aminotransferase (U/L) | 8; 8 | 32; 27 | 27; 214 | 191; 49 |
| Aspartate aminotransferase (U/L) | 16; 15 | 42; 35 | 66; 528 | 28; 214 |
| Creatinine (μmol/L) | 72.1; 53.4 | 224.5; 13.3 | 43.4; 120.1 | 30.8; 26.7 |
| Blood urea nitrogen (mmol/L) | 3.71; 2.59 | 15.91; 3.60 | 12.52; 11.15 | 4.10; 2.20 |
| D‐dimer (mg/L) | 0.44; NA | NA; 0.78 | NA; 40.34 | 0.27; NA |
| IgE (IU/ml) | 219 | 126 | NA | NA |
| IgG (g/L) | 11.3 | 4.43 | 1.53 | NA |
| IgM (g/L) | 1.01 | 1.18 | 0.18 | NA |
| IgA (g/L) | 3.07 | 0.66 | 0.24 | NA |
| Complement C3 (g/L) | 0.75 | 0.66 | 0.33 | NA |
| Complement C4 (g/L) | 0.12 | 0.10 | 0.10 | NA |
| Lymphocyte subsets | ||||
| T‐cell percentage (%) | 62.22 | 38.07 | 26.63 | NA |
| CD4 + T‐cell percentage (%) | 30.34 | 20.23 | 13.43 | NA |
| CD8 + T‐cell percentage (%) | 30.29 | 16.68 | 8.83 | NA |
| B‐cell percentage (%) | 26.93 | 51.34 | 73.41 | NA |
| NK cell percentage (%) | 7.46 | 6.24 | 0.95 | NA |
| IL‐2 (pg/mL) | 1.71 | 1.03; 0.94 | NA; 1.75 | NA; 1.53 |
| IL‐4 (pg/mL) | 4.88 | 4.02; 2.88 | NA; 3.01 | NA; 2.97 |
| IL‐6 (pg/mL) | 7.37 | 120.31; 3.78 | NA; 3868.86 | NA; 36.46 |
| IL‐10 (pg/mL) | 3.31 | 33.38; 5.11 | NA; 326.93 | NA; 11.59 |
| TNF‐α (pg/mL) | 4.35 | 4.47; 1.43 | NA; 2.15 | NA; 1.36 |
| Interferon‐γ (pg/mL) | 4.62 | 1.92; 2.84 | NA; 16.98 | NA; 3.37 |
Abbreviations: CD, cluster of differentiation; COVID‐19, coronavirus disease 2019; DIC, disseminated intravascular coagulation; GGO, ground‐glass opacity; Ig, immunoglobulin; IL, interleukin; IVIG, intravenous immunoglobulin; MODS, multiple organ dysfunction syndrome; NA, not available; NK, natural killer (cells); TNF, tumor necrosis factor.
3.5. Distinct characteristics of COVID‐19 between younger and older children
Given the physiological and immunological differences of younger and older children, we divided the cases into two groups according to ages and compared the clinical features and laboratory results of them (Tables S3 and S4). Children aged 10 years or older experienced more fatigue and had more GGO lesions in chest CT images (P < .05), but there remained more individuals to be further observed. The differences in several laboratory parameters were likely to be induced by their own changes with age, and the most results were in normal ranges without clinical significance. In addition, there was no difference in the prevalence of allergic diseases between the two age groups. Moreover, there was no difference in the proportion of children with possible coinfections, such as MP, between children <10 years and children ≥10 years.
4. DISCUSSION
In 182 pediatric COVID‐19 patients, the most common symptoms were fever and dry cough, consistent with other reports. 25 A slightly male dominance was found in these patients, which was close to that reported in the United States 26 and China. 27 Most children were infected by family cluster, as observed previously, 28 which was different from that of adults who were infected during social activities. As for those with abnormal CT images, ground‐glass opacity and patchy shadowing were the most common features, and consolidation was rare in pediatric patients when compared to adult patients.
The proportion of patients with allergies and asthma in the current study was 23.6% (43/182), similar to the general prevalence reported in China, 16 and the allergic or asthmatic patients did not experience exacerbations during the hospitalization. Age distribution, sex ratio, contact history, clinical symptoms, radiological alterations, severity, treatment, and outcomes were not different between allergic and nonallergic patients. The proportion of COVID‐19 children with allergic rhinitis was 19.8% (36/182), which was also close to the prevalence of AR recently reported (17.6%) in children of Wuhan. 29 In consideration of the increasing prevalence of AR in China, 30 it could be concluded that AR is not a predisposing factor for infection of SARS‐CoV‐2. Intranasal corticosteroids should be continued for COVID‐19 children with AR, as stated in a position paper of the European Academy of Allergy and Clinical Immunology (EAACI). 31
There was only one asthma child in the current study, suggesting that asthma is not a predisposing factor for SARS‐CoV‐2 infection in children, the same as in adults. 22 , 32 This is probably because angiotensin‐converting enzyme‐2 (ACE2), the cellular receptor of SARS‐CoV‐2, is less expressed in airway epithelia of individuals with allergic asthma and rhinitis. 33 Noticeably, this study involved 10 children (median age, 3.5 years old) with a history of recurrent wheezing, a common symptom in preschool children, which is mainly caused by bronchiolitis and asthma. 34 It is not easy to make a definite diagnosis of asthma in these children, although treatments such as bronchodilators or inhaled corticosteroids will relieve the symptom. 35 However, several studies in the United States showed that asthma was a common comorbidity in children infected with SARS‐CoV‐2, with the prevalence of 20%‐24%. 36 , 37 This is possibly because that the overall prevalence of pediatric asthma is higher in the United States 38 than that in China. 39 Another reason may be that most of asthmatic children infected with SARS‐CoV‐2 were asymptomatic and thus could not be included in our study, as reported in the US studies that asthma was not more common in the hospitalized patients or critically ill cohort. 36 , 37 One more interesting point was that our cases were all between January and March, whereas American cases coincided with spring and pollen season.
Lymphocytes play an important role in antiviral immunity and contribute to the cytokine storm responsible for pulmonary and systematic inflammation of COVID‐19 patients. Lymphopenia was common in adult COVID‐19 patients, and the degree of lymphopenia was associated with the severity and outcome of the patients. 22 , 40 However, fewer patients with lymphopenia were observed in pediatric patients, as shown in the current and previous studies. 10 , 11 This is consistent with and also the cause of the high prevalence of asymptomatic and mild courses in COVID‐19 children. Interestingly, eosinopenia was also observed in a significant fraction (29.5%) of infected children, though the percentage was less than that of adults (52.9%). 22 We speculate that decreased Th2 lymphocytes and cytokines such as IL‐5 may be associated with eosinopenia, as we suggested previously. The ratios of patients with eosinopenia were not different between allergic and nonallergic patients, as well as between younger children and older children. Thus, eosinopenia could not be used as a diagnostic indicator of COVID‐19 in children, in contrast to that suggested in adults. 22
The median levels of total serum IgE in both allergic and nonallergic patients were within the normal range. The ratios of patients with increased IgE levels were not different between allergic and nonallergic, as well as younger and older children with COVID‐19. Most of the allergic children had well‐controlled AR, and only few patients were still using intranasal corticosteroids during the COVID‐19. It must be pointed out that no data about specific IgE, skin prick test, or other provocation tests were available in these patients. Taken together, our results suggest that allergy has no obvious impact on the disease course of COVID‐19 in children. Other immunoglobulins such as total IgG, IgA, IgM, and complements C3 and C4 were all in normal ranges, without difference between allergic and nonallergic patients, although higher ratios of patients with increased IgA, C3, and C4 were seen in older children, and both ratios of patients with increased and decreased IgG were observed in younger children.
As far as we know, there is no study focusing on the pediatric COVID‐19 children with different severities. Considering that most children infected with SARS‐CoV‐2 were asymptomatic or presented as AURI and mild pneumonia, this is rational. In our cohort, only four children were categorized as severe or critical cases, including one death due to intussusception and secondary multiorgan failure. The other three severe children were recovered. Recently, it has come to attention that some pediatric patients with Kawasaki‐like symptoms or multisystem inflammatory syndrome were found to be associated with SARS‐CoV‐2 infection. 41 There was no such case in our study, or reported in China, as far as we know, which remains to be further observed and studied with more evidences.
Because of the rarity of severe and critical pediatric COVID‐19 cases, we compared the clinical and laboratory features of mild pneumonia cases with those patients without pneumonia. Clinically, fever and cough were more common in patients with (mild) pneumonia. Most laboratory findings were comparable between the children with mild pneumonia and without pneumonia. Some biochemical and immunological parameters differed between the two groups, but all were in the normal ranges. These differences may reflect the inflammatory responses induced by pneumonia. The incidence of elevated PCT, ALP and IL‐10 and decreased complement C3 in pneumonia was higher in mild pneumonia patients than those without pneumonia. This is little different from adult COVID‐19 patients that inflammatory biomarkers CRP and PCT, coagulation indicator D‐dimer, myocardial injury indicator CK/CK‐MB, and liver and renal function indicators ALT, AST, ALP, and BUN in the blood were all elevated and were more prominent in severe and critical cases, as studies previously demonstrated. 22 , 42
Peripheral lymphocyte subset alteration has been reported in studies on adult COVID‐19 patients. CD8+ cytotoxic T cell was an independent predictor for COVID‐19 severity and treatment efficacy. 43 CD4+ and CD8+ T‐cell counts were also correlated with the disease severity and outcome. 44 So far, there were few studies focusing on the lymphocyte subsets in pediatric cases. In the present study, we found that in COVID‐19 children, both the numbers and percentages of T cells, CD4+ T cells, CD8+ T cells, B cells, and NK cells were mostly in the normal ranges, as well as the levels of cytokines involved in inflammation, immune regulation and antiviral immunity such as IL‐2, IL‐4, IL‐6, IL‐10, TNF‐α, and interferon‐γ in the serum. The slight or unchanged immunological function may contribute to the clinical features of pediatric COVID‐19 patients such as lower incidence, milder symptoms, shorter course of disease, and fewer severe cases. 45 The median numbers of total lymphocytes and lymphocyte subsets were different between younger and older children, but still in the corresponding normal ranges of their ages. Older children had more changes in the lymphocyte subsets, including more cases with increased percentages of T cells and CD8+ T cells, and decreased numbers of B cells. Younger children were more frequently associated with increased CD4+ T‐cell numbers and percentages. Our results provide deep insight into the immunological features of COVID‐19 children. Consistent with the clinical symptoms and laboratory findings, the lymphocyte subsets and cytokines were not different in allergic and nonallergic COVID‐19 patients. Thus, allergy plays a negligible role in the incidence, disease course, and outcomes of COVID‐19 in children.
Only a minority of children were with evidences of possible coinfection with other pathogens, most of which was MP, and few were EBV, CMV, adenovirus, and influenza B virus. COVID‐19 children with MP coinfection were associated with relatively lower monocyte counts and more azithromycin use, and also lower ratio of ground‐glass opacity in chest CT when compared to those without evidence of MP coinfection. The disease severity and proportion of children with allergies were not different between children with or without MP coinfection. There were no patients with evidence of coinfection with rhinovirus (RV) and respiratory syncytial virus (RSV), which are more commonly found in children with AR and wheezing. 46 This may be due to the suspension of RV and RSV testing performed in commercial institutions during the quarantine period. In addition, the physicians tended not to find other pathogens if the children had been confirmed with SARS‐CoV‐2 infection by RT‐PCR assays. The coinfection in COVID‐19 children with other respiratory viruses could not be excluded.
Treatments of COVID‐19 children during hospitalization were diverse and mostly empirical, without evidence of randomized controlled trials (RCTs). Almost all (97.8%) children were treated with inhalation of interferon‐α, based on the studies and experiences of its usage in treating other respiratory infection and viral pneumonia. 47 Therefore, we could not know the exact clinical effects of interferon‐α by comparing the outcomes of patients treated with or without interferon‐α. There is no clinical evidence to address the effect of IFN‐α in COVID‐19 children. Therefore, the treatment of interferon‐α should be evaluated with well‐designed RCTs in the future.
In the present cohort, almost all pediatric patients had good outcomes, except one death. This is consistent with previous report of the outcome in pediatric COVID‐19 patients. 9 , 10 , 11 Both patients with and without pneumonia recovered well and were discharged from the hospital. Duration of hospitalization in this study was not different between patients with mild and without pneumonia, but shorter than that of adult patients. 42 This is due to the large proportion of patients without pneumonia, which could be discharged after a few days of medical surveillance in the hospital. In addition, the median time from first positive to first negative RT‐PCR results of SARS‐CoV‐2 was 7 days in both patients with and without pneumonia, shorter than that in adult patients. 42 , 48 The cause of this difference is unclear, but older age and different immunological response may be factors affecting negative conversion of the virus RNA. 48 The negative conversion of RT‐PCR (two consecutive negative results at least with a 24‐hour interval) was one of the discharge criteria, which caused its positive correlation with the duration of hospitalization. Interestingly, in patients with pneumonia, the duration of hospitalization had mildly negative correlation with the level of IFN‐γ, which indicated the possible antiviral roles of interferon. More importantly, most of children were treated with IFN‐α, and its effect on the negative conversion of virus RNA in respiratory tract sample could not be excluded.
There are a few limitations of this study. Firstly, not all children in the designated hospital could be included in the present study. Secondly, the allergic status of most children was according to medical history, but not with medical records or allergen testing, and the allergens responsible for the allergy were reported in only 30% of allergic patients. Thirdly, the dominance of asymptomatic patients and mild pneumonia prevented most patients from repetitive laboratory tests; thus, the estimation of dynamic variations in blood cell counts and biochemical parameters was unavailable.
In conclusion, pediatric COVID‐19 patients tended to have mild clinical course, and severe cases were rare. Patients with pneumonia had higher proportion of fever and cough and increased inflammatory biomarkers than those without pneumonia, and the both were with favorable prognosis. Allergic and nonallergic COVID‐19 children were not different in disease incidence, clinical characteristics, and laboratory and immunological findings. Allergy is not a predisposing factor for SARS‐CoV‐2 infection and plays no role in the disease course of COVID‐19 at least in children.
CONFLICT OF INTEREST
Dr Akdis reports grants from Allergopharma, Idorsia, Swiss National Science Foundation, Christine Kühne‐Center for Allergy Research and Education, European Commission's Horizon 2020 Framework Programme, Cure, Novartis Research Institutes, Astra Zeneca, and Scibase, and for advisory role in Sanofi/Regeneron, outside the submitted work. Dr Cao, Dr Li, Dr Liu, Dr Chen, Dr Du, Dr Zhang, Prof. Akdis M, Dr Huang, Dr Dong, Dr Lu, and Dr Gao have nothing to disclose.
AUTHOR CONTRIBUTIONS
Hui Du collected the clinical data. Xiang Dong organized and analyzed the data, and prepared the manuscript. Jinjin Zhang was involved in the preparation of the manuscript. Yiyuan Cao interpreted the radiological images. Peiqi Huang, Hongwei Chen, and Ying Li participated in the clinical work and data extraction. Guanghui Liu made some instruction in the study. Cezmi A. Akdis worked in the writing and critical review of the manuscript. Yadong Gao participated in the preparation of the manuscript. Xiaoxia Lu and Yadong Gao designed the study and reviewed the manuscript.
Supporting information
Table S1‐S4
ACKNOWLEDGMENTS
We would like to express great gratitude and respect to all the healthcare professionals and others who have dedicated themselves to combating COVID‐19.
Du H, Dong X, Zhang J‐J, et al. Clinical characteristics of 182 pediatric COVID‐19 patients with different severities and allergic status. Allergy.2021;76:510–532. 10.1111/all.14452
Hui Du and Xiang Dong are contributed equally to this work.
Contributor Information
Cezmi A. Akdis, Email: akdisca@siaf.uzh.ch.
Xiao‐xia Lu, Email: akdisca@siaf.uzh.ch, Email: xueboen007@163.com, Email: gaoyadong@whu.edu.cn.
Ya‐dong Gao, Email: gaoyadong@whu.edu.cn.
REFERENCES
- 1. Wuhan Municipal Health Commission . Report of clustering pneumonia of unknown etiology in Wuhan City, 2019.
- 2. Zhu N, Zhang D, Wang W, et al. A novel coronavirus from patients with pneumonia in China, 2019. N Engl J Med 2020;382:727‐733. [DOI] [PMC free article] [PubMed] [Google Scholar]
- 3. Zhou P, Yang XL, Wang XG, et al. A pneumonia outbreak associated with a new coronavirus of probable bat origin. Nature 2020;579:270‐273. [DOI] [PMC free article] [PubMed] [Google Scholar]
- 4. Coronaviridae Study Group of the International Committee on Taxonomy of Viruses . The species Severe acute respiratory syndrome‐related coronavirus: classifying 2019‐nCoV and naming it SARS‐CoV‐2. Nat Microbiol. 2020;5:536‐544. [DOI] [PMC free article] [PubMed] [Google Scholar]
- 5. World Health Organization (WHO) . Responding to community spread of COVID‐19 (Interim guidance) 7 March 2020. https://www.who.int/publications‐detail/responding‐to‐community‐spread‐of‐covid‐19 Accessed April 23, 2020.
- 6. World Health Organization (WHO) . Coronavirus disease (COVID‐2019) situation reports. https://www.who.int/emergencies/diseases/novel‐coronavirus‐2019/situation‐reports Accessed April 17, 2020
- 7. Wu Z, McGoogan JM. Characteristics of and Important Lessons From the Coronavirus Disease 2019 (COVID‐19) Outbreak in China: Summary of a Report of 72 314 Cases From the Chinese Center for Disease Control and Prevention. JAMA. 2020;323(13):1239. [DOI] [PubMed] [Google Scholar]
- 8. Lu X, Zhang L, Du H, et al. SARS‐CoV‐2 Infection in Children. N Engl J Med. 2020;382(17):1663‐1665. [DOI] [PMC free article] [PubMed] [Google Scholar]
- 9. Cai J, Xu J, Lin D, et al. A Case Series of children with 2019 novel coronavirus infection: clinical and epidemiological features. Clin Infect Dis 2020. 10.1093/cid/ciaa198. [Epub ahead of print]. [DOI] [PMC free article] [PubMed] [Google Scholar]
- 10. Xu Y, Li X, Zhu B, et al. Characteristics of pediatric SARS‐CoV‐2 infection and potential evidence for persistent fecal viral shedding. Nat Med. 2020;26(4):502‐505. [DOI] [PMC free article] [PubMed] [Google Scholar]
- 11. Qiu H, Wu J, Hong L, Luo Y, Song Q, Chen D. Clinical and epidemiological features of 36 children with coronavirus disease 2019 (COVID‐19) in Zhejiang, China: an observational cohort study. Lancet Infect Dis. 2020;20(6):689‐696. [DOI] [PMC free article] [PubMed] [Google Scholar]
- 12. Dong X, Cao YY, Lu XX, et al. Eleven faces of coronavirus disease 2019. Allergy 2020.75(7):1699–1709. [DOI] [PMC free article] [PubMed] [Google Scholar]
- 13. Jiang Y, Lu XX, Jin RM, et al. [Expert consensus on the diagnosis, treatment and prevention of SARS‐CoV‐2 infection in children (2nd Version)]. Chin J Appl Clin Pediatr. 2020;35(2):143–150. [Google Scholar]
- 14. Pawankar R. Allergic diseases and asthma: a global public health concern and a call to action. World Allergy Organ J 2014;7:12. [DOI] [PMC free article] [PubMed] [Google Scholar]
- 15. Akinbami LJ, Simon AE, Schoendorf KC. Trends in allergy prevalence among children aged 0–17 years by asthma status, United States, 2001–2013. J Asthma 2016;53:356‐362. [DOI] [PMC free article] [PubMed] [Google Scholar]
- 16. Wong G, Li J, Bao YX, et al. Pediatric allergy and immunology in China. Pediatr Allergy Immunol 2018;29:127‐132. [DOI] [PubMed] [Google Scholar]
- 17. Gilles S, Blume C, Wimmer M, et al. Pollen exposure weakens innate defense against respiratory viruses. Allergy 2020;75(3):576‐587. [DOI] [PubMed] [Google Scholar]
- 18. Papadopoulos NG, Christodoulou I, Rohde G, et al. Viruses and bacteria in acute asthma exacerbations–a GA2LEN‐DARE systematic review. Allergy 2011;66:458‐468. [DOI] [PMC free article] [PubMed] [Google Scholar]
- 19. Greenberg SB. Update on human rhinovirus and coronavirus infections. Semin Respir Crit Care Med 2016;37:555‐571. [DOI] [PMC free article] [PubMed] [Google Scholar]
- 20. Han M, Rajput C, Ishikawa T, Jarman C, Lee J, Hershenson M. Small animal models of respiratory viral infection related to asthma. Viruses 2018;10(12):682. [DOI] [PMC free article] [PubMed] [Google Scholar]
- 21. Erdem SB, Can D, Girit S, et al. Does atopy affect the course of viral pneumonia. Allergol Immunopathol (Madr) 2018;46:119‐126. [DOI] [PMC free article] [PubMed] [Google Scholar]
- 22. Zhang JJ, Dong X, Cao YY, et al. Clinical characteristics of 140 patients infected with SARS‐CoV‐2 in Wuhan, China. Allergy 2020;75(7):1730–1741. [DOI] [PubMed] [Google Scholar]
- 23. Bauchner H, Golub RM, Zylke J. Editorial concern‐possible reporting of the same patients with COVID‐19 in different reports. JAMA 2020;323(13):1256. [DOI] [PubMed] [Google Scholar]
- 24. Chen F, Liu ZS, Zhang FR, et al. First case of severe childhood novel coronavirus pneumonia in China. Zhonghua Er Ke Za Zhi. 2020;58:179‐182. [DOI] [PubMed] [Google Scholar]
- 25. Zheng F, Liao C, Fan Q, et al. Clinical characteristics of children with coronavirus disease 2019 in Hubei. China. Curr Med Sci. 2020;40:1‐6. [DOI] [PMC free article] [PubMed] [Google Scholar]
- 26. Bialek S, Gierke R, Hughes M, McNamara LA, Pilishvili T, Skoff T. Coronavirus Disease 2019 in Children — United States, February 12–April 2, 2020. MMWR Morb Mortal Wkly Rep 2020;69(14):422‐426. [DOI] [PMC free article] [PubMed] [Google Scholar]
- 27. Dong Y, Mo X, Hu Y, et al. Epidemiology of COVID‐19 among children in china. Pediatrics 2020;145(6):e20200702. [DOI] [PubMed] [Google Scholar]
- 28. Hong H, Wang Y, Chung H‐T, Chen C‐J. Clinical characteristics of novel coronavirus disease 2019 (COVID‐19) in newborns, infants and children. Pediatr Neonatol. 2020;61(2):131‐132. [DOI] [PMC free article] [PubMed] [Google Scholar]
- 29. Lei Y, Yang H, Zhen L. Obesity is a risk factor for allergic rhinitis in children of Wuhan (China). Asia Pac Allergy 2016;6:101‐104. [DOI] [PMC free article] [PubMed] [Google Scholar]
- 30. Zhang Y, Zhang L. Increasing prevalence of allergic rhinitis in China. Allergy Asthma Immunol Res 2019;11:156‐169. [DOI] [PMC free article] [PubMed] [Google Scholar]
- 31. Bousquet J, Akdis C, Jutel M, et al. Intranasal corticosteroids in allergic rhinitis in COVID‐19 infected patients: An ARIA‐EAACI statement. Allergy 2020;75:2440‐2444. [DOI] [PubMed] [Google Scholar]
- 32. Li X, Xu S, Yu M, et al. Risk factors for severity and mortality in adult COVID‐19 inpatients in Wuhan. J Allergy Clin Immunol. 2020.146(1):110–118. [DOI] [PMC free article] [PubMed] [Google Scholar]
- 33. Jackson DJ, Busse WW, Bacharier LB, et al. Association of respiratory allergy, asthma, and expression of the SARS‐CoV‐2 receptor ACE2. J Allergy Clin Immunol. 2020.146(1):203–206. [DOI] [PMC free article] [PubMed] [Google Scholar]
- 34. Ducharme FM, Tse SM, Chauhan B. Diagnosis, management, and prognosis of preschool wheeze. Lancet 2014;383:1593‐1604. [DOI] [PubMed] [Google Scholar]
- 35. Bush A, Saglani S. Medical algorithm: Diagnosis and treatment of preschool asthma. Allergy 2020;75:2711‐2712. [DOI] [PubMed] [Google Scholar]
- 36. DeBiasi RL, Song X, Delaney M, et al. Severe Coronavirus Disease‐2019 in Children and Young Adults in the Washington, DC, Metropolitan Region. J Pediatr 2020;223:199–203. [DOI] [PMC free article] [PubMed] [Google Scholar]
- 37. Chao JY, Derespina KR, Herold BC, et al. Clinical Characteristics and Outcomes of Hospitalized and Critically Ill Children and Adolescents with Coronavirus Disease 2019 at a Tertiary Care Medical Center in New York City. J Pediatr 2020;223:14–19. [DOI] [PMC free article] [PubMed] [Google Scholar]
- 38. Zahran HS, Bailey CM, Damon SA, Garbe PL, Breysse PN. Vital Signs: Asthma in Children ‐ United States, 2001–2016. MMWR Morb Mortal Wkly Rep 2018;67:149‐155. [DOI] [PMC free article] [PubMed] [Google Scholar]
- 39. National Cooperative Group on Childhood Asthma , Institute of Environmental Health and Related Product Safety , Chinese Center for Disease Control and Prevention , Chinese Center for Disease Control and Prevention . [Third nationwide survey of childhood asthma in urban areas of China]. Zhonghua Er Ke Za Zhi. 2013;51:729‐735. [PubMed] [Google Scholar]
- 40. Zhou F, Yu T, Du R, et al. Clinical course and risk factors for mortality of adult inpatients with COVID‐19 in Wuhan, China: a retrospective cohort study. Lancet 2020;395(10229):1054‐1062. [DOI] [PMC free article] [PubMed] [Google Scholar]
- 41. Riphagen S, Gomez X, Gonzalez‐Martinez C, Wilkinson N, Theocharis P. Hyperinflammatory shock in children during COVID‐19 pandemic. Lancet. 2020;395(10237):1607‐1608. [DOI] [PMC free article] [PubMed] [Google Scholar]
- 42. Cai Q, Huang D, Ou P, et al. COVID‐19 in a designated infectious diseases hospital outside Hubei Province, China. Allergy. 2020;75(7):1742–1752. [DOI] [PubMed] [Google Scholar]
- 43. Wang F, Nie J, Wang H, et al. Characteristics of peripheral lymphocyte subset alteration in COVID‐19 pneumonia. J Infect Dis 2020;221(11):1762‐1769. [DOI] [PMC free article] [PubMed] [Google Scholar]
- 44. Liu Z, Long W, Tu M, et al. Lymphocyte subset (CD4+, CD8+) counts reflect the severity of infection and predict the clinical outcomes in patients with COVID‐19. J Infect 2020;81(2):318–356. [DOI] [PMC free article] [PubMed] [Google Scholar]
- 45. Duan YN, Zhu YQ, Tang LL, Qin J. CT features of novel coronavirus pneumonia (COVID‐19) in children. Eur Radiol. 2020;30(8):4427–4433. [DOI] [PMC free article] [PubMed] [Google Scholar]
- 46. Turunen R, Koistinen A, Vuorinen T, et al. The first wheezing episode: respiratory virus etiology, atopic characteristics, and illness severity. Pediatr Allergy Immunol 2014;25:796‐803. [DOI] [PMC free article] [PubMed] [Google Scholar]
- 47. Shen K, Yang Y, Wang T, et al. Diagnosis, treatment, and prevention of 2019 novel coronavirus infection in children: experts’ consensus statement. World J Pediatr 2020;16(3):223–231. [DOI] [PMC free article] [PubMed] [Google Scholar]
- 48. Hu X, Xing Y, Jia J, et al. Factors associated with negative conversion of viral RNA in patients hospitalized with COVID‐19. Sci Total Environ 2020;728:138812. [DOI] [PMC free article] [PubMed] [Google Scholar]
Associated Data
This section collects any data citations, data availability statements, or supplementary materials included in this article.
Supplementary Materials
Table S1‐S4