

Abstract
Background
Coronavirus disease‐2019 (COVID‐19) has a deleterious effect on several systems, including the cardiovascular system. We aim to systematically explore the association of COVID‐19 severity and mortality rate with the history of cardiovascular diseases and/or other comorbidities and cardiac injury laboratory markers.
Methods
The standardized mean difference (SMD) or odds ratio (OR) and 95% confidence intervals (CIs) were applied to estimate pooled results from the 56 studies. The prognostic performance of cardiac markers for predicting adverse outcomes and to select the best cutoff threshold was estimated by receiver operating characteristic curve analysis. Decision tree analysis by combining cardiac markers with demographic and clinical features was applied to predict mortality and severity in patients with COVID‐19.
Results
A meta‐analysis of 17 794 patients showed patients with high cardiac troponin I (OR = 5.22, 95% CI = 3.73‐7.31, P < .001) and aspartate aminotransferase (AST) levels (OR = 3.64, 95% CI = 2.84‐4.66, P < .001) were more likely to develop adverse outcomes. High troponin I more than 13.75 ng/L combined with either advanced age more than 60 years or elevated AST level more than 27.72 U/L was the best model to predict poor outcomes.
Conclusions
COVID‐19 severity and mortality are complicated by myocardial injury. Assessment of cardiac injury biomarkers may improve the identification of those patients at the highest risk and potentially lead to improved therapeutic approaches.
Keywords: cardiac injury, cardiac markers, COVID‐19, meta‐analysis, outcome, SARS‐CoV‐2
Highlights
COVID‐19 severity and mortality are complicated by myocardial injury.
Patients with high cardiac troponin I and AST levels were more likely to develop adverse outcomes.
High troponin I combined with either advanced age or elevated AST level was the best model to predict poor outcomes.
Assessment of cardiac injury biomarkers may improve identification of COVID‐19 patients at the highest risk.
Abbreviations
- AKI
acute kidney injury
- ARDS
acute respiratory distress syndrome
- AST
aspartate aminotransferase
- AUC
area under the curve
- CI
confidence intervals
- CK
creatine kinase
- CKD
chronic kidney disease
- COVID‐19
coronavirus disease‐2019
- cTnI
cardiac troponin I
- ICU
intensive care unit
- LDH
lactate dehydrogenase
- MERS
Middle East respiratory syndrome
- NT‐proBNP
N‐terminal‐pro hormone B‐type natriuretic peptide
- OR
odds ratio
- PRISMA
Preferred Reporting Items for Systematic Reviews and Meta‐Analyses
- ROC
receiver operating characteristic
- RT‐PCR
reverse transcription‐polymerase chain reaction
- SARS‐CoV‐2
severe acute respiratory syndrome coronavirus 2
- SMD
standardized mean difference
1. INTRODUCTION
The first incidence of coronavirus disease‐2019 (COVID‐19) was in December 2019 in Wuhan city, China which was attributed to viral infection with a newly originating Zoonotic virus. This virus is known as the severe acute respiratory syndrome coronavirus 2 (SARS‐CoV‐2). 1 , 2 Indeed, infection with coronavirus was detected before in China in 2002 to 2003 and was also later detected in Saudi Arabia and was given the name of Middle East respiratory syndrome (MERS‐CoV). 3 , 4 Although SARS‐CoV‐2 infection is considered the most serious infection worldwide, most of the infected individuals suffer from mild or moderate symptoms that begin in the first week after infection. The most common mild symptoms include fever, fatigue, and cough. However, infected patients may suffer from serious complications that vary in their degrees between different individuals such as dyspnea, severe pneumonia, and organ dysfunction. 1 Based on the previous facts, the diagnosis of COVID‐19 cannot be based on specific symptom detection and the only specific detection test depends on identification of the viral genome utilizing reverse transcription‐polymerase chain reaction (RT‐PCR) method. 1
Although China is the country of origin for COVID‐19, it has been spread everywhere all over the world. That is why several prospective and retrospective studies have been directed to characterize COVID‐19 and its complications among infected patients. Cardiovascular diseases are classified as one of the main reasons for mortality and morbidity among patients with COVID‐19. 5 , 6 , 7 Moreover, the presence of cardiovascular diseases is linked to poor prognosis among infected patients. 8 , 9 Moreover, it was also detected that SARS‐CoV‐2 infection is associated with aggravation in inflammation that can trigger cardiac arrhythmia, myocarditis, and inflammation in the vascular system that can induce heart destruction. 8
Based on the fact that COVID‐19 is a recently detected disease, there is no wonder that no sufficient clinical data that characterize the correlation between the severity and complication of COVID‐19 and cardiovascular or cerebrovascular diseases. Moreover, data available provide wide variations in results and do not determine the risk factors for COVID‐19. Thus, the current meta‐analysis aimed to gather a broad range of current studies to characterize the association between the history of cardiovascular diseases and their specific biological markers levels, and the severity of COVID‐19 and its rate of mortality.
2. METHODS
2.1. Search strategy
This systematic review and meta‐analysis were reported following the Preferred Reporting Items for Systematic Reviews and Meta‐Analyses (PRISMA) guidelines. We selected relevant studies published up to 8 May 2020, by searching Web of Science, PubMed, Scopus, and Science Direct search engines. We applied no language restrictions. Searches initially used the following strings: “Novel coronavirus 2019,” “2019 nCoV,” “COVID‐19,” “Wuhan coronavirus,” “Wuhan pneumonia,” or “SARS‐CoV‐2.” The results of these searches were combined with sets created with “Cardiac biomarkers,” “chronic heart disease,” “cardiovascular disease,” intensive care unit: “ICU,” “cardiac injury,” and “mortality.” Bibliographies of allocated articles were reviewed for possible data sources.
2.2. Selection criteria
We performed a systematic review of studies that explored pre‐existing cardiovascular diseases as risk factors of severe COVID‐19, cardiac injury, ICU admission, or mortality. Inclusion criteria for eligibility were as follows: (a) types of studies: a retrospective, prospective, observational, descriptive or case‐control studies reporting cardiac biomarkers (including cardiac troponin I (cTnI), creatine kinase (CK), CK‐MB, aspartate aminotransferase (AST), lactate dehydrogenase (LDH), myoglobin, or N‐terminal‐pro hormone B‐type natriuretic peptide (NT‐proBNP) in patients with COVID‐19; (b) subjects: diagnosed patients with COVID‐19; (c) exposure/intervention: enclosing at least one outcome data for severe (defined as acute respiratory distress syndrome, mechanical ventilation, and ICU admission) vs nonsevere, ICU admission vs floor admission, develop cardiac injury (defined as cTnI elevation above 99th percentile) vs not, or survived vs expired cohorts; and (d) outcome indicator: the mean and standard deviation for each laboratory test or event and total sample size for demographics, comorbidities, and complications. The following exclusion criteria were considered: (a) pre‐print, case reports, reviews, editorial materials, conference abstracts, and summaries of discussions, (b) insufficient reported data information; or (c) in vitro or in vivo studies.
2.3. Data abstraction
Two investigators separately conducted literature screening, followed by data abstraction in a predesigned excel sheet by four investigators (RE, AE, MNA, and MEM). Any disagreement was resolved by another investigator (ET). Study characteristics (author name, publication date, journal name, ethnicity, study design, and sample size) and the patients' demographics (age and gender) were collected.
2.4. Statistical analysis
Data analysis was performed using RevMan version 5.3 and comprehensive meta‐analysis software version 3.0. 10 The standardized mean difference (SMD) or odds ratio (OR) and 95% confidence intervals (CIs) were applied to estimate pooled results from studies. Two levels of analysis were conducted; (a) four pairwise comparison for severity, myocardial injury, ICU admission, and mortality, then (b) all studies related to severity, ICU admission, cardiac injury, and mortality were pooled together to compare between patients with poor vs good prognosis. The results of the included studies were performed with random‐effect models. 11 Heterogeneity was evaluated using Cochran's Q statistic and quantified by using Higgin's I 2 statistics. If there was statistical heterogeneity among the results, further sensitivity analysis and meta‐regression were performed to determine the source of heterogeneity. Receiver operating characteristic (ROC) curve analysis was performed to assess the prognostic performance of cardiac biomarkers and area under the curve (AUC) was calculated. Next, the risk assessment decision tree was employed to identify laboratory and clinical predictor factors for poor prognosis. Accuracy, precision, and recall of model performance were evaluated. R Studio was employed using the following packages: tidyverse, magrittr, rpart, caret, and pROC. Finally, publication bias was assessed using a funnel plot and quantified using Egger's linear regression test. Asymmetry of the collected studies’ distribution by visual inspection or P‐value < .1 indicated obvious publication bias. 12
3. RESULTS
3.1. Study selection and characteristics
Using the key terms, a total of 4021 articles were retrieved using the search strategy. After screening by the abstract and title of 1541 studies, 160 articles were selected for full‐text assessment. Of these, 104 were excluded due to lack of enough data, and 56 were included for qualitative analysis. Pairwise comparison meta‐analysis was conducted; 29 articles to compare between the severe and nonsevere presentation of COVID‐19 disease, seven records to compare between cohorts who developed cardiac injury and those who are not, six records to compare between patients who were admitted to the ICU and those admitted to the general hospital ward and 16 studies to compare between survivors and expired patients (Figure 1A). The study included a total of 56 studies (52 retrospective and 4 prospective studies) published from 24 January 2020 to 7 May 2020. 1 , 13 , 14 , 15 , 16 , 17 , 18 , 19 , 20 , 21 , 22 , 23 , 24 , 25 , 26 , 27 , 28 , 29 , 30 , 31 , 32 , 33 , 34 , 35 , 36 , 37 , 38 , 39 , 40 , 41 , 42 , 43 , 44 , 45 , 46 , 47 , 48 , 49 , 50 , 51 , 52 , 53 , 54 , 55 , 56 , 57 , 58 , 59 , 60 , 61 , 62 , 63 , 64 , 65 , 66 , 67 , 68 These included 17 794 COVID‐19 patients from China (13 cities) and overseas (Figure 1B,C). The main characteristics of eligible studies are demonstrated in Table 1.
Figure 1.
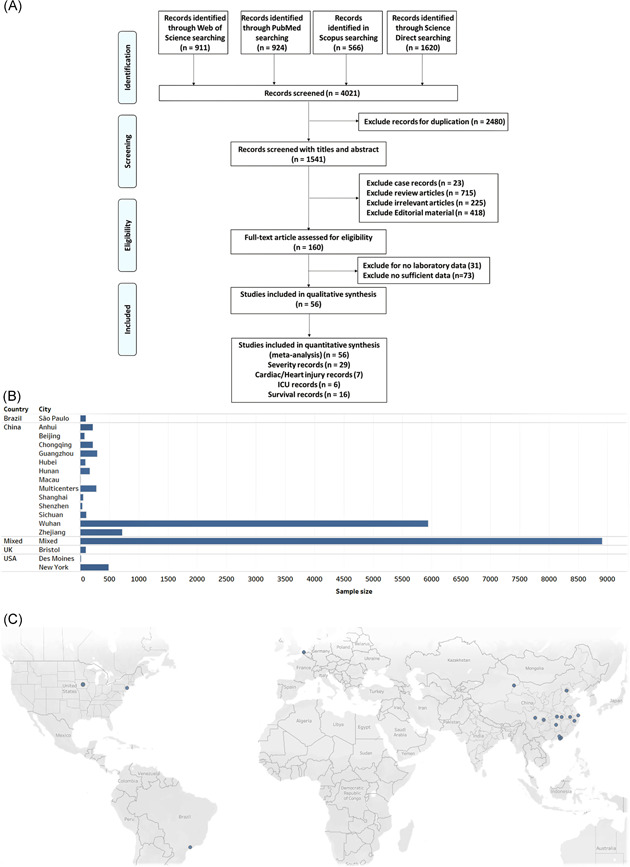
Selected studies. A, The workflow of the selection process. PRISMA guidelines were followed. B, The total sample size for each geographic location. Mixed: analysis included data from 169 hospitals located in 11 countries in Asia, Europe, and North America. C, Map of the source of patients with COVID‐19 in the eligible studies. COVID‐19, coronavirus disease‐2019; PRISMA, Preferred Reporting Items for Systematic Reviews and Meta‐Analyses
Table 1.
Characteristics of the included studies
| First author | Sample size | Age | Gender | |||||||||||
|---|---|---|---|---|---|---|---|---|---|---|---|---|---|---|
| (1) Severity | Year | Publication date | Journal name | Continent | Country | Ethnicity | Study design | Severe | Mild | Severe, M (SD) | Mild, M (SD) | Severe, (M/F) | Mild, (M/F) | Reference no. |
| Aggarwal S | 2020 | 29‐Apr | Diagnosis (Berl) | Des Moines | USA | American | Retrospective | 8 | 8 | 58.3 (28.6) | 68.2 (40.0) | 5/3 | 7/1 | 13 |
| Chen C | 2020 | 6‐Mar | Zhonghua Xin Xue Guan Bing Za Zhi | Wuhan | China | Asian | Retrospective | 24 | 126 | NA | NA | 18/6 | 66/60 | 14 |
| Chen G | 2020 | 27‐Mar | J Clin Invest | Wuhan | China | Asian | Retrospective | 11 | 10 | 61.2 (7.04) | 50.3 (9.8) | 10/1 | 7/3 | 15 |
| Deng Q | 2020 | 8‐Apr | Int J cardiol | Wuhan | China | Asian | Retrospective | 67 | 45 | 67.3 (14.8) | 54 (20.7) | 38/29 | 19/26 | 16 |
| Fang X | 2020 | 11‐Apr | J Infect | Anhui | China | Asian | Retrospective | 7 | 46 | 54.3 (15.4) | 39.9 (15.5) | 5/2 | 22/24 | 17 |
| Gao L | 2020 | 15‐Apr | Respir Res | Wuhan | China | Asian | Retrospective | 30 | 24 | 67.4 (14.4) | 51.6 (13.9) | 16/14 | 8/16 | 18 |
| He R | 2020 | 12‐Apr | J Clin Virol | Wuhan | China | Asian | Retrospective | 69 | 135 | 62.3 (16.3) | 42.3 (16.3) | 37/32 | 42/93 | 19 |
| Hong Y | 2020 | 8‐Apr | Ann Transl Med | Zhejiang | China | Asian | Retrospective | 25 | 50 | 44.1 (11.3) | 47.5 (14.2) | 11/14 | 30/20 | 20 |
| Lo I | 2020 | 15‐Mar | Int J Biol Sci | Macau | China | Asian | Retrospective | 4 | 6 | 61 (5.0) | 37 (19.0) | 1/3 | 2/4 | 21 |
| Mo P | 2020 | 16‐Mar | Clin Infect Dis | Wuhan | China | Asian | Retrospective | 85 | 70 | 60.7 (14.1) | 45.7 (15.6) | 55/30 | 31/39 | 22 |
| Pereira M | 2020 | 24‐Apr | Am J Transplant | New York | USA | American | Retrospective | 27 | 63 | 65.7 (13.3) | 52.3 (18.5) | 16/11 | 37/26 | 23 |
| Shi Y | 2020 | 18‐Mar | Crit Care | Zhejiang | China | Asian | Retrospective | 49 | 438 | 56 (17.0) | 45 (19.0) | 36/13 | 223/215 | 24 |
| Wan S | 2020 | 21‐Mar | J Med Virol | Chongqing | China | Asian | Retrospective | 40 | 95 | 60.3 (15.6) | 42 (11.8) | 21/19 | 52/43 | 25 |
| Wei Y | 2020 | 17‐Apr | J Infect | Anhui | China | Asian | Retrospective | 30 | 137 | 49 (12.6) | 40.8 (15.5) | 20/10 | 75/62 | 26 |
| Zhang G | 2020 | 9‐Apr | J Clin Virol | Wuhan | China | Asian | Retrospective | 55 | 166 | 62.7 (16.3) | 50.4 (20.9) | 35/20 | 73/93 | 27 |
| Zhang J | 2020 | 19‐Feb | Allergy | Wuhan | China | Asian | Retrospective | 58 | 82 | 58.7 (45.9) | 51.8 (38.5) | 33/25 | 38/44 | 28 |
| Zhao X | 2020 | 29‐Apr | BMC Infect Dis | Hubei | China | Asian | Retrospective | 30 | 61 | NA | NA | 14/16 | 35/26 | 29 |
| Zhu Z | 2020 | 22‐Apr | Int J Infect Dis | Zhejiang | China | Asian | Retrospective | 16 | 104 | 57.5 (11.7) | 49.9 (15.5) | 9/7 | 73/38 | 30 |
| Feng Y | 2020 | 10‐Apr | Am J Respir Crit Care Med | Wuhan | China | Asian | Retrospective | 54 | 352 | 57.7 (14.1) | 50.3 (19.3) | 33/21 | 190/162 | 31 |
| Han Y | 2020 | 27‐Mar | MedRxiv | Wuhan | China | Asian | Retrospective | 24 | 23 | 61 (41.5) | 62.2 (29.6) | 17/7 | 9/14 | 32 |
| Ma K | 2020 | 23‐Mar | MedRxiv | Chongqing | China | Asian | Retrospective | 20 | 64 | 60.3 (19.3) | 46.8 (11.6) | 12/8 | 36/28 | 33 |
| Zhao W | 2020 | 30‐Mar | MedRxiv | Beijing | China | Asian | Retrospective | 20 | 57 | 69 (15.0) | 45 (17.0) | 11/9 | 23/34 | 34 |
| Zheng F | 2020 | 24‐Mar | Eur Rev Med Pharmacol Sci | Hunan | China | Asian | Retrospective | 30 | 131 | 56.5 (14.4) | 40.7 (14.8) | 14/16 | 66/65 | 35 |
| Chen X | 2020 | 17‐Apr | Clin Infect Dis | Wuhan | China | Asian | Retrospective | 10 | 21 | 63.9 (15.2) | 52.8 (14.2) | 9/1 | 13/8 | 36 |
| Han H | 2020 | 31‐Mar | J Med Virol | Wuhan | China | Asian | Retrospective | 60 | 198 | 58.9 (14.4) | 58.9 (10.8) | 21/39 | 71/127 | 37 |
| Yang Y | 2020 | 29‐Apr | J Allergy Clin Immunol | Shenzhen | China | Asian | Retrospective | 25 | 14 | 58.3 (26.7) | 50.5 (41.5) | 14/11 | 7/7 | 38 |
| Li X | 2020 | 12‐Apr | J Allergy Clin Immunol | Wuhan | China | Asian | Retrospective | 269 | 279 | 63.7 (13.3) | 55.3 (16.3) | 153/116 | 126/153 | 39 |
| Zheng C | 2020 | 27‐Mar | Int J Infect Dis | Wuhan | China | Asian | Retrospective | 21 | 34 | NA | NA | NA | NA | 40 |
| Wu J | 2020 | 27‐Mar | J Intern Med | Multicenter | China | Asian | Retrospective | 83 | 197 | 63 (10.2) | 37.5 (17.1) | 45/38 | 106/91 | 41 |
| (2) Cardiac injury | With | Without | With, M (SD) | Without, M (SD) | With, (M/F) | Without, (M/F) | ||||||||
|---|---|---|---|---|---|---|---|---|---|---|---|---|---|---|
| Guo T | 2020 | 27‐Mar | JAMA Cardiol | Wuhan | China | Asian | Retrospective | 52 | 135 | 71.4 (9.4) | 53.5 (13.2) | 34/18 | 57/78 | 42 |
| Li M | 2020 | 18‐Apr | Nutrition, Metabolism & Cardiovascular Diseases | Wuhan | China | Asian | Retrospective | 42 | 41 | 60 (13.3) | 33 (5.2) | 18/24 | 16/25 | 43 |
| Shi S | 2020 | 25‐Mar | JAMA Cardiol | Wuhan | China | Asian | Retrospective | 82 | 334 | 67.7 (45.2) | 57 (51.1) | 44/38 | 161/173 | 44 |
| Liu Y | 2020 | 16‐Mar | MedRxiv | Guangzhou | China | Asian | Retrospective | 15 | 276 | 64 (12.6) | 47 (20.7) | 11/4 | 122/154 | 45 |
| Wei J | 2020 | 30‐Apr | Heart | Sichuan | China | Asian | Prospective | 16 | 85 | 69.5 (14.4) | 45 (16.3) | 7/9 | 47/38 | 46 |
| He X | 2020 | 30‐Apr | Zhonghua Xin Xue Guan Bing Za Zhi | Shanghai | China | Asian | Retrospective | 24 | 30 | 69.2 (8.5) | 66.1 (12.8) | 17/7 | 17/13 | 47 |
| Peng Y | 2020 | 2‐Mar | Zhonghua Xin Xue Guan Bing Za Zhi | Wuhan | China | Asian | Retrospective | 16 | 96 | 58.2 (6.7) | 61.5 (9.2) | 9/7 | 44/52 | 48 |
| (3) Admission | ICU | Floor | ICU, M (SD) | Floor, M (SD) | ICU, (M/F) | Floor, (M/F) | ||||||||
|---|---|---|---|---|---|---|---|---|---|---|---|---|---|---|
| Goyal P | 2020 | 18‐Apr | N Engl J Med | New York | USA | American | Retrospective | 130 | 263 | 63.3 (16.2) | 61.2 (20.7) | 92/38 | 146/117 | 49 |
| Chu Y | 2020 | 28‐April | J Infect | Zhejiang | China | Asian | Retrospective | 7 | 26 | 67 (17.7) | 64.7 (16.6) | 6/1 | 16/10 | 50 |
| Du R | 2020 | 7‐Apr | Ann Am Thorac Soc | Wuhan | China | Asian | Retrospective | 51 | 58 | 68.4 (9.7) | 72.7 (11.6) | 36/15 | 38/20 | 51 |
| Huang C | 2020 | 24‐Jan | The Lancet | Wuhan | China | Asian | Prospective | 13 | 28 | 50.3 (14.8) | 49.2 (12.2) | 11/2 | 19/9 | 1 |
| Lei S | 2020 | 4‐Apr | EClinicalMedicine | Wuhan | China | Asian | Retrospective | 15 | 19 | 57.7 (22.2) | 44.7 (21.5) | 5/10 | 9/10 | 52 |
| Wang D | 2020 | 7‐Feb | JAMA | Wuhan | China | Asian | Retrospective | 36 | 102 | 67 (15.6) | 50 (20.7) | 22/14 | 53/49 | 53 |
| (4) Mortality | Died | Alive | Died, M (SD) | Alive, M (SD) | Died, (M/F) | Alive, (M/F) | ||||||||
|---|---|---|---|---|---|---|---|---|---|---|---|---|---|---|
| Chen T | 2020 | 16‐Mar | BMJ | Wuhan | China | Asian | Retrospective | 113 | 161 | 69 (11.1) | 51.3 (21.5) | 83/30 | 88/73 | 54 |
| Du R | 2020 | 7‐May | Eur Respir J | Wuhan | China | Asian | Prospective | 21 | 158 | 70.2 (7.7) | 56 (13.5) | 10/11 | 87/71 | 55 |
| Mehra M | 2020 | 1‐May | N Engl J Med | Mixed | Mixed | Mixed | Retrospective | 515 | 8395 | 55.8 (15.1) | 48.7 (16.6) | 336/179 | 5003/3392 | 56 |
| Siciliano R | 2020 | 10‐Mar | Int J Infect Dis | São Paulo | Brazil | Latin American | Prospective | 26 | 71 | NA | NA | 19/7 | 42/29 | 57 |
| Tomlins J | 2020 | 27‐Apr | J Infect | Bristol | UK | Caucasian | Retrospective | 20 | 75 | 78 (9.6) | 70.7 (19.3) | 12/8 | 48/27 | 58 |
| Wang L | 2020 | 30‐Mar | J Infect | Wuhan | China | Asian | Retrospective | 65 | 274 | 76.3 (9.6) | 68.7 (7.4) | 39/26 | 127/147 | 59 |
| Zhou F | 2020 | 9‐Mar | Lancet | Wuhan | China | Asian | Retrospective | 54 | 137 | 69.3 (9.6) | 51.7 (9.6) | 38/16 | 81/56 | 60 |
| Zhou W | 2020 | 21‐Feb | Signal Transduction Targeted Therapy | Wuhan | China | Asian | Retrospective | 7 | 8 | 68 (3.3) | 56.3 (10.0) | 4/3 | 6/2 | 61 |
| Deng Y | 2020 | 20‐Mar | Chin Med J (Engl) | Wuhan | China | Asian | Retrospective | 109 | 116 | 68.3 (8.9) | 43.3 (17.8) | 73/36 | 51/65 | 62 |
| Fu L | 2020 | 16‐Mar | MedRxiv | Wuhan | China | Asian | Retrospective | 34 | 166 | NA | NA | 16/18 | NA | 63 |
| Li K | 2020 | 27‐Mar | MedRxiv | Wuhan | China | Asian | Retrospective | 15 | 87 | 68 (14.1) | 55 (16.3) | 48/39 | 11/4 | 64 |
| Luo X | 2020 | 23‐Mar | MedRxiv | Wuhan | China | Asian | Retrospective | 100 | 303 | 72 (11.1) | 49.3 (18.5) | 57/43 | 136/167 | 65 |
| Wang Y | 2020 | 8‐Apr | Am J Respir Crit Care Med | Wuhan | China | Asian | Retrospective | 133 | 211 | 69.7 (11.1) | 57.7 (16.3) | 74/59 | 105/106 | 66 |
| Zhang F | 2020 | 24‐Mar | MedRxiv | Wuhan | China | Asian | Retrospective | 17 | 31 | 78.6 (8.3) | 66.2 (13.7) | 12/5 | 21/10 | 67 |
| He X | 2020 | 30‐Apr | Zhonghua Xin Xue Guan Bing Za Zhi | Shanghai | China | Asian | Retrospective | 26 | 28 | 69.7 (10.4) | 64.8 (11.7) | 16/10 | 18/10 | 47 |
| Wang L | 2020 | 14‐Apr | Zhonghua Yan Ke Za Zhi | Wuhan | China | Asian | Retrospective | 33 | 169 | 74.3 (14.1) | 59 (13.3) | 23/10 | 65/104 | 68 |
3.2. Pooled analysis of demographic characteristics
The demographic characteristics of patients with COVID19 are shown in Table 2. The median age of 17 364 COVID‐19 patients across 53 studies ranged from 32 to 74 years in patients with a good prognosis and 47 to 77 years in patients with poor outcomes. Pooled estimates revealed significantly higher age in critical/expired cases (SMD = 1.0, 95% CI = 0.72‐1.31, P < .001) than the noncritical group. The results from 54 articles with a total sample size of 17 702 patients showed that the proportion of males was significantly higher in critical cases (OR = 1.50, 95% CI = 1.36‐1.69, P < .001). Evidence of heterogeneity and publication bias were observed for age data (I 2 = 97.1%, P < .001, Egger's P = .041), but not for gender (I 2 = 26.5%, P = .041, Egger's P = .58).
Table 2.
Predictors for poor outcomes in patients with COVID‐19
| Characteristics | Number studies | Sample size | Test of association | Effect size | Heterogeneity | Publication bias | |||||||
|---|---|---|---|---|---|---|---|---|---|---|---|---|---|
| Total | Poor prognosis | Good prognosis | Statistical method | Effect measure | Analysis model | Estimate | 95% CI | P‐value | I 2 | P‐value | P (Egger's test) | ||
| Demographic data | |||||||||||||
| Age | 53 | 17 364 | 2942 | 14 422 | IV | SMD | Random | 1.01 | 0.72‐1.31 | <.001 | 97.11% | <.001 | .041 |
| Sex (male) | 54 | 17 702 | 3022 | 14 680 | MH | OR | Random | 1.50 | 1.34‐1.69 | <.001 | 26.56% | .041 | .58 |
| Cardiac biomarkers | |||||||||||||
| Troponin I | 32 | 4953 | 1321 | 3632 | IV | SMD | Random | 0.96 | 0.71‐1.22 | <.001 | 91.9% | <.001 | .46 |
| Creatine kinase | 30 | 4528 | 1262 | 3266 | IV | SMD | Random | 0.68 | 0.47‐0.90 | <.001 | 89.32% | <.001 | .55 |
| CK‐MB | 27 | 3816 | 994 | 2822 | IV | SMD | Random | 0.80 | 0.59‐1.01 | <.001 | 86.63% | <.001 | .12 |
| AST | 38 | 5557 | 1483 | 4074 | IV | SMD | Random | 0.71 | 0.57‐0.84 | <.001 | 74.70% | <.001 | .25 |
| LDH | 30 | 3992 | 1145 | 2847 | IV | SMD | Random | 1.12 | 0.86‐1.38 | <.001 | 90.67% | <.001 | .57 |
| Myoglobin | 10 | 2232 | 536 | 1696 | IV | SMD | Random | 1.16 | 0.80‐1.51 | <.001 | 90.06% | <.001 | .98 |
| NT‐proBNP | 20 | 3240 | 719 | 2521 | IV | SMD | Random | 1.15 | 0.83‐1.48 | <.001 | 91.52% | <.001 | .80 |
| Presentation | |||||||||||||
| Chest pain/tightness | 18 | 3325 | 974 | 2351 | MH | OR | Random | 1.93 | 1.14‐3.28 | .014 | 70.23% | <.001 | .818 |
| Comorbidities | |||||||||||||
| Hypertension | 50 | 16 974 | 2782 | 14 192 | MH | OR | Random | 2.22 | 1.75‐2.81 | <.001 | 77.83% | <.001 | .027 |
| Diabetes | 51 | 17 120 | 2826 | 14 294 | MH | OR | Random | 1.88 | 1.59‐2.24 | <.001 | 32.08% | .020 | .96 |
| CHD | 40 | 15 864 | 2508 | 13 356 | MH | OR | Random | 3.42 | 2.65‐4.42 | <.001 | 49.86% | .011 | .031 |
| COPD | 35 | 14 658 | 2148 | 12 510 | MH | OR | Random | 3.08 | 2.36‐4.03 | <.001 | 10.12% | .30 | .42 |
| CVD | 21 | 3791 | 970 | 2821 | MH | OR | Random | 4.49 | 2.72‐7.40 | <.001 | 60.8% | <.001 | .85 |
| CKD | 26 | 5212 | 1450 | 3762 | MH | OR | Random | 2.75 | 1.77‐4.28 | <.001 | 32.4% | .06 | .046 |
| Cancer | 31 | 5563 | 1567 | 3996 | MH | OR | Random | 1.97 | 1.41‐2.76 | <.001 | 8.35% | .33 | .73 |
| Complications | |||||||||||||
| ARDS | 14 | 2963 | 877 | 2086 | MH | OR | Random | 34.8 | 13.6‐89.2 | <.001 | 87.6% | <.001 | .12 |
| Pneumonia | 10 | 1211 | 348 | 863 | MH | OR | Random | 3.66 | 2.04‐6.57 | <.001 | 0.0% | .52 | .72 |
| AKI | 13 | 2979 | 844 | 2135 | MH | OR | Random | 15.7 | 8.24‐30.2 | <.001 | 57.88% | <.001 | .83 |
| Liver injury | 11 | 2050 | 558 | 1492 | MH | OR | Random | 2.93 | 1.01‐8.46 | .049 | 86.55% | <.001 | .030 |
| Arrhythmia | 10 | 10 421 | 847 | 9574 | MH | OR | Random | 3.40 | 1.67‐6.94 | <.001 | 66.98% | <.001 | .35 |
| Heart failure | 9 | 10 391 | 781 | 9610 | MH | OR | Random | 4.15 | 2.41‐7.15 | <.001 | 56.8% | .020 | .23 |
| Coagulopathy | 4 | 996 | 221 | 775 | MH | OR | Random | 5.86 | 2.83‐12.13 | <.001 | 50.96% | .010 | .71 |
| Shock | 12 | 1915 | 628 | 1287 | MH | OR | Random | 36.9 | 11.05‐123.5 | <.001 | 70.16% | <.001 | .73 |
| Sepsis | 2 | 465 | 167 | 298 | MH | OR | Random | 220.0 | 30.38‐1593.71 | <.001 | 0.0% | .69 | NA |
| Treatment | |||||||||||||
| Antiviral | 16 | 3620 | 1150 | 2470 | MH | OR | Random | 0.985 | 0.67‐1.45 | .94 | 42.84% | .036 | .77 |
| Antibiotics | 11 | 2924 | 920 | 2004 | MH | OR | Random | 3.36 | 1.66‐6.77 | .001 | 71.46% | <.001 | .73 |
| Glucocorticoids | 23 | 3961 | 1289 | 2672 | MH | OR | Random | 3.52 | 2.51‐4.93 | <.001 | 67.97% | <.001 | .83 |
| Immunoglobulin | 12 | 2300 | 738 | 1562 | MH | OR | Random | 3.41 | 1.90‐6.14 | <.001 | 84.66% | <.001 | .16 |
| Lopinavir/ritonavir | 3 | 299 | 122 | 177 | MH | OR | Random | 0.620 | 0.097‐3.97 | .61 | 87.33% | <.001 | .72 |
| Oseltamivir | 2 | 494 | 130 | 364 | MH | OR | Random | 0.974 | 0.61‐1.56 | .91 | 5.46% | .30 | NA |
| Interferon | 4 | 842 | 302 | 540 | MH | OR | Random | 0.794 | 0.285‐2.21 | .65 | 79.84% | .002 | .43 |
| Hydroxychloroquine | 2 | 106 | 35 | 71 | MH | OR | Random | 6.67 | 2.00‐22.22 | .002 | 0.0% | .35 | NA |
| Azithromycin | 2 | 106 | 35 | 71 | MH | OR | Random | 5.49 | 1.13‐26.66 | .03 | 38.49% | .20 | NA |
Abbreviations: AKI, acute kidney injury; ARDS, acute respiratory distress syndrome; AST, aspartate aminotransferase; CHD, chronic heart disease; CI, confidence interval; CKD, chronic kidney disease; CK‐MB, creatine kinase myocardial band; COPD, chronic obstructive pulmonary disease; COVID‐2019, coronavirus disease‐2019; I2, the ratio of true heterogeneity to total observed variation; IV, inverse variance; LDH, lactate dehydrogenase; MH, Mantel‐Haenszel; NT‐proBNP, N‐terminal‐pro hormone B‐type natriuretic peptide; OR, odds ratio; SMD, standardized mean difference. Bold values indicate significance at P < 0.05.
3.3. Pooled analysis of cardiac biomarkers
The laboratory examination of the included studies is demonstrated in Table 2. Meta‐analysis showed higher levels of cardiac biomarkers in critical/expired patients; high‐sensitivity cTnI (SMD = 0.96, 95% CI = 0.71‐1.22, P < .001), creatine kinase (SMD = 0.68, 95% CI = 0.47‐0.90, P < .001), CK‐MB (SMD = 0.80, 95% CI = 0.59‐1.01, P < .001), AST (SMD = 0.71, 95% CI = 0.57‐0.84, P < .001), LDH (SMD = 1.12, 95% CI = 0.86‐1.38, P < .001), myoglobin (SMD = 1.16, 95% CI = 0.80‐1.51, P < .001), and NT‐proBNP (SMD = 1.15, 95% CI = 0.83‐1.48, P < .001). A considerable heterogeneity was observed across studies for all laboratory parameters; cTnI (I 2 = 91.9%, P < .001), creatine kinase (I 2 = 89.3%, P < .001), CK‐MB (I 2 = 86.6%, P < .001), AST (I 2 = 74.7%, P < .001), LDH (I 2 = 90.6%, P < .001), myoglobin (I 2 = 90.1%, P < .001), and NT‐proBNP (I 2 = 91.5%, P < .001). Subgroup analysis by ethnicity and sample size did not resolve heterogeneity. No evidence of publication bias was found for all laboratory tests.
3.4. Pooled analysis of comorbidities
We then compared the difference of the prevalence of the comorbidities in patients with poor outcomes compared with those with good outcomes. The presence of prior cerebrovascular diseases (OR = 4.49, 95% CI = 2.72‐7.40, P < .001) or chronic heart diseases (OR = 3.42, 95% CI = 2.65‐4.42, P < .001) had the highest risk for poor prognosis, followed by chronic obstructive pulmonary disease (COPD) (OR = 0.08, 95% CI = 2.36‐4.03, P < .001). For all other reported comorbid conditions, their proportion was also statistically higher in critical/expired group; chronic kidney disease (CKD) (OR = 2.75, 95% CI = 1.77‐4.28, P < .001), hypertension (OR = 2.22, 95% CI = 1.75‐2.81, P < .001), diabetes mellitus (OR = 1.88, 95% CI = 1.59‐2.24, P < .001), and malignant neoplasm (OR = 1.97, 95% CI = 1.41‐2.76, P < .001). Apart of articles for hypertension (I 2 = 77.8%, P < .001) and cerebrovascular diseases (I 2 = 60.8%, P < .001), homogeneity was observed across studies. Pairwise comparison yielded evidence of publication bias for hypertension (Egger's P‐value = .027), chronic heart disease (Egger's P‐value = .031), and CKD (Egger's P‐value = .046) (Table 2).
3.5. Pooled analysis of secondary complications
Summarizing analysis revealed a 93% increased risk of poor prognosis in cohorts who experienced chest pain or tightness (OR = 1.93, 95% CI = 1.14‐3.28, P = .014). In addition, meta‐analysis showed that patients with COVID‐19 who developed complications were more likely to have adverse outcomes with higher risk of mortality (Table 2). The highest risk was for those with ARDS (OR = 34.8, 95% CI = 13.6‐89.2, P < .001), shock (OR = 31.4, 95% CI = 6.26‐157, P < .001), and acute kidney injury (OR = 15.7, 95% CI = 8.24‐30.2, P < .001), followed by coagulopathy (OR = 5.86, 95% CI = 2.83‐12.13, P < .001), heart failure (OR = 4.15, 95% CI = 2.41‐7.15, P < .001), pneumonia (OR = 3.66, 95% CI = 2.04‐6.57, P < .001), arrhythmia (OR = 3.40, 95% CI = 1.67‐6.94, P < .001), and liver injury (OR = 2.93, 95% CI = 1.01‐8.46, P = .049). Obvious heterogeneity was observed across studies. Apart of liver injury articles (P = .030), the Egger's test provides no evidence of publication bias.
3.6. Pooled analysis of COVID‐19‐related medications
Furthermore, as depicted in Table 2 patients who received antibiotics (OR = 3.36, 95% CI = 1.66‐6.77, P = .001), glucocorticoids (OR = 3.52, 95% CI = 2.51‐4.93, P < .001), immunoglobulins (OR = 3.41, 95% CI = 1.90‐6.14, P < .001), and hydroxychloroquine (OR = 6.67, 95% CI = 2.0‐22.2, P = .002) had higher risk for poor prognosis. However, noteworthy, there was significant heterogeneity between studies (I 2 = 67.9%‐84.6%), and only two studies had reported hydroxychloroquine.
3.7. Pairwise comparisons for severity, cardiac injury, ICU admission, and mortality
Table S1 summarizes pooled estimates for seven cardiac biomarkers, eight comorbidities, and nine secondary complications in patients with COVID‐19 with severe presentation compared with nonsevere cohorts, who developed secondary cardiac injury versus not, ICU admitted patients vs general ward patients and survived vs expired. The Forest plot for the pooled analyses is presented in Figures S1‐S11. Funnel plots for assessment of publication bias are depicted in Figure S12. Meta‐regression to assess the impact of study characteristics as sample size, the city of the study, and timing of publications as moderators for the study effect size of each pairwise comparison is demonstrated in Table S2.
3.8. Meta‐regression analysis
To assess the impact of study characteristics as sample size, the city of the study, and timing of publications as moderators for the study effect size, meta‐regression was performed. Results of studies comparing critical/expired patients with noncritical cases suggested confounding of AST (coefficient = 0.31, 95% CI = 0.03‐0.59, P = .028) and pneumonia (coefficient = 1.39, 95% CI = 0.04‐2.74, P = .040) by publication date, and hypertension (coefficient = 0.76, 95% CI = 0.17‐1.35, P = .010) and chronic heart disease (coefficient = 0.75, 95% CI = 0.28‐1.22, P = .002) by ethnicity (Table 3).
Table 3.
Meta‐regression analysis for overall analysis
| Parameter | Feature | Categories | Number of studies | Coefficient | Lower bound | Upper bound | P‐value |
|---|---|---|---|---|---|---|---|
| (1) Demographic data | |||||||
| Age | Country of origin | China vs others | 48/5 | 0.74 | −0.59 | 2.08 | .28 |
| Sample size | >50 vs ≤50 | 42/11 | 0.57 | −0.39 | 1.54 | .25 | |
| Publication date | Jan‐Mar vs Apr‐May | 27/26 | 0.64 | −0.15 | 1.42 | .11 | |
| Male gender | Country of origin | China vs others | 48/6 | 0.07 | −0.20 | 0.34 | .60 |
| Sample size | >50 vs ≤50 | 43/43 | 0.02 | −0.51 | 0.56 | .94 | |
| Publication date | Jan‐Mar vs Apr‐May | 28/26 | 0.20 | −0.01 | 0.41 | .07 | |
| (2) Presentation | |||||||
| Chest pain or tightness | Sample size | >50 vs ≤50 | 16/2 | −0.83 | −2.87 | 1.21 | .42 |
| Publication date | Jan‐Mar vs Apr‐May | 10/8 | 0.12 | −0.92 | 1.18 | .81 | |
| (3) Cardiac biomarkers | |||||||
| Troponin I | Country of origin | China vs others | 28/4 | 0.34 | −0.72 | 1.40 | .53 |
| Sample size | >50 vs ≤50 | 27/5 | 0.28 | −0.67 | 1.24 | .56 | |
| Publication date | Jan‐Mar vs Apr‐May | 18/14 | 0.12 | −0.57 | 0.82 | .73 | |
| Creatine kinase | Country of origin | China vs others | 25/5 | 0.16 | −0.52 | 0.83 | .65 |
| Sample size | >50 vs ≤50 | 24/6 | 0.3 | −0.35 | 0.95 | .37 | |
| Publication date | Jan‐Mar vs Apr‐May | 18/12 | 0.36 | −0.15 | 0.87 | .17 | |
| CK‐MB | Country of origin | China vs others | 23/4 | 0.06 | −0.62 | 0.74 | .86 |
| Sample size | >50 vs ≤50 | 23/4 | 0.63 | −0.1 | 1.36 | .09 | |
| Publication date | Jan‐Mar vs Apr‐May | 13/14 | 0.48 | −0.001 | 0.96 | .05 | |
| AST | Country of origin | China vs others | 36/2 | −0.03 | −0.74 | 0.68 | .94 |
| Sample size | >50 vs ≤50 | 28/10 | 0.23 | −0.13 | 0.59 | .22 | |
| Publication date | Jan‐Mar vs Apr‐May | 22/16 | 0.31 | 0.03 | 0.59 | .028 | |
| LDH | Country of origin | China vs others | 29/1 | −0.1 | −1.91 | 1.71 | .91 |
| Sample size | >50 vs ≤50 | 22/8 | 0.27 | −0.4 | 0.93 | .43 | |
| Publication date | Jan‐Mar vs Apr‐May | 17/13 | 0.39 | −0.15 | 0.92 | .16 | |
| NT‐proBNP | Country of origin | China vs others | 19/1 | 0.3 | −1.14 | 1.74 | .68 |
| Sample size | >50 vs ≤50 | 19/1 | 0.5 | −0.98 | 1.99 | .51 | |
| Publication date | Jan‐Mar vs Apr‐May | 10/10 | 0.57 | −0.07 | 1.21 | .08 | |
| (4) Comorbidities | |||||||
| Hypertension | Country of origin | China vs others | 44/6 | 0.76 | 0.17 | 1.35 | .010 |
| Sample size | >50 vs ≤50 | 41/9 | 0.43 | −0.26 | 1.12 | .22 | |
| Publication date | Jan‐Mar vs Apr‐May | 27/23 | 0.24 | −0.17 | 0.64 | .25 | |
| Diabetes | Country of origin | China vs others | 45/6 | 0.3 | 0.04 | 0.57 | .14 |
| Sample size | >50 vs ≤50 | 42/9 | 0.51 | −0.15 | 1.18 | .34 | |
| Publication date | Jan‐Mar vs Apr‐May | 26/25 | 0.16 | −0.1 | 0.42 | .13 | |
| CHD | Country of origin | China vs others | 37/3 | 0.75 | 0.28 | 1.22 | .002 |
| Sample size | >50 vs ≤50 | 34/6 | 0.63 | −0.24 | 1.49 | .15 | |
| Publication date | Jan‐Mar vs Apr‐May | 25/15 | 0.2 | −0.2 | 0.6 | .33 | |
| COPD | Country of origin | China vs others | 30/5 | 0.61 | −0.09 | 1.32 | .09 |
| Sample size | >50 vs ≤50 | 31/4 | −0.28 | −1.96 | 1.40 | .74 | |
| Publication date | Jan‐Mar vs Apr‐May | 15/20 | 0.19 | −0.46 | 0.83 | .57 | |
| CVD | Country of origin | China vs others | 19/2 | 1.08 | −0.87 | 3.03 | .28 |
| Sample size | >50 vs ≤50 | 18/3 | 0.42 | −1.16 | 2.00 | .60 | |
| Publication date | Jan‐Mar vs Apr‐May | 11/10 | 0.45 | −0.48 | 1.38 | .35 | |
| CKD | Country of origin | China vs others | 23/3 | 0.62 | −0.32 | 1.56 | .20 |
| Sample size | >50 vs ≤50 | 22/4 | −0.06 | −1.47 | 1.34 | .93 | |
| Publication date | Jan‐Mar vs Apr‐May | 13/13 | −0.20 | −0.62 | 1.01 | .63 | |
| Cancer | Country of origin | China vs others | 28/3 | 0.33 | −0.88 | 1.53 | .59 |
| Sample size | >50 vs ≤50 | 26/5 | −0.48 | −1.61 | 0.66 | .41 | |
| Publication date | Jan‐Mar vs Apr‐May | 15/16 | 0.43 | −0.25 | 1.10 | .21 | |
| (5) Complications | |||||||
| ARDS | Country of origin | China vs others | 13/1 | −3.82 | −11.04 | 3.41 | .30 |
| Sample size | >50 vs ≤50 | 12/2 | 3.95 | −1.36 | 9.26 | .15 | |
| Publication date | Jan‐Mar vs Apr‐May | 9/5 | 0.41 | −1.90 | 2.71 | .73 | |
| Pneumonia | Country of origin | China vs others | 9/1 | −3.26 | −7.81 | 1.28 | .16 |
| Sample size | >50 vs ≤50 | 8/2 | 0.73 | −2.77 | 4.21 | .68 | |
| Publication date | Jan‐Mar vs Apr‐May | 6/4 | 1.39 | 0.04 | 2.74 | .040 | |
| AKI | Country of origin | China vs others | 12/1 | −0.71 | −4.44 | 3.02 | .71 |
| Sample size | >50 vs ≤50 | 12/1 | 0.23 | −1.21 | 1.67 | .75 | |
| Liver injury | Country of origin | China vs others | 10/1 | −0.89 | −4.82 | 3.04 | .66 |
| Sample size | >50 vs ≤50 | 10/1 | −0.68 | −2.79 | 1.44 | .53 | |
| Arrhythmia | Country of origin | China vs others | 7/3 | 0.82 | −1.02 | 2.66 | .38 |
| Sample size | >50 vs ≤50 | 8/2 | 0.83 | −1.36 | 3.01 | .46 | |
| Publication date | Jan‐Mar vs Apr‐May | 4/6 | 0.17 | −1.65 | 2.00 | .85 | |
| Heart failure | Country of origin | China vs others | 6/3 | 0.76 | 0.08 | 1.44 | .030 |
| Publication date | Jan‐Mar vs Apr‐May | 6/3 | −0.03 | −0.72 | 0.66 | .93 | |
| Shock | Sample size | >50 vs ≤50 | 8/4 | 1.97 | −0.10 | 4.05 | .06 |
| Publication date | Jan‐Mar vs Apr‐May | 8/4 | −1.25 | −3.25 | 0.75 | .22 | |
| (6) Treatment | |||||||
| Antiviral | Sample size | >50 vs ≤50 | 15/4 | −0.27 | −2.35 | 1.80 | .79 |
| Publication date | Jan‐Mar vs Apr‐May | 7/12 | 0.24 | −1.25 | 1.73 | .75 | |
| Antibiotics | Sample size | >50 vs ≤50 | 11/4 | 1.14 | −0.99 | 3.28 | .29 |
| Publication date | Jan‐Mar vs Apr‐May | 10/5 | 0.59 | −0.80 | 1.99 | .40 | |
| Glucocorticoids | Sample size | >50 vs ≤50 | 17/6 | 0.29 | −0.68 | 1.27 | .55 |
| Publication date | Jan‐Mar vs Apr‐May | 12/11 | 0.06 | −0.63 | 0.76 | .85 | |
| Immunoglobulin | Sample size | >50 vs ≤50 | 10/2 | 0.25 | −1.49 | 2.01 | .77 |
| Publication date | Jan‐Mar vs Apr‐May | 8/4 | 0.69 | −0.50 | 1.90 | .25 |
Note: Variables with number of studies ≥10 were included.
Abbreviations: AKI, acute kidney injury; ARDS, acute respiratory distress syndrome; AST, aspartate aminotransferase; CHD, chronic heart disease; CKD, chronic kidney disease; CK‐MB, creatine kinase‐MB; COPD, chronic obstructive pulmonary disease; CVD, cardiovascular disease; LDH, lactate dehydrogenase; NT‐proBNP, N‐terminal‐pro hormone B‐type natriuretic peptide.
3.9. Decision tree classifier model
Receiver operating characteristics (ROC) curves were first employed to analyze the prognostic performance of cardiac markers for predicting adverse outcomes and to select the best cutoff threshold with high sensitivity and specificity. The highest area under the curves (AUC) were for myoglobin (AUC = 0.91 ± 0.07, P = .002) and high‐sensitive cTnI (AUC = 0.89 ± 0.04, P < .001) at the cutoff values of 72 ng/mL and 13.75 ng/L, respectively, followed by NT‐proBNP (AUC = 0.86 ± 0.06, P < .001) and AST (AUC = 0.84 ± 0.04, P < .001). Combining cardiac markers with demographic and clinical features, decision tree analysis was used to predict mortality and severity in patients with COVID‐19. Age, cTnI, and AST levels were able to classify patients into high and low‐risk patients (Figure 2A,B). High troponin I over 13.75 ng/L combined with either advanced age over 60 years or elevated AST level over 27.72 U/L were the best model to predict poor outcomes (classification accuracy = 81.03%, precision = 74.1%, recall = 86.0%, and diagnostic odds ratio = 20.8). After conversion of SMD to OR, meta‐analysis showed that patients with high cTnI (OR = 5.22, 95% CI = 3.73‐7.31, P < .001) and AST levels (OR = 3.64, 95% CI = 2.84‐4.66, P < .001) were more likely to develop adverse outcomes for COVID‐19 disease.
Figure 2.
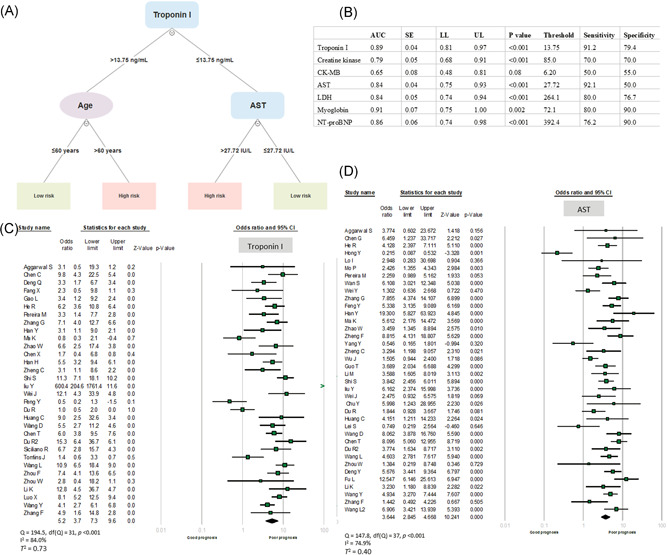
A, Decision tree model analysis for clinical and cardiac biomarkers. Based on several inputs (clinical parameters and biomarkers), a model was created by a multilevel split. Each interior node corresponds to one of the input variables, each leaf represents a value of the target variable given the values of the input variables represented by the path from the root to the leaf. B, Receiver operating characteristics for cardiac biomarkers. C, Forest plot of high‐sensitivity cardiac troponin I in critical/expired patients compared to noncritical cases. Each horizontal bar represents a study, with lines extending from the symbols representing 95% confidence intervals. The size of the data marker indicates relative weight. Pooled estimates are represented by the black diamond. D, Forest plot for AST in critical/expired patients compared with noncritical cases. AST, aspartate aminotransferase; AUC, area under the curve; CK‐MB, creatine kinase myocardial band; LDH, lactate dehydrogenase; NT‐proBNP, N‐terminal‐pro hormone B‐type natriuretic peptide; LL, lower limit; SE, standard error; UL, upper limit
4. DISCUSSION
Our meta‐analysis has several important aspects. We include a robust sample size with broad, global geographic reach. Utilizing a two‐arms meta‐analysis for 56 articles and 17 794 COVID‐19 subjects, our findings reveal the association of COVID‐19 mortality with high levels of cardiac biomarkers. We amplify previous smaller meta‐analyses and the single site or regional studies. Furthermore, as of 8 May 2020, we enclosed a larger number of studies and patients, and involved more cardiac biomarkers, demographics, and clinical data than prior studies, demonstrating multiple predictors of cardiac injury, poor prognosis, severity, ICU admission, and mortality. In addition, for prognostic risk assessment, we employed decision tree model analysis for both serum biomarkers and the clinical data and performed ROC curves analyses. Although our analysis included 169 hospitals located in 11 countries in Asia and Europe, it is largely retrospective.
Meta‐regression analyses indicated the pooled results were independent to study characteristics and decision tree analysis revealed that cTnI, AST, and potentially other serum biomarkers could be predictors of risk. One significant limitation, inherent in the use of meta‐analyses to guide further clinical practice is the heterogeneity across studies, including differences in study methods.
COVID‐19 pulmonary and cardiac complications are difficult to disaggregate. Before the SARS‐CoV‐2 pandemic, acute viral infections were associated with acute coronary syndromes. 69 Despite limited elevated cTnl findings in less severe cases, significantly higher cTnI unmasks the subset of patients with poorer outcomes as earlier seen in 341 patients from China. 70
Similarly, in 112 patients with COVID‐19 in China, elevated troponin was linked to severity and mortality despite normal levels of troponin at admission. 16 Another prior systematic literature, from 1 December 2019 to 27 March 2020, in 4189 patients with COVID‐19 from 28 studies, higher mean troponin, with a similar trend for CK‐MB, myoglobin, and NT‐proBNP were associated with higher mortality (summary risk ratio 3.85, 2.13‐6.96; P < .001). 71
A recent retrospective single‐center cohort study of patients between 28 January 2020 and 16 March 2020, from the Central Hospital of Wuhan, also reported 176 patients (116 survivors, 60 nonsurvivors) with elevated cTnI and increased odds of mortality by the regression models. 72
Moreover, a larger cohort enrolled 671 patients with severe COVID‐19 from 1 January to 23 February 2020. As a predictor of in‐hospital mortality, the area under the receiver operating characteristic curve of initial cTnI was 0.92 (95% CI, 0.87‐0.96; sensitivity, 0.86; specificity, 0.86; P < .001). Overall, multiple abnormal laboratory values on admission were higher in nonsurvivors, including CK‐MB, myoglobin, cTnI, and NT‐proBNP (all P < .001). 73
The exact pathway by which elevated biomarkers leads to death with COVID‐19 with systemic inflammatory activity may include myocarditis, thrombosis, and additionally unstable coronary atherosclerotic plaque rupture. Hence, beyond the predominant pulmonary complications, severity, and mortality sources include viral myocarditis, cytokine‐driven myocardial damage, microangiopathy, and acute coronary syndromes. 74 Therefore, biomarkers may identify a heightened inflammatory response, including endothelial dysfunction and microvascular damage.
There are several limitations to our analysis and review. The actual cause of mortality may be obscured by unmeasured or unknown confounders, underestimated by analysis of multivariable regression. Understanding CVD‐associated mortality must integrate biomarker data with cardiac imaging and physiologic and structural abnormalities. In addition, the percentage of patients with sepsis has been underreported in our report and cardiac injury may correlate with the prevalence of shock with severe COVID‐19. 75 Another limitation of these data is the lack of a determination of timing and estimated glomerular filtration rate as factors. Although cardiac biomarkers may reflect myocardial injury, inflammation, and remodeling, interpretation of biomarkers in chronic kidney disease (CKD) can be complicated by decreased urinary clearance and/or overall CKD‐associated chronic inflammation. The prognostic power of future biomarker analyses for COVID‐19 mortality should be trended over time and account for the degree of renal dysfunction. 76 Finally, in consideration of the immense COVID‐19 global mortality, over 360 000 deaths, 77 with over 100 000 deaths in the US alone 78 at the time of manuscript submission, despite our relatively large sample size, our data will require ongoing supplementation, to overcome inherent statistical bias and confirming our results.
In conclusion, COVID‐19 severity and mortality are compounded by vascular and myocardial injury. Elevated cardiac injury biomarkers may improve the identification of those patients at the highest risk and potentially lead to improved therapeutic approaches.
CONFLICT OF INTERESTS
All the authors declare that there are no conflict of interests.
AUTHOR CONTRIBUTIONS
EAT and RME: study design; RME, AE, MNA, ME‐M, and ME‐M: study identification and data extraction; EAT, RME, and MHH: statistical analysis; EAT, RME, MHH, AE, and MSF: data interpretation; EAT, RME, MHH, AE, MNA, M E‐M, M E‐M, KCF, and MSF: original draft preparation. All authors revised and approved the final version of the manuscript.
Supporting information
Supporting information
Toraih EA, Elshazli RM, Hussein MH, et al. Association of cardiac biomarkers and comorbidities with increased mortality, severity, and cardiac injury in COVID‐19 patients: A meta‐regression and decision tree analysis. J Med Virol. 2020;92:2473–2488. 10.1002/jmv.26166
Contributor Information
Rami M. Elshazli, Email: Relshazly@horus.edu.eg.
Mohammad H. Hussein, Email: mhussein1@tulane.edu.
Abdelaziz Elgaml, Email: Elgamel3a@mans.edu.eg.
Mohamed Amin, Email: Dr.mohamednasr@hotmail.com.
Mohammed El‐Mowafy, Email: Seven@mans.edu.eg.
Mohamed El‐Mesery, Email: Elmesery@hotmail.com.
Juan Duchesne, Email: jduchesn@tulane.edu.
Mary T. Killackey, Email: mkillack@tulane.edu.
Keith C. Ferdinand, Email: kferdina@tulane.edu.
Emad Kandil, Email: ekandil@tulane.edu.
Manal S. Fawzy, Email: manal_mohamed@med.suez.edu.eg.
REFERENCES
- 1. Huang C, Wang Y, Li X, et al. Clinical features of patients infected with 2019 novel coronavirus in Wuhan, China. Lancet. 2020;395(10223):497‐506. [DOI] [PMC free article] [PubMed] [Google Scholar]
- 2. Rodriguez‐Morales AJ, Cardona‐Ospina JA, Gutiérrez‐Ocampo E, et al. Clinical, laboratory and imaging features of COVID‐19: a systematic review and meta‐analysis. Travel Med Infect Dis. 2020;34:101623. [DOI] [PMC free article] [PubMed] [Google Scholar]
- 3. Al‐Tawfiq JA, Gautret P. Asymptomatic Middle East respiratory syndrome coronavirus (MERS‐CoV) infection: extent and implications for infection control: a systematic review. Travel Med Infect Dis. 2019;27:27‐32. [DOI] [PMC free article] [PubMed] [Google Scholar]
- 4. Ksiazek TG, Erdman D, Goldsmith CS, et al. A novel coronavirus associated with severe acute respiratory syndrome. N Engl J Med. 2003;348(20):1953‐1966. [DOI] [PubMed] [Google Scholar]
- 5. Ahmed I, Azhar A, Eltaweel N, Tan BK. First Covid‐19 maternal mortality in the UK associated with thrombotic complications. Br J Haematol. 2020;22:19458. [DOI] [PMC free article] [PubMed] [Google Scholar]
- 6. Pranata R, Huang I, Lim MA, Wahjoepramono PEJ, July J. Impact of cerebrovascular and cardiovascular diseases on mortality and severity of COVID‐19 ‐ systematic review, meta‐analysis, and meta‐regression. J Stroke Cerebrovasc Dis. 2020:104949. [DOI] [PMC free article] [PubMed] [Google Scholar]
- 7. Shi Q, Zhang X, Jiang F, et al. Clinical characteristics and risk factors for mortality of COVID‐19 patients with diabetes in Wuhan, China: a two‐center, retrospective study. Diabetes Care. 2020;43(6):dc200598. [DOI] [PubMed] [Google Scholar]
- 8. Li B, Yang J, Zhao F, et al. Prevalence and impact of cardiovascular metabolic diseases on COVID‐19 in China. Clin Res Cardiol. 2020;109(5):531‐538. [DOI] [PMC free article] [PubMed] [Google Scholar]
- 9. Madjid M, Safavi‐Naeini P, Solomon SD, Vardeny O. Potential effects of coronaviruses on the cardiovascular system: a review [published online ahead of print March 27, 2020]. JAMA Cardiol. 2020. 10.1001/jamacardio.2020.1286 [DOI] [PubMed] [Google Scholar]
- 10. Borenstein M, Hedges LV, Higgins JPT, Rothstein HR. Comprehensive meta‐analysis (version 2.2.027) [Computer software]. Englewood, NJ: Biostat. Organ Res Methods. 2006;11(1):188‐191. [Google Scholar]
- 11. DerSimonian R, Kacker R. Random‐effects model for meta‐analysis of clinical trials: an update. Contemp Clin Trials. 2007;28(2):105‐114. [DOI] [PubMed] [Google Scholar]
- 12. Lin L, Chu H. Quantifying publication bias in meta‐analysis. Biometrics. 2018;74(3):785‐794. [DOI] [PMC free article] [PubMed] [Google Scholar]
- 13. Aggarwal S, Garcia‐Telles N, Aggarwal G, Lavie C, Lippi G, Henry BM. Clinical features, laboratory characteristics, and outcomes of patients hospitalized with coronavirus disease 2019 (COVID‐19): early report from the United States. Diagnosis (Berl). 2020;7(2):91‐96. [DOI] [PubMed] [Google Scholar]
- 14. Chen C, Chen C, Yan JT, Zhou N, Zhao JP, Wang DW. [Analysis of myocardial injury in patients with COVID‐19 and association between concomitant cardiovascular diseases and severity of COVID‐19]. Zhonghua Xin Xue Guan Bing Za Zhi. 2020;48(0):E008. [DOI] [PubMed] [Google Scholar]
- 15. Chen G, Wu D, Guo W, et al. Clinical and immunological features of severe and moderate coronavirus disease 2019. J Clin Invest. 2020;130(5):2620‐2629. [DOI] [PMC free article] [PubMed] [Google Scholar]
- 16. Deng Q, Hu B, Zhang Y, et al. Suspected myocardial injury in patients with COVID‐19: evidence from front‐line clinical observation in Wuhan, China. Int J Cardiol. 2020;311:116‐121. [DOI] [PMC free article] [PubMed] [Google Scholar]
- 17. Fang X, Mei Q, Yang T, et al. Low‐dose corticosteroid therapy does not delay viral clearance in patients with COVID‐19. J Infect. 2020;81:147‐178. [DOI] [PMC free article] [PubMed] [Google Scholar]
- 18. Gao L, Jiang D, Wen XS, et al. Prognostic value of NT‐proBNP in patients with severe COVID‐19. Respir Res. 2020;21(1):83. [DOI] [PMC free article] [PubMed] [Google Scholar]
- 19. He R, Lu Z, Zhang L, et al. The clinical course and its correlated immune status in COVID‐19 pneumonia. J Clin Virol. 2020;127:104361. [DOI] [PMC free article] [PubMed] [Google Scholar]
- 20. Hong Y, Wu X, Qu J, Gao Y, Chen H, Zhang Z. Clinical characteristics of coronavirus disease 2019 and development of a prediction model for prolonged hospital length of stay. Ann Transl Med. 2020;8(7):443. [DOI] [PMC free article] [PubMed] [Google Scholar]
- 21. Lo IL, Lio CF, Cheong HH, et al. Evaluation of SARS‐CoV‐2 RNA shedding in clinical specimens and clinical characteristics of 10 patients with COVID‐19 in Macau. Int J Biol Sci. 2020;16(10):1698‐1707. [DOI] [PMC free article] [PubMed] [Google Scholar]
- 22. Mo P, Xing Y, Xiao Y, et al. Clinical characteristics of refractory COVID‐19 pneumonia in Wuhan, China [published online ahead of print March 16, 2020]. Clin Infect Dis. 2020. 10.1093/cid/ciaa270 [DOI] [Google Scholar]
- 23. Pereira MR, Mohan S, Cohen DJ, et al. COVID‐19 in solid organ transplant recipients: initial report from the US epicenter [published online ahead of print April 24, 2020]. Am J Transplant. 2020. 10.1111/ajt.15941 [DOI] [PMC free article] [PubMed] [Google Scholar]
- 24. Shi Y, Yu X, Zhao H, Wang H, Zhao R, Sheng J. Host susceptibility to severe COVID‐19 and establishment of a host risk score: findings of 487 cases outside Wuhan. Crit Care. 2020;24(1):108. [DOI] [PMC free article] [PubMed] [Google Scholar]
- 25. Wan S, Xiang Y, Fang W, et al. Clinical features and treatment of COVID‐19 patients in northeast Chongqing. J Med Virol. 2020;92:797‐806. [DOI] [PMC free article] [PubMed] [Google Scholar]
- 26. Wei YY, Wang RR, Zhang DW, et al. Risk factors for severe COVID‐19: evidence from 167 hospitalized patients in Anhui, China [published online ahead of print April 17, 2020]. J Infect. 2020. 10.1016/j.jinf.2020.04.010 [DOI] [PMC free article] [PubMed] [Google Scholar]
- 27. Zhang G, Hu C, Luo L, et al. Clinical features and short‐term outcomes of 221 patients with COVID‐19 in Wuhan, China. J Clin Virol. 2020;127:104364. [DOI] [PMC free article] [PubMed] [Google Scholar]
- 28. Zhang J, Dong X, Cao Y, et al. Clinical characteristics of 140 patients infected with SARS‐CoV‐2 in Wuhan, China [published online ahead of print February 19, 2020]. Allergy. 2020. 10.1111/all.14238 [DOI] [PubMed] [Google Scholar]
- 29. Zhao XY, Xu XX, Yin HS, et al. Clinical characteristics of patients with 2019 coronavirus disease in a non‐Wuhan area of Hubei Province, China: a retrospective study. BMC Infect Dis. 2020;20(1):311. [DOI] [PMC free article] [PubMed] [Google Scholar]
- 30. Zhu Z, Cai T, Fan L, et al. Clinical value of immune‐inflammatory parameters to assess the severity of coronavirus disease 2019. Int J Infect Dis. 2020;95:332‐339. [DOI] [PMC free article] [PubMed] [Google Scholar]
- 31. Feng Y, Ling Y, Bai T, et al. COVID‐19 with different severity: a multi‐center study of clinical features. Am J Respir Crit Care Med. 2020;201:1380‐1388. [DOI] [PMC free article] [PubMed] [Google Scholar]
- 32. Han Y, Zhang H, Mu S, et al. Lactate dehydrogenase, a risk factor of severe COVID‐19 patients [published online ahead of print March 27, 2020]. medRxiv. 2020. 10.1101/2020.03.24.20040162 [DOI] [Google Scholar]
- 33. Li HC, Ma J, Zhang H, et al. COVID‐19 myocarditis and severity factors: an adult cohort study. medRxiv. 2020;43:396‐400. [Google Scholar]
- 34. Zhao W, Yu S, Zha X, et al. Clinical characteristics and durations of hospitalized patients with COVID‐19 in Beijing: a retrospective cohort study [published online ahead of print March 30, 2020]. medRxiv. 2020. 10.1101/2020.03.13.20035436 [DOI] [Google Scholar]
- 35. Zheng F, Tang W, Li H, Huang YX, Xie YL, Zhou ZG. Clinical characteristics of 161 cases of corona virus disease 2019 (COVID‐19) in Changsha. Eur Rev Med Pharmacol Sci. 2020;24(6):3404‐3410. [DOI] [PubMed] [Google Scholar]
- 36. Chen X, Zhao B, Qu Y, et al. Detectable serum SARS‐CoV‐2 viral load (RNAaemia) is closely correlated with drastically elevated interleukin 6 (IL‐6) level in critically ill COVID‐19 patients [published online ahead of print April 17, 2020]. Clin Infect Dis. 2020. 10.1093/cid/ciaa449 [DOI] [PMC free article] [PubMed] [Google Scholar]
- 37. Han H, Xie L, Liu R, et al. Analysis of heart injury laboratory parameters in 273 COVID‐19 patients in one hospital in Wuhan, China. J Med Virol. 2020;92:819‐823. [DOI] [PMC free article] [PubMed] [Google Scholar]
- 38. Yang Y, Shen C, Li J, et al. Plasma IP‐10 and MCP‐3 levels are highly associated with disease severity and predict the progression of COVID‐19 [published online ahead of print April 29, 2020]. J Allergy Clin Immunol. 2020. 10.1016/j.jaci.2020.04.027 [DOI] [PMC free article] [PubMed] [Google Scholar]
- 39. Li X, Xu S, Yu M, et al. Risk factors for severity and mortality in adult COVID‐19 inpatients in Wuhan [published online ahead of print April 12, 2020]. J Allergy Clin Immunol. 2020. 10.1016/j.jaci.2020.04.006 [DOI] [PMC free article] [PubMed] [Google Scholar]
- 40. Zheng C, Wang J, Guo H, et al. Risk‐adapted treatment strategy for COVID‐19 patients. Int J Infect Dis. 2020;94:74‐77. [DOI] [PMC free article] [PubMed] [Google Scholar]
- 41. Wu J, Li W, Shi X, et al. Early antiviral treatment contributes to alleviate the severity and improve the prognosis of patients with novel coronavirus disease (COVID‐19) [published online ahead of print March 27, 2020]. J Intern Med. 2020. 10.1111/joim.13063 [DOI] [PubMed] [Google Scholar]
- 42. Guo T, Fan Y, Chen M, et al. Cardiovascular implications of fatal outcomes of patients with coronavirus disease 2019 (COVID‐19) [published online ahead of print March 27, 2020]. JAMA Cardiol. 2020. 10.1001/jamacardio.2020.1017 [DOI] [PMC free article] [PubMed] [Google Scholar]
- 43. Li M, Dong Y, Wang H, et al. Cardiovascular disease potentially contributes to the progression and poor prognosis of COVID‐19 [published online ahead of print April 18, 2020]. Nutr Metab Cardiovasc Dis. 2020. 10.1016/j.numecd.2020.04.013 [DOI] [PMC free article] [PubMed] [Google Scholar]
- 44. Shi S, Qin M, Shen B, et al. Association of cardiac injury with mortality in hospitalized patients with COVID‐19 in Wuhan, China [published online ahead of print March 25, 2020]. JAMA Cardiol. 2020:e200950. 10.1001/jamacardio.2020.0950 [DOI] [PMC free article] [PubMed] [Google Scholar]
- 45. Liu Y, Li J, Liu D, et al. Clinical features and outcomes of 2019 novel coronavirus‐infected patients with cardiac injury [published online ahead of print March 16, 2020]. medRxiv. 2020. 10.1101/2020.03.11.20030957 [DOI] [Google Scholar]
- 46. Wei JF, Huang FY, Xiong TY, et al. Acute myocardial injury is common in patients with covid‐19 and impairs their prognosis [published online ahead of print April 30, 2020]. Heart. 2020. 10.1136/heartjnl-2020-317007 [DOI] [PMC free article] [PubMed] [Google Scholar]
- 47. He XW, Lai JS, Cheng J, et al. [Impact of complicated myocardial injury on the clinical outcome of severe or critically ill COVID‐19 patients]. Zhonghua Xin Xue Guan Bing Za Zhi. 2020;48(0):E011. [DOI] [PubMed] [Google Scholar]
- 48. Peng YD, Meng K, Guan HQ, et al. [Clinical characteristics and outcomes of 112 cardiovascular disease patients infected by 2019‐nCoV]. Zhonghua Xin Xue Guan Bing Za Zhi. 2020;48(0):E004. [DOI] [PubMed] [Google Scholar]
- 49. Goyal P, Choi JJ, Pinheiro LC, et al. Clinical characteristics of Covid‐19 in New York City. N Engl J Med. 2020;382:2372‐2374. [DOI] [PMC free article] [PubMed] [Google Scholar]
- 50. Chu Y, Li T, Fang Q, Wang X. Clinical characteristics and imaging manifestations of the 2019 novel coronavirus disease (COVID‐19): A multi‐center study in Wenzhou city, Zhejiang, China. J Infect. 2020. [DOI] [PMC free article] [PubMed] [Google Scholar]
- 51. Du RH, Liu LM, Yin W, et al. Hospitalization and critical care of 109 decedents with COVID‐19 pneumonia in Wuhan, China [published online ahead of print April 07, 2020]. Ann Am Thorac Soc. 2020. 10.1513/AnnalsATS.202003-225OC [DOI] [PMC free article] [PubMed] [Google Scholar]
- 52. Lei S, Jiang F, Su W, et al. Clinical characteristics and outcomes of patients undergoing surgeries during the incubation period of COVID‐19 infection. EClinicalMedicine. 2020;21:100331. [DOI] [PMC free article] [PubMed] [Google Scholar]
- 53. Wang D, Hu B, Hu C, et al. Clinical characteristics of 138 hospitalized patients with 2019 novel coronavirus‐infected pneumonia in Wuhan, China. JAMA. 2020;323(11):1061‐1069. [DOI] [PMC free article] [PubMed] [Google Scholar]
- 54. Chen T, Wu D, Chen H, et al. Clinical characteristics of 113 deceased patients with coronavirus disease 2019: retrospective study. BMJ. 2020;368:m1091. [DOI] [PMC free article] [PubMed] [Google Scholar]
- 55. Du RH, Liang LR, Yang CQ, et al. Predictors of mortality for patients with COVID‐19 pneumonia caused by SARS‐CoV‐2: a prospective cohort study. Eur Respir J. 2020;55(5):2000524. [DOI] [PMC free article] [PubMed] [Google Scholar]
- 56. Mehra MR, Desai SS, Kuy S, Henry TD, Patel AN. Cardiovascular disease, drug therapy, and mortality in Covid‐19 [published online ahead of print May 01, 2020]. N Engl J Med. 2020. 10.1056/NEJMoa2007621 [DOI] [PMC free article] [PubMed] [Google Scholar] [Retracted]
- 57. Siciliano RF, Gualandro DM, Sommer Bittencourt M, et al. Biomarkers for prediction of mortality in left‐sided infective endocarditis. Int J Infect Dis. 2020;96:25‐30. [DOI] [PubMed] [Google Scholar]
- 58. Tomlins J, Hamilton F, Gunning S, Sheehy C, Moran E, MacGowan A. Clinical features of 95 sequential hospitalised patients with novel coronavirus 2019 disease (COVID‐19), the first UK cohort [published online ahead of print April 27, 2020]. J Infect. 2020. 10.1016/j.jinf.2020.04.020 [DOI] [PMC free article] [PubMed] [Google Scholar]
- 59. Wang L, He W, Yu X, et al. Coronavirus disease 2019 in elderly patients: characteristics and prognostic factors based on 4‐week follow‐up. J Infect. 2020;80:639‐645. [DOI] [PMC free article] [PubMed] [Google Scholar]
- 60. Zhou F, Yu T, Du R, et al. Clinical course and risk factors for mortality of adult inpatients with COVID‐19 in Wuhan, China: a retrospective cohort study. Lancet. 2020;395(10229):1054‐1062. [DOI] [PMC free article] [PubMed] [Google Scholar]
- 61. Zhou W, Liu Y, Tian D, et al. Potential benefits of precise corticosteroids therapy for severe 2019‐nCoV pneumonia. Signal Transduct Target Ther. 2020;5(1):18. [DOI] [PMC free article] [PubMed] [Google Scholar]
- 62. Deng Y, Liu W, Liu K, et al. Clinical characteristics of fatal and recovered cases of coronavirus disease 2019 (COVID‐19) in Wuhan, China: a retrospective study. Chin Med J (Engl). 2020;133:1261‐1267. [DOI] [PMC free article] [PubMed] [Google Scholar]
- 63. Bakr AR, Fu GY, Hedeen D. Influence factors of death risk among COVID‐19 patients in Wuhan, China: a hospital‐based case‐cohort study. medRxiv. 2020;726:138068. 10.1101/2020.03.13.20035329 [DOI] [Google Scholar]
- 64. Li J, Wang X, Huang X, et al. Radiographic findings and other predictors in adults with Covid‐19. medRxiv. 2020;20:56. [Google Scholar]
- 65. Luo X, Xia H, Yang W, et al. Characteristics of patients with COVID‐19 during epidemic ongoing outbreak in Wuhan, China [published online ahead of print March 23, 2020]. medRxiv. 2020. 10.1101/2020.03.19.20033175 [DOI] [Google Scholar]
- 66. Wang Y, Lu X, Li Y, et al. Clinical course and outcomes of 344 intensive care patients with COVID‐19. Am J Respir Crit Care Med. 2020;201:1430‐1434. [DOI] [PMC free article] [PubMed] [Google Scholar]
- 67. Zhang F, Yang D, Li J, et al. Myocardial injury is associated with in‐hospital mortality of confirmed or suspected COVID‐19 in Wuhan, China: a single center retrospective cohort study [published online ahead of print March 24, 2020]. medRxiv. 2020. 10.1101/2020.03.21.20040121 [DOI] [Google Scholar]
- 68. Wang L, He WB, Yu XM, Liu HF, Zhou WJ, Jiang H. [Prognostic value of myocardial injury in patients with COVID‐19]. Zhonghua Yan Ke Za Zhi. 2020;56(0):E009. [DOI] [PubMed] [Google Scholar]
- 69. Dong M, Liu T, Li G. Association between acute infections and risk of acute coronary syndrome: a meta‐analysis. Int J Cardiol. 2011;147(3):479‐482. [DOI] [PubMed] [Google Scholar]
- 70. Lippi G, Lavie CJ, Sanchis‐Gomar F. Cardiac troponin I in patients with coronavirus disease 2019 (COVID‐19): evidence from a meta‐analysis [published online ahead of print March 10, 2020]. Prog Cardiovasc Dis. 2020. 10.1016/j.pcad.2020.03.001 [DOI] [PMC free article] [PubMed] [Google Scholar]
- 71. Li J‐W, Han T‐W, Woodward M, et al. The impact of 2019 novel coronavirus on heart injury: a systemic review and meta‐analysis [published online ahead of print April 16, 2020]. Prog Cardiovasc Dis. 2020. 10.1016/j.pcad.2020.04.008 [DOI] [PMC free article] [PubMed] [Google Scholar]
- 72. Ni W, Yang X, Liu J, et al. Acute myocardial injury at hospital admission is associated with all‐cause mortality in COVID‐19 [published online ahead of print May 11, 2020]. J Am Coll Cardiol. 2020. 10.1016/j.jacc.2020.05.007 [DOI] [PMC free article] [PubMed] [Google Scholar]
- 73. Shi S, Qin M, Cai Y, et al. Characteristics and clinical significance of myocardial injury in patients with severe coronavirus disease 2019. Eur Heart J. 2020;41:2070‐2079. [DOI] [PMC free article] [PubMed] [Google Scholar]
- 74. Tersalvi G, Vicenzi M, Calabretta D, Biasco L, Pedrazzini G, Winterton D. Elevated troponin in patients with Coronavirus Disease 2019 (COVID‐19): possible mechanisms [published online ahead of print April 18, 2020]. J Card Failure. 2020. 10.1016/j.cardfail.2020.04.009 [DOI] [PMC free article] [PubMed] [Google Scholar]
- 75. Savoj J, Becerra B, Kim J, et al. Utility of cardiac biomarkers in the setting of kidney disease. Nephron. 2019;141:227‐235. 10.1159/000495946 [DOI] [PubMed] [Google Scholar]
- 76. Alhazzani W, Møller MH, Arabi YM, et al. Surviving sepsis campaign: guidelines on the management of critically ill adults with coronavirus disease 2019 (COVID‐19). Crit Care Med. 2020;48(6):e440‐e469. 10.1097/CCM.0000000000004363 [DOI] [PMC free article] [PubMed] [Google Scholar]
- 77. Leffler CT, Hogan MC. Age‐dependence of mortality from novel coronavirus disease (COVID‐19) in highly exposed populations: New York transit workers and residents and Diamond Princess passengers [published online ahead of print May 18, 2020]. medRxiv. 2020. 10.1101/2020.05.14.20094847 [DOI] [Google Scholar]
- 78. New York City Department of H, Mental Hygiene C‐RT . Preliminary estimate of excess mortality during the COVID‐19 outbreak ‐ New York City, March 11‐May 2, 2020. MMWR Morb Mortal Wkly Rep. 2020;69(19):603‐605. [DOI] [PubMed] [Google Scholar]
Associated Data
This section collects any data citations, data availability statements, or supplementary materials included in this article.
Supplementary Materials
Supporting information