Abstract
Objective
To ascertain the biomechanical effects of a degenerated L4–L5 segment on the lower lumbar spine through a comprehensive simulation of disc degeneration.
Methods
A three‐dimensional nonlinear finite element model of a normal L3–S1 lumbar spine was constructed and validated. This normal model was then modified such that three degenerated models with different degrees of degeneration (mild, moderate, or severe) at the L4–L5 level were constructed. While experiencing a follower compressive load (500 N), hybrid moment loads were applied to all models to determine range of motion (ROM), intradiscal pressure (IDP), maximum von Mises stress in the annulus, maximum shear stress in the annulus, and facet joint force.
Results
As the degree of disc degeneration increased, the ROM of the L4–L5 degenerated segment declined dramatically in all postures (flexion: 5.79°–1.91°; extension: 5.53°–2.62°; right lateral bending: 4.47°–1.46°; left lateral bending: 4.86°–1.61°; right axial rotation: 2.69°–0.74°; left axial rotation: 2.69°–0.74°), while the ROM in adjacent segments increased (1.88°–8.19°). The largest percent decrease in motion of the L4–L5 segment due to disc degeneration was in right axial rotation (75%), left axial rotation (69%), flexion (67%), right lateral bending (67%), left lateral bending right (67%), and extension (53%). The change in the trend of the IDP was the same as that of the ROM. Specifically, the IDP decreased (flexion: 0.592–0.09 MPa; extension: 0.678–0.334 MPa; right lateral bending: 0.498–0.205 MPa; left lateral bending: 0.523–0.272 MPa; right axial rotation: 0.535–0.246 MPa; left axial rotation: 0.53–0.266 MPa) in the L4–L5 segment, while the IDP in adjacent segments increased (0.511–0.789 MPa). The maximum von Mises stress and maximum shear stress of the annulus in whole lumbar spine segments increased (L4–L5 segment: 0.413–2.626 MPa and 0.412–2.783 MPa, respectively; adjacent segment of L4–L5: 0.356–1.493 MPa and 0.359–1.718 MPa, respectively) as degeneration of the disc progressively increased. There was no apparent regularity in facet joint force in the degenerated segment as the degree of disc degeneration increased. Nevertheless, facet joint forces in adjacent healthy segments increased as the degree of disc degeneration increased (extension: 49.7–295.3 N; lateral bending: 3.5–171.2 N; axial rotation: 140.2–258.8 N).
Conclusion
Degenerated discs caused changes in the motion and loading pattern of the degenerated segments and adjacent normal segments. The abnormal load and motion in the degenerated models risked accelerating degeneration in the adjacent normal segments. In addition, accurate simulation of degenerated facet joints is essential for predicting changes in facet joint loads following disc degeneration.
Keywords: Biomechanical effect, Disc degeneration, Finite element, Lower lumbar spine
Introduction
Disc degeneration is a progressive condition that modifies the geometric morphology and biomechanical behavior of an intervertebral disc, eventually affecting its ability to transmit and distribute loads1. Lumbar disc degeneration is among the most common reasons for the development of lower back pain. Causes of disc degeneration are complex and multifactorial, caused by processes including aging, abnormal mechanical loads, and accidental damage2, 3, 4. It is known that the number of people experiencing lower back pain related to disc degeneration increases year on year5, 6. Degenerative disease of the lumbar spine is not only the cause of pain in numerous patients, it has become an excessive social burden in various countries7, 8, 9. Therefore, understanding the underlying mechanism that causes pain due to degeneration of lumbar discs is important when analyzing the basic principles of spine biomechanics, selection of optimal treatment options, or the development of new surgical devices.
Previous investigations have demonstrated that degeneration in the lumbar disc is often accompanied by ruptures, fissures, endplate sclerosis, formation of osteophytes, a reduction in disc height and nucleus pulposus volume, ligament failure, annulus fiber laxity, and changes in the material properties of the intervertebral disc10, 11, 12, 13, 14. In degenerated intervertebral discs, different morphological changes are present, individually or, more frequently, in various combinations. It is difficult to accurately simulate degenerative changes of the lumbar spine in finite element (FE) models by changing only a small number of intervertebral disc morphologies. A fundamental requirement for accurate simulation of disc degeneration in FE analysis is determining as far as possible the changes to intervertebral disc morphology and tissue properties.
Numerous in vitro experimental studies have analyzed the influence of disc degeneration on spinal biomechanics, including range of motion (ROM) of the lumbar spine15, 16, 17, facet contact force18, 19, intradiscal pressure (IDP)13, 20, and stress distribution in the vertebral body21. In particular, Kettler et al.15 explored stability in the early stages of lumbar disc degeneration and Mimura et al.16 studied the effect of disc degeneration on the multidirectional flexibility of the lumbar spine. These studies indicated that ROM in degenerated segments decreased during flexion–extension and lateral bending as disc degeneration progressed. There has also been progress in the study of the relationship between degenerative lumbar intervertebral discs and facet joint disease in the lumbar spine19. In addition, Adams et al. and McNally et al. investigated the mechanics of internal changes to intervertebral discs, finding a decrease in pressure when degenerated and analyzing the cause of that reduction in IDP13, 20. However, it is not sufficient to study the process of intervertebral disc degeneration using only in vitro experiments, because such tests cannot control the different degenerative changes, being highly dependent on the limited availability of cadavers. Likewise, the quality of cadaveric tissue can be problematic. FE analysis may, thus, provide an easier and more reliable method of investigation of mechanical changes due to intervertebral disc degeneration and has been extensively used in previous studies22, 23, 24, 25, 26. It has, to some extent, compensated for the shortcomings of in vitro experimental research.
Regarding FE studies of lumbar disc degeneration, Rohlmann et al.22 and Park et al.23 constructed three single‐segment lumbar models with different degrees of degeneration by changing both disc height and compressibility of the nucleus pulposus to study the influence of the degenerated disc on the biomechanical behavior of one motion segment. In addition, the second of these studies simulated degeneration by changing the material properties of the annulus fibrosus, ligaments, and nucleus pulposus23. Many single‐segment FE simulation studies have been conducted to investigate disc degeneration, but their common shortcoming is the inability to reflect the biomechanical changes in adjacent segments of the degenerated segment12, 24, 25, 26. Such biomechanical changes are also the focus of current studies. For example, Tang et al. simulated degeneration in the L4–L5 segment and developed three L3–L5 degenerated models and an anterior lumbar interbody fusion (ALIF) model of the L3–L5 segment. They compared the effects of ALIF and disc degeneration on the adjacent upper segmental disc and concluded that ALIF may promote adjacent upper segmental disc degeneration27. Ruberte et al. evaluated the effect of a single‐segment lumbar degenerated disc on the mechanical behavior of adjacent normal segments by changing the height of the intervertebral disc and the volume of the nucleus pulposus28. In addition, Park et al. simulated two degrees of disc degeneration and analyzed degeneration of intervertebral discs on intersegmental rotation, IDP, and facet contact forces on the whole lumbar spine. However, they only modified the material properties of the degenerated segment and disc height29. It is worth noting that there has also been some progress in the study of multi‐segmental simulation of lumbar disc degeneration30. Despite numerous studies of the mechanics of degenerated discs having been conducted by FE analysis, very few have comprehensively simulated lumbar disc degeneration.
Accordingly, the present study aimed to comprehensively simulate disc degeneration and evaluate the biomechanical effects of L4–L5 segmental intervertebral disc degeneration on the degenerated segment and adjacent normal segments in the lower lumbar spine.
Materials and Methods
Development of Normal Lumbar Spine Model
The detailed steps for building a lumbar spine FE model were obtained from previous studies31, 32. Briefly, detailed geometric information of the lumbar spine (L3–S1) was derived from computed tomography (CT) images of a healthy male subject (age: 30 years, weight: 68 kg, height: 173 cm). According to the above geometric information of the lumbar spine, the normal lumbar spine FE model was developed. This normal FE model of the lumbar spine (L3–S1) is shown in Fig. 1 and includes posterior elements, cancellous bone, endplates, cortical bone, facet cartilage, intervertebral discs, and ligaments. The endplate in the model was composed of cartilage. The thickness of the cortical bone was set at 0.5 mm33. The mean initial gap between the facet cartilage surfaces was 0.1 mm and the interaction was defined as frictionless surface‐to‐surface contact. In addition, the facet cartilage had an inhomogeneous thickness, the distribution of thickness of which was derived from previously published literature34, 35. Intervertebral discs are composed of a nucleus pulposus, annulus ground, and fibers36, 37. The angle between fiber layers and the endplate surface was approximately ±30°28. The ligaments in the FE model included the anterior and posterior longitudinal ligaments, the interspinous ligament, the supraspinal ligament, the flaval ligament, the capsular ligament, and the intertransverse ligament. Of note, the fibers and ligaments were defined as tension‐only springs with nonlinear characteristics38. The types of element and material parameters of each component of the normal model are shown in Table 1 28, 30, 31, 32, 37, 38.
Figure 1.
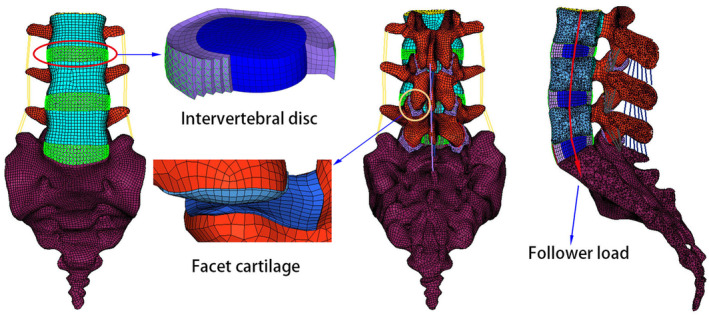
Three‐dimensional nonlinear finite element model of a normal lumbar spine (L3–S1).
Table 1.
Material properties and element types of the various spinal structures in the normal lumbar spine model28, 30, 31, 32, 37, 38
| Component | Young's modulus (MPa) | Poisson's ratio | Element type | Element numbers |
|---|---|---|---|---|
| Cortical | 12,000 | 0.3 | C3D8R | 1496 |
| Cancellous | 100 | 0.4 | C3D4 | 83,619 |
| Endplate | 24 | 0.4 | C3D8R | 3168 |
| Posterior element | 3500 | 0.3 | C3D4 | 155,673 |
| Sacrum | 5000 | 0.2 | C3D4 | 200,295 |
| Facet cartilage | Neo‐Hookean, C10 = 2 | C3D8RH | 4391 | |
| Annulus ground | Mooney–Rivlin, C1 = 0.18, C2 = 0.045 | C3D8RH | 3600 | |
| Nucleus pulposus | Mooney–Rivlin, C1 = 0.12, C2 = 0.03 | C3D8RH | 4320 | |
| Annulus fibers | Calibrated stress–strain curves | Spring | 8640 | |
| Ligament | — | — | — | |
| ALL | Calibrated deflection–force curves | Spring | 15 | |
| PLL | Calibrated deflection–force curves | Spring | 18 | |
| ISL | Calibrated deflection–force curves | Spring | 18 | |
| SSL | Calibrated deflection–force curves | Spring | 3 | |
| LF | Calibrated deflection–force curves | Spring | 27 | |
| CL | Calibrated deflection–force curves | Spring | 48 | |
| ITL | Calibrated deflection–force curves | Spring | 12 | |
ALL, anterior longitudinal ligament; CL, capsular ligament; FL, flaval ligament, ISL, interspinous ligament; ITL, intertransverse ligament; PLL, posterior longitudinal ligament; SSL, supraspinal ligament.
Development of Lumbar Disc Degeneration Models
In the present study, three variables of intervertebral disc morphology (disc height, formation of anterior osteophytes, and area of nucleus pulposus) were modified to construct three lumbar spine FE models simulating mild, moderate, and severe degeneration at the L4–L5 level (Figs 2 and 3). The L4–L5 segment was selected to simulate disc degeneration due to a higher incidence of degeneration28, 39, 40.
Figure 2.
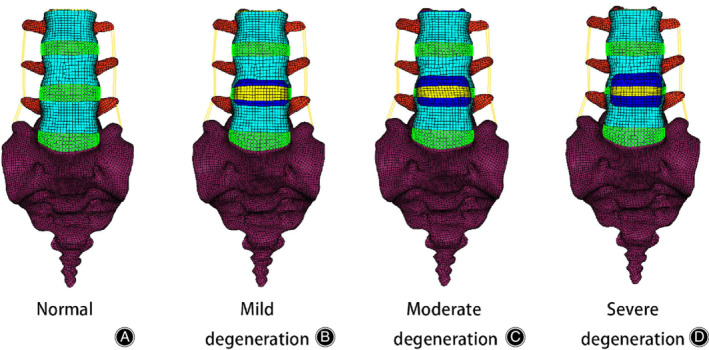
Anterior views of a normal and three degenerative three‐dimensional nonlinear finite element models of the lumbar spine (L3–S1). (A) Normal model: material properties (no degeneration), normal disc height (no degeneration), no anterior osteophytes. (B) Mild degeneration: material properties (mild degeneration), 20% reduction in disc height, anterior osteophyte size representing 10%. (C) Moderate degeneration: material properties (moderate degeneration), 40% reduction in disc height, anterior osteophyte size representing 20%. (D) Severe degeneration: material properties (severe degeneration), 60% reduction in disc height, anterior osteophytes size representing 30%.
Figure 3.
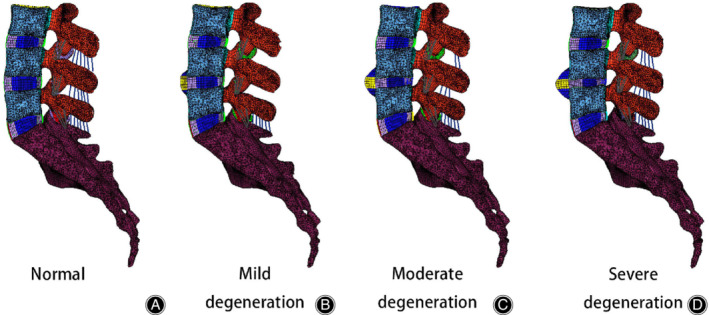
Sagittal views of a normal and three degenerative three‐dimensional nonlinear finite element models of the lumbar spine (L3–S1). (A) Normal model: the material properties (no degeneration), normal disc height (no degeneration), no anterior osteophytes. (B) Mild degeneration: material properties (mild degeneration), 20% reduction in disc height, anterior osteophyte size representing 10%. (C) Moderate degeneration: material properties (moderate degeneration), 40% reduction in disc height, anterior osteophyte size representing 20%. (D) Severe degeneration: material properties (severe degeneration), 60% reduction in disc height, anterior osteophytes size representing 30%.
The specific values and proportion of three variables of intervertebral disc morphology are shown in Table 2 12, 22, 24, 28, 42. Compared with a normal intervertebral disc, disc height in mild, moderate, and severe degeneration decreased by 20%, 40%, and 60%, respectively22. The values of height and length of osteophytes in the sagittal plane were equal (Fig. 4). Osteophytes in the L4 lower vertebra were classified as 10% (mild degeneration), 20% (moderate degeneration), or 30% (severe degeneration) of the normal sagittal diameter of an L4 vertebra12, 24. Classification of osteophytes of the L5 upper vertebra was the same as described above. As the degree of degeneration increased, the volume of the nucleus pulposus gradually decreased41, 42. To maintain a constant intervertebral disc volume, decreased nucleus pulposus volume was replaced with elements representing annulus ground. Changes in the nucleus pulposus and the annulus cross‐sectional area are shown in Table 2. In addition, the material properties of the endplate12, 24, 43, 44, 45 and intervertebral disc12, 24, 28 in the degenerated segment were also modified to further simulate disc degeneration (Tables 3 and 4). Modification of the endplate material properties simulated endplate sclerosis. In addition, analysis using frozen sections has indicated that the material properties of osteophytes and the soft tissue between them are similar to those of cancellous bone and annulus ground, respectively12, 43, as presented in Table 4 12, 43, 44.
Table 2.
| Variables of lumbar disc morphology | Normal | Mild | Moderate | Severe |
|---|---|---|---|---|
| Height loss | ||||
| Anterior disc height loss (mm) | 0 | 2.42 (20%) | 4.84 (40%) | 7.26 (60%) |
| Posterior disc height loss (mm) | 0 | 1.55 (20%) | 3.50 (40%) | 5.25 (60%) |
| Anterior osteophytes | ||||
| Osteophytes of L4 low vertebral (mm) | 0 | 3.01 (10%) | 6.02 (20%) | 9.03 (30%) |
| Osteophytes of L5 upper vertebral (mm) | 0 | 2.96 (10%) | 5.92 (20%) | 8.88 (30%) |
| The changes of intervertebral disc area | ||||
| Nucleus pulposus area (mm2) | 613 | 463 | 333 | 223 |
| Annulus ground area (mm2) | 762 | 912 | 1042 | 1152 |
Height loss: Compared with a normal intervertebral disc, disc height in mild, moderate, and severe degeneration decreased by 20%, 40%, and 60%, respectively. The percentage of anterior disc height loss and posterior disc height loss are the same. For example, the 20% of anterior disc height loss of normal intervertebral disc is 2.42 mm
Anterior osteophytes: Osteophytes in the L4 lower vertebra were classified as 10% (mild degeneration), 20% (moderate degeneration), or 30% (severe degeneration) of the normal sagittal diameter of an L4 vertebra. Classification of osteophytes of the L5 upper vertebra was the same as described above. For example, 10% of the normal sagittal diameter of an L4 vertebra is 3.01 mm.
Figure 4.
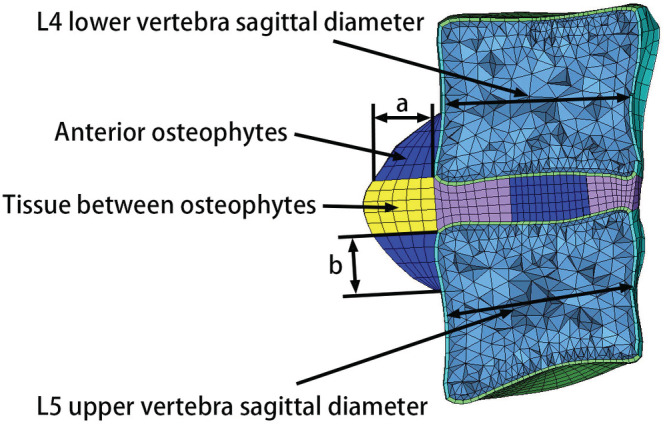
Schematic diagram of the vertebral sagittal diameter and anterior osteophyte dimensions.
Table 3.
Material properties and element types of the annulus ground and nucleus pulposus in all lumbar spine models12, 24, 28
| The degree of lumbar disc degeneration | Hype‐elastic Mooney–Rivlin | Element type | |
|---|---|---|---|
| C1 | C2 | ||
| No degeneration | |||
| Annulus ground | 0.18 | 0.045 | C3D8RH |
| Nucleus pulposus | 0.12 | 0.03 | C3D8RH |
| Mild degeneration | |||
| Annulus ground | 0.4 | 0.1 | C3D8RH |
| Nucleus pulposus | 0.14 | 0.035 | C3D8RH |
| Moderate degeneration | |||
| Annulus ground | 0.6 | 0.15 | C3D8RH |
| Nucleus pulposus | 0.17 | 0.041 | C3D8RH |
| Severe degeneration | |||
| Annulus ground | 0.9 | 0.23 | C3D8RH |
| Nucleus pulposus | 0.19 | 0.045 | C3D8RH |
Table 4.
Material properties and element types of the endplate, osteophytes and tissue between osteophytes in all lumbar spine models12, 24, 43, 44, 46
| Degree of lumbar disc degeneration | Young's modulus (MPa) | Poisson's ratio | Element type |
|---|---|---|---|
| No degeneration | |||
| Endplate | 24 | 0.4 | C3D8R |
| Osteophytes | — | — | — |
| Tissue between osteophytes | — | — | — |
| Mild degeneration | |||
| Endplate | 24 | 0.4 | C3D8R |
| Osteophytes | 100 | 0.4 | C3D8R |
| Tissue between osteophytes | Mooney–Rivlin, C1 = 0.4, C2 = 0.1 | C3D8RH | |
| Moderate degeneration | |||
| Endplate | 50 | 0.4 | C3D8R |
| Osteophytes | 100 | 0.4 | C3D8R |
| Tissue between osteophytes | Mooney–Rivlin, C1 = 0.6, C2 = 0.15 | C3D8RH | |
| Severe degeneration | |||
| Endplate | 100 | 0.4 | C3D8R |
| Osteophytes | 100 | 0.4 | C3D8R |
| Tissue between osteophytes | Mooney–Rivlin, C1 = 0.9, C2 = 0.23 | C3D8RH | |
Loading and Boundary Conditions
In the present study, a hybrid moment load was used to compare differences between the healthy and the three degenerated models, because such a load required the same end conditions of these lumbar spine FE models. That is, in each posture, the L3–S1 total ROM of each degenerated model was the same as for the normal model. The resultant moment loading required to achieve the same L3–S1 rotational motion as the normal model is listed in Table 5. During loading, the sacrum was fixed in six possible types of motion. When placed under a follower load (500 N), the moment loading described above was applied to the superior surface of the L3 endplate in all models. This method of applying a follower load is the same as described in the published literature29, 47.
Table 5.
Moment loading applied to each finite element model of the lumbar spine (Nm)
| Types | Flexion | Extension | RB | LB | RAR | LAR |
|---|---|---|---|---|---|---|
| No degeneration | 7.5 | 7.5 | 7.5 | 7.5 | 7.5 | 7.5 |
| Mild degeneration | 11.3 | 10.6 | 11 | 11 | 11.9 | 11.7 |
| Moderate degeneration | 11.9 | 11.7 | 11.5 | 11.6 | 12.3 | 12.1 |
| Severe degeneration | 12.3 | 13.1 | 12.6 | 12.7 | 12.8 | 12.9 |
Dashes refer to the normal lumbar spine model lack osteophytes and tissue between osteophytes. LAR, left axial rotation; LB, left bending; RAR, right axial rotation; RB, right bending.
Calibration and Validation
The process of calibration was conducted by changing correction factors for the collagen fibers and ligaments, in accordance with previously published literature48, 49. The detailed process of calibration was described elsewhere31, 32. The ROM of the lumbar spine in each segment when placed under a pure moment load (flexion, 8 Nm; extension, 6 Nm; lateral bending, 6 Nm; axial rotation, 4 Nm) and disc compression under a follower compressive load of 1200 N were calculated. The motion of each segment of the normal model was compared with previous cadaveric specimen data to validate the normal model50. Boundary and loading conditions were set and replicated in vitro. All simulation work was conducted using commercial FE software (Abaqus 6.11; Dassault Systemes Simulia, Pennsylvania, USA).
Results
Calibration and Validation
The calibration results are presented in Fig. 5A,B and the validation results are presented in Fig. 6. The optimized calibration factors of fibers and ligaments were as follows: fibers, 0.49; ALL, 1.0; PLL, 0.3; ITL, 1.0; FL, 5.0; SSL, 0.07; ISL, 0.08, and CL, 5.0. Figure 6 displays predicted data from FE analysis of the normal model (ROM and disc compression of each segment) compared with experimental data of specimens by Renner et al.50. The ROM and disc compression of each segment in each posture closely matched the in vitro experimental data. Therefore, the model was considered to be calibrated and validated, and was used to further study the biomechanical response of the lumbar spine under disc degeneration.
Figure 5.
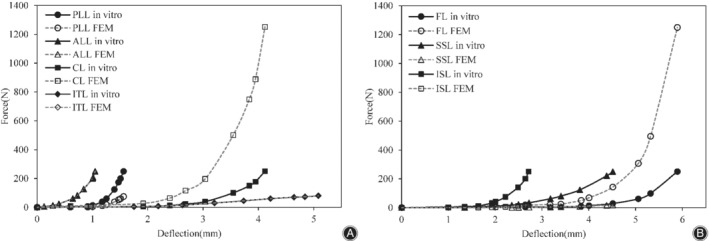
Calibration results of seven major ligaments of the lumbar spine finite element model: (A) anterior longitudinal ligament (ALL), capsular ligament (CL), intertransverse ligament (ITL), and posterior longitudinal ligament (PLL); and (B) flaval ligament (FL), interspinous ligament (ISL), and supraspinal ligament (SSL).
Figure 6.
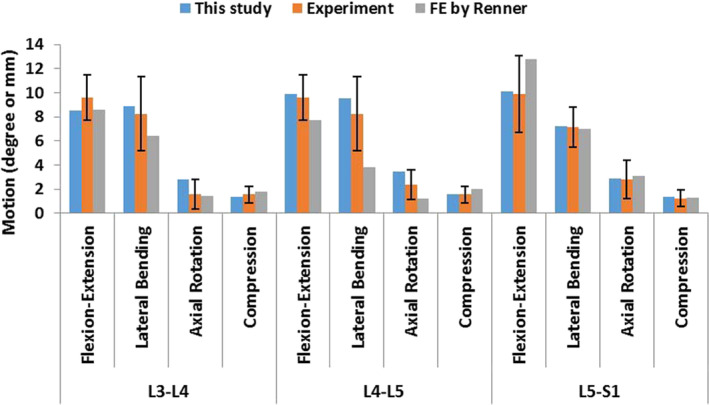
Comparison of finite predicted data of the normal model (range of motion and disc compression of each segment) and experimental data of clinical specimens by Renner et al.50.
Range of Motion
The ROM of the L4–L5 degenerated segment and adjacent normal segments in six directions under hybrid moment loading are shown in Fig. 7A–C. In a degenerated L4–L5 segment, the ROM gradually decreased with increasing disc degeneration. In a normal segment adjacent to an L4–L5 degenerated segment, the ROM gradually increased as the degree of disc degeneration increased. The percentage change in the ROM in the L3–L4 segment is larger than that of the L5–S1 segment. The percentage change in the ROM of the L4–L5 degenerated segment relative to the L4–L5 segment of the normal lumbar spine model is shown in Fig. 7D.
Figure 7.
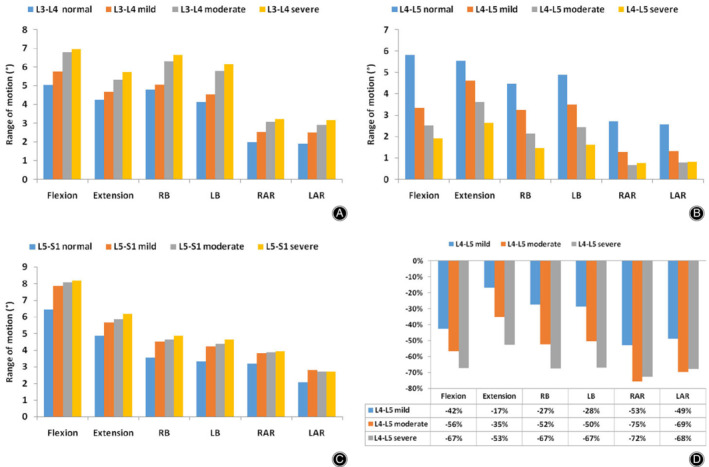
Range of motion (ROM) in normal and degenerated lumbar spine finite element (FE) models in six directions (LAR, left axial rotation; LB, left bending; RAR, right axial rotation; RB, right bending). (A) ROM of the L3–L4 segment in all lumbar spine FE models. (B) ROM of the L4–L5 segment in all lumbar spine FE models. (C) ROM of the L5–S1 segment in all lumbar spine FE models. (D) Percentage change in ROM of the L4–L5 degenerated segment with respect to L4–L5 segments of the normal model.
Intradiscal Pressure
In different postures, the IDP of the L4–L5 degenerative segment and adjacent normal segments when placed under hybrid moment loading are shown in Fig. 8A–C. Compared with the normal model, the IDP of the L4–L5 degenerated segment declined dramatically in all postures as the degree of disc degeneration increased. In contrast, the IDP in the adjacent normal segments of the L4–L5 degenerated segments increased with increasing disc degeneration.
Figure 8.
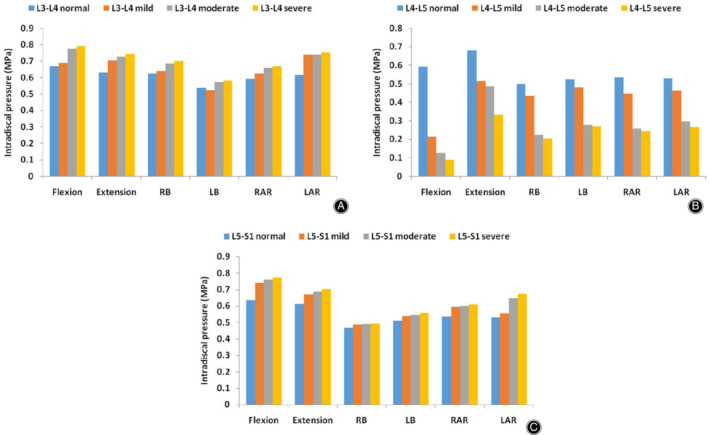
Intradiscal pressure (IDP) of the normal and degenerated lumbar spine finite element (FE) models in six directions. (A) IDP of the L3–L4 segment in all lumbar spine FE models. (B) IDP of the L4–L5 segment in all lumbar spine FE models. (C) IDP of the L5–S1 segment in all lumbar spine FE models.
Maximum Von Mises Stress in the Annulus
The maximum von Mises stress in the annulus of the L3–S1 lumbar segment in six different postures under varying hybrid moment loading are shown in Fig. 9A–C. Under such hybrid moment loading, the maximum von Mises stress in the annulus of the L4–L5 degenerated segment increased with increasing degree of degeneration. Compared with a normal lumbar spine model, increasing degeneration of the disc resulted in an increase in maximum von Mises stress in the annulus of the adjacent normal segments, with the exception of the L3–L4 segment during axial rotation.
Figure 9.
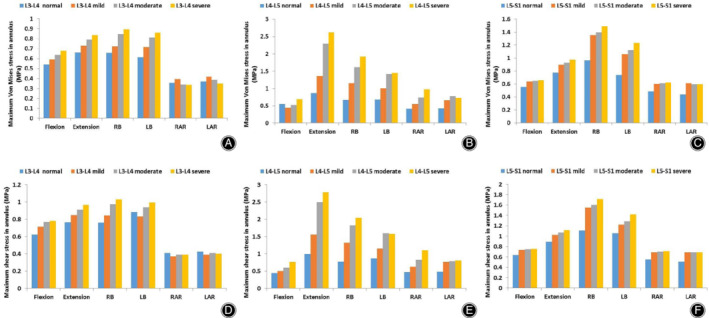
Maximum von Mises and shear stress in the annulus of the normal and degenerated lumbar spine finite element (FE) models in six directions. (A) Maximum von Mises stress in the annulus of the L3–L4 segment in all lumbar spine FE models. (B) Maximum von Mises stress in the annulus of the L4–L5 segment in all lumbar spine FE models. (C) Maximum von Mises stress in the annulus of the L5–S1 segment in all lumbar spine FE models. (D) Maximum shear stress in the annulus of the L3–L4 segment in all lumbar spine FE models. (E) Maximum shear stress in the annulus of the L4–L5 segment in all lumbar spine FE models. (F) Maximum shear stress in the annulus of the L5–S1 segment in all lumbar spine FE models.
Maximum Shear Stress in the Annulus
Maximum shear stress in the annulus of all lumbar FE models in six directions of loading under hybrid moment loading is shown in Fig. 9D–F. Maximum shear stress in the annulus of the L4–L5 degenerated segment increased with increasing disc degeneration. In the segments adjacent to the L4–L5 degenerated segment, in addition to axial rotation of the L3–L4 segments, the maximum shear stress in the annulus of the adjacent normal segments increased as the degree of degeneration increased.
Facet Joint Force
The gap between facet cartilage during flexion was so large that the facet joint force was very small or even zero, so facet joint force is not shown in flexion. In the present study, facet joint forces on the left and right sides of the lumbar spine were recorded. The predicted facet joint forces in different lumbar FE models in different postures under loading using a hybrid moment are shown in Fig. 10A–C. In the L4–L5 degenerated segment, compared with the normal lumbar spine model, facet joint forces decreased during extension and increased in axial rotation. In lateral bending, the facet joint force was small and irregular. In summary, the change in facet joint force is irregular in an L4–L5 degenerated segment. However, facet joint forces on the segments adjacent to the L4–L5 degenerated segment gradually increased as the extent of disc degeneration increased.
Figure 10.
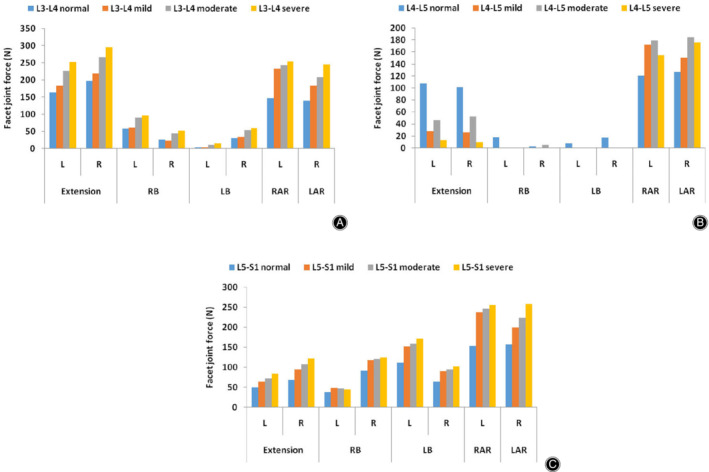
Facet joint force in normal and degenerated lumbar spine finite element (FE) models in six directions (L, left; R, Right). (A) Facet joint force of the L3–L4 segment in all lumbar spine FE models. (B) Facet joint force of the L5–S1 segment in all lumbar spine FE models. (C) Facet joint force of the L4‐L5 segment in all lumbar spine FE models.
Discussion
A three‐dimensional nonlinear normal lumbar spine FE model of the L3–S1 segments was constructed, then validated by comparing data with previously published experimental data. Three different degrees of lumbar disc degeneration (mild, moderate, and severe) were modeled by modifying both the geometry of the intervertebral disc and the associated material properties. Using these models, we evaluated the effect of intervertebral disc degeneration in the L4–L5 segment on the lower lumbar spine.
It is common to use a hybrid moment loading to simulate various postures in lumbar spine FE studies, especially when studying lumbar spine degeneration27, 28, 29, 32. When the lumbar spine is degenerated, the ROM of the degenerated segment tends to decrease, but the patient often needs to maintain the total ROM originally present. During this time, the lumbar spine of the patient may cause pain. The key aim of using hybrid moment loading is to maintain the ROM of the degenerated lumbar spine models at the same value as the total ROM of the normal lumbar spine model. That is, we simulated the physiological state of the lumbar spine after the patient returned to the normal ROM and further| explored the mechanisms underlying pain in disc degeneration.
Progressive disc degeneration affects the pattern of motion of the diseased disc and its adjacent discs. In the present study, with increasing degree of disc degeneration, the results indicated that the ROM of the L4–L5 degenerated segment decreased dramatically and that of its healthy adjacent segments increased in all postures. Because the total ROM (L3–S1) of the healthy model was the same as that of the degenerated models, the adjacent intervertebral disc levels compensated for changes in motion of the degenerated disc. Several previous studies have reached the same conclusion for the trend of segmental rotation predicted by the finite element model in the present study23, 27, 28, 29, 30. However, a number of in vitro experimental15, 16, 51, 52 and finite element studies22 have indicated that the ROM of the degenerated segments increases in axial rotation. That may be because degenerated discs are often accompanied by fissures and ruptures during in vitro experimental studies10. Such fissures and ruptures reduce the limit of the ROM of discs in axial rotation. In addition, the reason for the difference, as shown by the research results of Rohlmann et al.22, may be due to different methods of modeling. Rohlmann et al.22 only changed one geometrical variable, disc height, to simulate disc degeneration. In comparison, we simulated the formation of anterior osteophytes and the reduction in nucleus pulposus volume. The reduced nucleus pulposus was replaced by annulus ground material, which had greater stiffness. In addition, anterior osteophytes limited the motion of the degenerated disc.
With progressive disc degeneration, the volume of the nucleus pulposus decreased, as did the ability of the tissue to stay hydrated, leading to further loss in disc height and changes in the tissue properties of the disc3, 13, 41. Due to the reasons above, transfer in load transmission from the nucleus pulposus to the annulus was evident with advancing disc degeneration28. The above phenomena are clearly evident in the present study. With increasing numbers of disc degenerative pathologies, the IDP of the L4–L5 degenerative segments dramatically declined in six postures, while maximum von Mises stress and shear stress in the annulus of the L4–L5 degenerated segment increased with an increasing degree of degeneration. These changes are in agreement with previous results, as reported in the literature22, 23, 28, 29. In addition, the maximum von Mises stress and the maximum shear stress in the annulus and the IDP in normal segments adjacent to the L4–L5 degenerated segment increased as the degree of disc degeneration increased. A number of studies support the conclusions above28, 29. From an anatomical and physiological point of view, as the load‐supporting function is progressively transferred from the nucleus pulposus to the annulus, intervertebral disc degeneration is initiated53, 54. In summary, degenerated discs change the capability of the degenerated segment and its adjacent normal segments to transmit and distribute loads.
Facet joint force is very sensitive to loading conditions and the geometry of the facet joint32. In addition, it has been documented that facet joint force is largely dependent on its orientation22. In the process of building a degenerated model, the relative positions of the two pieces of facet cartilage in the posterior element of the degenerated segment change. Therefore, abnormal facet contact forces can exist in the degenerated segment. Due to the reasons above, no apparent consistency was observed in the force at the facet joints in the degenerated segment as the degree of disc degeneration increased. In the degenerated segment, the load at the facet joint during lateral bending was considerably smaller than during axial rotation and extension. A similar phenomenon was found by Rohlmann et al.22. Such a phenomenon may be caused by the physiological anatomical structure of the lumbar facet joint32. However, the load in the facet joint of the segment adjacent to the L4–L5 degenerated segment increased with increasing degenerative pathology. Such a trend has been confirmed in previous studies of lumbar degeneration29. In addition, investigations have reported that excessive facet joint forces may result in painful articular facets55, 56. From this perspective, an abnormal increase in facet joint load in segments adjacent to L4–L5 is likely to be a cause of back pain. Overall, degenerated discs also affect posterior facet joints and cause abnormal forces. Therefore, in future finite element analyses of the spine, we must pay attention to the actual changes in the facet joint to better simulate the result of disc degeneration.
Degeneration of the lumbar disc causes an increase in stiffness in the degenerated segment, although the overall ROM of the spine is not much affected, inevitably resulting in a compensatory reduction in the stiffness of other segments, thereby increasing the ROM of other segments, with increased stress in the intervertebral disc and facet joint loading. Larger mechanical force may cause unrecoverable micro‐injury of the disc and facet joints, possibly accelerating the degeneration of adjacent segments over time57, 58. There will also be changes similar to lumbar disc degeneration after lumbar interbody fusion; that is, accelerated degeneration of adjacent segments. Previous studies have also shown that adjacent segmental degeneration (ASD) is widespread as a complication of lumbar fusion59, 60. For example, Tang et al. explored the relationship between ALIF and ASD and concluded that ALIF resulted in more adverse effects than disc degeneration on the biomechanical behavior of adjacent upper segments that may exacerbate adjacent upper segmental degeneration27. A number of researchers also think that the natural progression of degeneration results in adjacent segment degeneration, not lumbar fusion59. To summarize, for both lumbar disc degeneration and fusion, there is the risk of accelerating the degeneration of adjacent segments.
Degeneration of passive elements of the lumbar spine can cause abnormal stress46. Abnormal increases in stress at a degenerated segment and adjacent segments may be the cause of pain experienced by patients, but it remains unclear which is the dominant factor that causes pain. To our knowledge, degenerative changes in the ROM of the lumbar spine are the direct cause of abnormal stress. Therefore, in clinical treatments, excessive movement of the lumbar spine should be avoided when the lumbar spine of a patient becomes degenerated; otherwise it may lead to pain. Even if the pain is improved by lumbar fusion surgery, the spine should not be exposed to excessive motion. To some extent, lumbar disc degeneration and fusion result in the same biomechanical changes. It may be difficult for the patient's lumbar spine to return to the previous healthy ROM while avoiding pain. Therefore, understanding biomechanical changes in disc degeneration remains critical for further analysis of the mechanisms of lumbar spine disorders and improvements in clinical treatment.
There are several reasons for choosing a reduction in disc height, the formation of anterior osteophytes, endplate sclerosis, and a reduction in nucleus pulposus volume to simulate disc degeneration. First, there is a correlation between disc height loss, anterior osteophyte formation, and endplate sclerosis that has been demonstrated statistically24, 45. A previous radiographic study demonstrated that the endplate contour flattened with progressing disc degeneration61. However, endplate curvature in our lumbar finite element model was very small, so the endplate shape was not changed but endplate sclerosis was simulated by changing the material properties (increase in hardness). Second, a reduction in nucleus pulposus volume is also an important feature of lumbar disc degeneration10, 13. In the present study, we simulated the reduction in nucleus pulposus volume using a combination of decreased disc height and the cross‐sectional area of the nucleus pulposus. In addition, we modified the material properties of normal disc tissue to more accurately simulate the conditions of disc degeneration. Such morphological changes and variations in material properties are the principal features of intervertebral disc degeneration12, 13, 22, 23, 24, 27, 28, 29. Therefore, our degenerative model represents a certain proportion of cases of clinical degeneration cases and provides some guidance for clinical treatment.
The causes of disc degeneration are not fully understood. Patient complaints are varied. First, it may start with fracture (or other trauma) of the cartilage endplate, with abnormal load and calcification accelerating cartilage endplate damage, leading to more severe degeneration62. Second, loss of proteoglycans and a reduction in hydration of the nucleus pulposus can cause stress inside the disc to increase and, therefore, decrease the disc's subsequent capability to withstand physiological loads63. It is worth noting that cartilage endplate–vertebral endplate failure is definitely among the most important triggers for disc degeneration, because nutrition can be interrupted and cell viability of the intervertebral disc damaged64. In addition, a number of researchers suggest that if damage to the vertebral endplate is small, the flow of nutrients can be maintained. However, the quantity of nutrients may not be sufficient to maintain integrity of the disc65, 66. It can be seen from the above that the endplate affects disc degeneration by regulating the transport of nutrients. Therefore, it is necessary to construct a porous‐osmotic‐hyperelastic disc based on nutrient transport in future models.
The structure of the human lumbar spine is very complicated, resulting in a number of simplifications and limitations in our finite element analysis. First, disc degeneration is usually accompanied by degeneration of the posterior facet joint. In this FE study, we did not observe changes in facet joint geometry in the degenerated lumbar segments in experimental studies. Therefore, the posterior facet joint of degenerated segments is not accurately simulated. Second, the lumbar spine FE model in the present study was developed from geometric information from a single subject, while morphological differences between individuals may result in differences in motion patterns and locations of stress. Third, the lack of lumbar muscle is a common shortcoming in all current lumbar finite element models, although muscle plays an important role in regulating lumbar motion and maintaining stability67. Fourth, due to the difficulty in simulating the true geometry of the ligaments, they are simplified to one‐dimensional nonlinear spring elements. Despite these simplifications and limitations, the FE model of the lumbar spine developed here exhibited good consistency with published experimental data and will be useful in investigating the effects of disc degeneration on the lower lumbar spine. In addition, as lumbar disc degeneration FE models created by different researchers have different methods of modeling, loading and boundary conditions, it is difficult to compare quantitatively with the data from these models.
Conclusion
In conclusion, the present study analyzed the biomechanical effects of L4–L5 segmental disc degeneration on the degenerated segment and healthy adjacent segments. We found that degenerated intervertebral discs led to changes in the motion and loading patterns of degenerated segments and adjacent normal segments. The abnormal loading and motion in the degenerated segment and its adjacent healthy segments risked accelerating degeneration in the adjacent segments. In addition, disc degeneration is usually accompanied by degeneration of the posterior facet joints, so accurate simulation of degenerated facet joints is essential for predicting changes in facet joint forces after disc degeneration. In the future, it may be necessary to determine the actual changes in the facet joints after lumbar disc degeneration through in vitro experimental studies.
Grant Sources: Financial support for this work has been provided by the National Natural Science Foundation of China (No. 11602172), Tianjin's Fund for Distinguished Young Scholars (Qiang Yang), Tianjin's Fund for Top Medical Talent (Qiang Yang), and the Natural Science Foundation of Fujian Province, China (2019J01451).
Disclosure: The authors declare that they have no conflict of interest.
Contributor Information
Cheng‐fei Du, Email: ddccffb31@hotmail.com.
Qiang Yang, Email: yangqiangspine@163.com.
References
- 1. Adams MA, Roughley PJ. What is intervertebral disc degeneration, and what causes it?. Spine (Phila Pa 1976), 2006, 31: 2151–2161. [DOI] [PubMed] [Google Scholar]
- 2. Stokes IA, Iatridis JC. Mechanical conditions that accelerate intervertebral disc degeneration: overload versus immobilization. Spine (Phila Pa 1976), 2004, 29: 2724–2732. [DOI] [PMC free article] [PubMed] [Google Scholar]
- 3. Iatridis JC, Setton LA, Weidenbaum M, Mow VC. Alterations in the mechanical behavior of the human lumbar nucleus pulposus with degeneration and aging. J Orthop Res, 1997, 15: 318–322. [DOI] [PubMed] [Google Scholar]
- 4. Wilke HJ, Rohlmann F, Neidlinger‐Wilke C, Werner K, Claes L, Kettler A. Validity and interobserver agreement of a new radiographic grading system for intervertebral disc degeneration: part I. Lumbar spine. Eur Spine J, 2006, 15: 720–730. [DOI] [PMC free article] [PubMed] [Google Scholar]
- 5. Waris E, Eskelin M, Hermunen H, Kiviluoto O, Paajanen H. Disc degeneration in low back pain: a 17‐year follow‐up study using magnetic resonance imaging. Spine (Phila Pa 1976), 2007, 32: 681–684. [DOI] [PubMed] [Google Scholar]
- 6. Walker BF. The prevalence of low back pain: a systematic review of the literature from 1966 to 1998. J Spinal Disord, 2000, 13: 205–217. [DOI] [PubMed] [Google Scholar]
- 7. Deyo RA, Gray DT, Kreuter W, Mirza S, Martin BI. United States trends in lumbar fusion surgery for degenerative conditions. Spine (Phila Pa 1976), 2005, 30: 1441–1447. [DOI] [PubMed] [Google Scholar]
- 8. Von Forell GA, Stephens TK, Samartzis D, Bowden AE. Low back pain: a biomechanical rationale based on "patterns" of disc degeneration. Spine (Phila Pa 1976), 2015, 40: 1165–1172. [DOI] [PubMed] [Google Scholar]
- 9. Machado GC, Maher CG, Ferreira PH, et al Trends, complications, and costs for hospital admission and surgery for lumbar spinal stenosis. Spine (Phila Pa 1976), 2017, 42: 1737–1743. [DOI] [PubMed] [Google Scholar]
- 10. Gunzburg R, Parkinson R, Moore R, et al A cadaveric study comparing discography, magnetic resonance imaging, histology, and mechanical behavior of the human lumbar disc. Spine (Phila Pa 1976), 1992, 17: 417–426. [DOI] [PubMed] [Google Scholar]
- 11. Wang K, Jiang C, Wang L, Wang H, Niu W. The biomechanical influence of anterior vertebral body osteophytes on the lumbar spine: a finite element study. Spine J, 2018, 18: 2288–2296. [DOI] [PubMed] [Google Scholar]
- 12. Schmidt H, Kettler A, Rohlmann A, Claes L, Wilke HJ. The risk of disc prolapses with complex loading in different degrees of disc degeneration ‐ a finite element analysis. Clin Biomech (Bristol, Avon), 2007, 22: 988–998. [DOI] [PubMed] [Google Scholar]
- 13. Johansson MS, Jensen Stochkendahl M, Hartvigsen J, Boyle E, Cassidy JD. Incidence and prognosis of mid‐back pain in the general population: a systematic review. Eur J Pain, 2017, 21: 20–28. [DOI] [PubMed] [Google Scholar]
- 14. Luoma K, Riihimaki H, Luukkonen R, Raininko R, Viikari‐Juntura E, Lamminen A. Low back pain in relation to lumbar disc degeneration. Spine (Phila Pa 1976), 2000, 25: 487–492. [DOI] [PubMed] [Google Scholar]
- 15. Kettler A, Rohlmann F, Ring C, Mack C, Wilke HJ. Do early stages of lumbar intervertebral disc degeneration really cause instability? Evaluation of an in vitro database. Eur Spine J, 2011, 20: 578–584. [DOI] [PMC free article] [PubMed] [Google Scholar]
- 16. Mimura M, Panjabi MM, Oxland TR, Crisco JJ, Yamamoto I, Vasavada A. Disc degeneration affects the multidirectional flexibility of the lumbar spine. Spine (Phila Pa 1976), 1994, 19: 1371–1380. [DOI] [PubMed] [Google Scholar]
- 17. Fujiwara A, Lim TH, An HS, et al The effect of disc degeneration and facet joint osteoarthritis on the segmental flexibility of the lumbar spine. Spine (Phila Pa 1976), 2000, 25: 3036–3044. [DOI] [PubMed] [Google Scholar]
- 18. Fujiwara A, Tamai K, An HS, et al The relationship between disc degeneration, facet joint osteoarthritis, and stability of the degenerative lumbar spine. J Spinal Disord, 2000, 13: 444–450. [DOI] [PubMed] [Google Scholar]
- 19. Hicks GE, Morone N, Weiner DK. Degenerative lumbar disc and facet disease in older adults: prevalence and clinical correlates. Spine (Phila Pa 1976), 2009, 34: 1301–1306. [DOI] [PMC free article] [PubMed] [Google Scholar]
- 20. McNally DS, Adams MA. Internal intervertebral disc mechanics as revealed by stress profilometry. Spine (Phila Pa 1976), 1992, 17: 66–73. [DOI] [PubMed] [Google Scholar]
- 21. Pollintine P, Dolan P, Tobias JH, Adams MA. Intervertebral disc degeneration can lead to "stress‐shielding" of the anterior vertebral body: a cause of osteoporotic vertebral fracture?. Spine (Phila Pa 1976), 2004, 29: 774–782. [DOI] [PubMed] [Google Scholar]
- 22. Rohlmann A, Zander T, Schmidt H, Wilke HJ, Bergmann G. Analysis of the influence of disc degeneration on the mechanical behaviour of a lumbar motion segment using the finite element method. J Biomech, 2006, 39: 2484–2490. [DOI] [PubMed] [Google Scholar]
- 23. Park WM, Kim YH, Lee S. Effect of intervertebral disc degeneration on biomechanical behaviors of a lumbar motion segment under physiological loading conditions. J Mech Sci Technol, 2013, 27: 483–489. [Google Scholar]
- 24. Galbusera F, Schmidt H, Neidlinger‐Wilke C, Gottschalk A, Wilke HJ. The mechanical response of the lumbar spine to different combinations of disc degenerative changes investigated using randomized poroelastic finite element models. Eur Spine J, 2011, 20: 563–571. [DOI] [PMC free article] [PubMed] [Google Scholar]
- 25. Jackson AR, Huang CY, Gu WY. Effect of endplate calcification and mechanical deformation on the distribution of glucose in intervertebral disc: a 3D finite element study. Comput Methods Biomech Biomed Engin, 2011, 14: 195–204. [DOI] [PMC free article] [PubMed] [Google Scholar]
- 26. Little JP, Adam CJ, Evans JH, Pettet GJ, Pearcy MJ. Nonlinear finite element analysis of anular lesions in the L4/5 intervertebral disc. J Biomech, 2007, 40: 2744–2751. [DOI] [PubMed] [Google Scholar]
- 27. Tang S, Rebholz BJ. Does anterior lumbar interbody fusion promote adjacent degeneration in degenerative disc disease? A finite element study. J Orthop Sci, 2011, 16: 221–228. [DOI] [PubMed] [Google Scholar]
- 28. Ruberté LM, Natarajan RN, Andersson GB. Influence of single‐level lumbar degenerative disc disease on the behavior of the adjacent segments–a finite element model study. J Biomech, 2009, 42: 341–348. [DOI] [PubMed] [Google Scholar]
- 29. Park WM, Kim K, Kim YH. Effects of degenerated intervertebral discs on intersegmental rotations, intradiscal pressures, and facet joint forces of the whole lumbar spine. Comput Biol Med, 2013, 43: 1234–1240. [DOI] [PubMed] [Google Scholar]
- 30. Wu Y, Wang Y, Wu J, et al Study of double‐level degeneration of lower lumbar spines by finite element model. World Neurosurg, 2016, 86: 294–299. [DOI] [PubMed] [Google Scholar]
- 31. Du C, Mo Z, Tian S, et al Biomechanical investigation of thoracolumbar spine in different postures during ejection using a combined finite element and multi‐body approach. Int J Numer Method Biomed Eng, 2014, 30: 1121–1131. [DOI] [PubMed] [Google Scholar]
- 32. Du CF, Yang N, Guo JC, Huang YP, Zhang C. Biomechanical response of lumbar facet joints under follower preload: a finite element study. BMC Musculoskelet Disord, 2016, 17: 126–138. [DOI] [PMC free article] [PubMed] [Google Scholar]
- 33. Keaveny TM, Buckley JM. Biomechanics of vertebral bone In: Kurtz SM, Edidin AA, eds. Spine Technology Handbook. New York: Academic Press, 2006; 63–98. [Google Scholar]
- 34. Simon P, Espinoza Orias AA, Andersson GB, An HS, Inoue N. In vivo topographic analysis of lumbar facet joint space width distribution in healthy and symptomatic subjects. Spine (Phila Pa 1976), 2012, 37: 1058–1064. [DOI] [PMC free article] [PubMed] [Google Scholar]
- 35. Woldtvedt DJ, Womack W, Gadomski BC, Schuldt D, Puttlitz CM. Finite element lumbar spine facet contact parameter predictions are affected by the cartilage thickness distribution and initial joint gap size. J Biomech Eng, 2011, 133: 061009. [DOI] [PubMed] [Google Scholar]
- 36. Pooni JS, Hukins DW, Harris PF, Hilton RC, Davies KE. Comparison of the structure of human intervertebral discs in the cervical, thoracic and lumbar regions of the spine. Surg Radiol Anat, 1986, 8: 175–182. [DOI] [PubMed] [Google Scholar]
- 37. Ayturk UM, Garcia JJ, Puttlitz CM. The micromechanical role of the annulus fibrosus components under physiological loading of the lumbar spine. J Biomech Eng, 2010, 132: 061007. [DOI] [PubMed] [Google Scholar]
- 38. Shirazi‐Adl A, Ahmed AM, Shrivastava SC. Mechanical response of a lumbar motion segment in axial torque alone and combined with compression. Spine (Phila Pa 1976), 1986, 11: 914–927. [DOI] [PubMed] [Google Scholar]
- 39. Boden SD, Davis DO, Dina TS, Patronas NJ, Wiesel SW. Abnormal magnetic‐resonance scans of the lumbar spine in asymptomatic subjects. A prospective investigation. J Bone Joint Surg Am, 1990, 72: 403–408. [PubMed] [Google Scholar]
- 40. Elfering A, Semmer N, Birkhofer D, Zanetti M, Hodler J, Boos N. Risk factors for lumbar disc degeneration: a 5‐year prospective MRI study in asymptomatic individuals. Spine (Phila Pa 1976), 2002, 27: 125–134. [DOI] [PubMed] [Google Scholar]
- 41. McMillan DW, McNally DS, Garbutt G, Adams MA. Stress distributions inside intervertebral discs: the validity of experimental ‘tress profilometry’. Proc Inst Mech Eng H, 1996, 210: 81–87. [DOI] [PubMed] [Google Scholar]
- 42. Benneker LM, Heini PF, Anderson SE, Alini M, Ito K. Correlation of radiographic and MRI parameters to morphological and biochemical assessment of intervertebral disc degeneration. Eur Spine J, 2005, 14: 27–35. [DOI] [PMC free article] [PubMed] [Google Scholar]
- 43. Kumaresan S, Yoganandan N, Pintar FA, Maiman DJ, Goel VK. Contribution of disc degeneration to osteophyte formation in the cervical spine: a biomechanical investigation. J Orthop Res, 2001, 19: 977–984. [DOI] [PubMed] [Google Scholar]
- 44. He X, Liang A, Gao W, et al The relationship between concave angle of vertebral endplate and lumbar intervertebral disc degeneration. Spine (Phila Pa 1976), 2012, 37: 1068–1073. [DOI] [PubMed] [Google Scholar]
- 45. Cai XY, Sang D, Yuchi CX, et al Using finite element analysis to determine effects of the motion loading method on facet joint forces after cervical disc degeneration. Comput Biol Med, 2020, 116: 103519 10.1016/j.compbiomed.2019.103519. [DOI] [PubMed] [Google Scholar]
- 46. Wang K, Wang L, Deng Z, Jiang C, Niu W, Zhang M. Influence of passive elements on prediction of intradiscal pressure and muscle activation in lumbar musculoskeletal models. Comput Methods Programs Biomed, 2019, 177: 39–46. [DOI] [PubMed] [Google Scholar]
- 47. Du CF, Guo JC, Huang YP, Fan YB. A new method for determining the effect of follower load on the range of motions in the lumbar spine. In: World Congress on Medical Physics and Biomedical Engineering, June 7–12, 2015, Toronto, Canada, 2015; 326–329.
- 48. Schmidt H, Heuer F, Simon U, et al Application of a new calibration method for a three‐dimensional finite element model of a human lumbar annulus fibrosus. Clin Biomech (Bristol, Avon), 2006, 21: 337–344. [DOI] [PubMed] [Google Scholar]
- 49. Schmidt H, Heuer F, Drumm J, Klezl Z, Claes L, Wilke HJ. Application of a calibration method provides more realistic results for a finite element model of a lumbar spinal segment. Clin Biomech (Bristol, Avon), 2007, 22: 377–384. [DOI] [PubMed] [Google Scholar]
- 50. Renner SM, Natarajan RN, Patwardhan AG, et al Novel model to analyze the effect of a large compressive follower pre‐load on range of motions in a lumbar spine. J Biomech, 2007, 40: 1326–1332. [DOI] [PubMed] [Google Scholar]
- 51. Wang IC, Ueng SW, Lin SS, et al Effect of hyperbaric oxygenation on intervertebral disc degeneration: an in vitro study with human lumbar nucleus pulposus. Spine (Phila Pa 1976), 2011, 36: 1925–1931. [DOI] [PubMed] [Google Scholar]
- 52. Schmidt H, Heuer F, Wilke HJ. Dependency of disc degeneration on shear and tensile strains between annular fiber layers for complex loads. Med Eng Phys, 2009, 31: 642–649. [DOI] [PubMed] [Google Scholar]
- 53. Mirza SK, White AA 3rd. Anatomy of intervertebral disc and pathophysiology of herniated disc disease. J Clin Laser Med Surg, 1995, 13: 131–142. [DOI] [PubMed] [Google Scholar]
- 54. Raj PP. Intervertebral disc: anatomy‐physiology‐pathophysiology‐treatment. Pain Pract, 2008, 8: 18–44. [DOI] [PubMed] [Google Scholar]
- 55. Yang KH, King AI. Mechanism of facet load transmission as a hypothesis for low‐back pain. Spine (Phila Pa 1976), 1984, 9: 557–565. [DOI] [PubMed] [Google Scholar]
- 56. Butler D, Trafimow JH, Andersson GB, McNeill TW, Huckman MS. Discs degenerate before facets. Spine (Phila Pa 1976), 1990, 15: 111–113. [DOI] [PubMed] [Google Scholar]
- 57. Lee JC, Choi SW. Adjacent segment pathology after lumbar spinal fusion. Asian Spine J, 2015, 9: 807–817. [DOI] [PMC free article] [PubMed] [Google Scholar]
- 58. Videbaek TS, Egund N, Christensen FB, GretheJurik A, Bunger CE. Adjacent segment degeneration after lumbar spinal fusion: the impact of anterior column support: a randomized clinical trial with an eight‐ to thirteen‐year magnetic resonance imaging follow‐up. Spine (Phila Pa 1976), 2010, 35: 1955–1964. [DOI] [PubMed] [Google Scholar]
- 59. Wai EK, Santos ER, Morcom RA, Fraser RD. Magnetic resonance imaging 20 years after anterior lumbar interbody fusion. Spine (Phila Pa 1976), 2006, 31: 1952–1956. [DOI] [PubMed] [Google Scholar]
- 60. Mobbs RJ, Phan K, Malham G, Seex K, Rao PJ. Lumbar interbody fusion: techniques, indications and comparison of interbody fusion options including PLIF, TLIF, MI‐TLIF, OLIF/ATP, LLIF and ALIF. J Spine Surg, 2015, 1: 2–18. [DOI] [PMC free article] [PubMed] [Google Scholar]
- 61. Sohn HM, You JW, Lee JY. The relationship between disc degeneration and morphologic changes in the intervertebral foramen of the cervical spine: a cadaveric MRI and CT study. J Korean Med Sci, 2004, 19: 101–106. [DOI] [PMC free article] [PubMed] [Google Scholar]
- 62. Colombini A, Lombardi G, Corsi MM, Banfi G. Pathophysiology of the human intervertebral disc. Int J Biochem Cell Biol, 2008, 40: 837–842. [DOI] [PubMed] [Google Scholar]
- 63. Massey CJ, van Donkelaar CC, Vresilovic E, Zavaliangos A, Marcolongo M. Effects of aging and degeneration on the human intervertebral disc during the diurnal cycle: a finite element study. J Orthop Res, 2012, 30: 122–128. [DOI] [PubMed] [Google Scholar]
- 64. Galbusera F, Mietsch A, Schmidt H, Wilke HJ, Neidlinger‐Wilke C. Effect of intervertebral disc degeneration on disc cell viability: a numerical investigation. Comput Methods Biomech Biomed Engin, 2013, 16: 328–337. [DOI] [PubMed] [Google Scholar]
- 65. Hadjipavlou AG, Tzermiadianos MN, Bogduk N, Zindrick MR. The pathophysiology of disc degeneration: a critical review. J Bone Joint Surg Br, 2008, 90: 1261–1270. [DOI] [PubMed] [Google Scholar]
- 66. Roughley PJ, Melching LI, Heathfield TF, Pearce RH, Mort JS. The structure and degradation of aggrecan in human intervertebral disc. Eur Spine J, 2006, 15: 326–332. [DOI] [PMC free article] [PubMed] [Google Scholar]
- 67. Zhu R, Niu WX, Wang ZP, et al The effect of muscle direction on the predictions of finite element model of human lumbar spine. Biomed Res Int, 2018, 2018: 4517471. [DOI] [PMC free article] [PubMed] [Google Scholar]


