

Abstract
Background
In the context of home confinement during the coronavirus disease (COVID-19) pandemic, objective, real-time data are needed to assess populations’ adherence to home confinement to adapt policies and control measures accordingly.
Objective
The aim of this study was to determine whether wearable activity trackers could provide information regarding users' adherence to home confinement policies because of their capacity for seamless and continuous monitoring of individuals’ natural activity patterns regardless of their location.
Methods
We analyzed big data from individuals using activity trackers (Withings) that count the wearer’s average daily number of steps in a number of representative nations that adopted different modalities of restriction of citizens’ activities.
Results
Data on the number of steps per day from over 740,000 individuals around the world were analyzed. We demonstrate the physical activity patterns in several representative countries with total, partial, or no home confinement. The decrease in steps per day in regions with strict total home confinement ranged from 25% to 54%. Partial lockdown (characterized by social distancing measures such as school closures, bar and restaurant closures, and cancellation of public meetings but without strict home confinement) does not appear to have a significant impact on people’s activity compared to the pre-pandemic period. The absolute level of physical activity under total home confinement in European countries is around twofold that in China. In some countries, such as France and Spain, physical activity started to gradually decrease even before official commitment to lockdown as a result of initial less stringent restriction orders or self-quarantine. However, physical activity began to increase again in the last 2 weeks, suggesting a decrease in compliance with confinement orders.
Conclusions
Aggregate analysis of activity tracker data with the potential for daily updates can provide information regarding adherence to home confinement policies.
Keywords: wearable activity trackers, pandemic, COVID-19, home confinement, lockdown, monitoring, wearables, tracking
Introduction
Nationwide total home confinement is the most significant measure that has been taken to prevent the spread of coronavirus disease (COVID-19) infection [1]. Currently, over 3 billion people worldwide, one-quarter of the world’s population, are confined to their homes. However, the timing and stringency of governmental decisions have been heterogeneous; some governments have imposed total lockdown, while others have required partial or no confinement. Objective, real-time measures to assess populations’ adherence to confinement are essential to adapt policies and control measures accordingly.
We asked whether wearable activity trackers could provide this information because of their capacity for seamless and continuous monitoring of individuals’ natural activity patterns regardless of their location [2]. Data from activity trackers enable the compilation of synchronized big data resources on human behavior with high geographical and temporal resolution. In the context of the COVID-19 pandemic, activity trackers provide a valuable data set that objectively documents the time course of adherence to home confinement worldwide in response to the outbreak.
Methods
We analyzed data from approximately 742,000 individuals using activity trackers that count the wearer’s average daily number of steps (Withings) in a number of representative nations that adopted different modalities of restriction of citizens’ activities. We selected the nations according to a compromise between exposure to the COVID-19 pandemic, rules of lockdown, and availability of data from a large number of activity tracker users.
The pre-pandemic period was used as a reference. For each individual, we calculated the average daily number of steps between December 1, 2019, and the date of lockdown, representing the pre-pandemic period, and the average daily number of steps between the date of lockdown and the analysis time point (4 weeks for China). These data were then aggregated across countries or regions. The paired Wilcoxon nonparametric test was used to compare the number of steps per day before and during lockdown. The data presented extend to April 13, 2020, and are averaged by days and over countries or provinces/states.
The activity tracker used in this study was a wristwatch with an embedded accelerometer that counts steps. The performance of this tracker is reported to be one of the best among available devices [3]. The activity tracker provides the most accurate measures of step count under all three important physiological conditions (ie, treadmill, over-ground, and 24-hour conditions). The same accelerometer and algorithm were used for all individuals included in the analysis. All activity tracker wearers were informed that the anonymized data collected from them could be used for research purposes, and they provided informed consent before starting to use the activity tracker. They were allowed to withdraw their consent at any time and request deletion of their individual data.
Results
Table 1 shows the number of users per country or province/state, percentage of female users, lockdown initiation dates, rules, and percentage of decrease in steps during lockdown. The most demonstrative countries are presented in Figure 1, illustrating the time course of the step count and enhancing the data in Table 1. Before the epidemic, all countries showed a stable mean number of steps per day, with periodic and reproducible decreases during weekends. In countries adopting a total lockdown, a marked decrease (from 25% to 54%) in the number of steps following the official dates of home confinement can be clearly identified (Figure 1A). Partial lockdown (characterized by social distancing measures such as school closures, bar and restaurant closures, and cancellation of public meetings but without strict home confinement) does not appear to have a significant clinical impact on people’s activity compared to the pre-pandemic period (Figure 1B), with similar activity patterns to those in nations without any restriction orders (Figure 1C).
Table 1.
Characteristics of the studied population.
| Country | Province or state |
Size of user populationa | Proportion of women (%)a | Mean age (years) | Lockdown rules | Lockdown date | Baseline steps per day |
Lockdown steps per day | Decrease in steps (%) |
P value |
| Australia | N/Ab | 10,000 | 42 | 42 | Partial | 2020-03-23 | 5765 | 5302 | 8.0 | <.001 |
| Canada | N/A | 10,000 | 38 | 43 | None | N/A | 5049 | 4708 | 6.8 | <.001 |
| China | N/A | 10,000 | 19 | 36 | Total | 2020-01-23 | 4108 | 3034 | 26.1 | <.001 |
| China | Hubei | 100 | 14 | 35 | Total | 2020-01-23 | 4375 | 1943 | 55.6 | <.001 |
| France | N/A | 100,000 | 43 | 43 | Total | 2020-03-17 | 4604 | 3342 | 27.4 | <.001 |
| Germany | N/A | 100,000 | 37 | 46 | Partial | 2020-03-16 | 5349 | 5416 | –1.3 | <.001 |
| Ireland | N/A | 10,000 | 38 | 42 | Total | 2020-03-28 | 5326 | 5356 | –0.6 | <.001 |
| Italy | N/A | 10,000 | 31 | 45 | Total | 2020-03-10 | 5445 | 3918 | 28.0 | <.001 |
| Italy | Lodi | 100 | 29 | 45 | Total | 2020-02-21 | 5640 | 5035 | 10.7 | <.001 |
| Japan | N/A | 100,000 | 29 | 43 | Total | 2020-04-07 | 5460 | 4581 | 16.1 | <.001 |
| Netherlands | N/A | 10,000 | 38 | 44 | None | N/A | 5193 | 5180 | 0.3 | <.001 |
| Singapore | N/A | 1000 | 33 | 41 | None | N/A | 6127 | 5860 | 4.3 | <.001 |
| Spain | N/A | 10,000 | 36 | 46 | Total | 2020-03-15 | 6215 | 3638 | 41.5 | <.001 |
| Sweden | N/A | 10,000 | 34 | 44 | None | N/A | 5681 | 6004 | –5.7 | <.001 |
| Switzerland | N/A | 10,000 | 40 | 44 | Partial | 2020-03-16 | 5325 | 4947 | 7.1 | <.001 |
| United Kingdom | N/A | 100,000 | 39 | 43 | Total | 2020-03-23 | 5690 | 5249 | 7.8 | <.001 |
| United States | N/A | 100,000 | 43 | 43 | Partial | 2020-03-22 | 5287 | 4912 | 7.1 | <.001 |
| United States | California | 100,000 | 38 | 43 | Total | 2020-03-19 | 5508 | 5013 | 9.0 | <.001 |
| United States | Florida | 10,000 | 44 | 46 | Partial | 2020-03-17 | 5303 | 5225 | 1.5 | <.001 |
| United States | Illinois | 10,000 | 41 | 42 | Total | 2020-03-21 | 5415 | 4966 | 8.3 | <.001 |
| United States | New Jersey | 10,000 | 38 | 43 | Total | 2020-03-21 | 5297 | 4693 | 11.4 | <.001 |
| United States | Pennsylvania | 10,000 | 43 | 44 | Partial | 2020-03-19 | 5186 | 4974 | 4.1 | <.001 |
| United States | New York | 10,000 | 39 | 42 | Partial | 2020-03-22 | 5776 | 4499 | 22.1 | <.001 |
| United States | Nevada | 1000 | 42 | 45 | Partial | 2020-03-21 | 5391 | 4902 | 9.1 | <.001 |
aThe number of users having activity data on a given day is subject to variation; the numbers given in the table are representative orders of magnitude of the daily number of users having activity data.
bNot applicable.
Figure 1.
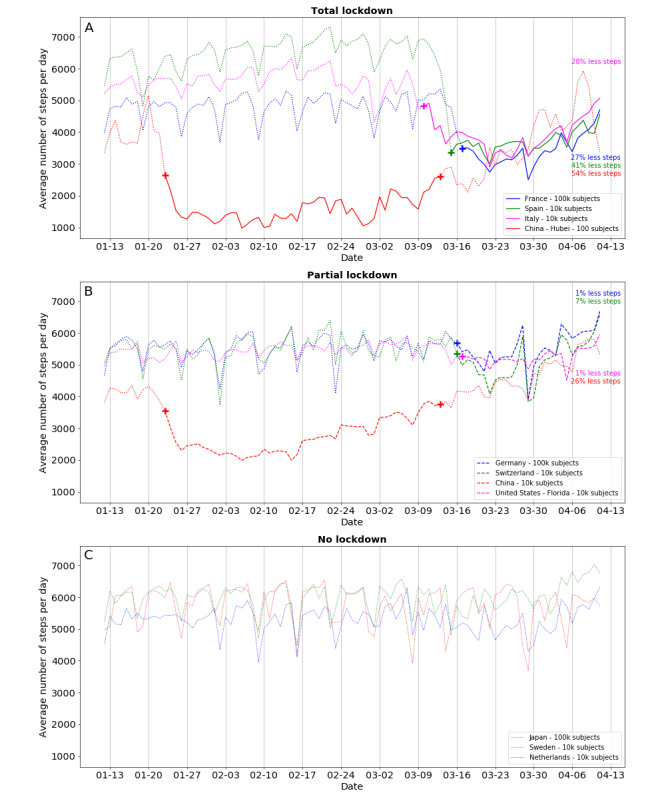
Trajectories of average daily number of steps recorded by activity trackers from January 13, 2020, to April 13, 2020, in a number of representative countries worldwide adopting total (A), partial (B), or no (C) lockdown. Solid lines indicate total lockdown periods, dashed lines indicate partial lockdown periods, and dotted lines indicate no lockdown. Crosses indicate the start and end dates of lockdown in the different countries.
Discussion
Principal Findings
The absolute level of physical activity under total home confinement in European countries is around twofold that in China (Table 1); this may be due to stricter governmental rules in China or different national temperaments. Interestingly, in some countries, such as France and Spain, physical activity started to gradually decrease even before official commitment to lockdown as a result of initial less stringent restriction orders or self-quarantine. However, physical activity began to increase again in the last 2 weeks, suggesting a decrease in compliance with confinement orders. Countries with partial or no lockdown policies had marginal or no changes in walking habits. Ireland was the only country with enforced confinement that showed no change in step counts. Regarding the magnitude and significance of the changes, all differences were highly significant in statistical terms (P<.001) because of the large number of users and because of consistent trends among users (the vast majority of users changed their step counts in the same direction, even for small changes). Clinical significance is thus arbitrary, and the weekly trends suggest spontaneous group changes (decreases on weekends). In fully locked-down countries, with the exception of Ireland, the number of steps decreased below the maximum on weekends; this shows overall good compliance with lockdown rules.
Conclusion
Aggregate analysis of activity tracker data, with the potential for daily updates, can inform governments and stakeholders on adherence to home confinement policies as well as their efficacy without violating citizens’ privacy [4]. The data allow comparison of the effectiveness of different government policies. Finally, quantification of physical activity patterns, particularly leisure versus occupational patterns, and their consequences on cardiometabolic health are important because sport and leisure physical activities have been shown to have positive effects on cardiometabolic health, whereas occupational physical activity has not [5]. Data emerging from studies conducted during lockdown will help to address this issue.
Acknowledgments
We thank Alison Foote, Grenoble Alpes University Hospital, France, for critically editing the manuscript. JLP is supported by a research grant from the French National Research Agency (ANR-12-TECS-0010) in the framework of the “Investissements d’avenir” program (ANR-15-IDEX-02) and the “e-Health and Integrated Care” and “Trajectories Medicine” Chairs of Excellence at Université Grenoble Alpes (MIAI Grenoble Alpes, ANR-19-P3IA-0003).
Abbreviations
- COVID-19
coronavirus disease
Footnotes
Authors' Contributions: JLP and PB conceived the study; RY, VV, and PJ acquired and analyzed the data; and JLP, RMB, PE, and PB drafted and significantly revised the manuscript.
Conflicts of Interest: RY, VV, and PJ are employees of Withings, a manufacturer of wearable activity tracking systems; PE is a remunerated scientific advisor to Withings; and JLP and PB are informal unpaid scientific advisors to Withings.
References
- 1.Wang G, Zhang Y, Zhao J, Zhang J, Jiang F. Mitigate the effects of home confinement on children during the COVID-19 outbreak. Lancet. 2020 Mar;395(10228):945–947. doi: 10.1016/s0140-6736(20)30547-x. [DOI] [PMC free article] [PubMed] [Google Scholar]
- 2.Frie K, Hartmann-Boyce J, Jebb S, Oke J, Aveyard P. Patterns in Weight and Physical Activity Tracking Data Preceding a Stop in Weight Monitoring: Observational Analysis. J Med Internet Res. 2020 Mar 17;22(3):e15790. doi: 10.2196/15790. https://www.jmir.org/2020/3/e15790/ [DOI] [PMC free article] [PubMed] [Google Scholar]
- 3.An H, Jones GC, Kang S, Welk GJ, Lee J. How valid are wearable physical activity trackers for measuring steps? Eur J Sport Sci. 2017 Apr;17(3):360–368. doi: 10.1080/17461391.2016.1255261. [DOI] [PubMed] [Google Scholar]
- 4.Buckee CO, Balsari S, Chan J, Crosas M, Dominici F, Gasser U, Grad YH, Grenfell B, Halloran ME, Kraemer MUG, Lipsitch M, Metcalf CJE, Meyers LA, Perkins TA, Santillana M, Scarpino SV, Viboud C, Wesolowski A, Schroeder A. Aggregated mobility data could help fight COVID-19. Science. 2020 Apr 10;368(6487):145–146. doi: 10.1126/science.abb8021. [DOI] [PubMed] [Google Scholar]
- 5.Climie RE, Boutouyrie P, Perier M, Chaussade E, Plichart M, Offredo L, Guibout C, van Sloten TT, Thomas F, Pannier B, Sharman JE, Laurent S, Jouven X, Empana J. Association Between Occupational, Sport, and Leisure Related Physical Activity and Baroreflex Sensitivity. Hypertension. 2019 Dec;74(6):1476–1483. doi: 10.1161/hypertensionaha.119.13461. [DOI] [PubMed] [Google Scholar]