

Abstract
Purpose
In this study, the efficacy of US/CEUS and clinicopathologic parameters in differential diagnosis of hepatic inflammatory lesions were evaluated.
Methods
This was a retrospective study in which CEUS imaging was performed on 182 patients. Among these patients, 44 patients had hepatic inflammatory lesions and 138 patients had malignant lesions. The ultrasound (US), CEUS, and clinicopathologic parameters with respect to differential diagnosis of hepatic inflammatory lesions were analyzed.
Results
Irregular lesion shape and unclear margin were commonly seen in hepatic inflammatory lesions by US/CEUS examination. Hypoenhancement in arterial phase (AP) and portal venous phase (PVP), and isoenhancement in delayed phase (DP) were more commonly found in inflammatory lesions rather than malignant lesions [9% (4/44), 68% (30/44), and 16% (7/44) vs 2% (3/138), 11% (15/138), 1% (1/138), respectively; P < .05]. The enhancement coverage was also a significant indicator for the differentiation of inflammatory lesions and malignant lesions (P < .05). History of hepatitis or cirrhosis, and higher serum alpha‐fetoprotein (AFP) level were indicators for malignant lesions, while liver parasites and higher body temperature were indicators for inflammatory lesions. When the US/CEUS findings were combined with clinicopathologic parameters, the diagnostic accuracy of inflammatory lesions could reach 93.3%, with sensitivity, specificity, positive predictive value, and negative predictive value of 63.64%, 96.03%, 84.85%, and 88.32%, respectively.
Conclusion
The US/CEUS findings combined with clinical characteristics can accurately differentiate hepatic inflammatory lesions and malignant lesions. The results of study will improve the diagnostic confidence for hepatic inflammatory lesions.
Keywords: contrast‐enhanced ultrasound imaging, differential diagnosis, hepatic inflammatory lesion
1. INTRODUCTION
Hepatic inflammatory lesions include pyogenic liver abscess, parasitic liver abscess, inflammatory pseudotumor, and granulomatous inflammation.1, 2, 3, 4, 5, 6, 7 The most common symptoms are fever and abdominal pain. It usually progresses rapidly, for example, liver abscess can develop a liquefaction center within 2 weeks.8 However, due to the extensive use of antibiotics, hepatic inflammatory lesions usually exhibit atypical clinical features. Under the circumstances, radiological examinations often play an important role in the diagnosis of the inflammatory liver mass. Unenhanced ultrasound (US) and color Doppler ultrasonographic examination are widely used to screen liver lesions, but these techniques have limited performance in the characterization of inflammatory lesions because the inflammatory mass may present highly variable US findings depending on the pathological stage. In addition, the inflammatory lesions and malignant lesions share similar vascular pattern on color Doppler images, which may lead to misdiagnoses or even unnecessary surgery.9, 10, 11, 12, 13, 14, 15, 16, 17, 18 Contrast‐enhanced ultrasound (CEUS) with intravenous bolus injection of microbubbles can reflect tissue perfusion and improve the display of the characterization of focal liver lesions (FLL),19 especially for the differential diagnosis of benign and malignant FLL. CEUS is comparable to CT and MRI for the diagnosis of liver masses if an appropriate acoustic window is available.20, 21, 22, 23, 24, 25, 26 However, diagnostic efficacy of CEUS for the hepatic inflammatory lesions is still debatable, because it has similar perfusion pattern with malignant lesion. Therefore, in this study, differential diagnostic value of US/CEUS findings and clinicopathologic parameters for inflammatory lesions diagnosis was retrospectively analyzed to evaluate the diagnosis efficacy of CEUS for hepatic inflammatory lesions.
2. MATERIALS AND METHODS
2.1. Patients
This retrospective study involved the patients who underwent ultrasound examination at Ultrasound Department of West China Hospital and Nan Chong Central Hospital between April 2009 and February 2014. Patients were excluded if the time intensity curve (TIC) could not be drawn due to the poor quality of CEUS images, such as the patients breathed hard during arterial or late phase.
All ultrasound diagnosis was confirmed by histopathological examination of the percutaneous biopsy or surgical specimens. The study was approved by the local institutional ethics committee.
2.2. Clinical characteristics
The demographics, body temperature, and history of cirrhosis or biliary calculi were recorded for each patient. All the patients underwent blood routine test, including white blood cell counts (WBC), eosinophil percentage (EOS %), hepatic function tests, parasitology test, and serum tumoral marker test including alpha‐fetoprotein (AFP), carcinoembryonic antigen (CEA), and carbohydrate antigen 19.9 (CA19.9).
2.3. US/CEUS examination
Conventional abdominal US and CEUS examinations were performed by four US doctors who all had more than 10 years’ experiences in abdominal ultrasound and more than 5 years’ experiences in CEUS. During the conventional abdominal US examination, the size, shape, and internal echogenicity of the mass, the number of mass, and appearance of mass’ margin were recorded.
Following the B‐mode evaluation of the hepatic lesions, CEUS examinations were performed using Philips IU22 (Philips Healthcare) equipped with a C1‐5 probe. For CEUS examination, a low mechanical index (MI) was used for continuous real‐time imaging. Ultrasonic second‐generation contrast agents, sulfur hexafluoride microbubbles (SonoVue®), were used. An intravenous bolus of 2.4 mL SonoVue® was applied followed by a bolus of 5 mL saline flush.
The lesion was evaluated during three phases, 10 to 30 seconds (arterial phase, AP), 31 to 120 seconds (portal venous phase, PVP), and 121 seconds (delayed phase, DP) after SonoVue® injection. The level of the enhancement of the lesion was compared to the adjacent liver parenchyma and describes as hypo‐, iso‐, or hyperenhancing (Figure 1).
Figure 1.
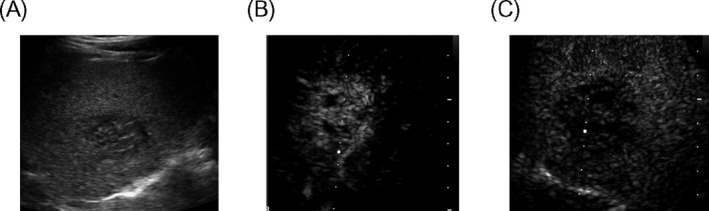
US/CEUS examination. A, Hypoechoic mass of right lobe of liver; B, the arterial phase showed rapid and high enhancement; C, the portal phase began to clear
2.4. The US/CEUS parameters’ evaluation
The US/CEUS parameters were evaluated, including (a) the maximum size of lesion (lesion size was defined as the largest diameter of the lesion under US scanning. In patients with multiple lesions, the largest lesion was selected for analysis); (b) the number of the lesions (solitary or numerous if the number of the lesions ≥2); (c) the echogenicity of the lesion (hyperechoic, isoechoic, or hypoechoic; as compared with surrounding liver parenchyma); (d) the shape of the lesion (regular or irregular); (e) the margin of the lesion (rough or smooth); and (f) the enhancement coverage, which represented the percentage of the isoenhancing or hyperenhancing area in the total area of the lesion in the arterial phase. Based on the amount of the enhancement coverage, the lesion enhancement was further categorized as following: enhancement in <50%, 50%‐75%, and 75%‐99% of lesion area and fill full (100%).
2.5. Statistical analysis
Age, gender, history of hepatitis and/or cirrhosis, lesion number, lesion size, baseline ultrasound echogenicity, lesion margin, lesion shape, enhancement in AP, enhancement in PVP, enhancement in DP, the enhancement coverage, WBC, serum AFP level, CEA level, CA19‐9 level, temperature, biliary calculi, parasites, and EOS% were treated as both continuous and dichotomous variables, using their respective medians for statistical analysis. Continuous variables were compared using Student's t test or non‐parametric Mann‐Whitney test. The diagnostic values of the clinicopathologic variables and US/CEUS findings were assessed using univariate regression analyses. The significant diagnostic factors (P < .05) were further subjected to a forward stepwise multivariate logistic regression to determine the independent diagnostic factors for differentiating malignant mass and inflammatory mass. All variables found to be significant on univariate analysis (P < .05) were entered into a step‐down Cox proportional hazard regression analysis. SPSS 10.0 software package (SPSS Inc) was used for data analysis.
3. RESULTS
3.1. Basic characteristics
A total of 182 patients were finally included, of them 44 had liver inflammatory lesions (median age: 49 years; range: 19‐75 years). Of 44 patients with liver inflammatory lesions, 16 had parasitic abscesses, 6 had inflammatory pseudotumor, 1 had granulomatous inflammation, 17 had pyogenic liver abscess, and 4 had chronic liver abscess. Malignant lesions were identified in other 138 cases (median age: 51 years; range: 26‐77 years), of whom 74 cases were diagnosed with hepatocellular carcinoma (HCC), 25 had cholangiocarcinoma carcinoma (ICC), and 39 had metastatic tumors.
3.2. Regression analyses of the clinicopathologic variables and US/CEUS findings
Univariate logistic regression analyses were performed to examine the diagnostic value of clinicopathologic variables and US/CEUS findings in differentiating malignant lesions and inflammatory lesions. The corresponding P value of each variable is listed in Table 1. Using regression analyses, 13 variables were identified, including presence of hepatitis, cirrhosis, parasites, the appearance of lesion margin, the shape of the lesion, enhancement in AP, enhancement in PVP, enhancement in DP, the enhancement coverage, WBC, AFP, body temperature, and EOS%, which were significant predictors for inflammatory lesions or malignant lesions.
Table 1.
The univariate predictors of malignant lesions or inflammatory lesions and their corresponding P values of logistic regression analysis
| Characteristic | IL | Malignant | Odds ratio | Std. Err. | P | 95% CI |
|---|---|---|---|---|---|---|
| Age | 0.9761882 | 0.0130029 | .070 | 0.9510328‐1.002009 | ||
| Sex | ||||||
| Male | 30 | 109 | 0.5701179 | 0.219639 | .145 | 0.2679401‐1.213086 |
| Female | 14 | 29 | ||||
| Hepatitis | ||||||
| Yes | 13 | 92 | 0.2119816 | 0.0798553 | .000 | 0.1013079‐0.4435606 |
| No | 31 | 46 | ||||
| Cirrhosis | ||||||
| Yes | 3 | 46 | 0.1463415 | 0.0914291 | .002 | 0.0430096‐0.4979308 |
| No | 41 | 92 | ||||
| US Echogenicity | ||||||
| Hyperechogenicity | 5 | 35 | 0.6992506 | 0.1628138 | .124 | 0.4430356‐1.103639 |
| Isoechogenicity | 6 | 11 | ||||
| Hypoechogenicity | 33 | 92 | ||||
| US Margin | ||||||
| Rough | 36 | 75 | 3.78 | 1.612533 | .002 | 1.638222‐8.721897 |
| Smooth | 8 | 63 | ||||
| Shape | ||||||
| Regular | 11 | 80 | 4.137931 | 1.607699 | .000 | 1.932272‐8.861318 |
| Irregular | 33 | 58 | ||||
| Enhancement in AP | ||||||
| Hyperenhancement | 37 | 134 | 0.3782785 | 0.1461275 | .012 | 0.1774172‐0.8065429 |
| Isoenhancement | 3 | 1 | ||||
| Hypoenhancement | 4 | 3 | ||||
| Enhancement in PVP | ||||||
| Hyperenhancement | 0 | 2 | 2.520323 | 0.9601924 | .015 | 1.194444‐5.317982 |
| Isoenhancement | 14 | 121 | ||||
| Hypoenhancement | 30 | 15 | ||||
| Enhancement in DP | ||||||
| Hyperenhancement | 0 | 0 | 25.9189 | 28.12151 | .003 | 3.090861‐217.3471 |
| Isoenhancement | 7 | 1 | ||||
| Hypoenhancement | 37 | 137 | ||||
| Enhancement coverage | ||||||
| 100% | 11 | 52 | 0.5888416 | 0.0964398 | .001 | 0.4271591‐0.8117219 |
| 75%‐99% | 8 | 51 | ||||
| 50‐75 | 7 | 16 | ||||
| <50 | 11 | 16 | ||||
| Number | ||||||
| Solitary | 36 | 89 | 0.4670554 | 0.1933218 | .066 | 0.2075115‐1.051222 |
| Numerous | 8 | 49 | ||||
| Size(cm) | 1.07442 | 0.0585504 | .188 | 0.9655796‐1.19553 | ||
| WBC | ||||||
| Positive | 17 | 9 | 7.356322 | 3.450993 | .000 | 2.933226‐18.44913 |
| Negative | 27 | 129 | ||||
| AFP (ng/mL) | ||||||
| ≤20 | 44 | 78 | 0.8910676 | 0.0522577 | .049 | 0.7943117‐0.9996095 |
| 21‐400 | 0 | 35 | ||||
| >400 | 0 | 25 | ||||
| CEA (ng/mL) | ||||||
| Positive | 6 | 42 | 0.9050758 | 0.0577823 | .118 | 0.7986235‐1.025718 |
| Negative | 38 | 96 | ||||
| CA199(U/mL) | ||||||
| Positive | 6 | 52 | 0.9873957 | 0.0074108 | .091 | 0.9729771‐1.002028 |
| Negative | 38 | 86 | ||||
| Temperature(℃) | ||||||
| ≤37.3 | 36 | 135 | 4.268652 | 1.662032 | .000 | 1.990073‐9.156142 |
| >37.3 | 8 | 3 | ||||
| Biliary calculi | ||||||
| Positive | 7 | 9 | 2.711712 | 1.457144 | .063 | 0.9459075‐7.773891 |
| Negative | 37 | 129 | ||||
| Parasites | ||||||
| Positive | 19 | 2 | 51.68 | 40.03064 | .000 | 11.32382‐235.8587 |
| Negative | 25 | 136 | ||||
| EOS% | ||||||
| Positive | 11 | 13 | 3.205128 | 1.455196 | .010 | 1.316382‐7.80385 |
| Negative | 33 | 125 | ||||
CEA > 3.4 ng/mL was considered as positive. CA19‐9 > 22 U/mL was considered as positive. WBC > 10 × 109/L was considered as positive. EOS% > 5% was considered as positive.
3.3. Differentiating values of US/CEUS findings for inflammatory lesions and malignant lesions
Irregular lesion shape and unclear margin were more commonly found in inflammatory lesions. Irregular lesion shape and unclear margin were found in 75% (33/44) and 82% (36/44) of inflammatory lesions, respectively, whereas regular shape and smooth margin were found in 58% (80/138) and 46% (63/138) of malignant lesions, respectively (P < .001).
The enhancement of temporal features had significant diagnostic values. Hypoenhancement in AP was more common in inflammatory lesions than in malignant lesions [9% (4/44) vs 2% (3/138), respectively; P < .05]. Hypoenhancement in PVP is more often seen in inflammatory lesions than in malignant lesions [68% (30/44) vs 11% (15/138), respectively; P < .05] (Figure 2). Enhancement in DP was significantly associated with malignant lesions or inflammatory lesions (P < .05). Moreover, isoenhancement in DP is more likely to be associated with inflammatory lesions than malignant lesions [16% (7/44) vs 1% (1/138), respectively; P < .05].
Figure 2.
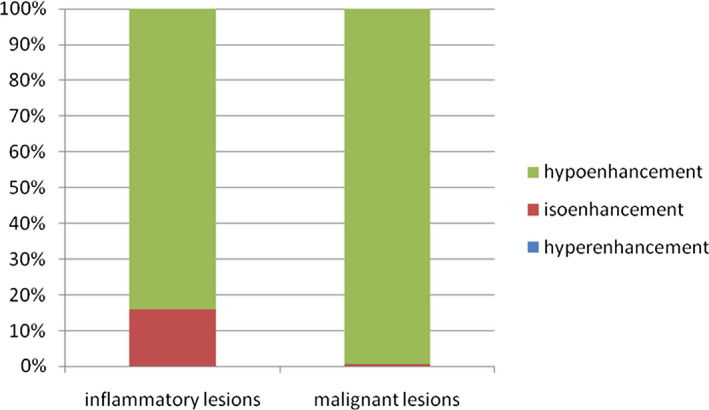
Enhancement in DP was significantly associated with malignant lesions or inflammatory lesions (P < .05), and 16% (7/44) of patients with isoenhancement in the DP had evidence of IL, compared to 1% (1/138) of patients with malignant lesions
The enhancement coverage, which represented percentage area with isoenhancement or hyperenhancement in the arterial phase, was also a significant predictor for differentiating inflammatory lesions and malignant lesions (P < .05) (Figure 3).
Figure 3.
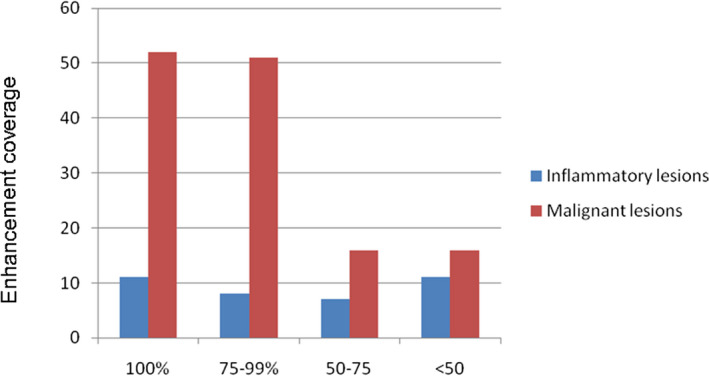
The enhancement coverage with isoenhancement or hyperenhancement during the arterial phase. The enhancement coverage has significant association with malignant lesions or inflammatory lesions (P < .05)
The above‐mentioned significant univariate predictors were further analyzed using stepwise multivariate logistic regression model to identify the independent differential diagnostic factors for malignant lesions and inflammatory lesions. Through multi‐factor stepwise regression analysis, we identified three independent US/CEUS findings including enhancement in AP, enhancement in DP, and the shape of the lesion (Table 2). The diagnostic accuracy for IL was 74.5% based on the three independent factors as ROC curve showed (Figure 4). The sensitivity, specificity, positive predictive value, and negative predictive value of this logistic model were 27.27%, 98.55%, 85.71%, and 80.95%, respectively.
Table 2.
Multivariate stepwise logistic regression analysis result based on univariate analysis of CEUS for malignant lesions or inflammatory lesions
| Benign or malignant | Odds ratio | Std. Err. | P > |z| | [95% CI] |
|---|---|---|---|---|
| Enhancement in AP | 0.4254115 | 0.1805614 | .044 | 0.1851509‐0.9774457 |
| Enhancement in DP | 30.56862 | 34.8744 | .003 | 3.267213‐286.0054 |
| Shape | 5.098112 | 2.232633 | .000 | 2.160926‐12.0276 |
Figure 4.
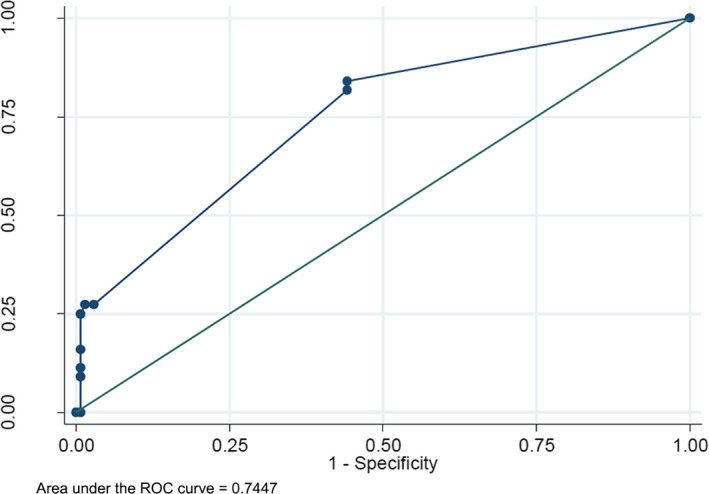
The efficiency of CEUS for IL or malignant lesions. ROC curve for the correctly diagnosed rate of CEUS. The area under the ROC curve = 0.74
3.4. Clinicopathologic characteristics
History of hepatitis and cirrhosis was positively associated with malignant lesions. Hepatitis and cirrhosis were found in 67% (92/138) and 33% (46/138) of patients with malignant lesions, but only found in 30% (13/44) and 7% (3/44) of patients with inflammatory lesions (P < .05).
Liver parasitic disease and higher body temperature were associated with inflammatory lesions. Liver parasites and higher body temperature (>37.3°C) were found in 76% (19/44) and 18%(8/44)of patients with inflammatory lesions, respectively. In contrast, liver parasites and body temperature greater than 37.3°C were found in 1% (2/138) and 2% (3/138) of patients with malignant lesions (P < .05).
The serum AFP level of patients with malignant lesions was higher than that of patients with inflammatory lesions (P < .05), whereas the WBC level and EOS% level of patients with inflammatory lesions were significantly higher than that of patients with malignant lesions (P < .05).
The above‐mentioned significant univariate predictors were further analyzed using stepwise multivariate logistic regression model to identify independent differential diagnostic factors for malignant lesions and inflammatory lesions. Through multi‐factor stepwise regression analysis, four independent clinicopathologic parameters including AFP, temperature, parasites, and WBC were identified.
3.5. Diagnostic efficiency of US/CEUS findings and clinicopathologic parameters for differentiating inflammatory or malignant lesions
The enhancement in AP, enhancement in DP, shape, AFP, temperature, parasites, and WBC were included in our study as independent factors. The diagnostic accuracy was 93.3% based on the independent factors as ROC curve showed (Figure 5). The sensitivity, specificity, positive predictive value, and negative predictive value of this logistic model were 63.64%, 96.03%, 84.85%, and 88.32%, respectively.
Figure 5.
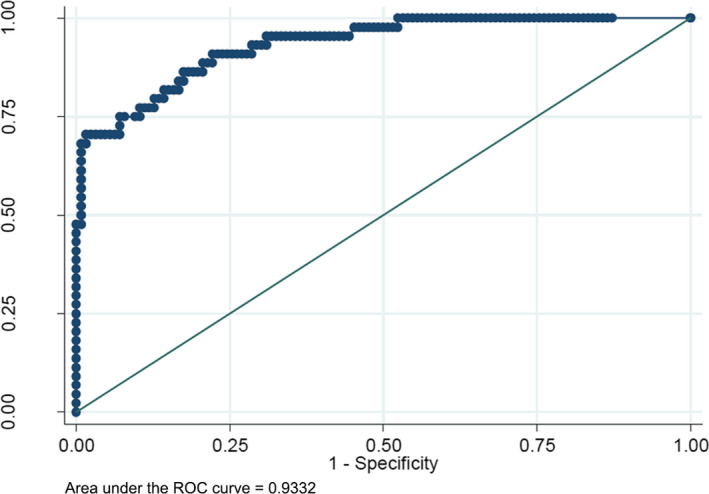
The efficiency of the five independent factors. ROC curve for the correctly diagnosed rate of the five independent factors. The area under the ROC curve = 0.93
4. DISCUSSION
CEUS showed exquisite vascularity and tissue perfusion in real‐time and excellent spatial resolution.27 In this study, we performed CEUS in two cohorts of patients, analyzed the temporal features of enhancement in AP, PVP, and DP, and investigated the differential diagnostic value of the CEUS‐derived parameters in liver inflammatory lesion and malignant lesions. Most malignant lesions showed hyperenhancement during the arterial phase, with hypoenhancement or isoenhancement in the portal venous and late phase. ICC and hepatic metastases often showed a rim‐like hyper‐/isoenhancement with the enhancement coverage less than 50% in AP, followed by hypo‐/isoenhancement during the PVP and LP.28, 29, 30 The rim‐like enhancement pattern also appeared in the inflammatory lesion due to the formation of necrotic center or peripheral inflammatory cell infiltration and granulation tissues. Although the pathological changes of inflammatory lesions vary, the distribution of the enhancement within all inflammatory lesions was similar. The enhancement pattern of inflammatory lesions in AP was nonspecific.
Washout enhancement pattern was considered as the presence of hypoenhancement of the lesion in the portal or late phases preceded by hyperenhancement in the arterial phase. Lesions with washout enhancement pattern should be considered as malignant until proven benign.31 However, in our study, it was found that the proportion of patients with isoenhancement in DP was more likely to be diagnosed with hepatic malignant tumor. When the lesion showed isoenhancement in DP, it obviously increased the confidence of IL. We could find 84% (37/44) typical of IL showed hypoenhancement in DP. The proportion of IL, which showed hypoenhancement in DP, was more than the malignant lesions, which meant that the IL washout was faster than the malignant lesion. Washout enhancement in DP was more common in inflammatory lesions [84% (37/44)] than that in malignant lesions in this study, which was consistent with previous research18 and suggested that inflammatory lesions washout was faster than the malignant lesions. Nonetheless, washout enhancement pattern could not be used as an independent factor for differential diagnosis of inflammatory lesion and malignant lesion. Inflammatory lesions were more likely to have irregular shape because of chronic inflammation in the lesion and the surrounding tissue. We identified three independent US/CEUS‐derived parameters using stepwise multivariate logistic regression model. The area under the ROC curve of the CEUS judgment was 0.73, which meant it was useful for differentiating inflammatory and malignant lesion. In addition, the US/CEUS‐derived parameters could not distinguish inflammatory lesions and malignant lesions independently. It is necessary to take into account both the patient's medical history and laboratory tests.
Cirrhosis existed in both HCC and ICC,32, 33, 41 while chronic viral hepatitis has been recognized as the most important risk factor for cirrhosis development.34, 35, 36 In addition to chronic viral hepatitis, hepatic parasitic diseases also lead to cirrhosis.37, 38, 39, 40 Although not all HCC and especially ICC cases have been recognized as risk factors, primary sclerosing cholangitis,42 hepatobiliary flukes,43 intrahepatic stones,44 and biliary tract malformation have been considered to have the ability to increase the incidence of ICC. Most hepatic inflammatory lesions originated from the liver,7, 50 but they could also show only extrahepatic symptoms.45, 46, 47, 48, 49 Overall, the etiologies of hepatic malignancies and inflammatory lesions vary, and these risk factors often mingled with each other and made it difficult for accurate diagnosis if we only consider some of the factors. Therefore, it is reasonable to bring in more clinicopathological parameters to improve the diagnosis accuracy.
Tumor markers are specific antigen used as a biomarker of malignant cellular transformation.51, 52, 53, 54, 55 We included the clinically widely used tumor serum markers including AFP, CEA, and CA199 in this study and aimed to investigate whether tumor marker measurement would facilitate differential diagnosis of inflammatory lesion and malignant lesion. AFP was not found to be a significant factor as suggested by multivariable analysis; CEA and CA199 might be taken into account. Although chills and fever are not always typical in inflammatory lesions because of the extensive use of antibiotics, we found that higher body temperature indicated inflammatory lesions, especially when combined with parasites and WBC tests. In this study, liver inflammatory lesions had rapid enhancement in the arterial phase and washout in the portal venous or the late phase, which is nonspecific and well‐resembled malignant lesions. Therefore, CEUS‐derived temporal enhancement parameters could not be solely relied on for differential diagnosis of inflammatory lesion and malignant lesion. However, when combined with patient medical history and laboratory test, the diagnosis confidence was greatly improved.
The limitation to our study is that the number of patients with inflammatory lesions was small while that of patients with malignant lesions was large. Further research with larger numbers was needed.
In conclusion, the CEUS‐derived temporal parameters combined with clinical characteristics can accurately differentiate hepatic inflammatory lesions and malignant lesions. Our method might be a potential way to improve the diagnostic confidence for hepatic inflammatory lesions.
ACKNOWLEDGMENT
This work was sponsored by the Research Development Program at School Level of Northern Sichuan Medical College in 2017 (CBY17‐A‐YB30).
Guo Y, Qin X, Chen S, Liu X, Gu P. Diagnosis efficacy of CEUS for hepatic inflammatory lesions. J Clin Lab Anal. 2020;34:e23231 10.1002/jcla.23231
Yuanyuan Guo and Xiachuan Qin are both the first authors of this article.
REFERENCES
- 1. Colmenero Jde D, Queipo‐Ortuño MI, Maria Reguera J, et al. Chronic hepatosplenic abscesses in Brucellosis. Clinico‐therapeutic features and molecular diagnostic approach. Diagn Microbiol Infect Dis. 2002;42:159‐167. [DOI] [PubMed] [Google Scholar]
- 2. Dehner LP. The enigmatic inflammatory pseudotumours: the current state of our understanding, or misunderstanding. J Pathol. 2000;192:277‐279. [DOI] [PubMed] [Google Scholar]
- 3. Peng JS, Lu H, Cruise MW, et al. Paraduodenal inflammatory pseudotumor masquerading as malignancy. BMJ Case Rep. 2019;12(2):2018‐226460. [DOI] [PMC free article] [PubMed] [Google Scholar]
- 4. Joo YE, Kim HS, Choi SK, et al. Hemobilia caused by liver abscess due to intrahepatic duct stones. J Gastroenterol. 2003;38:507‐511. [DOI] [PubMed] [Google Scholar]
- 5. Neill L, Edwards F, Collin SM, et al. Clinical characteristics and treatment outcomes in a cohort of patients with pyogenic and amoebic liver abscess. BMC Infect Dis. 2019;19(1):490. [DOI] [PMC free article] [PubMed] [Google Scholar]
- 6. Lim JH, Mairiang E, Ahn GH. Biliary parasitic diseases including clonorchiasis, opisthorchiasis and fascioliasis. Abdom Imaging. 2008;33:157‐165. [DOI] [PubMed] [Google Scholar]
- 7. Rahimian J, Wilson T, Oram V, et al. Pyogenic liver abscess: recent trends in etiology and mortality. Clin Infect Dis. 2004;39:1654‐2169. [DOI] [PubMed] [Google Scholar]
- 8. Khim G, Em S, Mo S, et al. Liver abscess: diagnostic and management issues found in the low resource setting. Br Med Bull. 2019;13:ldz032. [DOI] [PMC free article] [PubMed] [Google Scholar]
- 9. Akatsu T, Wakabayashi G, Tanimoto A, et al. Inflammatory pseudotumor of the liver masquerading as hepatocellular carcinoma after a hepatitis B virus infection: report of a case. Surg Today. 2006;36:1028‐1031. [DOI] [PubMed] [Google Scholar]
- 10. Brown KT, Gandhi RT, Covey AM, et al. Pylephlebitis and liver abscess mimicking hepatocellular carcinoma. Hepatobiliary Pancreat Dis Int. 2003;2:221‐225. [PubMed] [Google Scholar]
- 11. Calomeni GD, Ataíde EB, Machado RR, et al. Hepatic inflammatory pseudotumor: a case series. Int J Surg Case Rep. 2013;4:308‐311. [DOI] [PMC free article] [PubMed] [Google Scholar]
- 12. Jimeno‐Ayllón C, Martínez‐Fernández R, Serrano‐Sánchez L, et al. Liver abscess mimicking colon cancer. Rev Esp Enferm Dig. 2011;103:658‐660. [DOI] [PubMed] [Google Scholar]
- 13. Xian MF, Lan WT, Huang H, et al. Huge hepatic fungal inflammatory pseudotumor misdiagnosed as primary hepatocellular carcinoma. Ultrasound Q. 2017;33:242‐244. [DOI] [PubMed] [Google Scholar]
- 14. Kim YW, Lee JG, Kim KS, et al. Inflammatory pseudotumor of the liver treated by hepatic resection: a case report. Yonsei Med J. 2006;47:140‐143. [DOI] [PMC free article] [PubMed] [Google Scholar]
- 15. Kitajima K, Shiba H, Nojiri T, et al. Intrahepatic cholangiocarcinoma mimicking hepatic inflammatory pseudotumor. J Gastrointest Surg. 2007;11:398‐402. [DOI] [PubMed] [Google Scholar]
- 16. Mortele KJ, Segatto E, Ros PR. The infected liver: radiologic‐pathologic correlation. Radiographics. 2004;24:937‐955. [DOI] [PubMed] [Google Scholar]
- 17. Poyanli A, Bilge O, Kapran Y. Case report: foreign body granuloma mimicking liver metastasis. Br J Radiol. 2005;78:752‐754. [DOI] [PubMed] [Google Scholar]
- 18. Kong WT, Wang WP, Cai H, et al. The analysis of enhancement pattern of hepatic inflammatory pseudotumor on contrast‐enhanced ultrasound. Abdom Imaging. 2014;39:168‐174. [DOI] [PubMed] [Google Scholar]
- 19. Quaia E, Calliada F, Bertolotto M, et al. Characterization of focal liver lesions with contrast‐specific US modes and a sulfur hexafluoride‐filled microbubble contrast agent: diagnostic performance and confidence. Radiology. 2004;232:420‐430. [DOI] [PubMed] [Google Scholar]
- 20. Beaton C, Cochlin D, Kumar N. Contrast enhanced ultrasound should be the initial radiological investigation to characterise focal liver lesions. Eur J Surg Oncol. 2010;36:43‐46. [DOI] [PubMed] [Google Scholar]
- 21. Catala V, Nicolau C, Vilana R, et al. Characterization of focal liver lesions: comparative study of contrast‐enhanced ultrasound versus spiral computed tomography. Eur Radiol. 2007;17:1066‐1073. [DOI] [PubMed] [Google Scholar]
- 22. Dai Y, Chen MH, Yin SS, et al. Focal liver lesions: can SonoVue‐enhanced ultrasound be used to differentiate malignant from benign lesions? Invest Radiol. 2007;42:596‐603. [DOI] [PubMed] [Google Scholar]
- 23. Dietrich CF, Maddalena ME, Cui XW, et al. Liver tumor characterization–review of the literature. Ultraschall Med. 2012;33:S3‐10. [DOI] [PubMed] [Google Scholar]
- 24. D'Onofrio M, Martone E, Faccioli N, et al. Focal liver lesions: sinusoidal phase of CEUS. Abdom Imaging. 2006;31:529‐536. [DOI] [PubMed] [Google Scholar]
- 25. D'Onofrio M, Rozzanigo U, Masinielli BM, et al. Hypoechoic focal liver lesions: characterization with contrast enhanced ultrasonography. J Clin Ultrasound. 2005;33:164‐172. [DOI] [PubMed] [Google Scholar]
- 26. Li R, Guo Y, Hua X, et al. Characterization of focal liver lesions: comparison of pulse‐inversion harmonic contrast‐enhanced sonography with contrast‐enhanced CT. J Clin Ultrasound. 2007;35:109‐117. [DOI] [PubMed] [Google Scholar]
- 27. Wilson SR, Burns PN. Microbubble‐enhanced US in body imaging: what role? Radiology. 2010;257:24‐39. [DOI] [PubMed] [Google Scholar]
- 28. Bohle W, Clemens PU, Heubach T, et al. Contrast‐enhanced ultrasound (CEUS) for differentiating between hepatocellular and cholangiocellular carcinoma. Ultraschall Med. 2012;33:E191‐E195. [DOI] [PubMed] [Google Scholar]
- 29. Claudon M, Dietrich CF, Choi BI, et al. Guidelines and good clinical practice recommendations for contrast enhanced ultrasound (CEUS) ‐ update 2008. Ultraschall Med. 2008;29:28‐44. [DOI] [PubMed] [Google Scholar]
- 30. Zheng YL, Yin XY, Xie XY, et al. Value of contrast‐enhanced ultrasonography in assessing the vascularity of liver metastases: comparison with contrast‐enhanced computed tomography. J Ultrasound Med. 2010;29:1403‐1410. [DOI] [PubMed] [Google Scholar]
- 31. Bhayana D, Kim TK, Jang HJ, et al. Hypervascular liver masses on contrast‐enhanced ultrasound: the importance of washout. AJR Am J Roentgenol. 2010;194:977‐983. [DOI] [PubMed] [Google Scholar]
- 32. Ueda T, Starkey J, Mori K, et al. A pictorial review of benign hepatocellular nodular lesions: comprehensive radiological assessment incorporating the concept of anomalous portal tract syndrome. J Hepatobiliary Pancreat Sci. 2011;18:386‐396. [DOI] [PubMed] [Google Scholar]
- 33. Esfeh JM, Hajifathalian K, Ansari‐Gilani K. Sensitivity of ultrasound in detecting hepatocellular carcinoma in obese patients compared to explant pathology as the gold standard. Clin Mol Hepatol. 2019;26:54‐59. [DOI] [PMC free article] [PubMed] [Google Scholar]
- 34. Blechacz B, Gores GJ. Cholangiocarcinoma: advances in pathogenesis, diagnosis, and treatment. Hepatology. 2008;48:308‐321. [DOI] [PMC free article] [PubMed] [Google Scholar]
- 35. Palmer WC, Patel T. Are common factors involved in the pathogenesis of primary liver cancers? A meta‐analysis of risk factors for intrahepatic cholangiocarcinoma. J Hepatol. 2012;57:69‐76. [DOI] [PMC free article] [PubMed] [Google Scholar]
- 36. Shaib YH, El‐Serag HB, Nooka AK, et al. Risk factors for intrahepatic and extrahepatic cholangiocarcinoma: a hospital‐based case‐control study. Am J Gastroenterol. 2007;102:1016‐1021. [DOI] [PubMed] [Google Scholar]
- 37. Ekpanyapong S, Reddy KR. Infections in cirrhosis. Curr Treat Options Gastroenterol. 2019;17:254‐270. [DOI] [PMC free article] [PubMed] [Google Scholar]
- 38. Marinković D, Kukolj V, Aleksić‐Kovačević S, et al. The role of hepatic myofibroblasts in liver cirrhosis in fallow deer (Dama dama) naturally infected with giant liver fluke (Fascioloides magna). BMC Vet Res. 2013;9:45. [DOI] [PMC free article] [PubMed] [Google Scholar]
- 39. Lleo A, Marzorati S, Anaya JM, et al. Primary biliary cholangitis: a comprehensive overview. Hepatol Int. 2017;11:485‐499. [DOI] [PubMed] [Google Scholar]
- 40. Wyler DJ. Schistosomes, fibroblasts, and growth factors: how a worm causes liver scarring. New Biol. 1991;3:734‐740. [PubMed] [Google Scholar]
- 41. Vallin M, Sturm N, Lamblin G, et al. Unrecognized intrahepatic cholangiocarcinoma: an analysis of 993 adult cirrhotic liver explants. Clin Transplant. 2013;27:403‐409. [DOI] [PubMed] [Google Scholar]
- 42. Chalasani N, Baluyut A, Ismail A, et al. Cholangiocarcinoma in patients with primary sclerosing cholangitis: a multicenter case‐control study. Hepatology. 2000;31:7‐11. [DOI] [PubMed] [Google Scholar]
- 43. Watanapa P, Watanapa WB. Liver fluke‐associated cholangiocarcinoma. Br J Surg. 2002;89:962‐970. [DOI] [PubMed] [Google Scholar]
- 44. Clements O, Eliahoo J, Kim JU, et al. Risk factors for intrahepatic and extrahepatic cholangiocarcinoma: a systematic review and meta‐analysis. J Hepatol. 2020;72:95‐103. [DOI] [PubMed] [Google Scholar]
- 45. Bernard M, Marie I, Riachi G, et al. Inflammatory pseudotumor of the liver revealing gynecological Corynebacterium infection. Scand J Gastroenterol. 2005;40:875‐877. [DOI] [PubMed] [Google Scholar]
- 46. Diaz‐Torne C, Narváez J, De Lama E, et al. Inflammatory pseudotumor of the liver associated with rheumatoid arthritis. Arthritis Rheum. 2007;57:1102‐1106. [DOI] [PubMed] [Google Scholar]
- 47. Keynan Y, Karlowsky JA, Walus T, et al. Pyogenic liver abscess caused by hypermucoviscous Klebsiella pneumoniae. Scand J Infect Dis. 2007;39:828‐830. [DOI] [PubMed] [Google Scholar]
- 48. Wang J, Yan Y, Xue X, et al. Comparison of pyogenic liver abscesses caused by hypermucoviscous Klebsiella pneumoniae and non‐Klebsiella pneumoniae pathogens in Beijing: a retrospective analysis. J Int Med Res. 2013;41:1088‐1097. [DOI] [PubMed] [Google Scholar]
- 49. White JE, Chase CW, Kelley JE, et al. Inflammatory pseudotumor of the liver associated with extrahepatic infection. South Med J. 1997;90:23‐29. [DOI] [PubMed] [Google Scholar]
- 50. Park KS, Jang BK, Chung WJ, et al. Inflammatory pseudotumor of liver–a clinical review of 15 cases. Korean J Hepatol. 2006;12:429‐438. [PubMed] [Google Scholar]
- 51. Liu J, Yu Z, Sun M, et al. Identification of cancer/testis antigen 2 gene as a potential hepatocellular carcinoma therapeutic target by hub gene screening with topological analysis. Oncol Lett. 2019;18:4778‐4788. [DOI] [PMC free article] [PubMed] [Google Scholar]
- 52. Jiexian J, Xiaoqin X, Lili D, et al. Clinical assessment and prognostic evaluation of tumor markers in patients with gastric cancer. Int J Biol Markers. 2013;28:192‐200. [DOI] [PubMed] [Google Scholar]
- 53. Kouri M, Pyrhonen S, Kuusela P. Elevated CA19‐9 as the most significant prognostic factor in advanced colorectal carcinoma. J Surg Oncol. 1992;49:78‐85. [DOI] [PubMed] [Google Scholar]
- 54. Li CG, Huang XE, Xu L, et al. Clinical application of serum tumor associated material (TAM) from non‐small cell lung cancer patients. Asian Pac J Cancer Prev. 2012;13:301‐304. [DOI] [PubMed] [Google Scholar]
- 55. Yedema CA, Kenemans P, Wobbes T, et al. Use of serum tumor markers in the differential diagnosis between ovarian and colorectal adenocarcinomas. Tumour Biol. 1992;13:18‐26. [DOI] [PubMed] [Google Scholar]