

Abstract
Background
Atopic dermatitis (AD) is an inflammatory disease with diverse clinical features. Although AD is diagnosed mainly by clinical features, the laboratory abnormalities can be found in most patients and may be of diagnostic value. However, few studies have been performed on the clinical significance of laboratory abnormalities in adult and adolescent AD.
Methods
Adult and adolescent patients with AD were included in this study. The questionnaire and dermatological examination were completed by investigators. Laboratory tests included complete blood count, serum total IgE, and allergen‐specific IgE.
Results
A total of 473 patients were recruited and 396 of them were diagnosed as AD. Increased serum total IgE level, peripheral eosinophils, and basophils were seen more frequently in AD patients than in non‐AD patients (P < .05). Positive aeroallergens were seen more in AD patients than in non‐AD patients (P < .05). Both total serum IgE level (R = .286, P < .001) and peripheral eosinophils (R = .444, P < .001) significantly correlated with EASI score. Serum total IgE level and extrinsic type AD decreased with age. Patients with elevated serum total IgE are more likely to have a personal history of atopic diseases (P = .014). AD‐associated symptoms (such as flexural dermatitis, white dermographism, and anterior neck folds) are more frequently observed in AD patients with high serum IgE or eosinophilia (P < .05).
Conclusion
The serum total IgE level, allergen‐specific IgE, peripheral eosinophils, and basophils are important for the diagnosis of AD. And they are associated with the severity, age groups, and clinical manifestations.
Keywords: atopic dermatitis, basophils, clinical features, eosinophils, IgE
1. INTRODUCTION
Atopic dermatitis (AD) is an inflammatory skin disease characterized by chronic recurrent dermatitis with profound pruritus. Patients with AD often have personal or family history of atopic diseases such as asthma, allergic rhinitis, and allergic conjunctivitis.1
AD used to be diagnosed by explicit criteria that require information obtained from patient's history and physical examination according to different criteria.2, 3, 4 However, Liu et al5 reported that peripheral eosinophil and serum total IgE were also important in the diagnosis of AD. Elevation total serum IgE level, positive allergen‐specific IgE, eosinophilia, and basophilia were common in AD. Studies have suggested a significant association between the severity of AD and systemic measures of allergic inflammation including serum IgE and blood eosinophil in infant and children patients. However, few studies were finished in adolescent or adult patients.
The clinical manifestations of AD are heterogeneous. Three stages are proposed including infantile AD, childhood AD, and adolescent/adult AD.6 Typical clinical presentations are similar in all the stages such as head and neck dermatitis and xerosis. However, some clinical features of AD are more specific to adults, including lichenification and prurigo. Nummular eczema, xerotic eczema, eczema of the hands, and feet are considered as special forms of AD.7 Few studies focused on the relationship between clinical characteristics and laboratory findings.
2. MATERIALS AND METHODS
2.1. Patients
A total of 396 adult/adolescent patients with AD (201 female and 195 male) and 77 non‐AD patients were recruited. No significant difference in the median age and gender ratio between the groups was found. The informed consents were obtained from each patient. The diagnosis of AD was based on the Chinese criteria of AD.5 All patients were at an active stage of the disease, before the administration of systemic treatment. Atopic disorders or other inflammatory skin diseases were excluded in all healthy controls. The severity of AD was assessed by the eczema area and severity index (EASI) score at the first visit. Mild severity was defined as an EASI score of <7, moderate severity as ≥7 and <21, and severe AD as ≥21.
2.2. Questionnaire and dermatological examination
The patients were required to complete the questionnaire included demographic characteristics, atopic history (allergic rhinitis, allergic conjunctivitis, and allergic asthma), and family history. The patients also received a dermatological examination.
2.3. Laboratory tests
The complete blood count, serum total IgE, and allergen‐specific IgE were measured in each patient. Specific IgE antibody to aeroallergens and food allergens was measured in 226 AD patients and 65 non‐AD patients. Food allergen–specific IgE antibody detection kit was used for allergen detection, including D. pteronyssinus, artemisia, mixture of epithelia, mixed molds, pellitory, willow, poplar, egg, milk, shrimp, mutton, beef, fish, crab, and staple foods (including wheat and corn).
2.4. Statistical analysis
All the data were input using Epidata 3.1 software and analyzed by SPSS 22.0. Chi‐square, Mann‐Whitney U tests, and Kruskal‐Wallis test were used for non‐normally distributed variables. Simple linear regression analysis and Spearman's correlation index were applied to describe the correlation between measurement data. P < .05 was considered significant.
3. RESULTS
3.1. Laboratory findings in AD and non‐AD patients
The laboratory findings in AD and non‐AD patients are shown in Tables 1 and 2. Serum total IgE (62.6% vs 19.5%, P < .001), eosinophilia (36.9% vs 15.6%, P < .001), and basophilia (13.9% vs 5.2%, P = .037) in AD patients were significantly higher than in non‐AD patients. The prevalence of positive IgE to aeroallergens was higher in AD patients than in non‐AD patients (39.8% vs 24.6%, P = .028). A higher prevalence of positive IgE for D. pteronyssinus was found in AD patients than in non‐AD patients (25.3% vs 10.8%, P = .011). No significant difference was found for food allergens.
Table 1.
Comparison of laboratory findings in AD patients and non‐AD patients
| Laboratory tests | AD (n = 396) | Non‐AD (n = 77) | P value |
|---|---|---|---|
| Serum total IgE (IU/mL)a | MD: 187.7 | MD: 47.4 | <.001 |
| 25th: 56.0 | 25th: 19.3 | ||
| 75th: 722.0 | 75th: 132.5 | ||
| EOS (%)a | MD: 3.6 | MD: 2.9 | .022 |
| 25th: 1.9 | 25th: 1.6 | ||
| 75th: 6.7 | 75th: 5.1 | ||
| EOS count (*109/L)a | MD: 0.24 | MD: 0.18 | .011 |
| 25th: 0.12 | 25th: 0.10 | ||
| 75th: 0.45 | 75th: 0.37 | ||
| BAS (%)a | MD: 0.572 | MD: 0.581 | .383 |
| 25th: 0.400 | 25th: 0.400 | ||
| 75th: 0.800 | 75th: 0.700 | ||
| Serum total >100 IU/mL, n (%)b | 248 (62.6%) | 15 (19.5%) | <.001 |
| EOS% >5%, n (%)b | 146 (36.9%) | 12 (15.6%) | <.001 |
| EOS count >0.5 × 10⁹/L, n (%)b | 82 (20.7%) | 6 (7.8%) | .006 |
| BAS% >1%, n (%)b | 55 (13.9%) | 4 (5.2%) | .037 |
Abbreviations: MD, median values; 25th, 25th percentiles; 75th, 75th percentiles.
Mann‐Whitney U tests.
Pearson chi‐square test.
Table 2.
Allergen‐specific IgE in AD patients and non‐AD patients
| Allergens | AD (n = 226) | Non‐AD (n = 65) | P value | χ2 |
|---|---|---|---|---|
| Any positive allergens | 98 (43.4%) | 19 (29.2%) | .045 | 4.194 |
| Positive food allergens | 36 (15.9%) | 7 (10.8%) | .427 | 1.067 |
| Positive aeroallergens | 90 (39.8%) | 16 (24.6%) | .028 | 5.043 |
| D. pteronyssinus | 57 (25.3%) | 7 (10.8%) | .011 | 6.220 |
| Artemisia | 23 (10.2%) | 5 (7.7%) | .640 | 0.370 |
| Mixture of epithelia (cats and dogs) | 19 (8.4%) | 3 (4.6%) | .428 | 1.055 |
| Mixed molds | 21 (9.3%) | 6 (9.2%) | 1.000 | 0.001 |
| Pellitory | 6 (2.7%) | 1 (1.5%) | 1.000 | 0.273 |
| Willow | 9 (4.0%) | 2 (3.1%) | 1.000 | 0.118 |
Pearson chi‐square test was used.
3.2. Laboratory findings and AD severity
The relationship between serum total IgE, blood eosinophil and basophil count, and EASI score is shown in Table 3. The severity was stratified according to EASI scores as follows: mild <7 (n = 176), moderate ≥7 and <21 (n = 131), and severe ≥21 (n = 89). We found that serum total IgE (P = .025), blood eosinophil count (P < .001), EOS% (P < .001), and BAS% (P = .036) elevated significantly with severity. Linear regression analysis showed that the increased serum total IgE level and blood eosinophil count significantly associated with the EASI score (R = .286, R = .444, respectively, Figure 1).
Table 3.
Relationship between laboratory findings and severity of AD
| Laboratory tests | Mild (n = 176) | Moderate (n = 131) | Severe (n = 89) |
|---|---|---|---|
| Serum total IgE (IU/mL)a | MD: 139.4***, # | MD: 302.0 | MD: 356.0 |
| 25th: 51.7 | 25th: 54.3 | 25th: 81.1 | |
| 75th: 429.8 | 75th: 831.3 | 75th: 1576.5 | |
| EOS (%)a | MD: 2.8***, ### | MD: 4.5* | MD: 5.4 |
| 25th: 1.7 | 25th: 2.3 | 25th: 2.7 | |
| 75th: 4.6 | 75th: 7.1 | 75th: 12.7 | |
| EOS count (*109/L)a | MD: 0.19***, ### | MD: 0.27* | MD: 0.36 |
| 25th: 0.08 | 25th: 0.16 | 25th: 0.20 | |
| 75th: 0.31 | 75th: 0.46 | 75th: 0.88 | |
| BAS (%)a | MD: 0.5* | MD: 0.6 | MD: 0.6 |
| 25th: 0.3 | 25th: 0.4 | 25th: 0.5 | |
| 75th: 0.7 | 75th: 0.8 | 75th: 0.8 | |
| Serum total >100 IU/mL, n (%)b | 98 (55.7%)* | 86 (65.6%) | 64 (71.9%) |
| EOS%>5%, n (%)b | 34 (19.3%)***, ### | 60 (45.8%) | 52 (58.4%) |
| EOS count >0.5 × 10⁹/L, n (%)b | 15 (8.5%)***, ## | 27 (20.6%)*** | 40 (44.9%) |
| BAS% >1%, n (%)b | 24 (13.6%) | 18 (13.7%) | 13 (14.6%) |
Abbreviations: MD, median values; 25th, 25th percentiles; 75th, 75th percentiles.
Kruskal‐Wallis test.
Pearson chi‐square test.
P < .05 vs severe group.
P < .01 vs severe group.
P < .001 vs severe group.
P < .05 vs moderate group.
P < .01 vs moderate group.
P < .001 vs moderate group.
Figure 1.

Simple linear regression analysis and Spearman's correlation analysis between IgE, EOS%, and EASI score. A, Association between total serum IgE and EASI score (R = .286, P < .001). B, Association between eosinophil count and EASI score (R = .444, P < .001). EOS%: percentage of peripheral eosinophils. EASI, eczema area and severity index
3.3. Laboratory abnormalities in different age groups
The patients were divided into three different age groups: adolescence (12‐18 years old), adults (19‐60 years old), and seniors (>60 years old). No significant difference in severity was found between age groups. The serum total IgE level decreased significantly with age (P < .001, Figure 2A). No significant difference was found in peripheral eosinophils and basophils between age groups. The intrinsic AD was defined as a total IgE of <150 IU/mL and with no sensitization to allergens, whereas the extrinsic type was defined as a total IgE of >150 IU/mL or a positive sensitization to allergens. We found that the proportion of extrinsic AD decreased with age. The extrinsic AD was significantly higher in the adolescent group than in the senior group (90.2% and 73.9%, respectively, P = .029, Figure 2B).
Figure 2.
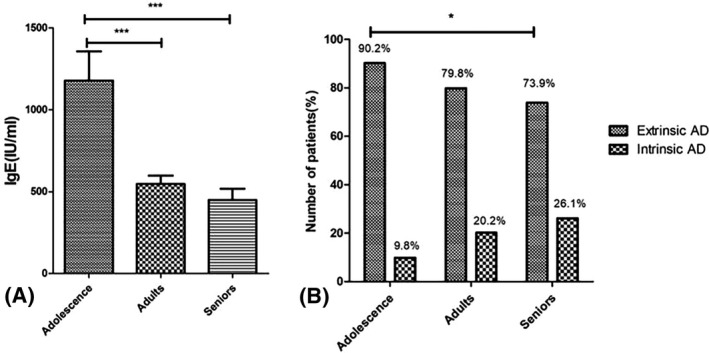
A, The mean value of total serum IgE in the adolescent group, adult group, and senior group was 1178.4, 546.8, and 449 IU/mL. Mann‐Whitney U test was used. ***P < .001. B, The proportion of extrinsic and intrinsic types according to different age groups. The intrinsic type was defined as a total IgE of <150 IU/mL and with no sensitization to allergens, whereas the extrinsic type was defined as a total IgE of >150 IU/mL or a positive sensitization to allergens. The age groups were defined as follows: adolescence >12 and ≤18 years old, adults >18 and ≤60 years old, and seniors >60 years old. Pearson chi‐square test was used. *P < .05
3.4. Association of serum total IgE and clinical features of AD
Table 4 shows the clinical features relevant to the diagnostic criteria and their association with serum total IgE levels. All the AD patients were divided into high serum IgE group (≥100 IU/mL) and low serum IgE group (<100 IU/mL). Flexural dermatitis (51.6% vs 35.8%, P = .002), anterior neck folds (17.3% vs 6.8%, P = .003), white dermographism (18.5% vs 9.5%, P = .023), and orbital darkening (12.9% vs 4.7%, P = .008) were significantly found more in high‐IgE group compared with low‐IgE group. Furthermore, patients with high‐IgE levels had higher personal atopic history than in those with normal IgE levels (64.5% vs 52.0%, P = .014, Table 5).
Table 4.
Clinical features in high‐IgE patients and low‐IgE patients
| Variables | Serum total IgE | P value | χ 2 | |
|---|---|---|---|---|
| ≥100 IU/mL (n = 248) | <100 IU/mL (n = 148) | |||
| Pruritus | 242 (97.6%) | 145 (98.0%) | .800 | 0.064 |
| Flexural dermatitis | 128 (51.6%) | 53 (35.8%) | .002 | 9.327 |
| Xerosis | 204 (82.3%) | 122 (82.4%) | 1.000 | 0.002 |
| Ichthyosis/palmar hyperlinearity/keratosis pilaris | 54 (21.8%) | 24 (12.6%) | .178 | 1.810 |
| Perifollicular accentuation | 41 (16.5%) | 24 (16.2%) | .935 | 0.007 |
| immediate skin test reactivity, RAST test positive | 79 (31.9%) | 42 (28.4%) | .467 | 0.528 |
| Tendency for cutaneous infections (especially Staphylococcus aureus and herpes simplex virus) | 50 (20.2%) | 27 (18.2%) | .641 | 0.218 |
| Tendency to nonspecific hand/foot dermatitis | 61 (24.6%) | 44 (29.7%) | .263 | 1.253 |
| Nipple eczema | 20 (8.1%) | 9 (6.1%) | .464 | 0.537 |
| Cheilitis | 48 (19.4%) | 21 (14.2%) | .190 | 1.719 |
| White dermographism | 46 (18.5%) | 14 (9.5%) | .023 | 7.505 |
| Facial pallor/facial erythema | 96 (38.7%) | 50 (33.8%) | .326 | 0.966 |
| Pityriasis alba | 23 (9.3%) | 6 (4.1%) | .054 | 3.721 |
| Itch when sweating | 143 (57.7%) | 84 (56.8%) | .860 | 0.031 |
| Intolerance to wool and lipid solvents | 86 (34.7%) | 50 (33.8%) | .856 | 0.033 |
| Food hypersensitivity | 91 (36.7%) | 43 (29.1%) | .120 | 2.416 |
| Recurrent conjunctivitis | 36 (14.5%) | 17 (11.5%) | .392 | 0.734 |
| Dennie‐Morgan infraorbital fold | 27 (10.9%) | 10 (6.8%) | .172 | 1.867 |
| Orbital darkening | 32 (12.9%) | 7 (4.7%) | .008 | 6.974 |
| Anterior neck folds | 43 (17.3%) | 10 (6.8%) | .003 | 8.953 |
| Keratoconus | 0 (0.0%) | 0 (0.0%) | — | — |
| Anterior subcapsular cataracts | 6 (2.4%) | 11 (7.4%) | .017 | 5.669 |
| Urticaria/angioedema | 67 (27.0%) | 32 (21.6%) | .230 | 1.439 |
| Nummular eczema | 65 (26.2%) | 35 (23.6%) | .570 | 0.322 |
| Periauricular eczema | 78 (31.5%) | 40 (27.0%) | .352 | 0.867 |
| Eyelid eczema | 58 (23.4%) | 27 (18.2%) | .228 | 1.455 |
| Scalp eczema/seborrheic dermatitis | 90 (36.3%) | 54 (36.5%) | .969 | 0.002 |
| Perineum eczema | 56 (22.6%) | 33 (22.3%) | .948 | 0.004 |
| Pompholyx of hand/foot | 32 (12.9%) | 25 (16.9%) | .274 | 1.197 |
Pearson chi‐square test was used.
Table 5.
Medical history in high‐IgE patients and low‐IgE patients
| Variables | Serum total IgE | P value | χ2 | |
|---|---|---|---|---|
| ≥100 IU/mL (n = 248) | <100 IU/mL (n = 148) | |||
| Eczema/AD before 2 years old | 95 (38.3%) | 44 (29.7%) | .084 | 2.993 |
| Eczema/AD before 12 years old | 101 (40.7%) | 46 (31.1%) | 3.694 | 0.055 |
| Personal history of atopic diseases (Eczema, AD, asthma or allergic rhinitis) | 160 (64.5%) | 77 (52.0%) | .014 | 6.016 |
| Family history of atopic diseases | 161 (64.9%) | 106 (71.6%) | .169 | 1.896 |
Pearson chi‐square test was used.
3.5. Association of peripheral eosinophils and clinical features of AD
Table 6 shows the association of clinical features and peripheral eosinophils. A total of 146 patients had eosinophilia (>5%), while 250 patients had normal peripheral eosinophils. We found that clinical features such as flexural dermatitis (53.4% vs 41.2%, P = .021), xerosis (89.0% vs 78.4%, P = .009), nipple eczema (11.0% vs 5.2%, P = .045), white dermographism (20.5% vs 12.0%, P = .029), facial pallor/facial erythema (44.5% vs 32.4%, P = .018), and anterior neck fold (19.2% vs 10.0%. P = .014) were seen more in patients with eosinophilia. No difference in personal and family atopic history was found between the two groups (57.5% vs 60.2% and 58.9% vs 72.4%, respectively, Table 7). In fact, patients with eosinophilia had a less frequent atopic personal and family history. History of periauricular eczema (38.4% vs 24.8%, P = .006), eyelid eczema (30.1% vs 16.4%, P = .002), and seborrheic dermatitis (45.2% vs 30.0%, P < .001) were found more frequently in patients with eosinophilia. No significant difference was found in clinical features and medical history in patients with or without basophilia (not shown in the table).
Table 6.
Clinical features in patients with or without eosinophilia
| Variables | EOS% | P value | χ2 | |
|---|---|---|---|---|
| ≥5% (n = 146) | <5% (n = 250) | |||
| Pruritus | 145 (99.3%) | 242 (98.6%) | .163 | 2.625 |
| Flexural dermatitis | 78 (53.4%) | 103 (41.2%) | .021 | 5.551 |
| Xerosis | 130 (89.0%) | 196 (78.4%) | .009 | 7.172 |
| Ichthyosis/palmar hyperlinearity/keratosis pilaris | 24 (16.4%) | 54 (21.6%) | .240 | 1.553 |
| Perifollicular accentuation | 22 (15.1%) | 43 (17.2%) | .674 | 0.305 |
| immediate skin test reactivity, RAST test positive | 47 (32.2%) | 74 (29.6%) | .651 | 0.292 |
| Tendency for cutaneous infections (especially Staphylococcus aureus and herpes simplex virus) | 26 (17.8%) | 51 (20.4%) | .599 | 0.395 |
| Tendency to nonspecific hand/foot dermatitis | 34 (23.3%) | 71 (28.4%) | .290 | 1.236 |
| Nipple eczema | 16 (11.0%) | 13 (5.2%) | .045 | 4.504 |
| Cheilitis | 26 (17.8%) | 43 (17.2%) | .891 | 0.024 |
| White dermographism | 30 (20.5%) | 30 (12.0%) | .029 | 5.239 |
| Facial pallor/facial erythema | 65 (44.5%) | 81 (32.4%) | .018 | 5.818 |
| Pityriasis alba | 14 (9.6%) | 15 (6.0%) | .230 | 1.749 |
| Itch when sweating | 87 (59.6%) | 140 (56.0%) | .528 | 0.485 |
| Intolerance to wool and lipid solvents | 57 (30.0%) | 79 (31.0%) | .154 | 2.263 |
| Food hypersensitivity | 53 (36.3%) | 81 (32.4%) | .443 | 0.627 |
| Recurrent conjunctivitis | 22 (15.1%) | 31 (12.4%) | .449 | 0.556 |
| Dennie‐Morgan infraorbital fold | 18 (12.3%) | 19 (17.6%) | .151 | 2.433 |
| Orbital darkening | 18 (12.3%) | 21 (8.4%) | .223 | 1.602 |
| Anterior neck folds | 28 (19.2%) | 25 (10.0%) | .014 | 6.698 |
| Keratoconus | 0 (0.0%) | 0 (0.0%) | — | — |
| Anterior subcapsular cataracts | 6 (4.1%) | 11 (4.4%) | 1.000 | 0.019 |
| Urticaria/angioedema | 28 (19.2%) | 64 (25.6%) | .205 | 3.165 |
| Nummular eczema | 37 (25.3%) | 58 (23.2%) | .877 | 0.263 |
| Periauricular eczema | 56 (38.4%) | 62 (24.8%) | .006 | 8.097 |
| Eyelid eczema | 44 (30.1%) | 41 (16.4%) | .002 | 10.318 |
| Scalp eczema/seborrheic dermatitis | 66 (45.2%) | 75 (30.0%) | .000 | 15.437 |
| Perineum eczema | 39 (26.7%) | 47 (18.8%) | .094 | 4.739 |
| Pompholyx of hand/foot | 20 (13.7%) | 34 (13.6%) | .561 | 1.157 |
Pearson chi‐square test was used.
Table 7.
Medical history in patients with or without eosinophilia
| Variables | EOS count% | P value | χ2 | |
|---|---|---|---|---|
| ≥5%(n = 146) | <5%(n = 250) | |||
| Eczema/AD before 2 years old | 49 (33.6%) | 90 (36.0%) | .663 | 0.241 |
| Eczema/AD before 12 years old | 55 (37.7%) | 92 (36.8%) | .914 | 0.030 |
| Personal history of atopic diseases (Eczema, AD, asthma, or allergic rhinitis) | 84 (57.5%) | 153 (61.2%) | .524 | 0.515 |
| Family history of atopic diseases | 86 (58.9%) | 181 (72.4%) | .008 | 7.643 |
Pearson chi‐square test was used.
4. DISCUSSION
Immunoglobulin E, eosinophils, and basophils are involved in the pathogenesis of atopic disease. IgE is a key molecule that can activate effector cells involved in allergic inflammation.8 In a case‐control study of 2201 East German schoolchildren, elevated serum total IgE levels were found in 75% children with AD.9 In our study, 62.6% of patients with AD were found to have elevated serum IgE levels, whereas only 19.5% in non‐AD group. Eosinophilia has been shown to be present in AD patients.10 Liu et al5 found that 31.8% of AD patients revealed eosinophilia (>5%). In our study, 36.9% of AD patients were found to have eosinophilia. However, the diagnostic importance of eosinophilia has been unclear since elevated blood eosinophils can be caused by other diseases such as parasite infection. And some AD patients may also have normal blood eosinophil levels. Basophils and mast cells are effector cells in an IgE‐dependent type Ⅰ hypersensitivity reaction in skin inflammation.11 In our study, we also found basophilia was more prevalent in AD patients than in non‐AD patients, which was rarely discussed in previous studies. The sensitization of aeroallergens was seen more in AD patients. However, no significant differences were found for food allergen sensitization between AD and non‐AD patients for adults in the present study. Previous studies have produced similar results. It was indicated12 that sensitization was predominate to foods initially, but then shifted toward inhalant allergens, as the AD patients became older. The occurrence of food allergy such as cow milk, egg, and peanut in children was called “Class Ⅰ food allergy.” The prevalence of “Class Ⅰ food allergy” decreased in adolescence and adult AD patients but the sensitization of aeroallergens remained unchanged.13 It was predicted that the prevalence of “Class Ⅰ food allergy” decreased due to their “self‐care behavior” as the increase with age. Adult patients might pay more attention to avoiding unconscious exposure to suspicious food allergens and thus avoiding the elevation of sIgE of allergens. However, it still needs to be further researched.
For the relationship between laboratory tests and the severity of AD, Kiiski et al14 reported that the total serum IgE level and specific IgE were significantly associated with the severity of AD. Clinical features of 5000 patients with AD in South Korea were studied, and a significant correlation between increased EASI scores and the total serum IgE levels was found.7 Our studies have produced similar results. We also found that eosinophils count was associated with the severity of AD. We found that basophil count in peripheral blood of severe AD patients was significantly higher than in mild AD patients (0.698% vs 0.591%, P < .05). The relationship between peripheral basophils and severity of AD is rarely discussed. Eosinophils contain granules that contain chemical mediators including major basic protein‐1 (MBP‐1), MBP‐2, eosinophil‐derived neurotoxin (EDN), and eosinophil cationic protein (ECP).15 They can induce tissue damage of target tissue and stimulate the recruitment of basophils, mast cells, and neutrophils. Activated eosinophils can produce a large number of cytokines and chemokines, such as IL‐16, IL‐12, TGF‐β1, and IL‐13, and play an important immunoregulatory role in the pathogenesis of AD.16
We also found that elevated serum total IgE level was less seen in elderly patients than in adolescent and adult patients (P < .01). Somani et al8 reported that 88% of the AD patients have elevated serum IgE levels with the highest IgE elevation seen in those between 10 and 20 years old.17 That is similar to our results. AD may be classified into two different types, extrinsic type and intrinsic type, which are also called allergic and non‐allergic types. The intrinsic type, or non‐allergic type, shows normal IgE levels in addition to the absence of any sensitization to allergens, whereas the extrinsic or allergic type has increased specific IgE levels with sensitization to specific allergens. The overall proportion of extrinsic type and intrinsic type were 79.8% and 20.2% in our patients, which was similar to that reported from Netherland18 (78.2% vs 21.8%) and Korea19 (80% vs 20%). Besides that, we also found that the number of AD patients with intrinsic type increased with age, reaching 9.8% in adolescence and 26.1% in seniors. In the previous study, children with AD were reported to have a high prevalence (about 80%) of sensitization to foods and a medium prevalence (about 40%) to aeroallergens.11 However, in our research sIgE prevalence in AD patients was 39.8% for aeroallergens and only 15.9% for food allergens, so food sensitization in adult patients was much lower than in children patients with AD. So it was predicted that sensitization to food allergens decreases with age, leading to the decrease in the proportion of the intrinsic types of AD.
We also found a significant difference in personal atopic history between high‐IgE group and low‐IgE group. Celakovska et al20 found that AD patients with elevated serum total IgE and food allergy suffer significantly more often from allergic rhinitis, bronchial asthma, and persistent eczematous lesions and have more positive personal or family history of atopic diseases. It indicates that serum total IgE as a key effector involved in allergic sensitization, contributing to the aggregation of several atopic diseases, thus contributing to high prevalence of personal atopic history.
In our study, the clinical differences in AD patients grouped by serum total IgE level and eosinophils count were also investigated. Flexural dermatitis, anterior neck folds, white dermographism, and orbital darkening were seen more in AD patients with elevated IgE. We also found that flexural dermatitis, xerosis, nipple eczema, white dermographism, facial pallor/facial erythema, anterior neck fold, periauricular eczema, eyelid eczema, and seborrheic dermatitis were seen more in patients with eosinophilia in our research. Direct evidence supporting the relationship between serum total IgE, eosinophil, and clinical features was scarce. However, EDN and ECP, released by activated eosinophils, were reported to play a role in the clinical phenotypes of AD. Kim et al21 found that EDN and ECD not only reflected the severity of AD, but also correlate with AD‐associated minor clinical features such as asthma, cheilitis, NS‐HFD (non‐specific hand or foot dermatitis), and scalp scale. The dysfunction of protein makes the skin more permeable to environmental allergens, which contribute to relevant symptoms such as xerosis, facial erythema, and anterior neck fold. In conclusion, we found that serum total IgE level and peripheral eosinophils count were seen more in AD patients and they correlated with clinical features of AD.
In conclusion, we considered that the serum total IgE, allergen‐specific IgE, blood eosinophil count, EOS%, and BAS% can be used in the diagnosis of AD. The serum total IgE, blood eosinophil count, and EOS% are related to the severity of disease. We also found a correlation in laboratory tests, medical history, and clinical features in AD patients. This analysis can lead to a better understanding of the clinical application of laboratory tests in AD.
CONFLICT OF INTEREST
The authors have no conflict of interest to declare.
Hu Y, Liu S, Liu P, Mu Z, Zhang J‐Z. Clinical relevance of eosinophils, basophils, serum total IgE level, allergen‐specific IgE, and clinical features in atopic dermatitis. J Clin Lab Anal. 2020;34:e23214 10.1002/jcla.23214
REFERENCES
- 1. Wollenberg A, Oranje A, Deleuran M, et al. ETFAD/EADV Eczema task force 2015 position paper on diagnosis and treatment of atopic dermatitis in adult and paediatric patients. J Eur Acad Dermatol Venereol. 2016;30(5):729‐747. [DOI] [PubMed] [Google Scholar]
- 2. Hanifin JM. Diagnostic criteria for atopic dermatitis: consider the context. Arch Dermatol. 1999;135(12):1551. [PubMed] [Google Scholar]
- 3. Williams HC. Clinical practice. Atopic dermatitis. N Engl J Med. 2005;352(22):2314‐2324. [DOI] [PubMed] [Google Scholar]
- 4. Aoki T, Yoshida H, Furue M, et al. English version of the concluding report published in 2001 by the Advisory Committee on Atopic Dermatitis Severity Classification Criteria of the Japanese Dermatological Association. J Dermatol. 2011;38(7):632‐644. [DOI] [PubMed] [Google Scholar]
- 5. Liu P, Zhao Y, Mu Z‐L, et al. Clinical features of adult/adolescent atopic dermatitis and Chinese criteria for atopic dermatitis. Chin Med J. 2016;129(7):757‐762. [DOI] [PMC free article] [PubMed] [Google Scholar]
- 6. Kanwar AJ. Adult‐onset atopic dermatitis. Indian J Dermatol. 2016;61(6):662‐663. [DOI] [PMC free article] [PubMed] [Google Scholar]
- 7. Silvestre Salvador JF, Romero‐Perez D, Encabo‐Duran B. Atopic dermatitis in adults: a diagnostic challenge. J Investig Allergol Clin Immunol. 2017;27(2):78‐88. [DOI] [PubMed] [Google Scholar]
- 8. Somani VK. A study of allergen‐specific IgE antibodies in Indian patients of atopic dermatitis. Indian J Dermatol Venereol Leprol. 2008;74(2):100‐104. [DOI] [PubMed] [Google Scholar]
- 9. Schafer T, Heinrich J, Wjst M, Adam H, Ring J, Wichmann HE. Association between severity of atopic eczema and degree of sensitization to aeroallergens in schoolchildren. J Allergy Clin Immun. 1999;104(6):1280‐1284. [DOI] [PubMed] [Google Scholar]
- 10. Leiferman KM. A role for eosinophils in atopic dermatitis. J Am Acad Dermatol. 2001;45(1 Suppl.):S21‐S24. [DOI] [PubMed] [Google Scholar]
- 11. Liu FT, Goodarzi H, Chen HY. IgE, mast cells, and eosinophils in atopic dermatitis. Clin Rev Allergy Immunol. 2011;41(3):298‐310. [DOI] [PubMed] [Google Scholar]
- 12. Osterballe M, Mortz CG, Hansen TK, Andersen KE, Bindslev‐Jensen C. The prevalence of food hypersensitivity in young adults. Pediatr Allergy Immunol. 2009;20(7):686‐692. [DOI] [PubMed] [Google Scholar]
- 13. Mastrorilli C, Caffarelli C, Hoffmann‐Sommergruber K. Food allergy and atopic dermatitis: prediction, progression, and prevention. Pediatr Allergy Immunol. 2017;28(8):831‐840. [DOI] [PubMed] [Google Scholar]
- 14. Kiiski V, Karlsson O, Remitz A, Reitamo S. High serum total IgE predicts poor long‐term outcome in atopic dermatitis. Acta Derm Venereol. 2015;95(8):943‐947. [DOI] [PubMed] [Google Scholar]
- 15. Elovic A, Wong DT, Weller PF, Matossian K, Galli SJ. Expression of transforming growth factors‐alpha and beta 1 messenger RNA and product by eosinophils in nasal polyps. J Allergy Clin Immunol. 1994;93(5):864‐869. [DOI] [PubMed] [Google Scholar]
- 16. Phipps S, Ying S, Wangoo A, Ong YE, Levi‐Schaffer F, Kay AB. The relationship between allergen‐induced tissue eosinophilia and markers of repair and remodeling in human atopic skin. J Immunol. 2002;169(8):4604‐4612. [DOI] [PubMed] [Google Scholar]
- 17. Chu H, Shin JU, Park CO, Lee H, Lee J, Lee KH. Clinical diversity of atopic dermatitis: a review of 5,000 patients at a Single Institute. Allergy Asthma Immun. 2017;9(2):158‐168. [DOI] [PMC free article] [PubMed] [Google Scholar]
- 18. Brenninkmeijer EEA, Spuls PI, Legierse CM, Lindeboom R, Smitt JHS, Bos JD. Clinical differences between atopic and atopiform dermatitis. J Am Acad Dermatol. 2008;58(3):407‐414. [DOI] [PubMed] [Google Scholar]
- 19. Choi SJ, Song MG, Sung WT, et al. Comparison of transepidermal water loss, capacitance and pH values in the skin between intrinsic and extrinsic atopic dermatitis patients. J Korean Med Sci. 2003;18(1):93‐96. [DOI] [PMC free article] [PubMed] [Google Scholar]
- 20. Celakovska J, Bukac J. Analysis of food allergy in atopic dermatitis patients ‐ association with concomitant allergic diseases. Indian J Dermatol. 2014;59(5):445‐450. [DOI] [PMC free article] [PubMed] [Google Scholar]
- 21. Kim M, Yoo J, Kim J, et al. Association of FLG single nucleotide variations with clinical phenotypes of atopic dermatitis. PLoS ONE. 2017;12(12):e0190077. [DOI] [PMC free article] [PubMed] [Google Scholar]