

Abstract
Distance-dependent magnetic resonance tuning (MRET) technology enables the sensing and quantitative imaging of biological targets in vivo, with the advantage of deep tissue penetration and less interactions with the surroundings as compared to fluorescence-based Förster resonance energy transfer (FRET). However, applications of MRET technology in vivo are currently limited by the moderate contrast enhancement and stability of T1-based MRET probes. Here we report a new two-way magnetic resonance tuning (t-MRET) nanoprobe with dually activatable T1 and T2 magnetic resonance signals that is coupled with dual-contrast enhanced subtraction imaging (DESI). This integrated platform achieves substantially improved contrast enhancement with minimal background signal and can be used to quantitatively image molecular targets in tumours and to sensitively detect very small intracranial brain tumours in patient-derived xenograft models. The high tumour-to-normal tissue ratio offered by t-MRET in combination with DESI provides new opportunities for molecular diagnostics and image-guided biomedical applications.
Nanometer-scale distance-dependent physical processes have significantly advanced the fundamental understanding of living systems and facilitated the development of new molecular medicines for better patient care.1–5 Förster resonance energy transfer (FRET) is one of such physical process, which is highly sensitive to investigate biological phenomena that produce changes in molecular proximity.6–10 However, FRET suffers from low and fluctuating signal intensities from single fluorophores and short observation times due to photobleaching. Nanoplasmonic techniques use distance variations between noble metals to generate a surface plasmon resonance (SPR) absorption wavelength shift and subsequent colour changes.11 Such techniques can overcome the limitations of organic fluorophores and provide a fast and convenient platform for mapping biological activities.11, 12 However, together with FRET, the broad applications of these optical techniques may be hampered by their intrinsic low tissue penetration and undesirable photon interactions with the complicated biological environments in the body.13 Cheon et al. reported the pioneering work on magnetism-based nanoscale distance-dependent magnetic resonance tuning (MRET). MRET opens new possibilities for non-invasive investigation of biological processes because magnetic resonance imaging (MRI) can provide high-resolution functional and anatomical imaging without being limited by the tissue penetration depth.13 In MRET, T1 relaxation is modulated by controlling the distance between a paramagnetic T1 enhancer and a superparamagnetic quencher. However, the use of T1 contrast agents in MRET can be compromised by low sensitivity and intrinsic low MR relaxivity. The first MRET probes were administrated intratumourally; however, the size, stability and surface properties of these probes need to be further optimized for broad in vivo application by using systemic injection (where these probes are exposed to the bloodstream). Furthermore, 1H MRI typically suffers from low contrast enhancement with high background noise from normal tissue, due to the interference from intrinsic 1H signals in the body.
Here we introduce a new two-way magnetic resonance tuning (t-MRET) nanotechnology with dually activatable T1&T2 signals. This method is designed to significantly improve the MR contrast and reliability as well as suppress the background signal of MRET. t-MRET nanotechnology is constructed by the concurrent encapsulation of a two-way MRET pair, a pheophorbide a-paramagnetic Mn2+ chelate (P-Mn) and a superparamagnetic iron oxide nanoparticle (SPIO), into a micelle with structure-dependent stability and stimuli-responsiveness ( Scheme 1). When the two-way MRET pair is “locked” closely within the micelle core, the T1&T2 MRI signal is turned “OFF”. Upon interaction with biological stimuli (the “key”), T1&T2 MRI signals are dually turned “ON” depending on the increased distance between Mn2+ and SPIO, which is controlled by the integrity of the micelles. Furthermore, a complementary post-imaging processing and reconstruction method named “dual-contrast enhanced subtraction imaging (DESI)” is introduced for better implementation of the dual T1&T2 MRI signal changes. We evaluated this t-MRET nanotechnology platform integrated with DESI for non-invasively and quantitatively imaging biological targets within the tumour, e.g. glutathione (GSH), the key sensing/imaging molecule for redox-responsive nano-platforms.15, 16 This strategy can be applied to different micellar nanostructures and engineered to respond to other biological markers, such as acidic tumour pH. The proposed t-MRET nanoprobe combined with the DESI technique is applied to detect very small intracranial tumours.
Scheme 1.

Schematic illustration of the t-MRET nanotechnology & dual-contrast enhanced subtraction imaging (DESI). Mn2+ conjugated to pheophorbide a serves as both an ‘enhancer’ in the T1 MRI signal and a ‘quencher’ in the T2 MRI signal, while the SPIO nanoparticle acts as an ‘enhancer’ in the T2 MRI signal and a ‘quencher’ in the T1 MRI signal.
Two-way magnetic resonance tuning and mechanisms
P-Mn was synthesized by chelating Mn2+ to Pa. The changes in optical behaviours of Pa suggested the successful synthesis of P-Mn (Supplementary Fig. 1).17–19 Then, P-Mn and SPIO (5 nm) were co-loaded into a disulfide cross-linked micelle (DCM), forming the t-MRET nanoprobes (DCM@P-Mn-SPIO). DCM@P-Mn-SPIO was ~81 nm in diameter (Fig. 1a) and showed a spherical nanostructure which evenly constrained a cluster of SPIOs (Fig. 1b). Upon the addition of reductive GSH (for disulfide bonds cleavage) and sodium dodecyl sulfate (SDS, for micelle disruption), DCM@P-Mn-SPIO disassembled from 81 nm to 12 nm (Fig. 1c), and the morphology changed to dispersed small-SPIOs (Fig. 1d). The DCM@P-Mn-SPIO exhibited a GSH concentration-dependent payload releasing profile (Fig. 1e). The payload release can also be triggered by adding GSH at a specific time (Fig. 1f). These results indicated that DCM@P-Mn-SPIO can be responsively dissociated by its molecular target, GSH.
Fig. 1. t-MRET nanoprobes and the T1/T2 dual-quenching properties as well as the mechanism.

a, Size distributions measured by dynamic light scattering and b, Transmission electron microscopy (TEM) micrograph of DCM@P-Mn-SPIO. c, Size distributions and d, TEM micrograph of disassembled DCM@P-Mn-SPIO treated with 20 mM GSH and 3 mg/mL SDS for 24 h. To observe changes in morphology, five experiments were repeated independently with similar results. e, The release profiles of pheophorbide a from DCM@P-Mn-SPIO in the presence of different GSH concentrations (0, 5, 10, 20 mM). Values are reported as mean ± s.d. (n=3). f, GSH-responsive release profiles (n=3) of Pa from DCM@P-Mn-SPIO upon the delayed addition of GSH (20 mM) at 4 h. Values are reported as mean ± s.d. (n=3). g, T1WI and the colour-coded T1 map and h, T2WI and the colour-coded T2 map of DCM@P-Mn-SPIO before and after the payload release (triggered by GSH). The changes in i, 1/T1 values (Δ1/T1) and j, 1/T2 values (Δ1/T2) of DCM@P-Mn-SPIO at different concentrations before and after incubation with GSH (0, 5, 10, 20 mM) and SDS. The changes in k, 1/T1 values (Δ1/T1) of DCM@P-Mn and l, 1/T2 values (Δ1/T2) of DCM@SPIO at different concentrations before and after incubation with GSH and SDS. m, T2 relaxivity values of free SPIO (75.04 mM−1s−1) and DCM@SPIO (88.97 mM−1s−1). n, Electron paramagnetic resonance (EPR) spectroscopy studies of DCM@P-Mn, DCM@SPIO, DCM@P-Mn-SPIO in the absence and presence of GSH and SDS. o, Magnetic moment of DCM@SPIO, DCM@P-Mn-SPIO and DCM@P-Mn-SPIO with SDS and GSH, measured over the same sample volume with background subtracted by vibrating-sample magnetometer (VSM). For the results in Fig. 1g to 1o, three experiments were repeated independently with similar results. To ensure the concentrations of all samples consistent, we added the same volume of water to other samples if SDS + GSH solution were introduced to one sample.
The nanoprobe with a particular ratio of P-Mn to SPIO (1:0.025, by mass) was chosen for the following studies because this ratio showed the most significant quenching and recovery in T1&T2 signals (Supplementary Fig. 2). Then, the T1&T2 dual-quenching effect of the t-MRET nanoprobes was explored. DCM@P-Mn with single T1 contrast and DCM@SPIO with single T2 contrast were employed as controls (Supplementary Fig. 3). For t-MRET nanoprobe, T1 weighted imaging (T1WI) and a colour-coded T1 map both showed obvious T1 quenching effects (Fig. 1g) when compared to that of DCM@P-Mn (Cont.) at an identical concentration of P-Mn (0.1 mM). A similar MR quenching phenomenon in T2 weighted imaging (T2WI) and T2 maps was also observed (Fig. 1h). When the T1 and T2 contrast agents were co-loaded in DCM@P-Mn-SPIO, T1 relaxivity (r1) reduced significantly to 1.23 mM−1s−1, and T2 relaxivity (r2) decreased dramatically to 11.7 mM−1s−1 (Supplementary Table 1). By comparison, DCM@P-Mn showed an r1 of 5.2 mM−1s−1 and the r2 of DCM@SPIO was 88.8 mM−1s−1 (Supplementary Fig. 4, Supplementary Table 2). The changes of r1 and r2 further confirmed that dual T1&T2 quench of t-MRET nanoprobe. We then investigated the dual T1&T2 signal recovery of the t-MRET nanoprobe. When the t-MRET nanoprobe was dissociated, its T1&T2 signal was recovered as the distance between P-Mn and SPIO increased (Fig. 1i and 1j). T1&T2 signal recovery of DCM@P-Mn-SPIO was dependent on GSH concentration. In contrast, DCM@P-Mn and DCM@SPIO did not exhibit “ON” and “OFF” switchable MR signals corresponding to the integrity of the nanoprobes (Fig. 1k and 1l).
The mechanisms of T1 and T2 quenching in t-MRET nanoprobe were investigated. There have been extensive reports on the quenching effect of T1 relaxivity by strong magnetization of T2 contrast materials such as SPIO.13, 20, 21 The T2 quenching effect, however, is poorly understood. We found that R2 of DCM@SPIO increased slightly compared to disperse SPIO nanoparticles (Fig. 1m and Supplementary Fig. 5), which ruled out the possibility that T2 quenching was induced by SPIO aggregation.22 We then proposed two possible mechanisms underlying the T2 quenching effect. Firstly, the dipole field experienced by water from the DCM@P-Mn-SPIO can be approximated as the sum of the fields from SPIO and P-Mn. The SPIO possesses an average magnetic dipole field along the magnetic field direction, while P-Mn was measured to be strongly diamagnetic either when encapsulated in the DCM or when released (Supplementary Fig. 6); P-Mn is composed of a diamagnetic Pa and a paramagnetic Mn2+, the latter makes it an effective T1 contrast agent (inset of Supplementary Fig. 6). For a range of magnetic fields and P-Mn to SPIO ratios, the net field components can match the diamagnetic field from the surrounding water. This would make the micelle “invisible” to the protons and thus quench the T2 relaxation, although in practice achieving an exact cancelation is unlikely. Secondly, attaching molecules to the surface of SPIO has been reported to decrease the net moment of the particle.23 It is known that Mn and Fe have a negative exchange interaction which results in a non-collinear antiferromagnetic configuration in their binary alloy.24 In this case, the Mn2+ in P-Mn may interact with SPIO, reducing the net moment of SPIO. Both mechanisms result in a reduced effective magnetic moment of DCM@P-Mn-SPIO, suppressing the dipole fields. These weakened dipole fields would extend the transverse relaxation time of surrounding water protons, resulting in an increase in T2 relaxation time. Once the DCM@P-Mn-SPIO is treated with GSH+SDS, the P-Mn and SPIO become dispersed and both mechanisms cease, and the T2 contrast would recover (Fig. 1h).
In support of these hypotheses, electron paramagnetic resonance (EPR) and magnetic measurements were performed. In EPR spectra (Fig. 1n), DCM@P-Mn showed a typical EPR spectrum of Mn ion25 while DCM@SPIO exhibited the characteristic peaks of SPIO26. Interestingly, the characteristic peaks of both Mn2+ and SPIO dramatically decreased, but can be recovered when t-MRET nanoprobe is broken down (Supplementary Fig. 7). These results indicate that some electrons in DCM@P-Mn-SPIO are no-longer free to rotate, potentially being constrained by the magnetic coupling proposed in the second mechanism; The magnetic measurement (Fig. 1o) showed a reduction in the magnetization upon encapsulation, and subsequent recovery after GSH+SDS treatment. These results are consistent with the diamagnetic contribution reducing the dipole field from t-MRET nanoprobe (the first mechanism) and the Mn-ion inducing a non-collinear or antiferromagnetic spin texture in the SPIO (the second mechanism). The two mechanisms work synergistically to suppress the dipole fields from the DCM@P-Mn-SPIO and quench the T1 and T2 relaxivity (Fig. 2). T1 contrast agents help relax protons in the surrounding water through a fast spin fluctuation,15 while T2 relaxivity is mainly affected by the dipole-dipole interaction between water protons and SPIO or t-MRET nanoprobe when SPIO and P-Mn are encapsulated. In the “OFF” state, the dipole field from the nanoprobe is small, making it ineffective in reducing the transverse magnetization of water protons, resulting in a longer T2. Simultaneously, the T1 contrast agent has slow spin fluctuation due to the magnetic field from the T2 contrast agent (SPIO), and is thus also ineffective in relaxing water protons. In the “ON” (activated) state, Mn is decoupled from the SPIO and regains fast spin fluctuation, decreasing T1, and the SPIO recovers its magnetic moment, which helps relax surrounding water protons. This leads to enhancements in both T1 and T2 imaging after dispersion.
Fig. 2. Illustration of the mechanism of the T1 and T2 quenching and recovery in t-MRET nanoprobe.
The black circle denotes SPIO and the golden star denotes for P-Mn. The golden and green arrow on SPIO indicates magnetization. Different lengths represent the strength of magnetization. OFF state: T1 and T2 contrast agents are coloaded into DCM with specific concentration ratios. The spin fluctuation of T1 contrast agent is slowed, the effective magnetic field from T2 contrast agent is weakened and the diamagnetic field further reduces the effective dipole field. This leads to quenched T1 and T2 relaxation rate. ON state: T1 and T2 contrast agents are separated. The fast spin fluctuation of T1 contrast agent and strong magnetic field from T2 contrast agent relaxes water protons effectively. This leads to enhanced T1 and T2 relaxation rate. The black arrow on the golden star represents the paramagnetic contribution from Mn ion, while the blue arrow on the golden star represents the total magnetic contribution from paramagnetic Mn ion and diamagnetic pheophorbide a.
Evaluation of the imaging platform in the biological system
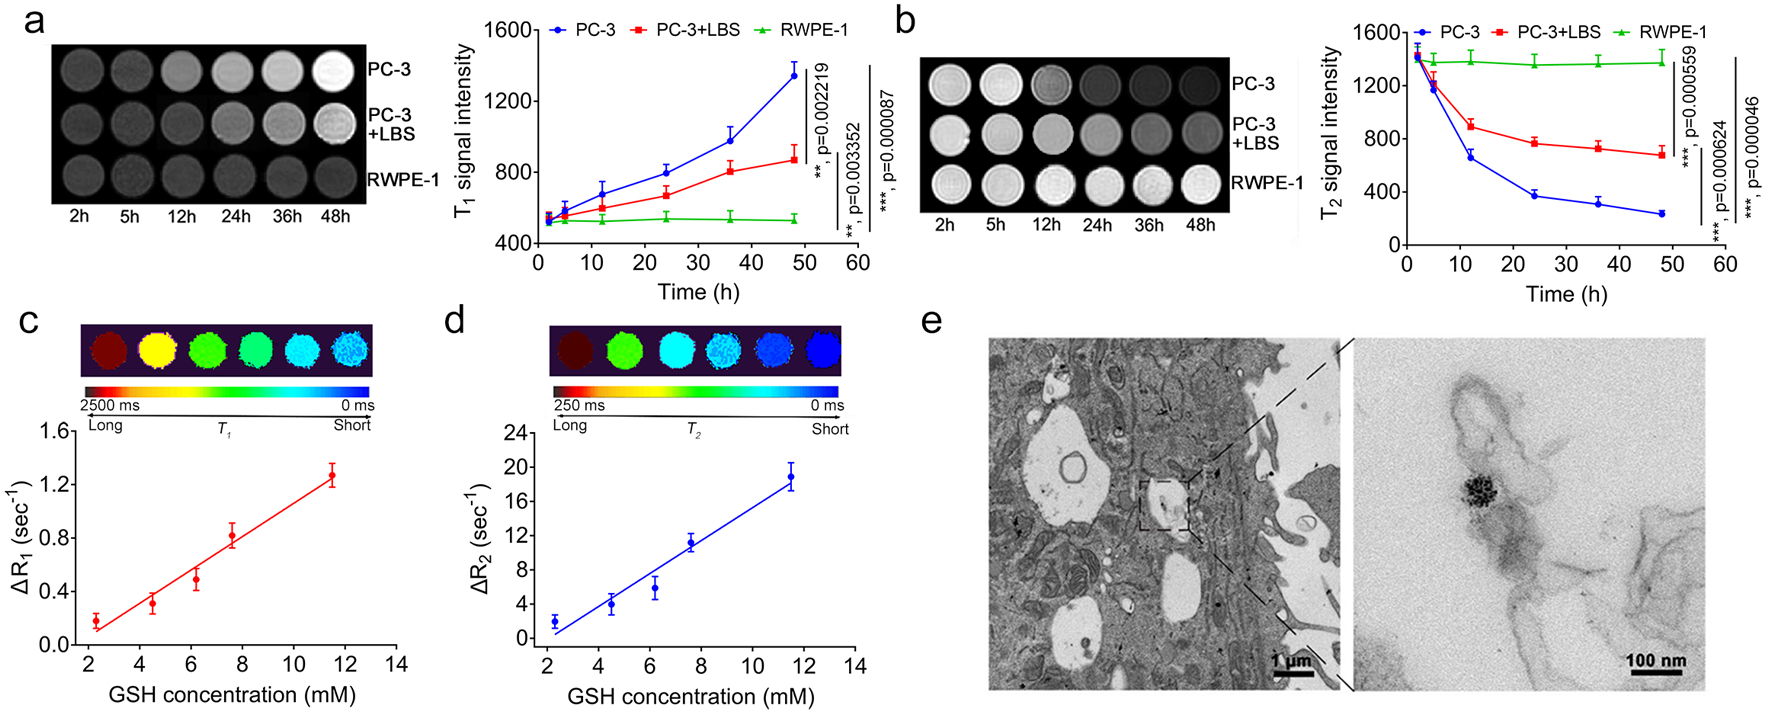
This stimuli-responsive t-MRET nanoplatform enabled accurate and quantitative imaging of biological targets. We have previously reported that DCM can retain its structural stability and minimize the payload release in blood circulation and allow for efficient release triggered by GSH at tumour sites.27–29 Firstly, t-MRET nanoprobe was proven to have good biocompatibility at the cellular level (Supplementary Fig. 8). Then, we incubated the t-MRET nanoprobes with PC-3 tumour cells, PC-3 cells treated with GSH inhibitor (L-Buthionine sulfoximine, LBS30, 31) and normal prostate cells (RWPE-1), and tested the T1&T2 signal recovery temporally. As shown in Fig. 3a and 3b, DCM@P-Mn-SPIO exhibited time-dependent activation of both T1 and T2 signals when incubated with PC-3 cells at a high GSH concentration (11.5 mM). Alternatively, DCM@P-Mn-SPIO did not show obvious T1&T2 signal recovery in RWPE-1 with a lower GSH level (1.89 mM). To verify if DCM@P-Mn-SPIO specifically responded to GSH, LBS was incubated with PC-3 cells to suppress the intracellular GSH level. The DCM@P-Mn-SPIO in the LBS treated PC-3 cells (GSH was measured as 2.3 mM) showed significantly less MR signal responsiveness than the normal PC-3 cells, indicating that GSH was the key factor for the activation of MR signals. In PC-3 cells with different concentrations of GSH (adjusted by LBS), the ΔR1 and ΔR2 increased linearly with the intracellular GSH level (Fig. 3c, 3d and Supplementary Table 3,), which offers the possibility for t-MRET nanoprobe to quantitatively measure GSH level in biological systems. In PC-3 cells, an obvious SPIO cluster was found inside of the cells by TEM (Fig. 3e), indicating that t-MRET nanoprobe is internalized by tumour cells.
Fig. 3. The dual-responsiveness of T1&T2 MR signals of DCM@P-Mn-SPIO compared to different levels of GSH in cells.

a, T1WI and b, T2WI and the corresponding quantitative analysis (n=3) of PC-3 cells treated without and with GSH inhibitor (LBS), incubated with DCM@P-Mn-SPIO at different time points. The normal prostate cells (RWPE-1) were employed as a control. c, T1 and d, T2 colour coded map and the changes in relaxation rate (△R1 and △R2) of DCM@P-Mn-SPIO in PC-3 cells treated with various concentrations of LBS (n=3). ΔR1 and ΔR2 (defined as the difference in the T1 or T2 relaxation rate (R1 = 1/T1) and T2 relaxation rate (R2 = 1/T2), respectively. The ΔR1 and ΔR2 of the t-MRET nanoprobe were measured to be 0.18, 0.31, 0.49, 0.82, 1.27 sec−1 (ΔR1) and 1.96, 3.97, 5.89, 11.20, 18.90 sec−1(ΔR2), respectively. The GSH concentrations in cells were measured by using ThiolTracker™ Violet (Glutathione Detection Reagent). e, TEM of PC-3 cells after 24 h incubation with DCM@P-Mn-SPIO. Three experiments were repeated independently with similar results. Curves are presented as mean ± s.d. Two-tailed Student’s t-test was employed for statistical analysis. **, p<0.01; ***, p<0.001.
We then quantitively investigated the correlation between intratumoural GSH level and MRI signal of t-MRET nanoprobe. The DCM@P-Mn-SPIO was i.v. injected into the tumour-bearing mice (Fig. 4a) for MRI analysis, the ΔR1 and ΔR2 increased linearly with the intratumoural GSH concentrations (Fig. 4b and 4c), indicating that the t-MRET nanoprobes are potentially useful for in vivo quantitative analysis of molecular target, such as GSH, in a non-invasive manner.
Fig. 4. The relationship between the MRI relaxation rates and the concentrations of the molecular target of t-MRET.

a, Quantitative MRI visualization of GSH in tumours (n=3) by using DCM@P-Mn-SPIO as a t-MERT nanoprobe. R1 and R2 mapped images of PC-3 tumour-bearing mice with different levels of GSH (6.15, 6.80, 8.10, 11.44 mM) quantitatively determined by using ThiolTracker™ Violet. Plot of b, △R1 and c, △R2 of tumours versus GSH concentration in tumours (n=3). The ΔR1 values at the tumour sites were measured to be 0.21, 0.27, 0.33, 0.37 sec−1 and the ΔR2 values were 5.26, 7.03, 9.79, 10.40 sec−1, corresponding to the concentrations of GSH from 6.15 to 11.44 mM. The △R1 and △R2 increased linearly with GSH concentration in the tumours. Pearson’s test was used for correlation analysis. Curves are presented as mean ± s.d.
We then evaluated the in vivo performance of t-MRET nanoprobes. DCM@P-Mn-SPIO, DCM@P-Mn and DCM@SPIO were i.v. administrated to PC-3 tumour-bearing mice, respectively. As shown in Fig. 5a, T1&T2 MRI contrast enhancements in the DCM@P-Mn-SPIO group were not distinguishable within 1 h but showed an obvious increase at 12 h. The contrast remained high for another 12 h, then decreased in 48 h. The T1 signal-to-noise ratios (SNRs) increased sharply after the administration of DCM@P-Mn-SPIO and gradually grew by 54.9% at 24 h post-injection, while the T2 SNR decreased 56.3%, correspondingly (Fig. 5b). In DCM@P-Mn and DCM@SPIO groups, the MRI contrast enhancement of tumours increased much faster than that of DCM@P-Mn-SPIO. The T1 or T2 MRI signal started to increase at 1 h and remained high at 12 h (Supplementary Fig. 9 and Fig. 10). T2 * imaging that solely depends on the SPIO contents could be considered as the baseline of SPIO accumulation, while T2 mapping not only depended on the SPIO accumulation but was also affected by the activation of the t-MRET pair. We then investigated the accumulation and activation of DCM@P-Mn-SPIO and DCM@SPIO by combining T2 and T2* MR sequences (Fig. 5c). R2* values showed no significant difference between the two groups, indicating the similar SPIO accumulation at the tumours sites (Fig. 5d). The R2 values (Fig. 5e) were significantly different between the two groups and reflected the initial T2 quenching of the DCM@P-Mn-SPIO (from 0 to 1 h) in response to GSH. These results indicated that the MRI signal enhancements of the t-MRET probe could be activated by the stimuli at the tumour site. The tumours and major organs were collected for H&E staining (Supplementary Fig. 11) and no obvious abnormities were observed.
Fig. 5. In vivo MRI of tumours using DCM@P-Mn-SPIO.

a, T1&T2WI of PC-3 tumour-bearing mice (n=3) after injection of DCM@P-Mn-SPIO. b, SNR and the applicable DESI area of DCM@P-Mn-SPIO in the tumour (n=3). The shaded area of the curves represents the effective T1 and T2 DESI area. c, The colour coded T2* and T2 map images of DCM@SPIO and DCM@P-Mn-SPIO. Three experiments were repeated independently with similar results. d, R2* and e, R2 of the tumours (n=3) treated by DCM@SPIO and DCM@P-Mn-SPIO at different timepoints. DESI subtraction images of f, DCM@P-Mn-SPIO, g, DCM@P-Mn and h, DCM@SPIO groups at 12 h after the probe administration. The scale bars are greyscale. The arrows point to the tumours. Three experiments were repeated independently with similar results. i, TNR of DCM@P-Mn-SPIO treated tumours (n=3). DCM@P-Mn and DCM@SPIO were employed as control groups. Curves or columns are presented as mean ± s.d. Two-tailed Student’s t-test was employed for statistical analysis. n.s., not significant; *, p<0.05; **, p<0.01.
Dual contrast-enhanced subtraction imaging technology
Furthermore, we developed a new dual-contrast enhanced subtraction imaging (DESI) technology as a post-imaging processing and reconstruction method to leverage the unique T1&T2 two-way magnetic resonance tuning property of t-MRET nanoprobes. DESI was carried out by subtraction of the positive T1 signal from the negative T2 signal that switched from “OFF” to “ON” to enhance MR contrast of targeted sites. We first investigated the feasibility of DESI in different model systems, such as aqueous solution, muscle of normal mice, cancer cell lines and tumour xenografts. In an aqueous solution, T1&T2 MRI signals of DCM@P-Mn-SPIO were detected at concentrations as low as 0.003 mM; further, the T1 signal intensity was always higher than the T2 signal intensity (Supplementary Fig. 12). When injected into the muscle of mice, a concentration of DCM@P-Mn-SPIO above 0.06 mM was comparable with DESI (Supplementary Fig. 13). In PC-3 cells, the T1 signal intensity of DCM@P-Mn-SPIO was greater than T2 intensity (Supplementary Fig. 14a). Alternatively, DCM@P-Mn-SPIO did not exhibit a higher T1 signal in PC-3 cells with LBS (Supplementary Fig. 14b) or in normal prostate cells (Supplementary Fig. 14c), due to their low GSH level. In mouse tumour model, the optimal time window for DESI was 12 h to 24 h (Fig. 5b). DESI was then applied to enhance the image contrast of the MR images in Fig. 5a. with the result in Fig. 5f and Supplementary Fig. 15. DESI was not applicable for processing images obtained with a single contrast agent. The DESI images acquired from DCM@P-Mn (Fig. 5g) and DCM@SPIO (Fig. 5h) treated mice only exhibited dim tumour outlines. The tumour-to-normal-tissue ratio (TNR) of DCM@P-Mn-SPIO dramatically higher than that of DCM@P-Mn and DCM@SPIO (Fig. 4i) based on DESI processing.
Diagnosis of small intracranial brain tumour
High TNRs are critical to the successful detection of early-stage cancer by imaging approaches.32, 33 The t-MRET nanoprobe was silent in blood circulation but visible within the tumor. The complementary DESI technology further suppressed the background signal and enhanced tumour contrast. This integrated imaging platform with t-MRET nanotechnology and DESI is expected to achieve the highest possible TNR, and is therefore particularly suitable for early cancer detection. We evaluated the capability of this platform to detect early-stage intracranial tumours in a patient-derived xenograft (PDX) mouse model of glioma (12FLR). In Fig. 6a, at 12 h after i.v. injection of DCM@P-Mn-SPIO, both T1 and T2 MR contrast in the intracranial tumour were enhanced significantly. T1 and T2 dynamic enhancements (Fig. 6d) from control groups elevated much faster than that of the t-MRET nanoprobe and reached a plateau within a short time (e.g. 1 h). The t-MRET nanoprobe showed a gradual increase in MR signal due to the GSH activation, and both R1 and R2 at tumour sites increased dramatically at 12 h post-injection (Supplementary Fig. 16a and 16b). Alternatively, DCM@P-Mn (Fig. 6b) and DCM@SPIO (Fig. 6c) enhanced the tumour MR signal at 1 h and 12 h post-injection (Supplementary Fig. 16c and 16d). The SNRs at tumour sites of DCM@P-Mn (Fig. 6e) and DCM@SPIO (Fig. 6f) treated mice started to increase at 1 h, indicating the single MRI signal was always” ON”. Then, we utilized the DESI technique to enhance the TNR of DCM@P-Mn-SPIO group. The subtraction imaging results showed that the signal of normal brain tissue could be dramatically reduced, further highlighting the tumour area (Fig. 6g and Supplementary Fig. 17). In the DCM@P-Mn and DCM@SPIO groups, the DESI technique was not applicable. The subtraction images showed a dim tumour outline in the brain (Fig. 6h, 6i and Supplementary Fig. 17). With DESI, the TNR of DCM@P-Mn-SPIO reached 11.6 while that of DCM@P-Mn and DCM@SPIO were 1.25 and 1.09, respectively (Fig. 6m), which demonstrated that t-MRET equipped with DESI can dramatically enhance the TNR. The H&E stained whole-brain sections confirmed the location of the tumours (Fig. 6j–l). In the DCM@P-Mn-SPIO group, the tumour size in the cerebrum was approximately 0.75 mm3 (Fig. 6j). Prussian blue stain (indicated ferric iron) confirmed that the iron containing nanoparticles, including DCM@P-Mn-SPIO (Fig. 6n) and DCM@SPIO (Fig. 6o), accumulated in orthotopic brain tumour tissue.
Fig. 6. In vivo applications of t-MRET probe with DESI technique on orthotopic brain tumours.

a, T1&T2 WI and T1&T2 mapped images of the mice (n=3) treated with DCM@P-Mn-SPIO. b, T1 WI and T1 mapped images of the mice (n=3) treated with DCM@P-Mn. c, T2 WI and T2 mapped images of the mice (n=3) treated with DCM@SPIO. d, T1&T2 SNR of DCM@P-Mn-SPIO mediated MRI of orthotopic brain tumour bearing mice (n=3). e, T1 SNR of DCM@P-Mn mediated MRI on orthotopic brain tumour-bearing mice (n=3). f, T2 SNR of DCM@SPIO mediated MRI on orthotopic brain tumour-bearing mice (n=3). g, DESI processing of the T1&T2WI in a). h, DESI processing of the T1WI in b). i, DESI processing of the T2WI in c). The scale bars are greyscale. Histopathology of the whole-brains of j, DCM@P-Mn-SPIO treated mice. k, DCM@P-Mn treated mice; l, DCM@SPIO treated mice. The scale bar is 1 mm. Three experiments were repeated independently with similar results. m, TNR of DCM@P-Mn-SPIO, DCM@P-Mn and DCM@SPIO treated tumours based on DESI (n=3). Prussian blue showed n, DCM@P-Mn-SPIO and o, DCM@SPIO accumulation in orthotopic brain tumour tissue. Scale bars are 50 μm. Columns are presented as mean ± s.d. Two-tailed Student’s t-test was employed for statistical analysis. **, p<0.01; ***, p<0.001.
To broaden the applications of the t-MRET technique, we also measured the t-MRET probe on a 3.0 T and 9.4 T MRI scanner, respectively. Supplementary Fig. 18 and 19 showed the T1 and T2 of DCM@P-Mn-SPIO can be quenched and readily recovered, supporting that the t-MRET system is stable and can be broadly applied to MRI scanners with different magnetic fields. This increases the potential for t-MRET nanotechnology to be translated into clinical use. To test if t-MRET technique is applicable to different nanocarriers and molecular targets, we developed two new probes that can realize the T1&T2 dual quench and recovery. First, an amphiphilic polymer (1,2-distearoyl-phosphatidylethanolamine-methyl-polyethylene glycol-2000, DSPE-PEG2000) was employed to encapsulate our t-MRET pair. The DSPE-PEG readily constrained the t-MRET pair in a spherical nanostructure (Supplementary Fig. 20a) and can be dissociated to smaller nanoparticles (Supplementary Fig. 20b). The R1 and R2 of DSPE-PEG@P-Mn-SPIO were quenched when the nanostructure was intact and recovered in the presence of SDS (Supplementary Fig. 20c and 20d), indicating that our t-MRET pair is applicable to other micellar systems which constrain the hydrophobic contrast agents tightly. We also developed a similar telodendritic nanocarriers (PEG5000-OH8-PPBA, POP), which could be responsively dissociated upon exposure to acidic pH. The chemical structure and characterization of POP were shown in Supplementary Fig. 21~23 and in Supplementary Fig. 24 and 25, respectively. The t-MRET pair was encapsulated into POP, forming a new pH-responsive t-MRET probe (POP@P-Mn-SPIO). The particle size changes (Fig. 7a and 7b) indicated that POP@P-Mn-SPIO can be broken down by acidic pH. The R1 (Fig. 7c) and R2 (Fig. 7d) of POP@P-Mn-SPIO can also be quenched and recovered upon acidic pH stimulation. In a PDX mouse model with intracranial glioma. The POP@P-Mn-SPIO detected ultra-small intracranial tumours with very high TNR (Fig. 7e to Fig. 7q and Supplementary Fig. 26). The T2* acquisition (Fig. 7r and 7s) supported that the initial T2 quenching and recovery of the POP@P-Mn-SPIO were caused by the MRI signal activation.
Fig. 7. Application of t-MRET nanotechnology and DESI on a pH responsive POP@P-Mn-SPIO.

The size distribution and morphology of a, POP@P-Mn-SPIO, b, POP@P-Mn-SPIO treated with acidic pH (5.5). In TEM micrograph, scale bars are 50 nm. Three experiments were repeated independently with similar results. c, R1 and d, R2 quenching behaviours of POP@P-Mn-SPIO (n=3). The R1 and R2 can be recovered by stimulating with acidic pH (5.5). e, T1&T2WI and T1&T2 mapped images of the mice (n=3) treated with POP@P-Mn-SPIO. f, T1WI and T1 mapped of the mice (n=3) treated with POP@P-Mn. g, T2WI and T2 mapped images of the mice (n=3) treated with POP@SPIO. h, T1&T2 SNR of POP@P-Mn-SPIO, i, T1 SNR of POP@P-Mn, j, T2 SNR of POP@SPIO mediated MRI of orthotopic brain tumour bearing mice (n=3). k, DESI processing of the T1&T2WI images in e). l, DESI of the T1WI in f). m, DESI processing of the T2WI in g). The scale bars are greyscale. Histopathology of the whole-brains of n, POP@P-Mn-SPIO treated mice. o, POP@P-Mn treated mice; p, POP@SPIO treated mice. The red arrows denote the orthotopic brain tumours. The scale bar is 1 mm. Three experiments were repeated independently with similar results. q, TNR of POP@P-Mn-SPIO treated tumours (n=3) based on DESI. POP@P-Mn and POP@SPIO were employed as control groups. r, R2 * and s, R2 of the tumours (n=3) treated by POP@SPIO and POP@P-Mn-SPIO at different timepoints. Two-tailed Student’s t-test was employed for statistical analysis. Columns are presented as mean ± s.d. n.s., not significantly; **, P<0.01.
Conclusions
We designed a unique t-MRET platform with a tailored DESI technique which makes MRI much more sensitive and selective than the conventional techniques used in cancer diagnosis. This is due to the following advantages: i) preferential tumour accumulation endows MRI with a high tumour selectivity; ii) activation by intrinsic tumour stimuli increases the TNR; iii) a dual-modal, subtraction-based, high sensitivity MRI for early-stage small lesions diagnosis; iv) the ultrahigh TNR may highlight the tumour margin to improve the accuracy of MRI-guided surgical procedures. We believe that our new imaging platform has great clinical potential for diagnosis of cancers and other diseases.
Methods
Materials.
Unless otherwise described, the solvents and chemicals were purchased from commercial sources and used without purification. The pheophorbide a (Catalog no. sc-264070B) was purchased from Santa Cruz Biotechnology, Inc. The SPIO (Catalog no. 700320–5mL) and Manganese (II) chloride (Catalog no. 244589–10G) were purchased from MilliporeSigma. The DSPE-PEG2000 was purchased from Laysan Bio Inc.
Synthesis of thiolated telodendrimers.
The synthesis of thiolated telodendrimers for making disulfide crosslinked micelles was well-established in our laboratory, and detailed synthesis procedures can be found in previous publications.34–37
Synthesis of PEG-OH8-PPBA telodendrimer.
(1) Synthesis of PEG-OH8
Synthesis of acetonide protected bis-MPA.
2 g of 2,2-Bis(hydroxymethyl)propionic acid (bis-MPA) (15 mmol), 280 μL of acetone dimethyl acetal (22.4 mmol) and 142 mg of p-toluenesulfonic acid (0.746 mmol) were dissolved in 10 mL of acetone in a 25 mL flask and the mixture was stirred for 6 h at room temperature. Then, 120 μL of triethylamine (0.88 mmol) was added to neutralize the residual acid. A white crystalline product was obtained after the solvent was moved by rotavap.
Synthesis of chlorination of acetonide-2,2-bis(methoxy) propanoic anhydride.
The acetonide-2,2-bis(methoxy) propanoic anhydride obtained as described above was chlorinated by refluxing in thionyl chloride. Chlorination of acetonide-2,2-bis(methoxy) propanoic anhydride was obtained as a colourless viscous liquid and used in the subsequent reaction immediately.
Synthesis of PEG-K.
500 mg of CH3O-PEG5000-NH2, 68 mg 6-Chloro-1-hydroxybenzotriazole (6-Cl-HOBT), 236 mg Fmoc-Lys (Fmoc)-OH and 62 μL diisopropylcarbodiimide (DIC) were dissolved in 5 mL DMF in a 10 mL flask and the mixture was stirred for 24 h at room temperature. Then, the mixture was precipitated in diethyl ether and the precipitate was dried under vacuum at room temperature for 24 h to obtain PEG-K-(Fmoc)2. Finally, 5 mL of piperidine (20% in DMF) was used to deprotect the Fmoc to get PEG-K with washing by ether three times.
Synthesis of PEG-K-bis-MPA.
PEG-K-(Fmoc)2 (200 mg, 0.039 mmol) was dissolved in 2 mL of dry DMF and stirred for 20 min. Acetonide-2,2-bis(methoxy) propanoic anhydride (Ac-MAP 54.34 mg, 0.312 mmol), DIC (48 μL) and Cl-HOBT (52.8 mg, 0.312 mmol) were added. The mixture was stirred at room temperature for 24 h. The flask was opened, and the product filtered off and precipitated in diethyl ether. The precipitate was dried under vacuum at room temperature for 24 h to obtain PEG-K-bis-MPA. Finally, the PEG-K-bis-MPA was dissolved in the Dowex H+/methanol mixture to get the PEG-OH4.
Synthesis of PEG-OH8.
PEG-OH4 (1 g), Cl-2,2-bis(methoxy) propanoic acid (290 mg) and DMAP (0.2 equivalent mass) were dissolved in 15 mL dichloromethane (DCM). The mixture was stirred in an ice bath for 1 h and reacted at room temperature for 24 h under N2 atmosphere protection. The product was filtered and precipitated in cold ether. The precipitate was dried under vacuum at room temperature for 24 h. Then, the reaction system was dissolved in the Dowex H+/methanol mixture to get PEG-OH8.
(2) Synthesis of porphyrin-PBA (PPBA).
Pheophorbide a (237 mg, 0.4 mmol), EDC (306.6 mg, 1.6 mmol) and NHS (184.0 mg, 1.6 mmol) were dissolved in 4 mL of anhydrous DMF and stirred for 20 min. Then the 3-aminophenylboronic acid monohydrate (248.0 mg, 1.6 mmol) was added into the solution. The mixture was stirred at room temperature for 24 h. The product was then filtered and extracted by water/DCM (2:1) for three times. The organic phase was added with 500 mg anhydrous sodium sulfate to remove the residual moisture and evaporated to obtain PPBA by rotavap.
(3) Preparation of PEG-OH8-PPBA (POP).
10 mg PEG-OH8 and 1 mg PPBA was dissolved in 2 mL MeOH and 2 mL DCM mixture solution and stirred under room temperature for 30 min. The POP monomer can be formed by coupling of PEG-OH8 and PPBA through boronate ester bonds.
Synthesis of Mn2+ chelated pheophorbide a (P-Mn).
Based on the method described in our publication19, pheophorbide a (59.3 mg, 100 μmol) and MnCl2 (63 mg, 500 μmol) were dissolved in a mixed solution of methanol (8 mL) and pyridine (0.8 mL). The reaction system was refluxed under 60 °C for 2 h. Free Mn2+ was removed by extraction (DCM against water). The P-Mn was dissolved in DCM, and the free Mn2+ was washed off by water. The P-Mn was then aliquoted and dried on a rotavapor.
Preparation of DCM@P-Mn-SPIO.
P-Mn, SPIO and thiolated telodendrimers (20 mg) were dissolved in tetrahydrofuran (200 μL), and dripped into 1 mL deionized water with vigorous stirring overnight at 37 °C. The ratios of P-Mn to SPIO were tuned from 1: 0.006, 1: 0.013, 1: 0.025 and 1: 0.05. After that, 4 μL of H2O2 was added to oxidize the thiol groups to form intra-micellar disulfide cross-linkages based on our published method.37 DCM@P-Mn with single T1 contrast and DCM@SPIO with single T2 contrast were prepared by using similar procedures with identical amounts of P-Mn or SPIO, respectively. For the following in vitro and in vivo studies, the ratio of P-Mn to SPIO in DCM@P-Mn-SPIO was fixed to 1: 0.025. The encapsulation efficiency (EE%) of P-Mn is 98.3% by measuring the UV absorbance of the free P-Mn. For the encapsulation of SPIO, it is technically difficult to isolate unloaded SPIO from DCM@P-Mn-SPIO, because both of them are nanoparticles. The SPIO that we employed is very hydrophobic (the stock was kept in toluene). When we encapsulated SPIO into DCM, we didn’t find any precipitations either by naked eyes or DLS measurements. Based on this evidence, we believe the encapsulation efficiency of SPIO is also very high and the actual ratio is close to its reaction ratio. Based on Supplementary Fig. 2, the T1 and T2 quench can be realized in different ratios between SPIO and P-Mn, which supported that our probe is with good reproducibility and can be made even with a little fluctuation of the ratios between SPIO and P-Mn. Therefore, we recommend making the DESI probe based on our reaction ratio of 1: 0.025 without further purification.
Preparation of DSPE-PEG@P-Mn-SPIO and POP@P-Mn-SPIO.
The preparation of these two nanoprobes followed the same procedures as the DCM@P-Mn-SPIO. Briefly, 20 mg of DSPE-PEG or POP, P-Mn and SPIO were dissolved in tetrahydrofuran (200 μL) and dripped into 1 mL deionized water with vigorous stirring overnight at 37 °C. The ratio between P-Mn and SPIO was set as 1:0.025.
Characterization of the t-MRET probes and the control probes with single contrast agents.
The t-MRET probes included DCM@P-Mn-SPIO, DSPE-PEG@P-Mn-SPIO and POP@P-Mn-SPIO; the probes with single contrast agents included DCM@P-Mn, DCM@SPIO, DSPE-PEG@P-Mn, DSPE-PEG@SPIO, POP@P-Mn and POP@SPIO. The size distributions of the nanoprobes (1.0 mg/mL) were measured by a dynamic light scattering instrument (DLS, Nano ZS, Malvern). The morphology was observed by transmission electron microscopy (TEM, Talos, L120c, FEI). The samples were made by directly dripping the aqueous nanoparticle solution (1.0 mg/mL) onto copper grids, and placed at room temperature to dry naturally. The UV-vis absorbance was measured by a UV-vis photospectrometer (UV-1800, Shimadzu), and the fluorescence spectra were obtained by fluorescence photospectrometer (RF6000, Shimadzu). For the optical measurement, including UV-vis and fluorescence spectra, the cuvette width was 1 cm.
GSH concentration-related MR relaxivity changes of DCM@P-Mn-SPIO, DCM@P-Mn and DCM@SPIO.
The R1 and R2 values of the DCM@P-Mn-SPIO were measured on a 7.0 T MRI Scanner (Bruker Biospec, USA) at 37 °C. Different concentrations of DCM@P-Mn-SPIO were treated with 100 μL GSH (0, 5, 10 and 20 mM) before MRI. In DCM@P-Mn-SPIO, the concentrations of Mn2+ varied from 0.1 to 0.6 mM, and SPIO from 2.5 to 15 mM. The R1 and R2 values of the DCM@P-Mn-SPIO were measured from 0 h to 24 h after incubation with GSH in the presence of SDS. The acquisition parameters were set as: T1WI: TR=200 ms, TE=15 ms, slice thickness=1 mm, slice spacing=1 mm. A 100-mm square field of view (FOV) was used with an image matrix of 256 × 256. T1 map images: TR=100–2000 ms, TE=14 ms, slice thickness=1 mm, slice spacing=1 mm. FOV= 10 × 10 cm, matrix = 256 × 256. T2WI: TR=1000 ms, TE=100 ms, slice thickness=1 mm, slice spacing=1 mm. A 100 cm2 FOV was used with an image matrix of 256 × 256. T2 map images: TR=1000 ms, TE=15–225 ms, slice thickness=1 mm, slice spacing=1 mm, FOV= 10 × 10 cm, matrix = 256 × 256. Quantitative T1 and T2 relaxation maps were reconstructed from datasets using Paravision 4 software. The same method was applied for the relaxivity calculation of DCM@P-Mn (0.1 to 0.6 mM, Mn2+) and DCM@SPIO (0.1 to 0.6 mM, SPIO).
Electron paramagnetic resonance spectroscopy (EPR).
The samples (DCM@SPIO, DCM@P-Mn, DCM@P-Mn-SPIO) for EPR characterization were prepared using the same procedures as described above, with the concentration of P-Mn of 1.5 mg/mL and SPIO of 0.0375 mg/mL. The X-band (9.43 GHz) continuous-wave (CW) EPR spectra were recorded on a Bruker (Billerica, MA) Biospin EleXsys E500 spectrometer equipped with a super-high Q resonator (ER4122SHQE). All CW-EPR data were acquired under non-saturating conditions and room temperature, with an excitation microwave frequency = 9.87 GHz, microwave power = 0.6325 mW, and modulation frequency = 100 kHz.
Vibrating sample magnetometry.
DCM@SPIO, DCM@P-Mn-SPIO, DCM@P-Mn-SPIO+SDS+GSH were prepared with 0.5 mg/mL P-Mn and 0.0125 mg/mL SPIO. In addition, we made reference samples without SPIO (DCM, DCM@P-Mn, DCM@P-Mn+SDS+GSH), whose concentrations were kept the same as the samples containing SPIO. The same volume of each type of sample was loaded into the same liquid sample holder with a cap from Lake Shore Cryotronics, filling it up to capacity before the measurement. The sample holder was sonicated by water and acetone and dried before changing samples. Thus, each sample had nominally the same amount of SPIO, due to the identical sample volume and concentration. Hysteresis loops were measured at room temperature using a vibrating sample magnetometer from Princeton Measurements Corporation. After measurements, we subtracted the background using the reference samples. For example, the SPIO signal shown in Fig. 1o was obtained by subtracting the measured signal of the DCM reference sample from DCM@SPIO, removing the background, including sample holder, water and the DCM from the measured signal. Similarly, DCM@P-Mn-SPIO, DCM@P-Mn-SPIO+SDS+GSH measurements were calibrated against DCM@P-Mn and DCM@P-Mn+SDS+GSH reference samples, respectively. Data from different samples were plotted together in the measured magnetic moment in Fig. 1o. Additionally, DCM@P-Mn was calibrated against a DCM reference sample.
Accumulated payload release of DCM@P-Mn-SPIO.
The DCM@P-Mn-SPIO solution was prepared to determine the payload release profile. The UV-vis absorbance of P-Mn was measured to determine the payload release. 1 mg/mL (0.5 mL) of DCM@P-Mn-SPIO PBS solutions with various GSH concentrations (0, 5, 10 and 20 mM) were injected into dialyzed cartridges (Pierce Chemical Inc.) with a 3.5 kDa MWCO. The cartridges were dialyzed against 2 L PBS at 37 °C. In the stimulus-responsive release experiment, GSH (20 mM) was added to the release medium at a specific time (4 h). The P-Mn concentrations that remained in the dialysis cartridge at various time points were calculated by the standard curve. The payload release was performed in triplicate samples to calculate the mean values.
Cell viability assay.
To evaluate the biocompatibility of DCM@P-Mn-SPIO, DCM@P-Mn, and DCM@SPIO, PC-3 prostate cancer cells were incubated with these nanoprobes and the cell viability was measured by MTT (methyl thiazolyl tetrazolium). PC-3 cells were seeded in 96-well plate with a density of 3×10⁵ cells per well, and incubated for 24 h (37 °C, 5% CO2) until all cells completely attached. Then different concentrations of DCM@P-Mn-SPIO, DCM@P-Mn and DCM@SPIO were added, (all probe concentrations were calculated based on DCM concentrations, which corresponded to 0, 0.1, 0.5, 1 and 5 mg/mL). After incubation for 24 h, the media was aspirated and 150 μL of dimethyl sulfoxide (DMSO) was added to dissolve the MTT crystal. Absorbance at 490 nm was measured by using a microplate reader (SpectraMax M3, USA) to assess cell viability.
In vitro MRI on PC-3 and RWPE-1 cells.
In vitro MRI was performed on PC-3 cells with and without GSH inhibitor (L-Buthionine sulfoximine, LBS30, 31) as well as on normal prostate cells (RWPE-1) (1×10⁶). The cells were incubated with DCM@P-Mn-SPIO (P-Mn concentration was 40 μg/mL, ) for 2 h, the cells were washed three times with PBS, then collected at various time point (2, 5, 12, 24, 36, 48 h) and fixed in agarose (1 mL, 1.0 %) in Eppendorf tubes. MRI was performed on a 7.0 T MR system. T1WI were obtained using the following parameters: TR/TE (250 ms/14 ms); T2WI: (1000 ms/100 ms), slice thickness =1 mm; slice spacing=1 mm; matrix =256 × 256; FOV =10 cm × 10 cm. The T1 and T2 signal intensities were measured within the region of interest (ROI).
In vitro MRI was further performed on PC-3 cells that were incubated with different concentrations of GSH inhibitor from 0 to 50 μM for 24 h. After incubation with P-Mn (40 μg/mL) for 2 h, cells were washed three times with PBS, cells were digested with 0.25% trypsin at different time points (2, 5, 12, 24, 36, 48 h), centrifuged for 3 min, and resuspended in agarose (1 mL, 1.0 %) in Eppendorf tubes. MR imaging was performed on a 7.0 T MR system. T1 map images: TR=100–2000 ms, TE=14 ms, slice thickness=1 mm, slice spacing=1 mm. FOV= 10 × 10 cm, matrix = 256 × 256. T2 map images: TR=1000 ms, TE=15–225 ms, slice thickness=1 mm, slice spacing=1 mm. A 10 cm × 10 cm FOV was used with an image matrix of 256 × 256.
Cell uptake of DCM@P-Mn-SPIO evaluated by TEM.
The cellular uptake of DCM@P-Mn-SPIO was further evaluated by TEM (Talos, L120c, FEI) with an accelerating voltage of 80 kV. In brief, the cells were seeded at a density of 1×10⁵ cells per well into an 8-well permanox slide for 24 h, reaching confluency of 80%. Then the cells were treated with DCM@P-Mn-SPIO for 2 h at 37°C. The embedded cells were sectioned (75 nm) and mounted onto 200-mesh copper grids after washing with phosphate buffer.
Tumour xenograft and orthotopic tumour animal models.
Nude mice, 4–5 weeks of age, were obtained from Harlan (Livermore, CA). All animals were kept under pathogen-free conditions according to AAALAC guidelines, and were allowed to acclimate for at least 4 days prior to any experiments. All animal experiments were performed under the requirements of institutional guidelines and according to protocol No. 07–13119 approved by the Use and Care of Animals Committee at the University of California, Davis. PC-3 cells in a 200 μL mixture of PBS suspension and Matrigel (1:1 v/v) were subcutaneously injected into the right flank of nude mice. The tumour sizes for all nude mice were monitored and recorded weekly. Tumours that reached the longest dimension of 0.8–1.0 cm were used for in vivo MR imaging. The tumour volume is calculated by the formula (L*W2)/2. For orthotopic or intracranial implantation, 2.5 × 10⁵ 12FLR glioma cells, derived from patient samples, resuspended in 5 μL PBS were injected into the right striatum area of the nude mouse with the aid of a mouse stereotactic instrument (Stoelting). The tumour sizes for all nude mice were monitored and recorded by the bioluminescence signal of luciferase weekly.
In vivo MR imaging.
PC-3 tumours and orthotopic 12FLR glioma-bearing nude mice (n=3) were scanned on a 7.0 T MRI Scanner (Bruker Biospec, USA.), with a high-resolution animal coil. The mice were i.v. administrated with 100 μL of the nanoprobes and then subjected to MRI at different timepoints: DCM@P-Mn-SPIO (0, 1, 12, 24, and 48 h), DCM@P-Mn (0, 1 and 12 h) and DCM@SPIO (0, 1 and 12 h). The concentrations of P-Mn and SPIO were kept at 15 mg/mL and 0.25 mg/mL, respectively. All mice were imaged under the T1WI (TR/TE=300/14 ms) & T2WI spin-echo sequences (TR/TE=1000/100 ms); T1 map: (TR/TE=100–2000/14 ms) and T2 map image (TR/TE = 1000/15–225 ms) (slice thickness=1 mm, slice spacing=1 mm, FOV= 10 × 10 cm, matrix = 256 × 256). The mean T1 and T2-weighted signal intensities (Smean) were measured for each tumour. Quantitative T1 and T2 maps were reconstructed from datasets using Paravision 4 software. T1 and T2 relaxation time were calculated with the Paravision 4 software. Then, the relative signal-to-noise ratio (SNR = Smean/NSD (standard deviation of the background signal) was calculated based on a previously reported method.38
T2 star measurement.
For T2* images, the MRI parameters were TR = (1500 ms), TE = (4.0–61.5 ms), FOV = 8 × 8 cm and matrix = 256 × 256. Quantitative T2* maps were reconstructed from datasets using Paravision 4 software. R1, R2 and R2* are defined as 1/T1, 1/T2 and 1/T2* relaxation time.
DESI of the MRI (T1-T2).
When the MRI study was performed using a 7.0 T MRI Scanner (Bruker Biospec, USA.), MR images were acquired at the same time point by T1 and T2 -weighted sequences with identical MRI geometrical parameters to ensure that the image slices were consistent. The MR images were co-registered to ensure T1-weight images correspond to the corresponding point of T2-weight images. Then the images of the skull and surrounding soft tissue of the mouse were removed using ImageJ software.
Code availability.
The subtraction imaging was obtained in MATLAB R2013b software by using the following commands:
A = imread (‘D:T1WI’);
B = imread (‘D: T2WI’);
C = imsubtract (A, B);
J = imcomplement c;
J:Subtraction images of the T1 and T2-weight imaging.
The last step involved anti-phase processing of subtraction images using MATLAB R2013b software.
H&E staining and Prussian blue staining.
After humanely sacrificing the mice, we collected the major organs, and fixed them in 4% paraformaldehyde. The organs were then sliced and stained by hematoxylin and eosin (H&E) to evaluate the systemic toxicity of our nanoprobes. Prussian blue staining was performed as described39 to detect iron-positive cells.
Statistical analysis.
All data analyses were shown as mean ± standard deviation (s.d.). The analysis was performed by using GraphPad Prism 7.00. MRI signal intensity, △R1 & △R2 versus GSH concentration, were compared and analyzed using univariate Analysis of Variance and Paravision 4. Pearson’s test was used for correlation analysis. Two-tailed Student’s t-test was employed for statistical analysis. p values < 0.05 were considered statistically significant for all analyses.
Supplementary Material
Acknowledgments
We thank the financial support from NIH/NCI (R01CA199668), NIH/NICHD (R01HD086195), UC Davis Comprehensive Cancer Center Support Grant (CCSG) awarded by the National Cancer Institute (NCI P30CA093373), and NSF (ECCS-1611424 and ECCS-1933527). The acquisition of a Magnetic Property Measurements System (MPMS3) at Georgetown University was supported by the NSF (DMR-1828420).
Footnotes
Methods
The materials, instruments, experimental methods and syntheses and characterizations of the nanoprobes were described in Supplementary Information. All the raw data are available upon request.
Competing interests
Y.L., X.X. and Z.W. are the co-inventors on the pending patent application filed by the Regents of the University of California on the t-MRET nanotechnology and DESI.
Supplementary Information
Supplementary information is available in the online version of the paper. Reprints and permission information is available online at www.nature.com/reprints. Correspondence and requests for materials should be addressed to Y. L.
Data availability
The data that support the plots within this paper and other findings of this study are available from the corresponding author upon reasonable request.
References
- 1.Liu GL et al. A nanoplasmonic molecular ruler for measuring nuclease activity and DNA footprinting. Nat. Nanotechnol 1, 47–52 (2006). [DOI] [PubMed] [Google Scholar]
- 2.Nguyen AW & Daugherty PS Evolutionary optimization of fluorescent proteins for intracellular FRET. Nat. Biotechnol 23, 355–360 (2005). [DOI] [PubMed] [Google Scholar]
- 3.Sönnichsen C, Reinhard BM, Liphardt J & Alivisatos AP A molecular ruler based on plasmon coupling of single gold and silver nanoparticles. Nat. Biotechnol 23, 741–745 (2005). [DOI] [PubMed] [Google Scholar]
- 4.Ma Y et al. A FRET sensor enables quantitative measurements of membrane charges in live cells. Nat. Biotechnol 35, 363–370 (2017). [DOI] [PubMed] [Google Scholar]
- 5.Schuler B, Lipman EA & Eaton WA Probing the free-energy surface for protein folding with single-molecule fluorescence spectroscopy. Nature 419, 743–747 (2002). [DOI] [PubMed] [Google Scholar]
- 6.Ma Y et al. A FRET sensor enables quantitative measurements of membrane charges in live cells. Nat. Biotechnol 35, 363–370 (2017). [DOI] [PubMed] [Google Scholar]
- 7.Nguyen AW & Daugherty PS Evolutionary optimization of fluorescent proteins for intracellular FRET. Nat. Biotechnol 23, 355–360 (2005). [DOI] [PubMed] [Google Scholar]
- 8.Rizzo MA, Springer GH, Granada B & Piston DW An improved cyan fluorescent protein variant useful for FRET. Nat. Biotechnol 22, 445–449 (2004). [DOI] [PubMed] [Google Scholar]
- 9.Biskup C, Zimmer T & Benndorf K FRET between cardiac Na+ channel subunits measured with a confocal microscope and a streak camera. Nat. Biotechnol 22, 220–224 (2004). [DOI] [PubMed] [Google Scholar]
- 10.Jares-Erijman EA & Jovin TM FRET imaging. Nat. Biotechnol 21, 1387–1395 (2003). [DOI] [PubMed] [Google Scholar]
- 11.Sonnichsen C, Reinhard BM, Liphardt J & Alivisatos AP A molecular ruler based on plasmon coupling of single gold and silver nanoparticles. Nat. Biotechnol 23, 741–745 (2005). [DOI] [PubMed] [Google Scholar]
- 12.Liu GL et al. A nanoplasmonic molecular ruler for measuring nuclease activity and DNA footprinting. Nat. Nanotechnol 1, 47–52 (2006). [DOI] [PubMed] [Google Scholar]
- 13.Choi JS et al. Distance-dependent magnetic resonance tuning as a versatile MRI sensing platform for biological targets. Nat. Mater 16, 537–542 (2017). [DOI] [PubMed] [Google Scholar]
- 14.Mizukami S et al. Paramagnetic Relaxation-Based 19F MRI Probe To Detect Protease Activity. J. Am. Chem. Soc 130, 794–795 (2008). [DOI] [PubMed] [Google Scholar]
- 15.Mura S, Nicolas J & Couvreur P Stimuli-responsive nanocarriers for drug delivery. Nat. Mater 12, 991–1003 (2013). [DOI] [PubMed] [Google Scholar]
- 16.Hong R et al. Glutathione-Mediated Delivery and Release Using Monolayer Protected Nanoparticle Carriers. J. Am. Chem. Soc 128, 1078–1079 (2006). [DOI] [PubMed] [Google Scholar]
- 17.Tam NCM et al. Porphyrin–Lipid Stabilized Gold Nanoparticles for Surface Enhanced Raman Scattering Based Imaging. Bioconj. Chem 23, 1726–1730 (2012). [DOI] [PubMed] [Google Scholar]
- 18.Lovell JF et al. Porphysome nanovesicles generated by porphyrin bilayers for use as multimodal biophotonic contrast agents. Nat. Mater 10, 324–332 (2011). [DOI] [PubMed] [Google Scholar]
- 19.Xue X et al. Trojan Horse nanotheranostics with dual transformability and multifunctionality for highly effective cancer treatment. Nat. Commun 9, 3653 (2018). [DOI] [PMC free article] [PubMed] [Google Scholar]
- 20.Zhou Z et al. T1-T2 Dual-Modal Magnetic Resonance Imaging: From Molecular Basis to Contrast Agents. ACS Nano 11, 5227–5232 (2017). [DOI] [PMC free article] [PubMed] [Google Scholar]
- 21.Santra S et al. Gadolinium-encapsulating iron oxide nanoprobe as activatable NMR/MRI contrast agent. ACS Nano 6, 7281–7294 (2012). [DOI] [PMC free article] [PubMed] [Google Scholar]
- 22.Mørup S, Hansen MF & Frandsen C Magnetic interactions between nanoparticles. Beilstein J. Nanotechnol 1, 182–190 (2010). [DOI] [PMC free article] [PubMed] [Google Scholar]
- 23.Köseoğlu Y, Yıldız F, Kim DK, Muhammed M & Aktaş B EPR studies on Na-oleate coated Fe3O4 nanoparticles. Phys. Status Solidi C 1, 3511–3515 (2004). [Google Scholar]
- 24.Kuch W et al. Three-Dimensional Noncollinear Antiferromagnetic Order in Single-Crystalline FeMn Ultrathin Films. Phys. Rev. Lett 92, 017201 (2004). [DOI] [PubMed] [Google Scholar]
- 25.Webb MR, Ash DE, Leyh TS, Trentham DR & Reed GH Electron paramagnetic resonance studies of MN(II) complexes with myosin subfragment 1 and oxygen 17-labeled ligands. J. Biol. Chem 257, 3068–3072 (1982). [PubMed] [Google Scholar]
- 26.Bulte JW, Brooks RA, Moskowitz BM, Bryant LH Jr. & Frank JA Relaxometry and magnetometry of the MR contrast agent MION-46L. Magn. Reson. Med 42, 379–384 (1999). [DOI] [PubMed] [Google Scholar]
- 27.Li Y et al. Probing of the assembly structure and dynamics within nanoparticles during interaction with blood proteins. ACS Nano 6, 9485–9495 (2012). [DOI] [PMC free article] [PubMed] [Google Scholar]
- 28.Li Y et al. Well-defined, reversible disulfide cross-linked micelles for on-demand paclitaxel delivery. Biomaterials 32, 6633–6645 (2011). [DOI] [PMC free article] [PubMed] [Google Scholar]
- 29.Li Y, Xiao K, Zhu W, Deng W & Lam KS Stimuli-responsive cross-linked micelles for on-demand drug delivery against cancers. Adv. Drug Deliv. Rev 66, 58–73 (2014). [DOI] [PMC free article] [PubMed] [Google Scholar]
- 30.Maeda H et al. Effective treatment of advanced solid tumors by the combination of arsenic trioxide and L-buthionine-sulfoximine. Cell Death Differ. 11, 737–746 (2004). [DOI] [PubMed] [Google Scholar]
- 31.Pileblad E, Magnusson T & Fornstedt B Reduction of Brain Glutathione by l‐Buthionine Sulfoximine Potentiates the Dopamine‐Depleting Action of 6‐Hydroxydopamine in Rat Striatum. J. Neurochem 52, 978–980 (1989). [DOI] [PubMed] [Google Scholar]
- 32.Zheng X et al. Successively activatable ultrasensitive probe for imaging tumour acidity and hypoxia. Nat. Biomed. Eng 1, 0057 (2017). [Google Scholar]
- 33.Hori SS, Tummers WS & Gambhir SS Cancer diagnostics: On-target probes for early detection. Nat. Biomed. Eng 1, 0062 (2017). [Google Scholar]
- 34.Li Y et al. A smart and versatile theranostic nanomedicine platform based on nanoporphyrin. Nat. Commun 5, 4712 (2014). [DOI] [PMC free article] [PubMed] [Google Scholar]
- 35.Kato J et al. Disulfide Cross-Linked Micelles for the Targeted Delivery of Vincristine to B-Cell Lymphoma. Mol. Pharm 9, 1727–1735 (2012). [DOI] [PMC free article] [PubMed] [Google Scholar]
- 36.Xiao K et al. Disulfide cross-linked micelles of novel HDAC inhibitor thailandepsin A for the treatment of breast cancer. Biomaterials 67, 183–193 (2015). [DOI] [PMC free article] [PubMed] [Google Scholar]
- 37.Li Y et al. Well-defined, reversible disulfide cross-linked micelles for on-demand paclitaxel delivery. Biomaterials 32, 6633–6645 (2011). [DOI] [PMC free article] [PubMed] [Google Scholar]
- 38.Wang Z et al. Active targeting theranostic iron oxide nanoparticles for MRI and magnetic resonance-guided focused ultrasound ablation of lung cancer. Biomaterials 127, 25–35 (2017). [DOI] [PMC free article] [PubMed] [Google Scholar]
- 39.Zhang Z et al. Facile Synthesis of Folic Acid-Modified Iron Oxide Nanoparticles for Targeted MR Imaging in Pulmonary Tumor Xenografts. Mol. Imaging Biol, 1–10 (2015). [DOI] [PubMed] [Google Scholar]
Associated Data
This section collects any data citations, data availability statements, or supplementary materials included in this article.