Abstract
Protein “sectors” is a theoretical construct positing that sparse subsets of amino acid residues form cooperative networks that are key elements of protein stability, ligand binding, and allosterism. Sectors in have been obtained for a number of proteins by Statistical Coupling Analysis (SCA) method of Ranganathan and co-workers, which involves the spectral analysis of conservation-weighted evolutionary covariance matrices obtained from a multiple sequence alignments of homologous families of proteins. SCA sectors have been successfully indentified with functional properties and allosterism in particular for a number of protein families. Here we investigate the utility of the sector idea for the analysis of physics-based molecular dynamics (MD) trajectories on proteins. The test case for this project is PSD95- PDZ3, a protein well characterized by x-ray crystallography, NMR spectroscopy and site specific mutagenisis, and one of the smallest systems for which allosterism has been experimentally observed. All-atom MD simulations were performed for a total of 500 nanoseconds. MD-calculated covariance matrices for the fluctuations of residue displacements and non-bonded interaction energies were subjected to spectral analysis in a manner analogous to that used to analyze positional correlation matrices in SCA. The composition of MD sectors was compared with results on SCA sectors and site specific mutagenesis. The agreement indicates that MD sectors to be a useful paradigm for analyzing protein MD trajectories, and likewise accounts for single domain allosterism in PDZ3. MD sectors are expected to be useful in the development of experimentally testable hypotheses on cooperativity, ligand binding, allosterism, and allosteric drug design.
Keywords: MD sectors, Molecular Dynamics simulations, sector residues, spectral analysis, allosteric signaling, ligand binding, cooperative network
1. Introduction
Prediction algorithms for amino acid residues of a protein that may be of special importance to function is an active area of research in computational biology (Gerek & Ozkan, 2011; Zerbe, Hall, Vajda, Whitty & Kozakov, 2012; Zhang, Jiang & Shan, 2016; Qiao, Xiong, Gao, Zhu & Chen, 2018). There is a considerable literature on prediction of positions in the sequence of a protein in which function is sensitive to single site mutations, or “hot spots” (Reynolds, McLaughlin & Ranganathan, 2011; Tse & Verkhivker, 2015; Kulp, Cloudsdale, Kulp & Guarnieri, 2017). Predicting the amino acid residues in a sequence that form cooperative networks that are involved in allosterism is a more challenging problem but also with active interest, particularly in allosteric drug design (Marcelino, Smock, & Gierasch, 2006; Acuner, Ozbabacan, Bursoy, Keskin, & Nussinov, 2010; Reynolds, McLaughlin & Ranganathan, 2011; Tse & Verkhivker, 2015; Wagner et al., 2016). While the allosteric effect is ubiquitously present in biological systems (Liu & Nussinov, 2016), there is no observable property of a residue that unequivocally indicates that it participates in a cooperative network that encompasses both the site of functional activity binding and the distal binding site of an allosteric effector.
The sector hypothesis postulates a construct termed “sectors” that captures the proposition that functional properties of a protein involve a cooperative network consisting of a sparse subset of the total complement of amino acid residues. Historically it was developed within the context of Statistical Coupling Analysis (SCA) (Halabi, Rivoire, Leibler & Ranganathan 2009; Reynolds et al. 2011; Rivoire, Reynolds & Ranganathan 2016), a bioinformatics protocol reporting on evolutionary covariance. The conservation-weighted evolutionary covariance matrix is computed based on a multiple sequence alignment from a collection of homologous entries from the sequence data bases. Spectral analysis is applied to identify positions that show a statistical tendency to co-evolve. Similar analysis utilizing methods from the domain of bioinformatics have also been developed to identify sectors (Wagner et al. 2016). Sectors are then taken as candidates for constituting functionally important cooperative networks associated with protein stability, ligand recognition, catalysis, and allosteric regulation.
Although the sequence based covariance method has procured useful empirical results generating testable hypotheses about biological phenomena of interest, the approach lacks footing in first principles.
Sectors are then taken as candidates for constituting functionally important cooperative networks associated with protein stability, ligand recognition, catalysis, and allosteric regulation. The results of SCA as applied to ligand binding and allosterism are impressive and strongly support the plausibility of the sector hypothesis that was developed within this framework of evolutionary covariance.
While the sector hypothesis enjoyed great success, some caveats stemming from the empirical nature of the analysis have been raised. Coevolution derives from organismal fitness, a property whose relationship to known structural or biochemical properties is formally undefined (Rivorie et al 2016). Furthermore, issues have been raised about the role of conservation versus covariance in the performance of the SCA method (Tesileanu, Dolwell (Coldwell?? & Leibler, 2015). Furthermore, as with any covariance based method, it may be complicated by limited sampling andpossible bias due to the choice of sequences for including in the analysis.
In sequence space, pairwise covariance of homology was improved by spectral analysis because the spectral analysis identified groups of residues that are varying in evolution with all other residues in the network; it is an n-wise variance rather than just pairwise covariance between two residues. The spectral analysis serves as an algorithm to extract the sector of the n-wise covariance of all n members. In an analogous fashion, a pairwise motional covariance plot also is limited to pairwise information but does not provide information about groups of residues that have correlated motions. The key idea in this paper is to introduce the spectral analysis algorithm to motionally covarying residues to obtain MD sectors analogous to the application fo spectral analysis to evolutionarily covarying residues. Ranganathan and coworkers have claimed a value added to the n-wise covariance of sectors. Here, we investigate if an analogous benefit may be achieved by the parallel application of the spectral analysis algorithm to motional covariance.
MD sectors significantly fortify the MD sector hypothesis by grounding it in first principles rather than relying solely upon empirical observation. In this alternate approach to obtaining sector residues, predicting the composition of cooperative networks from physics-based methods provides an alternate but heretofore undeveloped approach that enables understanding the nature of allosterism and developing experimentally testable hypotheses about the mechanism of allosteric signal transmission. Because the input consists solely of information from the MD simulation, the macroscopic property of allostery has therefore been linked to the inherent microscopic properties of the system as revealed through the simulations themselves
However, covariance based analysis may be complicated by both the limited sampling of an MSA and possible historical bias in the choice of sequences. Also, coevolution derives from organismal fitness, a property whose relationship to known structural or biochemical properties is formally undefined (Rivoire et al. 2016). Furthermore, issues have been raised about the role of conservation versus covariance in the performance of the SCA method (Tesileanu, Colwell & Leibler 2015). Nevertheless, the results of SCA applied to ligand binding and allosterism are impressive and strongly support the plausibility of the sector hypothesis.
As an alternate approach to obtaining sector residues, predicting the composition of cooperative networks from physics – based methods provides an alternate but heretofore undeveloped approach that may be useful for understanding the nature of allosterism and developing experimentally testable hypotheses about the mechanism of allosteric signal transmission (Huang, Nussinov & Zhang 2017). The potential utility of covariance analysis of MD was described in the seminal textbook on MD by McCammon and Harvey (McCAmmon & Harvey, 1987). Subsequent research into MD-calculated motional covariance analysis comes from several laboratories (Ichiye, Olafson, Swaminathan & Karplus, 1986; Harte et al., 1990; Harte Jr., 1992; Hunenberger, Mark & van Gunsteren, 1995; Roy & Post, 2012). High performance digital computing now enables molecular dynamics (MD) computer simulations on proteins that provide all-atom models of dynamical structure and energetics of an explicitly solvated system at ≤ 2 Å root mean square deviation of crystal structures (Rueda et al., 2007). Insights into allostery from MD have been reported in a number of cases (Ota & Agard, 2005; Sharp & Skinner, 2006; Ho & Agard, 2009; Bowerman & Wereszczynski, 2016; Hertig, Latorraca & Dror, 2016), and using this method fits with current ideas about the role of dynamics, i.e. dynamical allosterism (Swain & Gierasch, 2006; Goodey & Benkovic, 2008; Smock & Gierasch, 2009; Wei, Xi, Nussinov & Ma, 2016; Thayer, Lakhani & Beveridge 2017).
Covariance analysis of energetic fluctuations has been reported less frequently, with the notable exception of PDZ2, for which Kong and Karplus (Kong & Karplus 2007; Kong & Karplus 2009) reported energy correlation analysis which identified residues that corresponded favorably with evidence from NMR relaxation times (van den Berk et al., 2004; Gianni et al., 2006). Here, two independent pathways of communication between the ligand binding region and the allosteric effector residues are found.
An alternative method for the elucidation of protein structure networks based on NBI (non-bonded interaction) energy correlations in an ensemble of MD structures has been developed by Bhattacharyya and coworkers (Bhattacharyya, Upadhyay & Vishveshwara, 2012), and also applied to predictions of allosterism in large proteins.
While the ability of MD to provide insight into allostery has been well established by these advances, obtaining networks of covarying residues directly from the non-bonded interactions of residues as described by the MD trajectories themselves has not yet been fully explored. In this work, we investigate obtaining sector residues from MD simulations to obtain a vantage coalescing the advantages of analysis rooted closely to first principles with the power of the spectral analysis found in the SCA approach. All-atom molecular dynamics computer simulations formed the basis of a new covariance method to obtain sectors. To proceed, MD-calculated covariance matrices for motional and energy fluctuations are obtained and analyzed using spectral analysis in a manner analogous to that used for the analysis of positional covariance matrices in SCA, with our “MD sectors” likewise identified from the eigenvalues and eigenvectors of a spectral analysis.
The corresponding “MD sectors hypothesis” raises the question of the extent to which the covariance of calculated fluctuations in motions and in non-bonded energies obtained from all-atom MD simulations can contribute to the understanding of cooperativity and allosterism at the molecular level. To address this, we investigated the utility of MD sectors for data reduction in the analysis of MD simulations with particular attention to allosteric signaling. Our test case in this study is the protein PSD95-PDZ3, a PDZ domain which is well characterized by crystallography (Doyle et. al, 1996), NMR spectroscopy (Zhang et al., 2010), and site-specific mutagenesis (McLaughlin, Poelwijk, Raman, Gosal & Ranganathan, 2012). PDZ has served as the benchmark for a number of previous studies that endeavor to predict functionally important amino acid residues (Gerek & Ozkan, 2011), and is now taken to be a benchmark system in the field single and coupled site prediction methods. Using this model system, we report on our insights into allostery with the benefit of a first-principles based approach.
2. Materials and methods
2.1. MD Simulations
All-atom MD simulations on PDZ3 including explicit solvent were performed with the AMBER suite of programs (Case et. al, 2012) using the force fields ff99 SB for the protein (Hornak et al., 2006), ions08 (Joung & Cheatham, 2008) for monovalent K+ and Cl− at minimal salt concentration, and the TIP3P potential for solvent water (Jorgensen 1981; Jorgensen, Chandrasekhar, Madura, Impey & Klein, 1983). The starting configuration for MD was taken as the crystal structure of PDZ3 bound to the peptide ligand CRIPT (PDB: 1BE9) (Figure 1) (Doyle et al., 1996). The simulation cell contained protein, 15 K+, 13 Cl− and 7652 water molecules and was treated under Particle Mesh Ewald periodic boundary conditions as coded into AMBER to model a dilute aqueous solution. Five independent 100 ns simulations were performed using different initial velocity distributions. All simulations were analyzed for stability after equilibration using ensemble based convergence analysis (Zuckerman, 2011). The five trajectories analyzed separately showed a dispersion in calculated average structure ≤1.0 Å of each other, and they reside within ≤ 2.0 Å of the crystal structure, as expected (Rueda et al., 2007). The five trajectories all sample essentially the same configurational subspace, and were concatenated into a 500ns ensemble for subsequent analysis. In all calculations, atom-based quantities obtained from MD are combined to present results by residue. Motional and energy covariance matrices were computed from MD trajectories by standard methods using the AMBER utility cpptraj in AmberTools14 (Case, 2012). Spectral analysis was applied to the covariance matrices. The first eigenvalue of a spectral decomposition is by definition unity, and the remaining eigenvalues define a series of modes which comprise a series expansion of the covariance matrix in covariance space. The leading terms make the largest contributions to the expansion and, to be reasonably inclusive, MD sectors were defined based on the eigenvectors of the leading 20% of the eigenvalues of the spectral decomposition.
Figure 1.
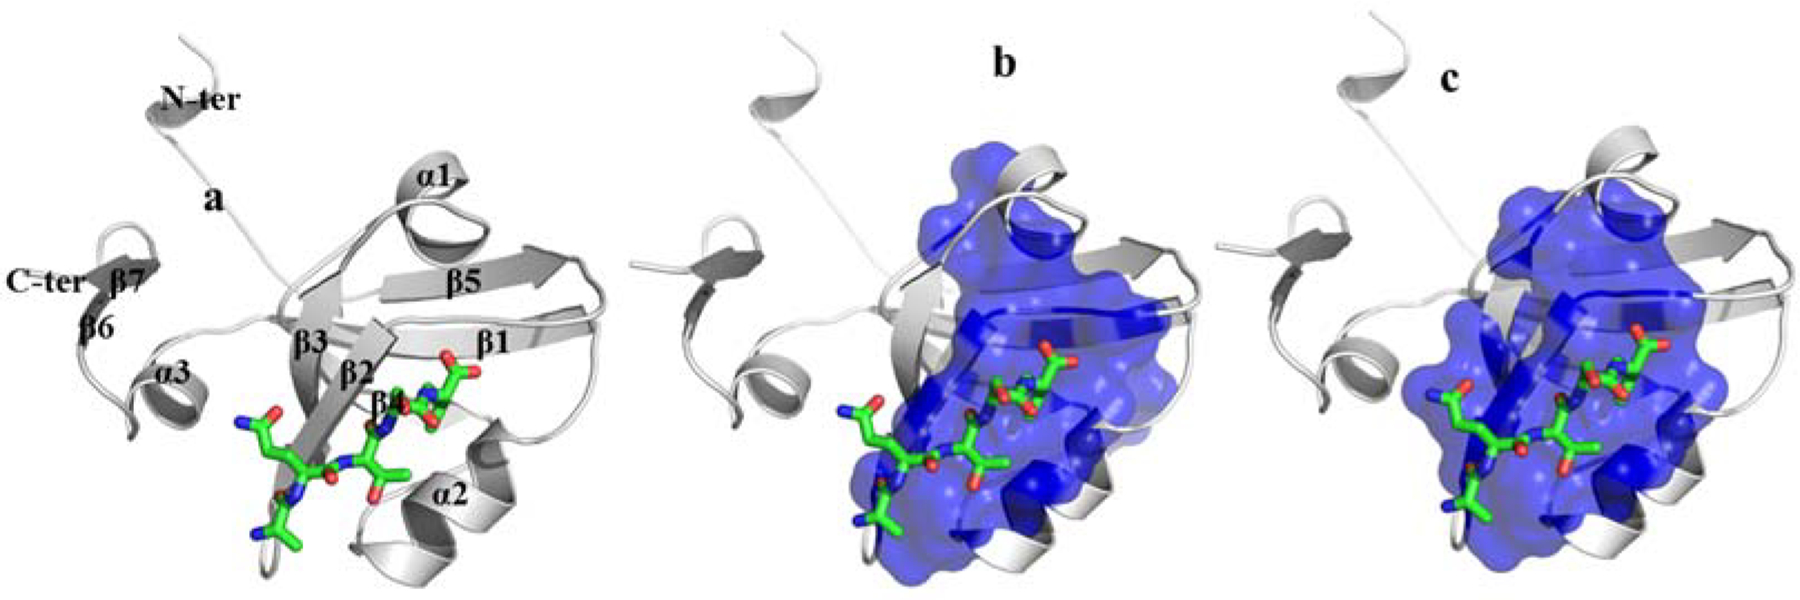
a) Crystal structure of PDZ3 bound to a peptide ligand (Doyle et al., 1996) (PDB ID 1be9), including the annotation of secondary structure followed in this article. b) Calculated SCA sector for PDZ domains (Suel, Lockless, Wall & Ranganathan, 2003); and c) Observed mutationally sensitive residues (MSR) of PDZ3 (McLaughlin et al., 2012).
2.2. Distance Covariance.
There is a well-known deficiency in standard covariance algorithms for motional correlations between displacement vectors oriented in the vicinity of perpendicular to each other, in which a cosine factor results an unphysical reduction in magnitude. Roy and Post (2012) have recently revisited this issue, and demonstrated that the “distance covariance” algorithm (Szekely et al., 2007) effectively deals with the problem. Following this work, all motional correlations in our study are computed using the distance covariance algorithm using code generously provided by the Post laboratory. Spectral analysis was applied using the protocol of Ranganathan et. al as implemented in the MATLAB toolbox for SCA analysis, with the covariance of motional or energetic fluctuations in place of the evolutionary covariance matrix. MD sectors were defined inclusively as the top 20% of residues based on the eigenvalue distribution.
3. Results
3.1. MD trajectories.
An overlay of equal time-spaced snapshots from the MD on PDZ3 is shown in Figure 2, and indicates that the range of dynamic motion predicted by MD is not large except for end effects. Figure 3 shows a plot of MD calculated thermal fluctuations for PDZ3 compared with the observed crystallographic B-factors for PDB 1BE9 (Doyle et al. 1996). There are some quantitative discrepancies as expected, but the trends in flexibility by residue are adequately reproduced for the purposes of our study.
Figure 2.
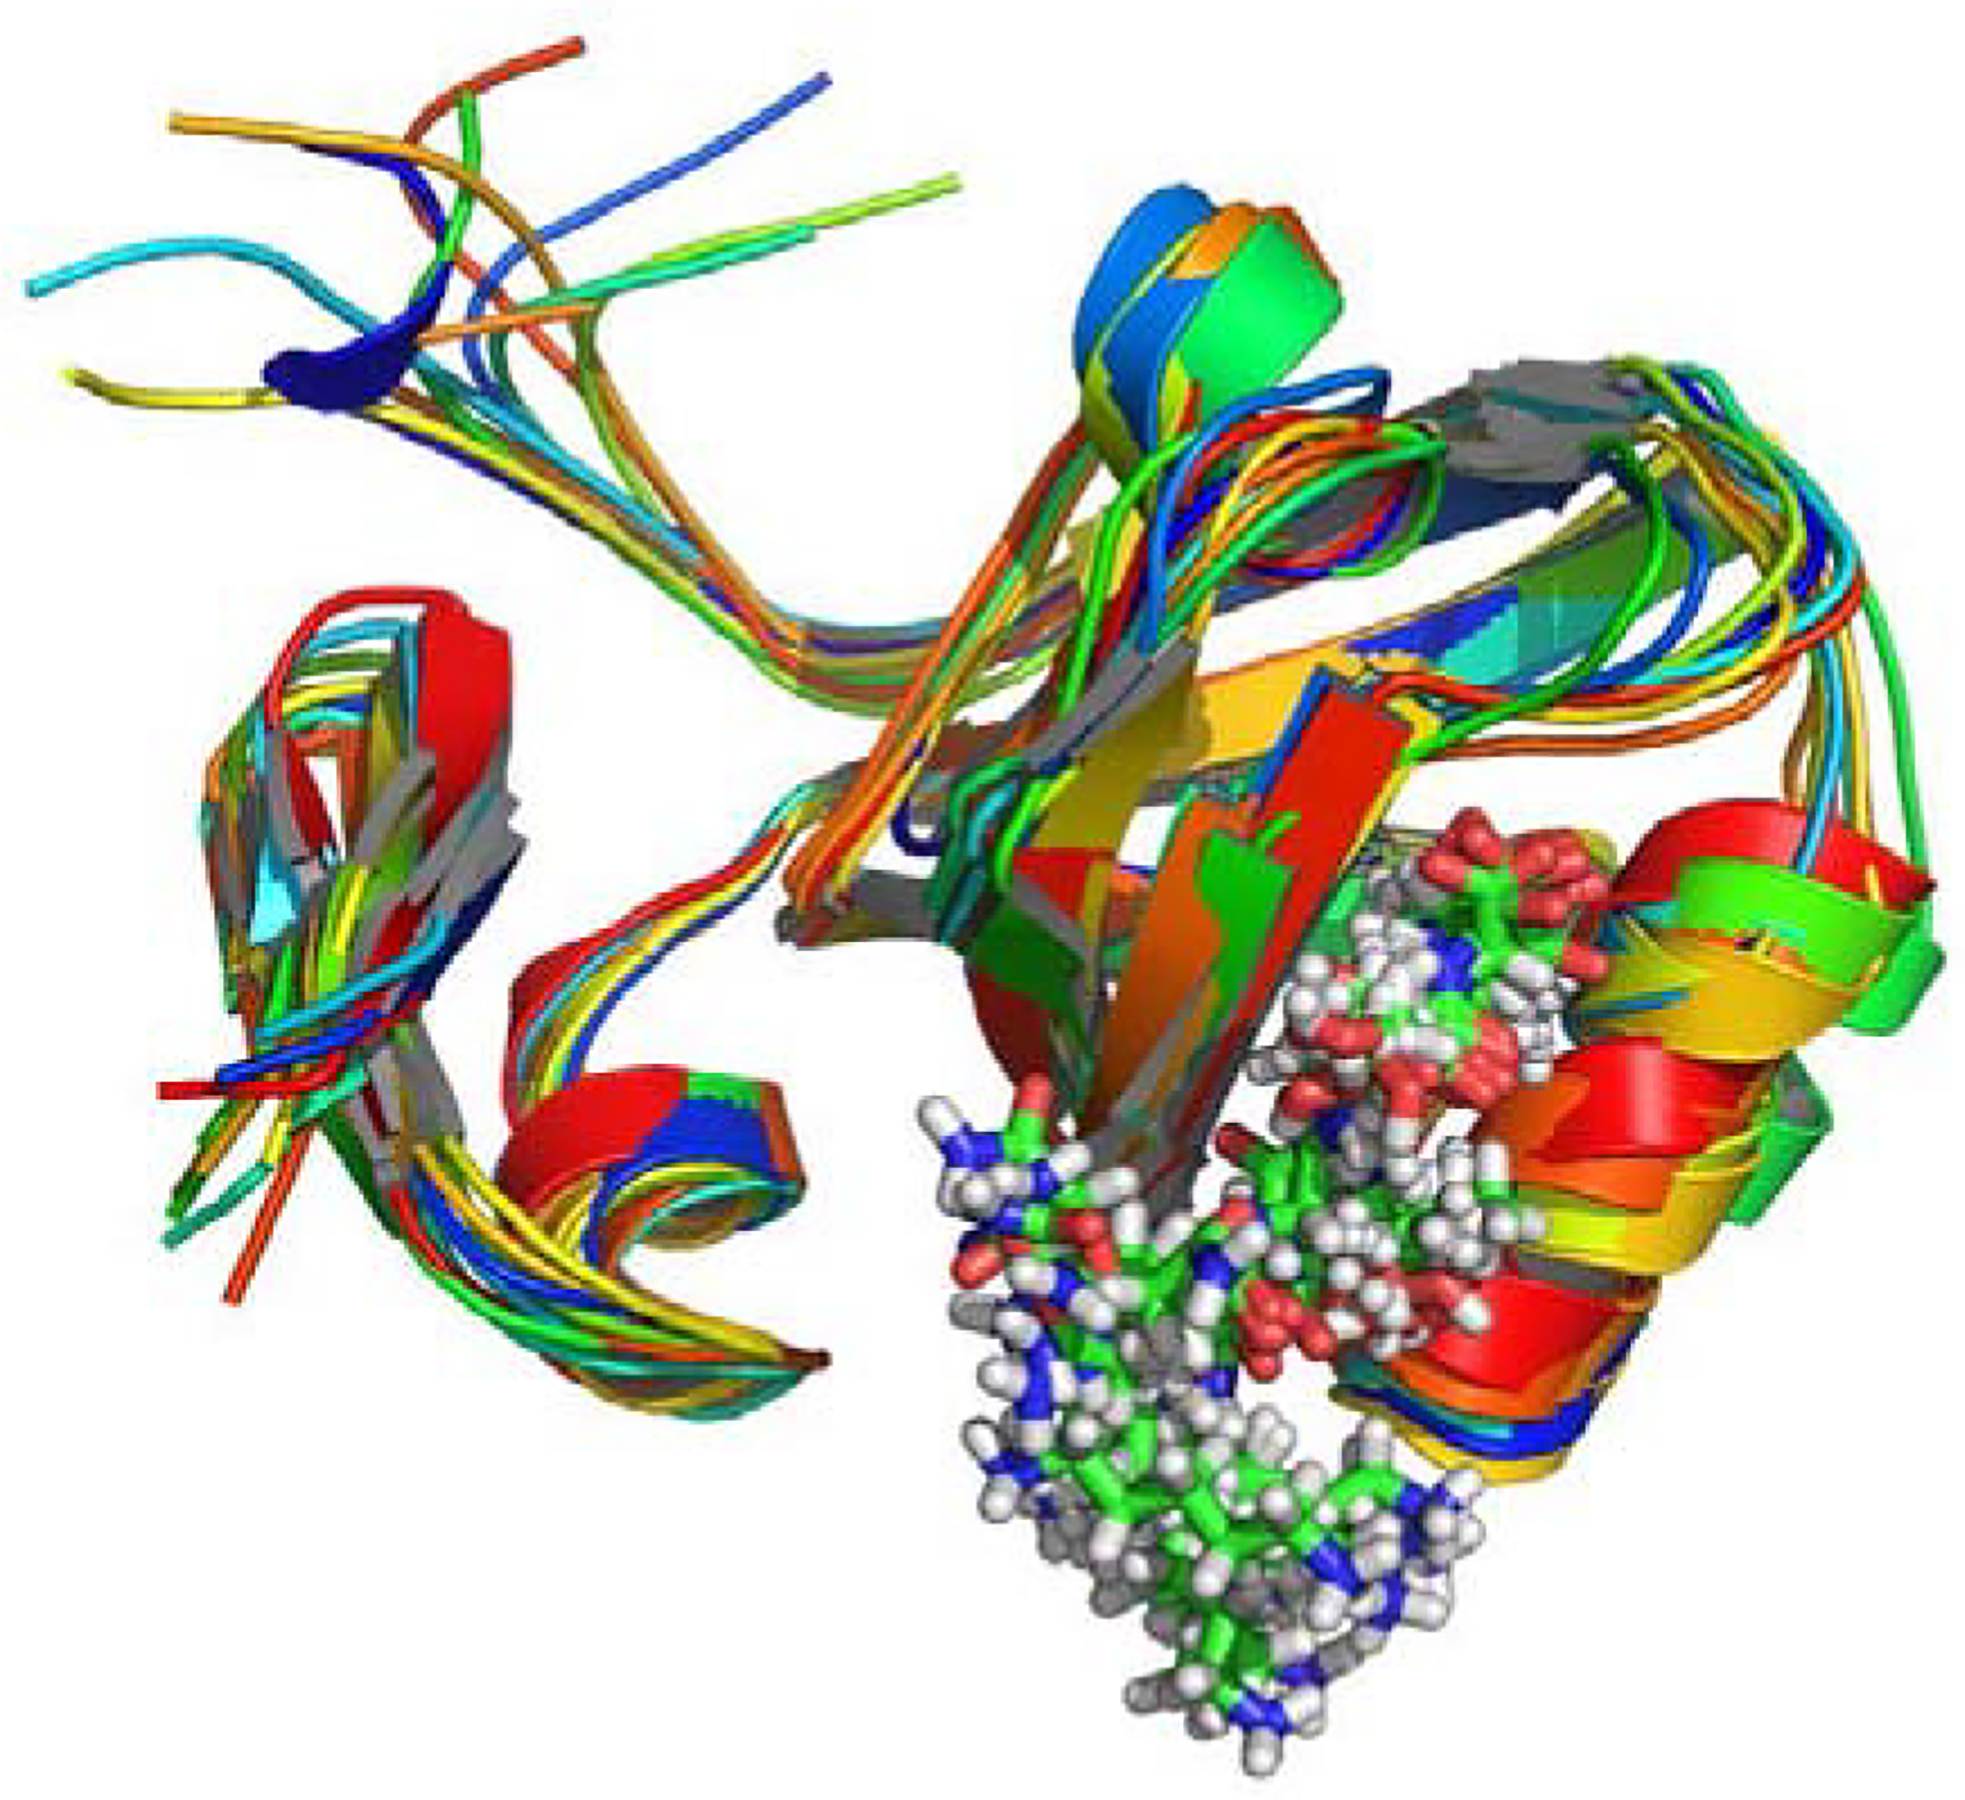
MD calculated dynamical structure of PDZ3, presented as an overlay of 10 snapshots.
Figure 3.
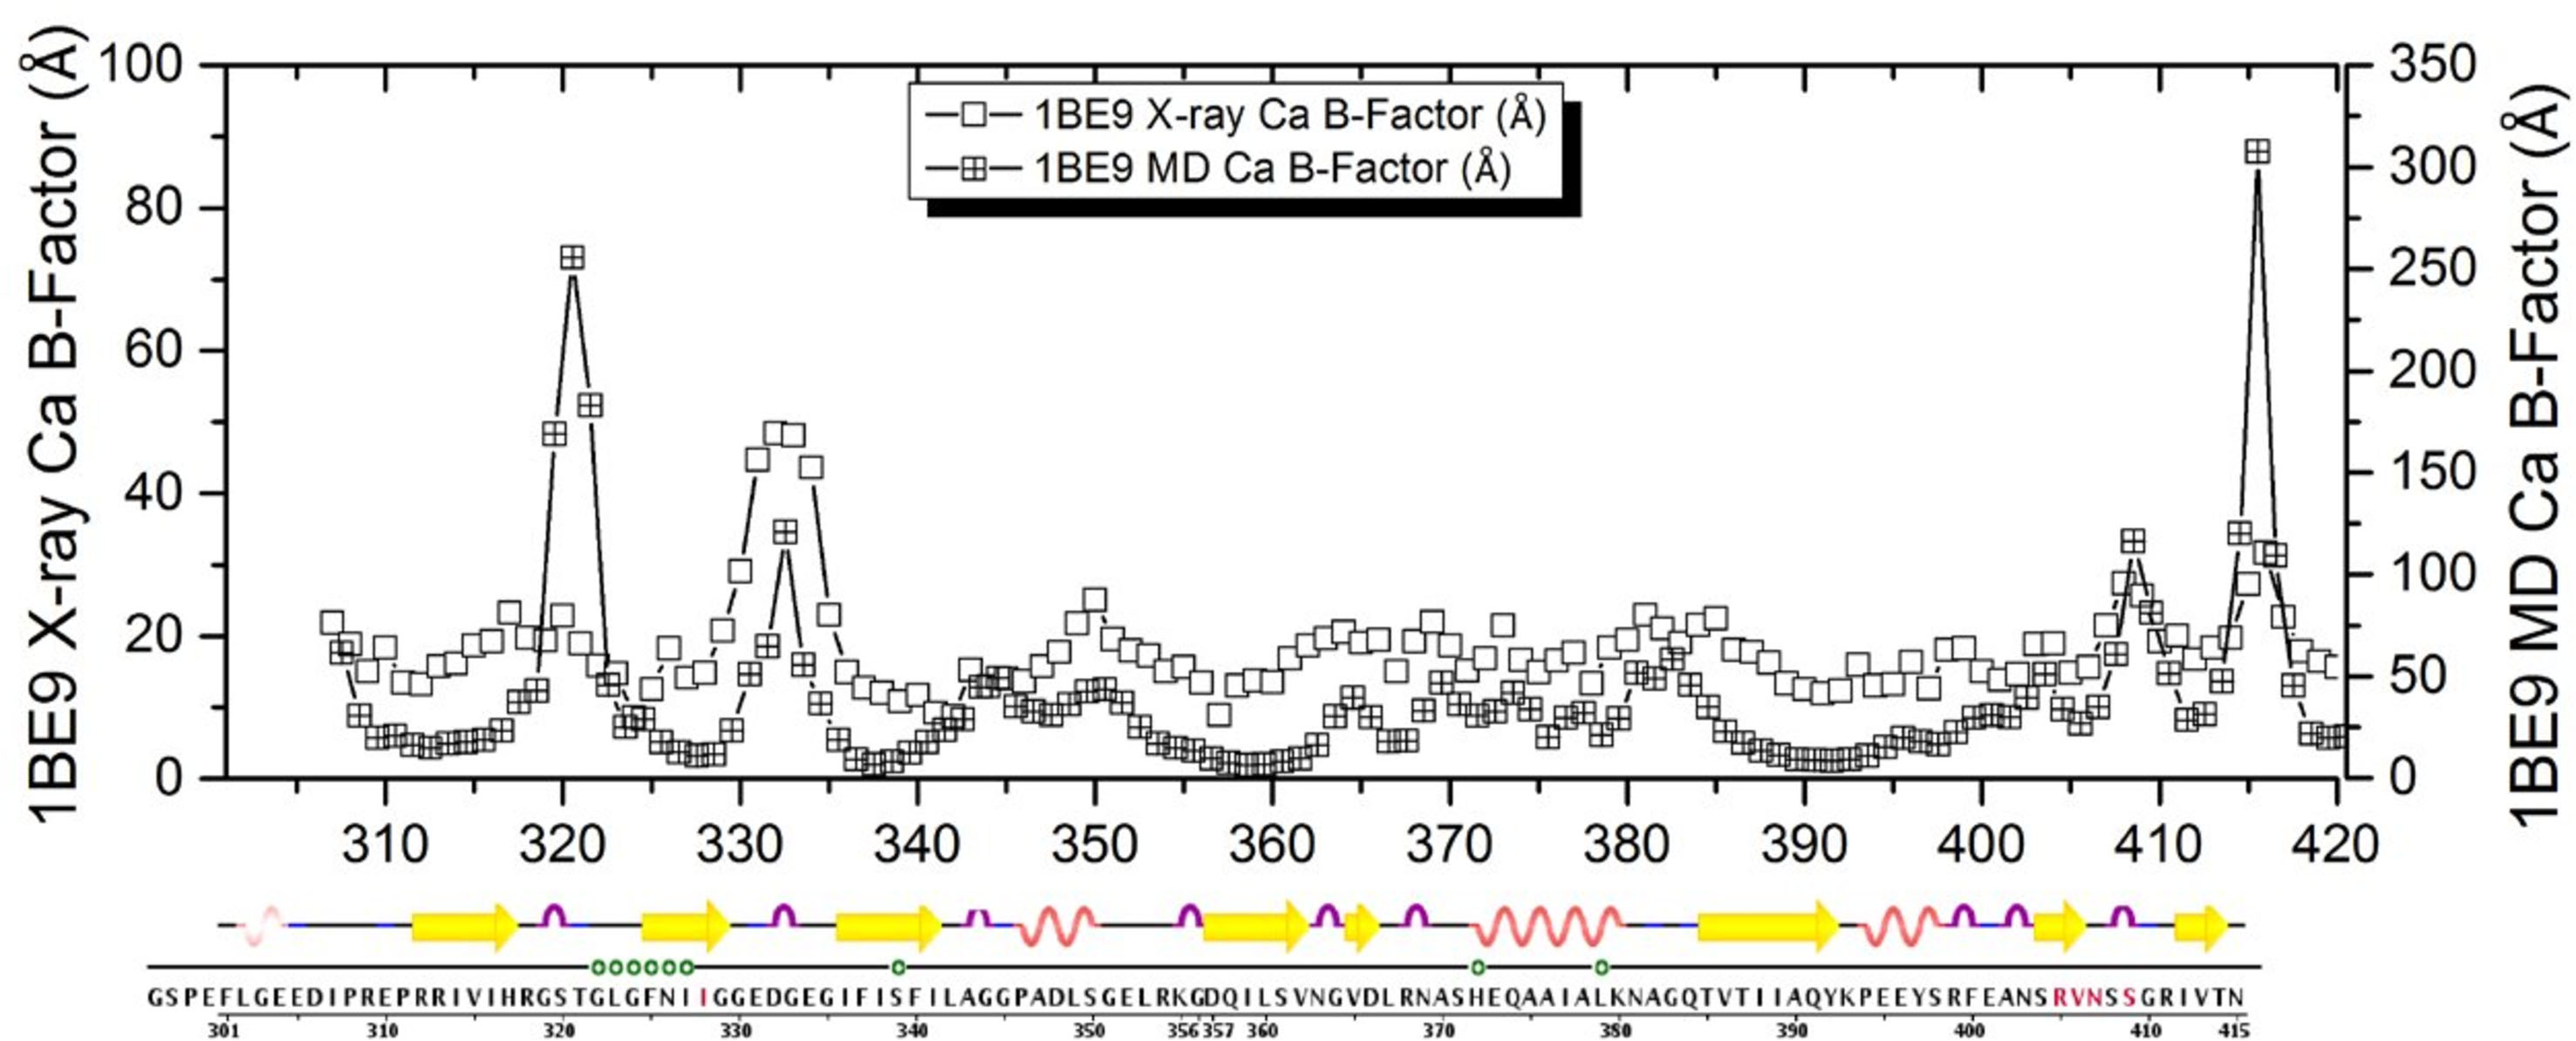
MD calculated fluctuations per residue compared with observed crystallographic B-factors (Doyle et al., 1996).
3.2. MD sectors from motional correlations.
A heat map for MD-calculated motional covariance matrices in PDZ3 is shown in Figure 4. This matrix is the essential data structure submitted for spectral analysis. Correlations that arise from residues adjacent in the backbone of PDZ3 (blue regions of Figure 4) are expected de facto, and not included in the subsequent analysis. Spectral analysis of the MD-calculated motional covariance matrix resulted in an MD sector of 21 residue positions. We stress that MD sectors are a heuristic, and there is no theoretical guarantee that all of the residues of a calculated sector are included in a functional cooperative network, nor that all residues of a functional network are identified in a sector calculation. However, the correlations of motional or energetic fluctuations (just as with fluctuations in evolutionary covariance) are to some extent a cooperative phenomenon, but whether the associated free energy changes are large enough to have an effect on function remains to be unequivocally established.
Figure 4. Heat map of the covariance matrix for fluctuations in MD calculated motional displacements <Δrij >.
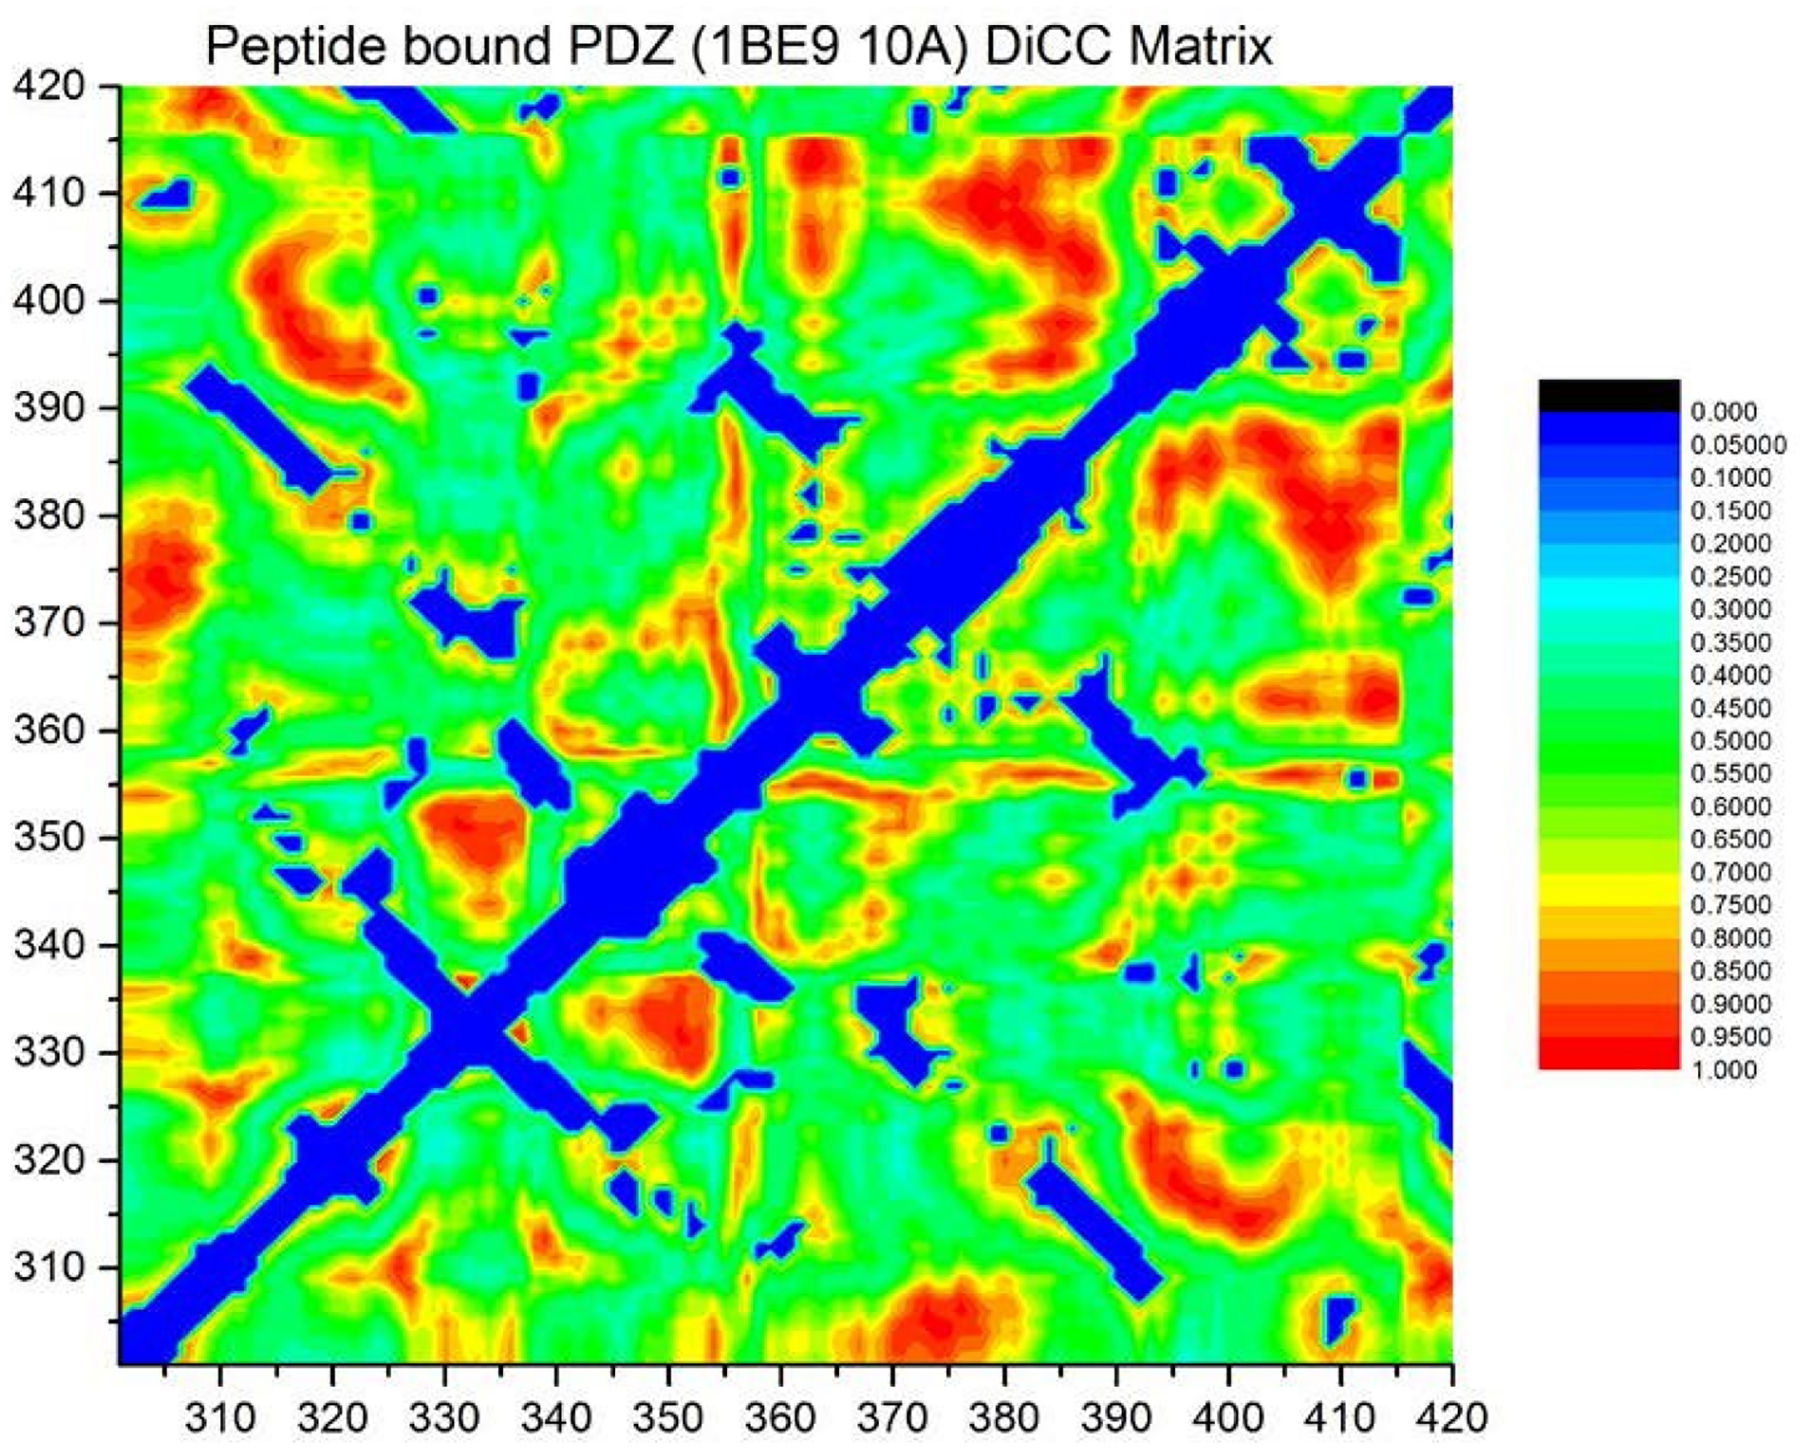
The indices i and j run over amino acid residues in PDZ3. The regions in blue correspond to neighboring inter-residue contacts, based on an interatomic distance cutoff < 10 Å.
The MD sector representation of correlations of motional or energetic fluctuations define a physics- based theoretical prediction method for coupled site interactions, which is a network with some extent of cooperativity. The question to be posed to MD sectors at this point is, ‘To what extent is this strategy useful for obtaining a plausible hypothesis about functional allosteric communication?’ Validation of this (and all other prediction methods) can only come from the plausibility of results compared with experimental data. The comparison of the calculated physics-based MD sectors and bioinformatics driven SCA sectors is also of interest. In any case, validation by any means is heuristic, and there is no basis for demanding complete agreement amongst the various methods or with experiments. However, the more the better, especially in the latter case. The 21 amino acid positions in PDZ3 are depicted in Figure 5. In Figure 5a, the 21 MD sector residues are shown as 1 Å spheres centered on the Cα atoms of amino acid residues. We observe that many sector residues are in the region of the crystallographic binding pocket, which supports the idea that MD sector analysis indeed identifies functionally important residues. Figure 5b shows the same basic result with a VDW surface over the sector residues, which shows that the MD sector residues form a contiguous van der Waals network. Moreover, this includes residues of both the peptide binding site and the allosteric site on opposite face of the molecule. Thus, using the same metrics as applied to SCA sectors, MD sectors as obtained from motional correlations provides a plausible hypothesis about the nature of a cooperative network supporting allosterism in the PDZ domain.
Figure 5.
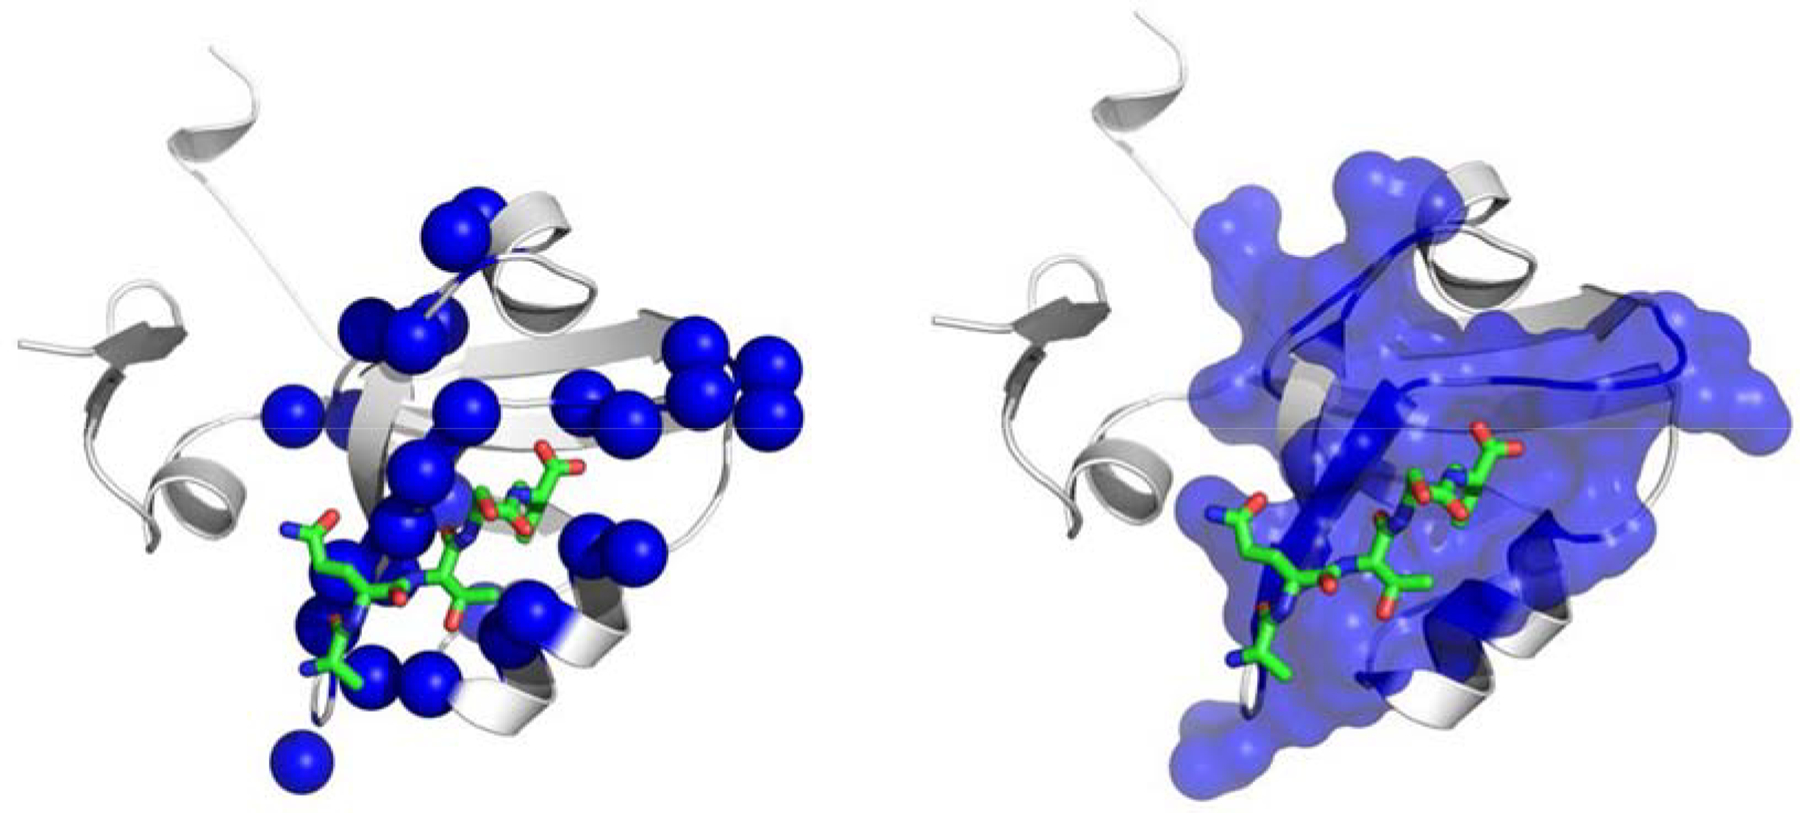
Two views of the MD calculated sector residues for PDZ3. a) Residues shown as discrete blue spheres; b) surface representation indicating contiguity of sector positions.
Figure 6 shows the coincidence of MD sector residues together with the positions observed as mutationally sensitive calculated from SCA is presented in the form of a Venn diagram. MD sectors coincide in 15/20 of the experimentally observed MSR positions, and also include 10/13 amino acids residues in the peptide binding pocket (McLaughlin, Poelwijk, Raman, Gusal, Ranganathan, 2012). We find that MD and SCA sectors coincide with SCA in 14/20 residue positions, an agreement commensurate with that reported as significant agreement between SCA and MSR results on PDZ3. In the case of MD as well as SCA, both SCA and MD sectors include residues of a groove in the vicinity of secondary structure elements α1 and β1 distal to the binding pocket that has been identified as region of an allosteric effector site in experiments on Par-6 PDZ. (Peterson, Penkert, Volkman & Prehoda, 2004; Whitney, Peterson, Kovrigin & Volkman, 2013). The MD sector includes residues H372, G329, G330 and I336 where mutations switch the preference for binding between Class I and Class II sequences, even though the latter three are distal to the binding site. The so-called “hidden” allosterism that was observed upon deletion of the C-terminal helix α3 (Petit, Zhang, Sapienza, Fuentes & Lee, 2009) is notable, but the residues involved are not included the 1BE9 structure.
Figure 6.
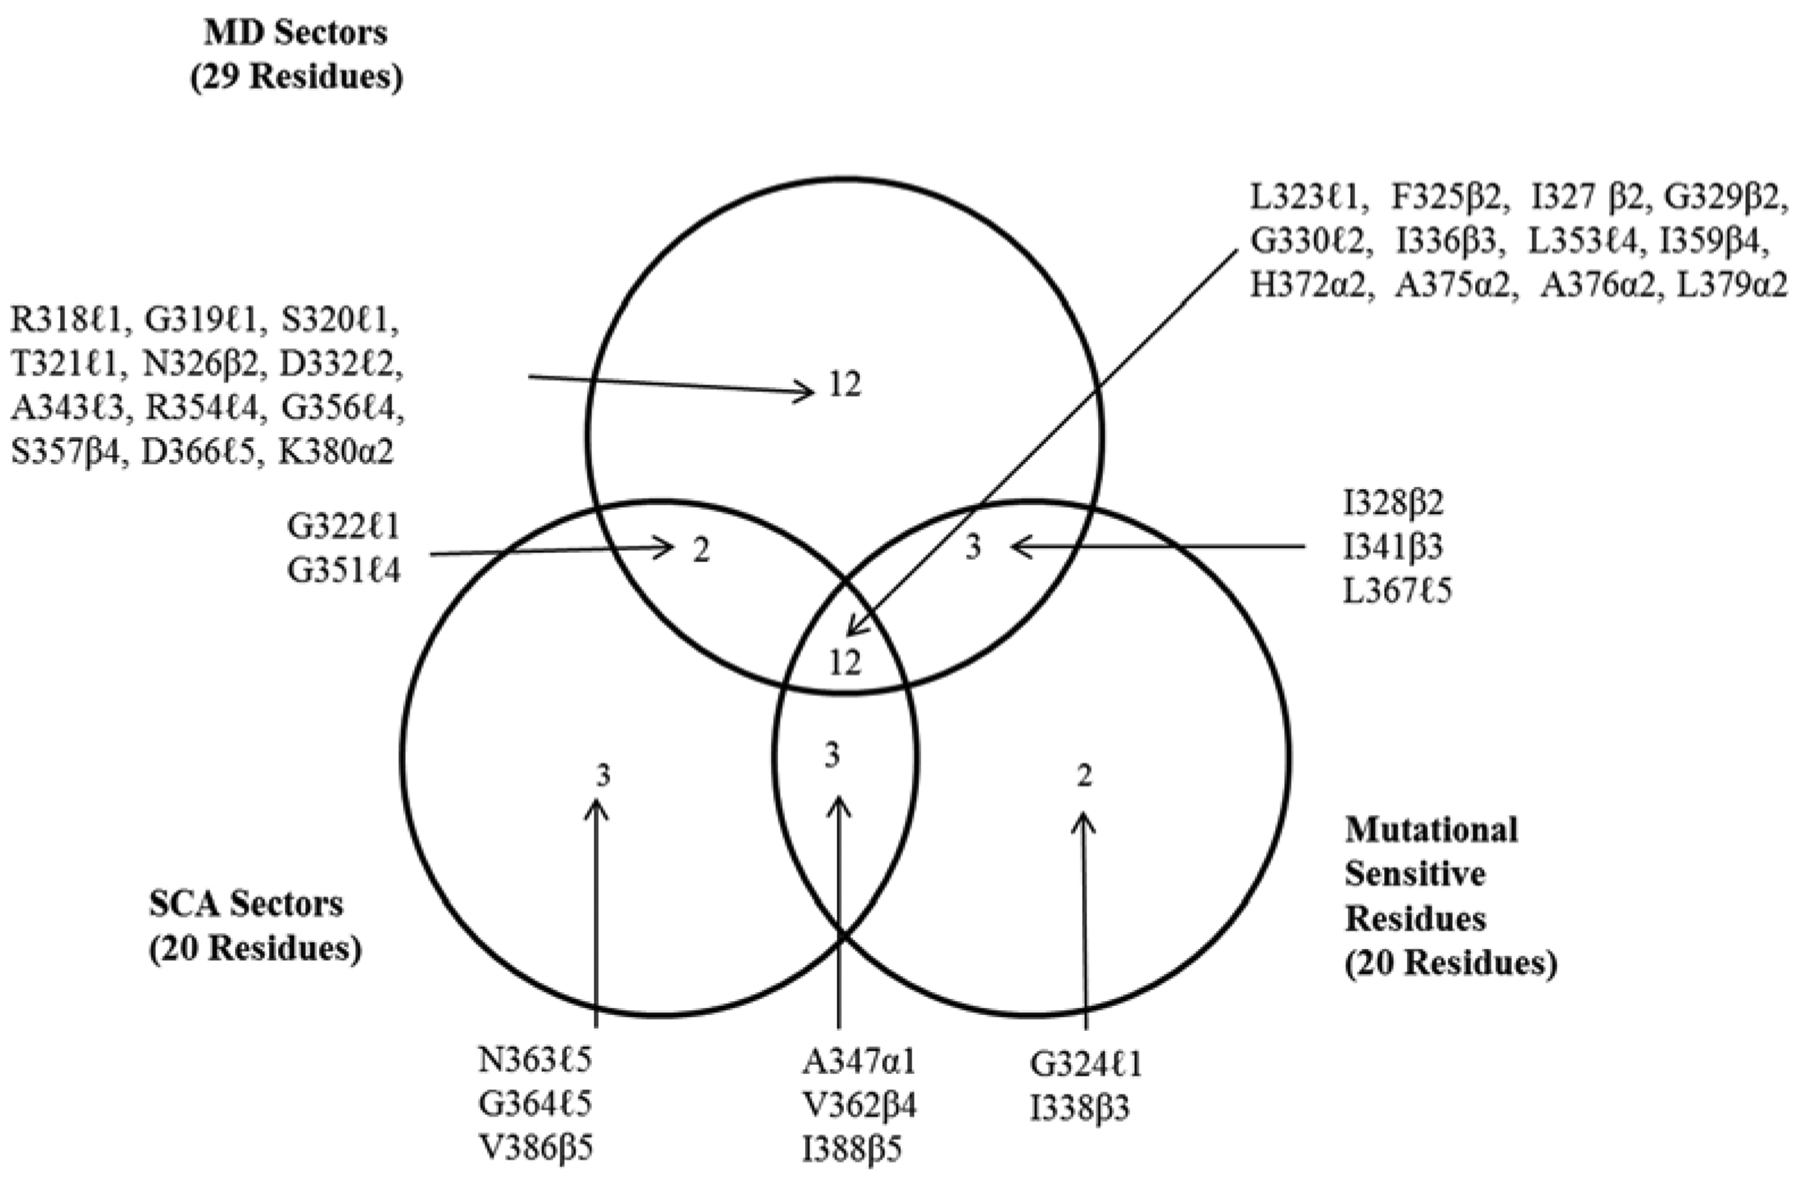
Venn diagram indicating the coincidences of sector residues obtained from SCA analysis, SCA and MD sectors, and MSR. First letter of each label is the one letter abbreviation for the residue in the wild type of the protein, next is the residue number, and last is the location of the residue in the secondary structure, c.f. Figure 1a.The sector residues listed here appear mapped to the structure in Figure 5.
Once the MD-sector residues have been established, the diagonal and off diagonal elements of the correlation matrix can be used to compose a Laplacian matrix and analyzed complex network theory using the program xpyder.(Pasi, Tiberti, Arrigoni & Papaleo, 2012) The results for SCA and MD sectors are shown in Figure 7. A notable feature of the results in Figure 7 is that the ligand binding pocket and allosteric region of PDZ3 are linked by no more than two degrees of separation, indicating that a sequential pathway of interacting amino acid residues may not be necessary for communication via motional correlations. This is interesting in light of current theories of the ensemble nature of protein allosterism provided by Hilser and coworkers (Hilser, Wrabl, & Motlagh, 2012).
Figure 7.
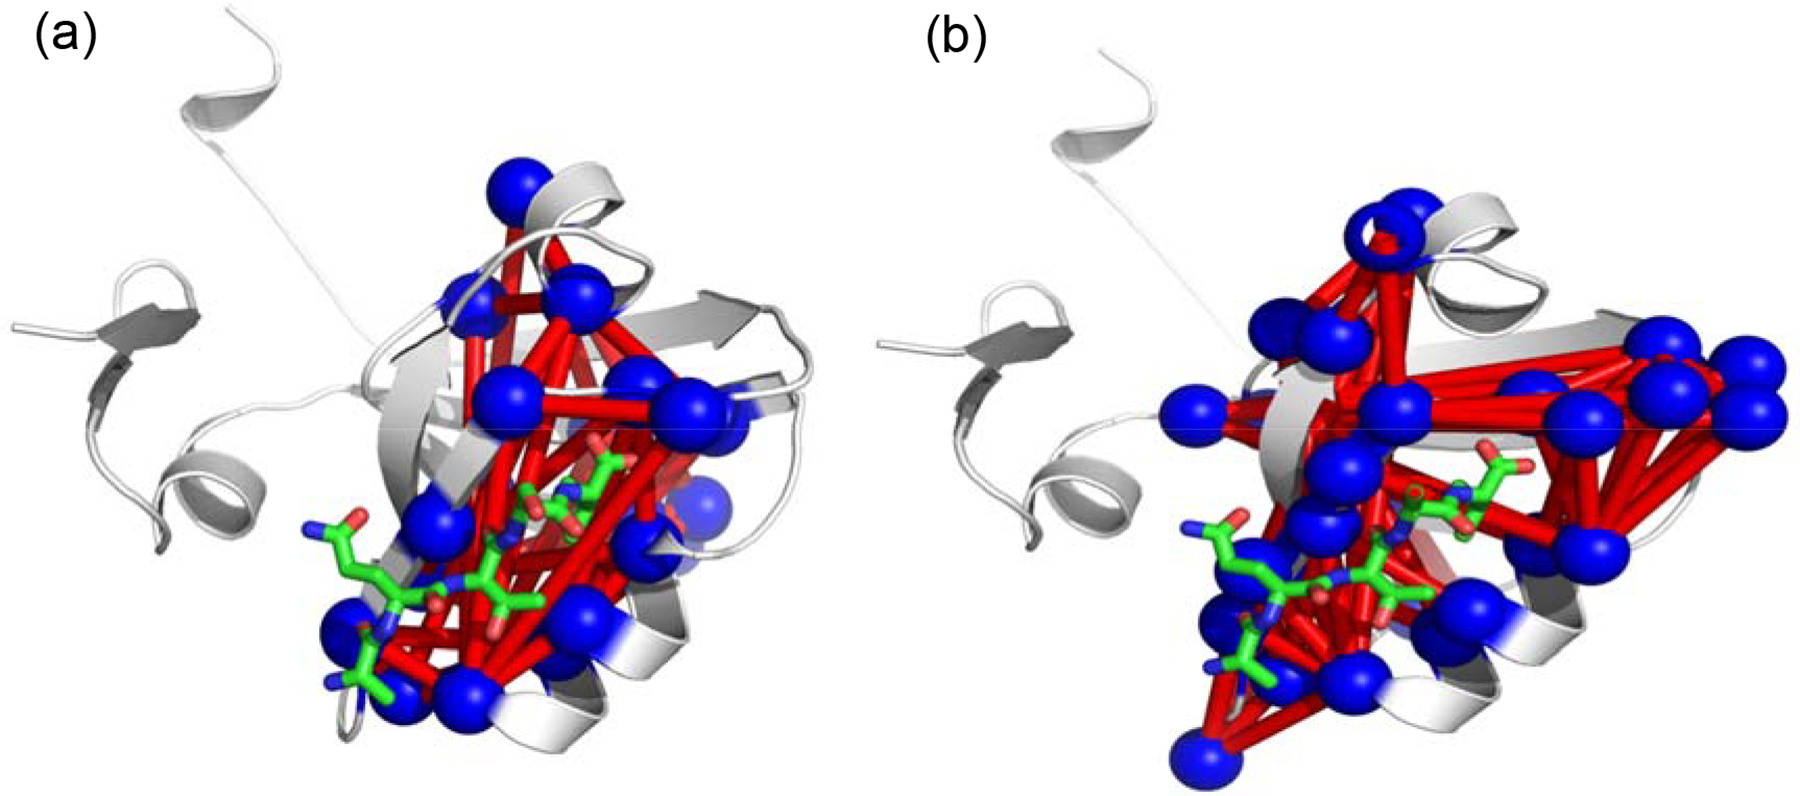
Pairwise links between a) MD and b) SCA sector residues, based on magnitude of correlations by residue. Plots were generated using the xPyder program (Pasi, Tiberti, Arrigoni, Papaleo, 2012)
3.3. MD Sectors for NBI energy correlations
The MD sector residues obtained from spectral analysis of the covariance of inter-residue non-bonded interaction (NBI) energy fluctuations is shown in Figure 8. A Venn diagram indicating the coincidences of sector residues obtained from SCA, MD, and the observed mutationally sensitive residues is shown in Figure 9. As in the related results of Kong and Karplus, (2007; 2009) the MD sector residues based on energy correlations show a somewhat different distribution from that of the motional correlations, and give results which are more consistent with observed NMR relaxation time measurements. The energy based MD sectors also show contiguity between the binding pocket and the allosteric site on PDZ3. Thus, MD sector analysis leads to the hypothesis of two different viable pathways of allosteric communication, one based on motional and one based on energetic correlations. Precedents for multiple pathways of allosteric communication in a protein have been compiled by Nussinov and co-workers (del Sol, Tsai, Ma & Nussinov, 2009). Some in the field also hold to the idea that allosteric communication is a collective property of the energy landscape of a protein, and thus distinct pathways of changes is not necessarily the way to look at the problem. Thayer and coworkers have estimated the plausibility of multiple means of allosteric communication within proteins from lattice models with PDZ as an example (Thayer, Galganov, & Stein, 2017).
Figure 8.
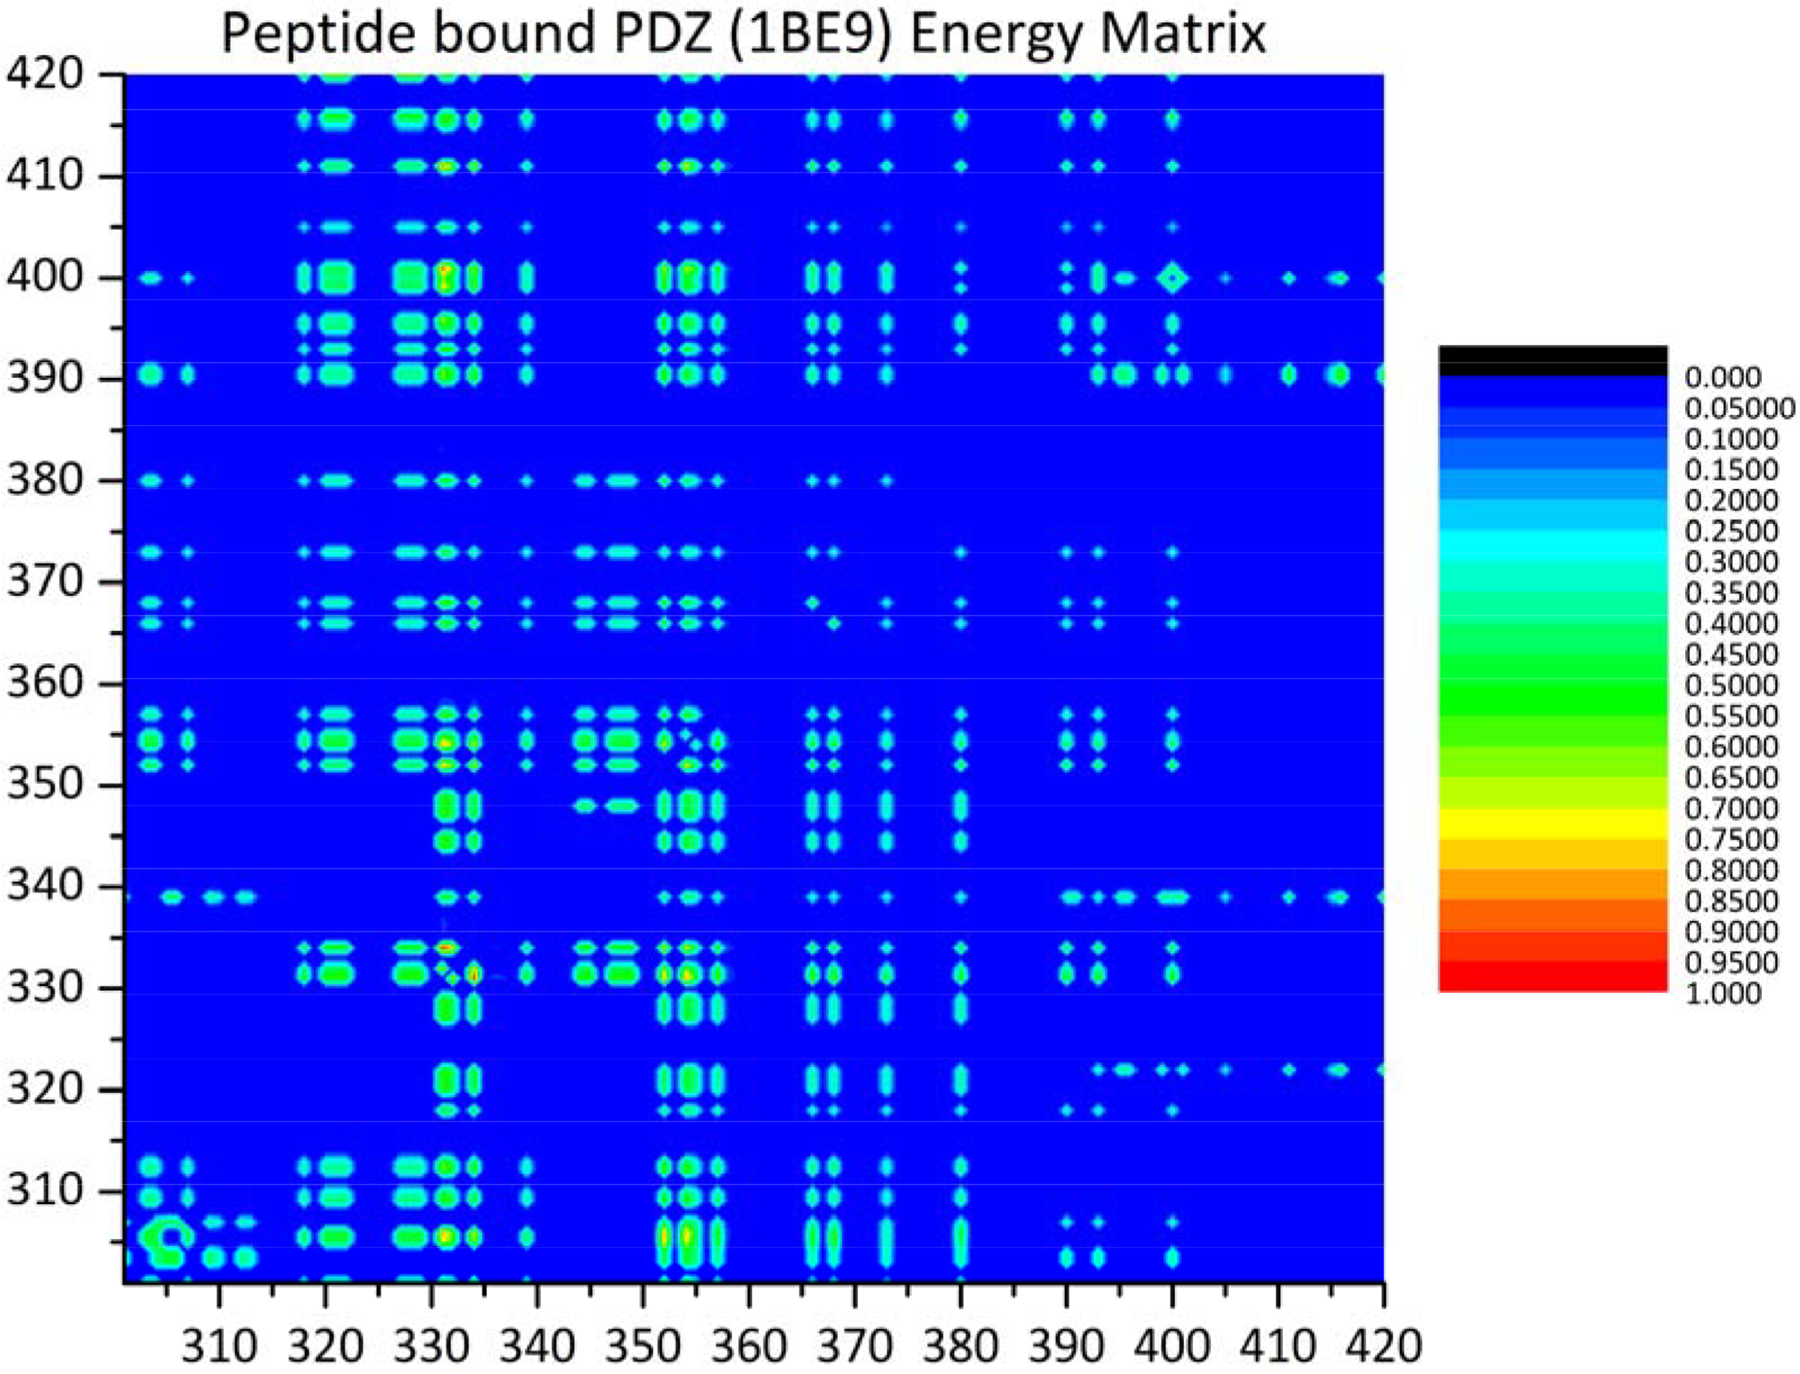
Heat map of the covariance matrix for fluctuations in MD calculated non-bonded interaction energies <Δεij > where i and j are running indices over amino acid residues in PDZ3.
Figure 9.
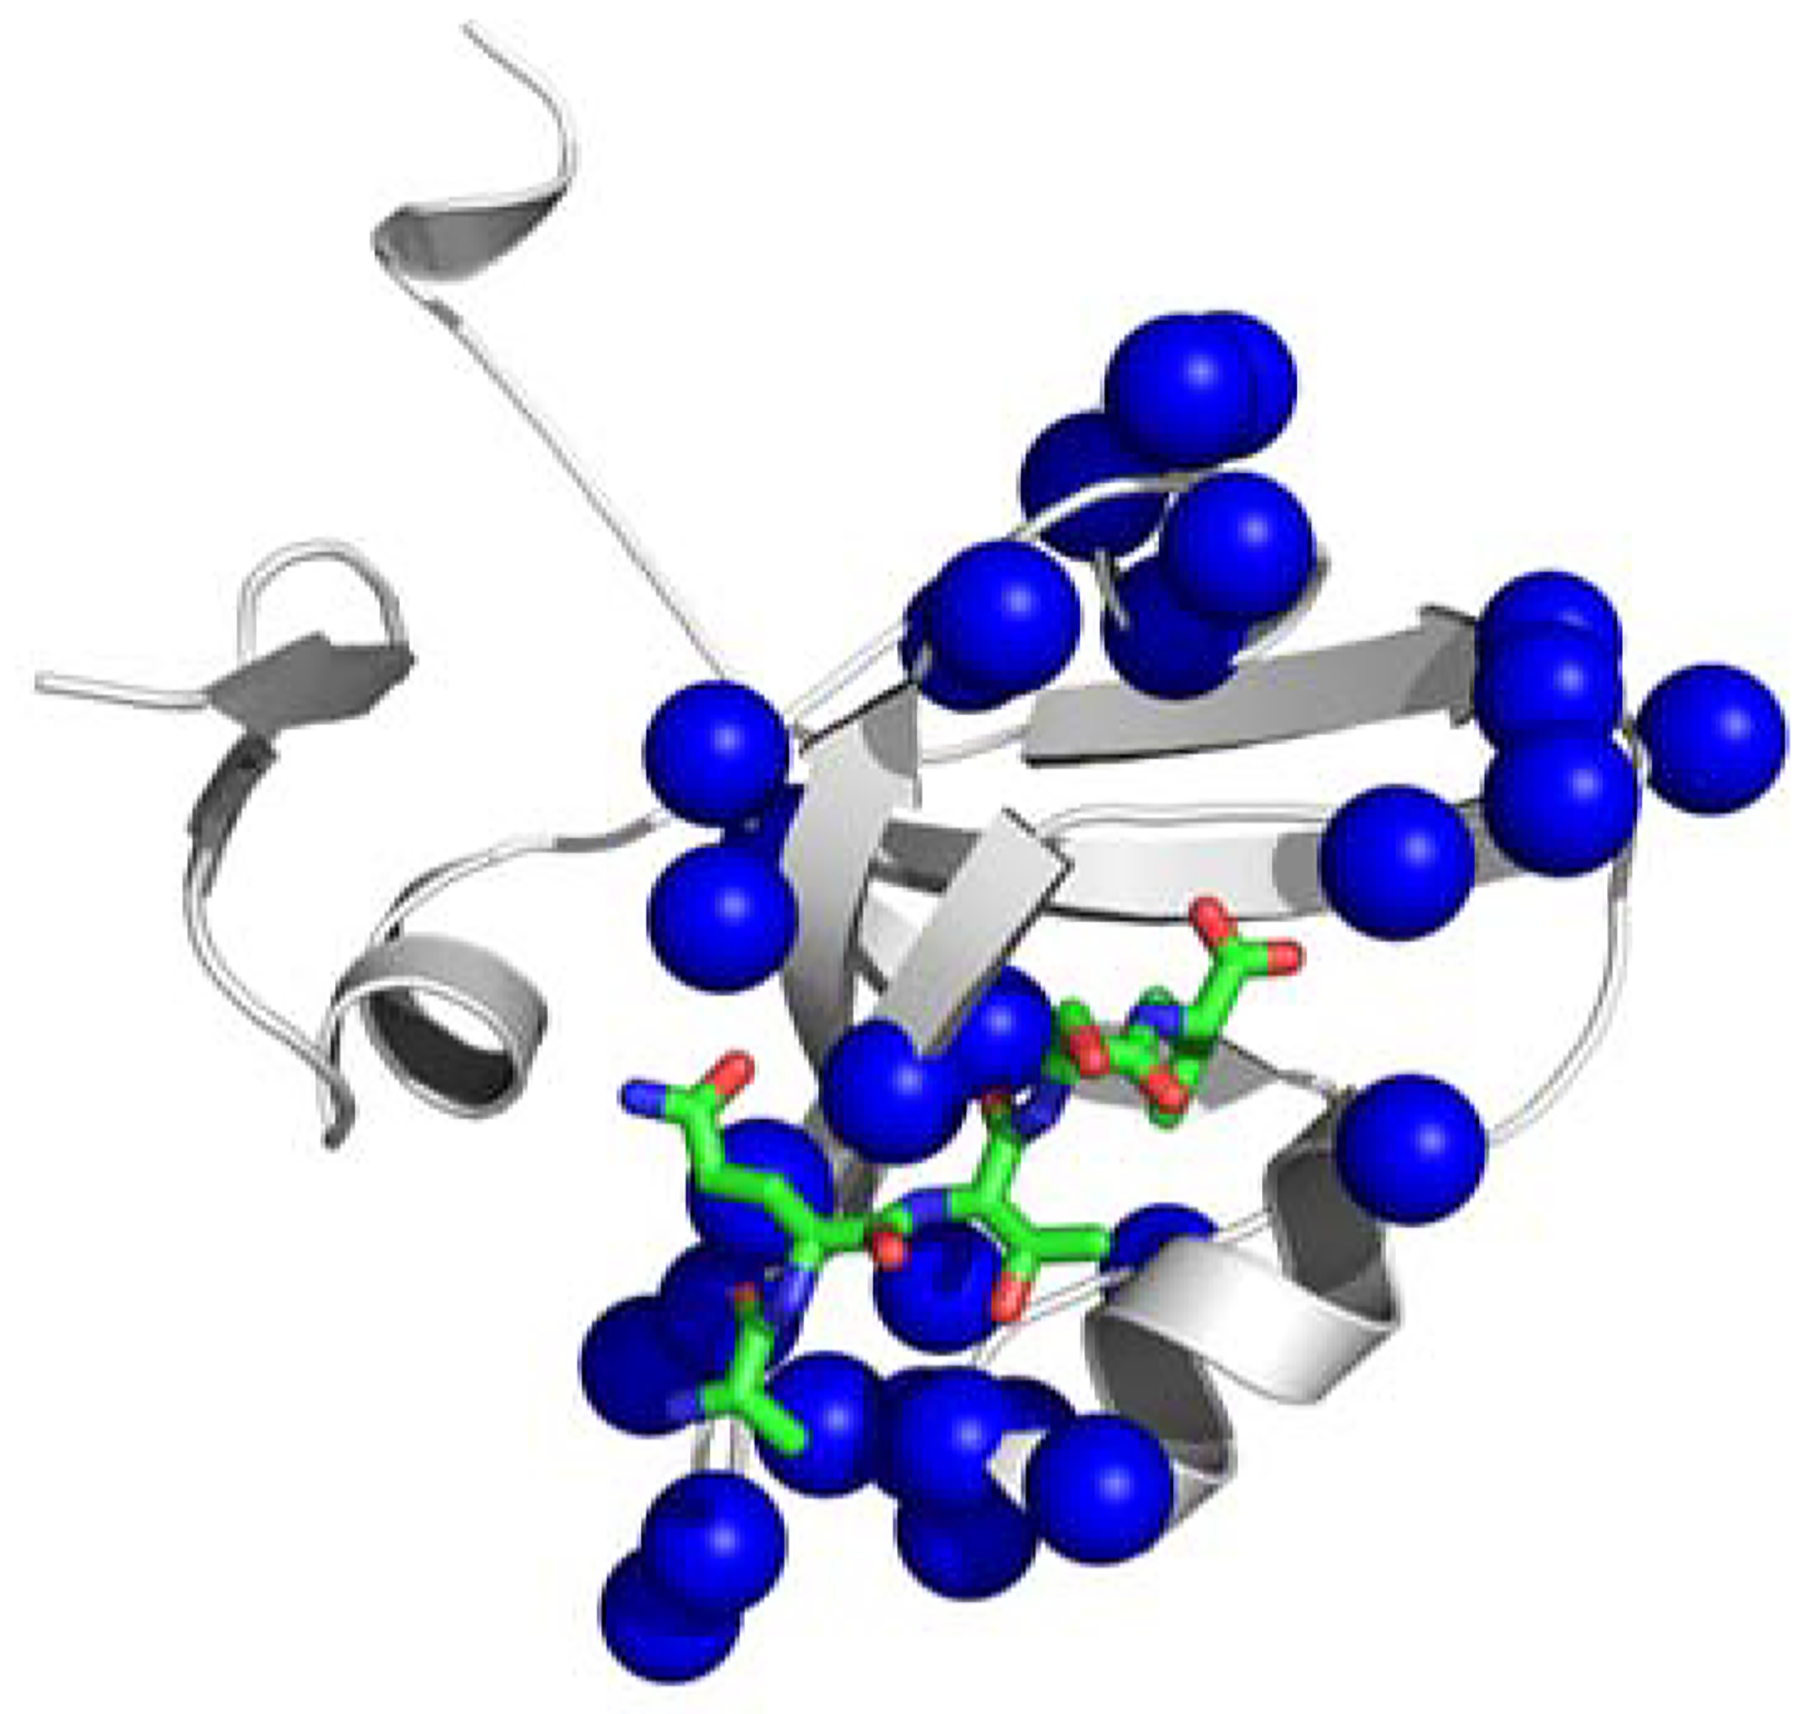
MD sector residues for PDZ3 based on fluctuations in non-bonded interaction energies <Δεij >. a) Individual sector residues shown as discrete blue spheres; b) collective surface representation of non-bonded interaction sector residues indicating extent of contiguity of <Δεin > sector residues.
3.4. Sectors obtained from Anisotropic Network Model Calculations
All-atom MD simulations are computationally intensive, and thus there is considerable interest in the extent to which MD results might coincide with those obtained much more rapidly with a coarser grained potential. Gur et al(Gur, Zomot & Bahar, 2013) have provided informative results on this issue in general, comparing micro- and milliseconds of all-atom MD with normal mode analysis (NMA) using the Anisotropic Network Model (ANM) (Eyal, Yang & Bahar, 2006). We obtained a motional correlation matrix for PDZ3 from NMA based on the ANM potential using the program ProDy from the Ivet Bahar Laboratory (Bakan, Meireles & Bahar, 2011) with default settings. We then calculated “ANM sectors” using a spectral decomposition analogous to that used in obtaining MD sectors. The result is shown in Figure 10. While a number of residues of SCA and MD sectors coincide with the ANM results, notably including the putative allosterism between H372 and the region of helices α1- β1 of PDZ3, there are also significant differences: certain residues in the binding pocket are not included in the ANM sector. However, ANM calculations do capture a considerable extent of the covariance in motions as calculated from all-atom MD. This is only the result of a single case; a more comprehensive study is required to take a well-informed position on this issue.
Figure 10.
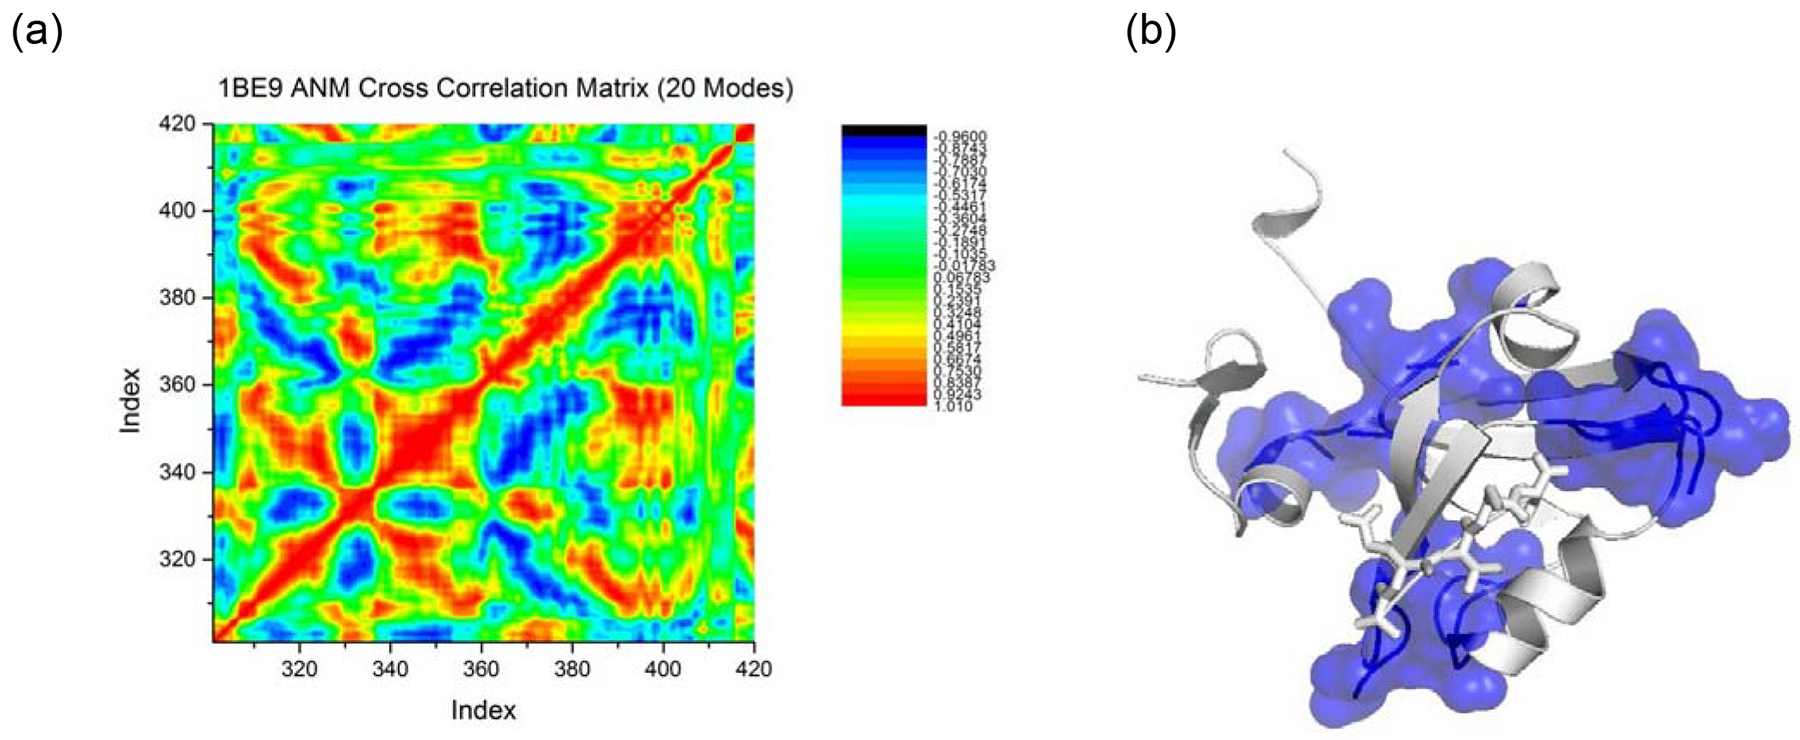
Results of sector Analysis of PDZ3 based on ANM calculations. a): ANM correlation matrix; b: sector residues obtained from ANM, in sphere and surface representations. All ANM calculations were carried out using ProDy (Bakan, Meireles & Bahar, 2011).
4. Discussion
In summary, we find that positions of PDZ3 obtained from spectral analysis of MD covariance matrix predicts a network of residues that are viable candidates for supporting allostery and cooperative effects in general. The MD calculated sector residues correspond well with experimentally observed MSR on PDZ domains, and show considerable coincidence with those obtained by SCA analysis. Since these results are achieved by independent methods, the correspondence we find among predictions based on MD sectors, SCA sectors and MSR is not likely to be fortuitous, and provides leading evidence that SCA sectors arise to some extent from correlations dynamical fluctuations.
MD sector residues calculated based on the covariance of the fluctuations of non-bonded interaction energies proposes two possible pathways of communication, which is supported by NMR relaxation experiments on related PDZ domains. This expands on the proposition of Nussinov and co-workers (Gunasekeran, Ma, & Nussinov, 2004) that all proteins are capable of allosterism to include the possibility that different mechanisms of signal transmission may be available for allosterism within a protein. The results presented herein are based only a single case study and consideration of more and diverse systems will be necessary to make any general conclusions. Also, we must stress that the connection between allosterism and either MD or SCA sectors or the results of any other coupled site prediction method with allosterism is heuristic approach to generating hypotheses. All that is actually required for allosterism in proteins is an effector ligand binding which perturbs the free energy landscape such that the activity at a distal functional site is modulated. While one or more pathways may be involved, this is not unequivocally established and the idea that allosterism is a collective property of amino acid residues, i.e. an energy landscape model. In any case, we feel the results presented here provide support for the idea that protein sectors obtained ab initio from MD simulations on proteins and other biological macromolecules is well worth pursuing, and has the potential to open up a significant new approach to the theoretical analysis of cooperativity and allosterism from the dynamical structure of proteins.
The task of identifying the composition of cooperative networks in proteins in general is a formidable task, and we do not presume to have solved this problem. For one thing there is no guarantee that evolutionary covariance from SCA and the covariance of motional or energetic covariance from MD captures all of the factors which make up the cooperative behavior in a protein. There is an implicit redundancy in the sector paradigm as derived from covariance matrices, since a strong signal can be obtained by one or two large matrix elements or a large number of small ones. A good feature is that a sector representation transcends pairwise additivity, since spectral analysis is an operation on the entire covariance.
5. Conclusions
We note in concluding that we have recently obtained MD sectors for several more proteins, including U1A, p53, DHFR and MutS. These results are available in the Wesleyan University PhD thesis of Dr. Bharat Lakhani (Lakhani, 2017), and are now being prepared for publication. We have recently applied the MD sector analysis to a study of allostery in the 1500 residue DNA repair protein MutS (Lakhani, Thayer, Hingorani & Beveridge, 2017) In this latter study we have obtained explicit computational evidence that MD sectors do comprise a network which exhibits cooperative effects. The MD trajectories on PDZ3 in the present investigation have also formed the basis for a study of the role of induced fit and conformational selection in protein ligand binding and allosterism using Markov State Models (Thayer, Lakhani, & Beveridge, 2017).
Acknowledgements
The authors would like to thank Carol Post for sharing code for computing motional covariance, and Henk Meij for technical support using Wesleyan’s High Performance Computing Center. This work was supported by NIH grant R15 GM12802-01.
Funding
This work was supported by NIH T32 GM008271 (Molecular Biophysics Training Grant), and by NSF grants CNS-0619508 and CNS-0959856 (Wesleyan University High Performance Computer Center).
Abbreviations:
- ANM
Anisotropic Network Model
- MD
Molecular dynamics simulation
- MSR
Mutationally Sensitive Residues
- NBI
non-bonded interaction
- SCA
statistical coupling Analysis
Footnotes
Disclosure statement
No potential conflict of interest was reported by the authors.
References
- Acuner Ozbabacan SE, Gursoy A, Keskin O & Nussinov R (2010). Conformational ensembles, signal transduction and residue hot spots: application to drug discovery. Curr Opin Drug Discov Devel 13, 527–537. [PubMed] [Google Scholar]
- Bakan A, Meireles LM & Bahar I (2011). ProDy: protein dynamics inferred from theory and experiments. Bioinformatics 27, 1575–1577. [DOI] [PMC free article] [PubMed] [Google Scholar]
- Bhattacharyya M, Upadhyay R & Vishveshwara S (2012). Interaction Signatures Stabilizing the NAD(P)-Binding Rossmann Fold, A Structure Network Approach. PloS one 7. [DOI] [PMC free article] [PubMed] [Google Scholar]
- Bowerman S & Wereszczynski J (2016). Detecting Allosteric Networks Using Molecular Dynamics Simulation. Methods in enzymology 578, 429–447. [DOI] [PMC free article] [PubMed] [Google Scholar]
- Case DA, D. TA, Cheatham TE III, Simmerling CL, Wang J, Duke RE, Luo R, Walker RC, Zhang W, Merz KM, Roberts B, Hayik S, Roitberg A, Seabra G, Swails J, Goetz AW, Kolossváry I, Wong KF, Paesani F, Vanicek J, Wolf RM, Liu J, Wu X, Brozell SR, Steinbrecher T, Gohlke H, Cai Q, Ye X, Wang J, Hsieh M-J, Cui G, Roe DR, Mathews DH, Seetin MG, Salomon-Ferrer R, Sagui C, Babin V, Luchko T, Gusarov S, Kovalenko A, Kollman PA (2012). AMBER 12, University of California, San Francisco. [Google Scholar]
- del Sol A, Tsai CJ, Ma B & Nussinov R (2009). The origin of allosteric functional modulation: multiple pre-existing pathways. Structure 17, 1042–1050. [DOI] [PMC free article] [PubMed] [Google Scholar]
- Doyle DA, Lee A, Lewis J, Kim E, Sheng M & MacKinnon R (1996). Crystal structures of a complexed and peptide-free membrane protein-binding domain: molecular basis of peptide recognition by PDZ. Cell 85, 1067–1076. [DOI] [PubMed] [Google Scholar]
- Eyal E, Yang LW & Bahar I (2006). Anisotropic network model: systematic evaluation and a new web interface. Bioinformatics 22, 2619–2627. [DOI] [PubMed] [Google Scholar]
- Gerek ZN & Ozkan SB (2011). Change in allosteric network affects binding affinities of PDZ domains: analysis through perturbation response scanning. PLoS Comput Biol 7, e1002154. [DOI] [PMC free article] [PubMed] [Google Scholar]
- Gianni S, Walma T, Arcovito A, Calosci N, Bellelli A, Engstrom A, Travaglini-Allocatelli C, Brunori M, Jemth P & Vuister GW (2006). Demonstration of long-range interactions in a PDZ domain by NMR, kinetics, and protein engineering. Structure 14, 1801–1809. [DOI] [PubMed] [Google Scholar]
- Goodey NM & Benkovic SJ (2008). Allosteric regulation and catalysis emerge via a common route. Nature Chemical Biology 4, 474–482. [DOI] [PubMed] [Google Scholar]
- Gunasekeran K, Ma B, & Nussinov R (2004). Is allostery an intrinsic property of all dynamic proteins? Proteins 57, 433–443. [DOI] [PubMed] [Google Scholar]
- Gur M, Zomot E & Bahar I (2013). Global motions exhibited by proteins in micro- to milliseconds simulations concur with anisotropic network model predictions. J Chem Phys 139, 121912. [DOI] [PMC free article] [PubMed] [Google Scholar]
- Halabi N, Rivoire O, Leibler S & Ranganathan R (2009). Protein sectors: evolutionary units of three-dimensional structure. Cell 138, 774–786. [DOI] [PMC free article] [PubMed] [Google Scholar]
- Harte WE Jr., Swaminathan S, Mansuri MM, Martin JC, Rosenberg IE & Beveridge DL (1990). Domain Communication in the Dynamical Structure of Human Immunodeficiency Virus 1 Protease. Proc. Natl. Acad. Sci. (USA) 87, 8864–8868. [DOI] [PMC free article] [PubMed] [Google Scholar]
- Hertig S, Latorraca NR & Dror RO (2016). Revealing Atomic-Level Mechanisms of Protein Allostery with Molecular Dynamics Simulations. PLoS Comput Biol 12, e1004746. [DOI] [PMC free article] [PubMed] [Google Scholar]
- Hilser VJ, Wrabl JO & Motlagh HN (2012). Structural and energetic basis of allostery. Annual review of biophysics 41, 585–609. [DOI] [PMC free article] [PubMed] [Google Scholar]
- Ho BK & Agard DA (2009). Probing the flexibility of large conformational changes in protein structures through local perturbations. PLoS Comput Biol 5, e1000343. [DOI] [PMC free article] [PubMed] [Google Scholar]
- Hornak V, Abel R, Okur A, Strockbine B, Roitberg A & Simmerling C (2006). Comparison of multiple amber force fields and development of improved protein backbone parameters. Proteins-Structure Function and Bioinformatics 65, 712–725. [DOI] [PMC free article] [PubMed] [Google Scholar]
- Huang W, Nussinov R & Zhang J (2017). Computational Tools for Allosteric Drug Discovery: Site Identification and Focus Library Design. Methods Mol Biol 1529, 439–446. [DOI] [PMC free article] [PubMed] [Google Scholar]
- Hunenberger PH, Mark AE & van Gunsteren WF (1995). Fluctuation and Cross-correlation Analysis of Protein Motions Observed in Nanosecond Molecular Dynamics Simulations. Journal of Molecular Biology 252, 492–503. [DOI] [PubMed] [Google Scholar]
- Ichiye T, Olafson BD, Swaminathan S & Karplus M (1986). Structure and internal mobility of proteins, a molecular dynamics study of hen egg white lysozyme. Biopolymers 25, 1909–1937. [DOI] [PubMed] [Google Scholar]
- Jorgensen WL (1981). Transferable Intermolecular Potential Functions. Application to Liquid Methanol Including Internal Rotation. J. Am. Chem. Soc 103, 341–345. [Google Scholar]
- Jorgensen WL, Chandrasekhar J, Madura JD, Impey RW & Klein ML (1983). Comparison of Simple Potential Functions for Simulating Liquid Water. Journal of Chemical Physics 79, 926–936. [Google Scholar]
- Joung IS & Cheatham TE 3rd (2008). Determination of alkali and halide monovalent ion parameters for use in explicitly solvated biomolecular simulations. The journal of physical chemistry. B 112, 9020–9041. [DOI] [PMC free article] [PubMed] [Google Scholar]
- Kong YF & Karplus M (2007). The signaling pathway of rhodopsin. Structure 15, 611–623. [DOI] [PubMed] [Google Scholar]
- Kong YF & Karplus M (2009). Signaling pathways of PDZ2 domain, A molecular dynamics interaction correlation analysis. Proteins-Structure Function and Bioinformatics 74, 145–154. [DOI] [PMC free article] [PubMed] [Google Scholar]
- Kulp JL 3rd, Cloudsdale IS, Kulp JL Jr. & Guarnieri F (2017). Hot-spot identification on a broad class of proteins and RNA suggest unifying principles of molecular recognition. PloS one 12, e0183327. [DOI] [PMC free article] [PubMed] [Google Scholar]
- Studies of Protein Cooperativity and Allosterism Molecular Biology. Middletown, CT, Wesleyan University; PhD. [Google Scholar]
- Lakhani B, Thayer KM, Hingorani MM & Beveridge DL (2017). Evolutionary Covariance Combined with Molecular Dynamics Predicts a Framework for Allostery in the MutS DNA Mismatch Repair Protein. The journal of physical chemistry. B 121, 2049–2061. [DOI] [PMC free article] [PubMed] [Google Scholar]
- Liu J & Nussinov R (2016). Allostery: An Overview of Its History, Concepts, Methods, and Applications. PLoS Comput Biol 12, e1004966. [DOI] [PMC free article] [PubMed] [Google Scholar]
- Marcelino AM, Smock RG & Gierasch LM (2006). Evolutionary coupling of structural and functional sequence information in the intracellular lipid-binding protein family. Proteins-Structure Function and Bioinformatics 63, 373–384. [DOI] [PubMed] [Google Scholar]
- McCAmmon JA & Harvey SC (1987). Dynamics of Proteins and Nucleic Acids, Cambridge University Press. [Google Scholar]
- McLaughlin RN Jr., Poelwijk FJ, Raman A, Gosal WS & Ranganathan R (2012). The spatial architecture of protein function and adaptation. Nature 491, 138–142. [DOI] [PMC free article] [PubMed] [Google Scholar]
- Ota N & Agard DA (2005). Intramolecular signaling pathways revealed by modeling anisotropic thermal diffusion. J Mol Biol 351, 345–354. [DOI] [PubMed] [Google Scholar]
- Pasi M, Tiberti M, Arrigoni A & Papaleo E (2012). xPyder: A PyMOL Plugin To Analyze Coupled Residues and Their Networks in Protein Structures. Journal of Chemical Information and Modeling 52, 1865–1874. [DOI] [PubMed] [Google Scholar]
- Peterson FC, Penkert RR, Volkman BF & Prehoda KE (2004). Cdc42 regulates the Par-6 PDZ domain through an allosteric CRIB-PDZ transition. Molecular cell 13, 665–676. [DOI] [PubMed] [Google Scholar]
- Petit CM, Zhang J, Sapienza PJ, Fuentes EJ & Lee AL (2009). Hidden dynamic allostery in a PDZ domain. Proceedings of the National Academy of Sciences of the United States of America 106, 18249–18254. [DOI] [PMC free article] [PubMed] [Google Scholar]
- Qiao Y, Xiong Y, Gao H, Zhu X & Chen P (2018). Protein-protein interface hot spots prediction based on a hybrid feature selection strategy. BMC Bioinformatics 19, 14. [DOI] [PMC free article] [PubMed] [Google Scholar]
- Reynolds KA, McLaughlin RN & Ranganathan R (2011). Hot Spots for Allosteric Regulation on Protein Surfaces. Cell 147, 1564–1575. [DOI] [PMC free article] [PubMed] [Google Scholar]
- Rivoire O, Reynolds KA & Ranganathan R (2016). Evolution-Based Functional Decomposition of Proteins. PLoS Comput Biol 12, e1004817. [DOI] [PMC free article] [PubMed] [Google Scholar]
- Roy A & Post CB (2012). Detection of Long-Range Concerted Motions in Protein by a Distance Covariance. Journal of chemical theory and computation 8, 3009–3014. [DOI] [PMC free article] [PubMed] [Google Scholar]
- Rueda M, Ferrer-Costa C, Meyer T, Perez A, Camps J, Hospital A, Gelpi JL & Orozco M (2007). A consensus view of protein dynamics. Proc Natl Acad Sci U S A 104, 796–801. [DOI] [PMC free article] [PubMed] [Google Scholar]
- Sharp K & Skinner JJ (2006). Pump-probe molecular dynamics as a tool for studying protein motion and long range coupling. Proteins-Structure Function and Bioinformatics 65, 347–361. [DOI] [PubMed] [Google Scholar]
- Smock RG & Gierasch LM (2009). Sending signals dynamically. Science 324, 198–203. [DOI] [PMC free article] [PubMed] [Google Scholar]
- Suel GM, Lockless SW, Wall MA & Ranganathan R (2003). Evolutionarily conserved networks of residues mediate allosteric communication in proteins. Nature Structural Biology 10, 59–69. [DOI] [PubMed] [Google Scholar]
- Swain JF & Gierasch LM (2006). The changing landscape of protein allostery. Curr Opin Struct Biol 16, 102–108. [DOI] [PubMed] [Google Scholar]
- Tesileanu T, Colwell LJ & Leibler S (2015). Protein sectors: statistical coupling analysis versus conservation. PLoS Comput Biol 11, e1004091. [DOI] [PMC free article] [PubMed] [Google Scholar]
- Thayer KM, Galganov JC, & Stein AJ (2017). Dependence of prevalence of contiguous pathways in proteins on structural complexity. PLoS One 12, e0188616. [DOI] [PMC free article] [PubMed] [Google Scholar]
- Thayer KM, Lakhani B & Beveridge DL (2017). Molecular Dynamics-Markov State Model of Protein Ligand Binding and Allostery in CRIB-PDZ: Conformational Selection and Induced Fit. The journal of physical chemistry. B 121, 5509–5514. [DOI] [PubMed] [Google Scholar]
- Tse A & Verkhivker GM (2015). Molecular Determinants Underlying Binding Specificities of the ABL Kinase Inhibitors: Combining Alanine Scanning of Binding Hot Spots with Network Analysis of Residue Interactions and Coevolution. PloS one 10, e0130203. [DOI] [PMC free article] [PubMed] [Google Scholar]
- van den Berk LC, van Ham MA, te Lindert MM, Walma T, Aelen J, Vuister GW & Hendriks WJ (2004). The interaction of PTP-BL PDZ domains with RIL: an enigmatic role for the RIL LIM domain. Mol Biol Rep 31, 203–215. [DOI] [PubMed] [Google Scholar]
- Wagner JR, Lee CT, Durrant JD, Malmstrom RD, Feher VA & Amaro RE (2016). Emerging Computational Methods for the Rational Discovery of Allosteric Drugs. Chem Rev 116, 6370–6390. [DOI] [PMC free article] [PubMed] [Google Scholar]
- Wei G, Xi W, Nussinov R & Ma B (2016). Protein Ensembles: How Does Nature Harness Thermodynamic Fluctuations for Life? The Diverse Functional Roles of Conformational Ensembles in the Cell. Chem Rev 116, 6516–6551. [DOI] [PMC free article] [PubMed] [Google Scholar]
- Whitney DS, Peterson FC, Kovrigin EL & Volkman BF (2013). Allosteric activation of the Par-6 PDZ via a partial unfolding transition. J Am Chem Soc 135, 9377–9383. [DOI] [PMC free article] [PubMed] [Google Scholar]
- Zerbe BS, Hall DR, Vajda S, Whitty A & Kozakov D (2012). Relationship between Hot Spot Residues and Ligand Binding Hot Spots in Protein–Protein Interfaces. Journal of Chemical Information and Modeling 52, 2236–2244. [DOI] [PMC free article] [PubMed] [Google Scholar]
- Zhang H, Jiang T & Shan G (2016). Identification of Hot Spots in Protein Structures Using Gaussian Network Model and Gaussian Naive Bayes. Biomed Res Int 2016, 4354901. [DOI] [PMC free article] [PubMed] [Google Scholar]
- Zhang J, Sapienza PJ, Ke H, Chang A, Hengel SR, Wang H, Phillips GN & Lee AL (2010). Crystallographic and nuclear magnetic resonance evaluation of the impact of peptide binding to the second PDZ domain of protein tyrosine phosphatase 1E. Biochemistry 49, 9280–9291. [DOI] [PMC free article] [PubMed] [Google Scholar]
- Zuckerman DM (2011). Equilibrium sampling in biomolecular simulations. Annual review of biophysics 40, 41–62. [DOI] [PMC free article] [PubMed] [Google Scholar]


