

Abstract
Background.
Newer analytic approaches for developing predictive models provides a method of creating decision support to translate findings into practice.
Objectives.
To develop and validate a clinically interpretable predictive model for 12-month mortality risk among community-dwelling older adults using routinely collected nursing assessment data to aide homecare nurses in identifying older adults who are at risk for decline, providing an opportunity to develop care plans that support patient and family goals for care.
Methods.
A retrospective secondary analysis of Medicare and Medicaid data of 635,590 Outcomes Assessment and Information Set (OASIS-C) start-of-care assessments from 1/1/2012 – 12/31/2012 were linked to the Master Beneficiary Summary File (2012–2013) for date-of-death. Decision tree, benchmarked against gold standards for predictive modeling, logistic regression and artificial neural network (ANN). The models underwent k-fold cross-validation and were compared using AUC and other data science metrics.
Results.
Decision tree variables associated with 12-month mortality risk included: Age, (M1034) Overall status, (M1800–1890) ADL Total Score, Cancer, Frailty, (M1410) Oxygen, and (M2020) Oral Medication Management. The final models had good discrimination: decision tree, AUC = .71, 95% CI [.705, .712], sensitivity = .73, specificity = .58, MCC = .31; ANN, AUC = .74, 95% CI [.74, .74], sensitivity = .68, specificity = .68, MCC = .35 and logistic regression, AUC = .74, 95% CI [.735, .742], sensitivity=.64, specificity = .70, MCC = .35.
Discussion.
The AUC and 95% CI for the decision tree are slightly less accurate than logistic regression and ANN, however, decision tree was more accurate in detecting mortality. The OASIS data set was useful to predict 12-month mortality risk. Decision tree is an interpretable predictive model developed from routinely collected nursing data that may be incorporated into routine care as a decision support tool to identify older adults at risk for death.
Keywords: Decision trees; Informatics; Predictive Modeling; Machine Learning, End of Life Care; Precision Health; Decision Support
Identifying individuals who are nearing the end-of-life (EOL) is becoming increasingly complex because people are living longer with multiple chronic illnesses and frailty, making it difficult to know when care interventions may become futile (Aldridge & Bradley, 2017; Bandeen-Roche et al., 2015). Targeting individuals who are most at risk for poor health outcomes improves concordance between stated preferences for EOL care and future care decisions (Auriemma et al., 2014). However, efforts to prevent unnecessary treatment by increasing the rates above 40% of advance care plans (ACP), written documents that outline serious illness goals of care, have been relatively unsuccessful (Institute of Medicine [IOM], 2014; Yadav et al., 2017). It is possible this partly due to failures in identifying the right individuals at the right time who would benefit the most from having EOL conversations (Billings & Bernacki, 2014; Yadav et al., 2017). Precision health initiatives, which aim to engage patients in maintaining their own health (Gambhir, Ge, Vermesh, & Spitler, 2018), may also empower them to complete an ACP by providing timely, actionable knowledge of risk, thereby providing an opportunity to discuss EOL goals for care before significant decline.
Approximately 4.9 million people in the US received home healthcare in 2013 and these numbers are growing (Harris-Kojetin et al., 2016). By the year 2030, the Centers for Disease Control (CDC) estimates that the number of Americans who will be over the age of 65 will double, amounting to 72 million people, or about 20% of the population (Centers for Disease Control and Prevention [CDC], 2013). Currently, two out of three older adults are living with multiple chronic conditions, which increases their chances of unnecessary hospitalizations, non-beneficial treatments, poor health outcomes, and death (Cardona-Morell et al, 2016; CDC, 2013). Predictive modeling may help homecare nurses identify older adults who are at risk for decline, providing an opportunity to raise the issue of limited life expectancy and potentially develop personalized care plans that support patient and family preferences for serious illness goals for care. However, there are few resources available for providers to use to evaluate the risk for decline among older adults who live at home (Yourman, Lee, Schonberg, Widera, & Smith, 2012).
Nurses have been collecting and reporting structured health assessment data that is specific to the home environment to the Centers for Medicare and Medicaid Services (CMS) since 1999 using the home health Outcome and Assessment Information Set (OASIS) (Centers for Medicare and Medicaid Services [CMS], 2018a). The OASIS contains health assessment information for documenting clinical assessments, evaluating outcomes, and facilitating care planning activities in licensed homecare agencies (CMS, 2018a). Utilizing routinely collected population-level OASIS data to develop an interpretable clinical prediction algorithm for mortality risk may facilitate the integration of a risk assessment tool into everyday workflows to support clinical decision-making. By recognizing mortality risk, homecare nurses may be able to identify community-dwelling older adults who have a higher probability of hospitalization or death within the next year than other older adults receiving homecare services.
The Data, Information, Knowledge, Wisdom (DIKW) framework underpins this study (Matney, Avant, & Staggers, 2016). The DIKW postulates that wisdom in nursing may be derived from the hierarchical progression of data symbols, that in combination contribute to the nurses’ ability to “evaluate information and knowledge within the context of caring, and use judgement to make care decisions” (Matney et al., 2016, para. 21). In 2003, Lunney and colleagues examined population-level survey data to identify patterns of functional decline in community-dwelling older adults during the year leading up to death. This seminal research laid the groundwork to guide inquiries using other large datasets and to gain insights into how needs change as a person approaches death. In another study, Davis and colleagues (2016) identified High Persistent, Moderate Persistent, Progressive, and Late Rise spending patterns among Medicare decedents in the last year of life using administrative claims data for over a million beneficiaries. Similarly, administrative claims data were used to segment the population based on disease group (chronic disease, system failure, or cancer) and revealed distinctly different cost trajectories during terminal decline (Sullivan, Li, Wu, & Hewner, 2017). Moreover, a recent systematic review identified six prognostic indices for community-dwelling older adults (Yourman et al., 2012). These studies demonstrated the value of using large data sets, but were limited in subsequent use in practice.
In 2011, Westra and colleagues used data science approaches comparing machine learning methods to logistic regression for predicting medication management outcomes in older adults receiving homecare. The investigators found that the final models were similar in their predictive ability, and nurses preferred rules-based and decision tree algorithms to support clinical decision-making. This is an important consideration as prognostication tools for evaluating functional decline of older adults have been developed but not widely adopted because they are difficult to integrate into clinical workflows, so they are less likely to influence clinician behavior and effect patient outcomes (Yourman et al., 2012). These prior studies suggest that there is an opportunity to use data-driven approaches to improve health outcomes for community-dwelling older adults and inform nursing wisdom (Matney et al., 2016).
Objectives
The objective of this study is to compare two machine learning approaches with logistic regression to develop and validate a predictive model for identifying 12-month mortality risk among homebound older adults. The purpose of the predictive model is to provide a clinically interpretable clinical decision support tool for 12-month mortality risk for use by nurses to prompt discussions about serious illness goals for care. The research question addressed in this paper is: What machine learning methods yield a parsimonious and clinically interpretable decision support algorithm for use in identifying mortality risk in community dwelling older adults?
Methods
This data modeling study employed a retrospective secondary analysis of the OASIS after linking it to the Master Beneficiary Summary File (MBSF) (CMS, 2018a; Research Data Assistance Center [ResDAC], 2017). Data modeling is an inductive mathematical approach for determining the probabilistic relationship that exists between variables (Grus, 2015). Two decision tree algorithms were developed and benchmarked against the gold standard for prediction among machine learning approaches (artificial neural network [ANN]) and with the gold standard statistical approach for predicting health outcomes, logistic regression (Tabachnick & Fidell, 2013). For the purposes of this study, 12-month mortality risk is defined as the probability that a person will be “not alive” at 12-months from the initial OASIS assessment. The University at Buffalo, State University of New York internal review board (IRB) approved this study and determined it to be non-human subject research.
Sample
Data Collection.
The OASIS data file contains 11 domains and approximately 100 questions represented by 279 predictor variables. The MBSF contains Medicare beneficiary enrollment data, which contains the date of death (ResDAC, 2017). Both data files were obtained from the Centers from Medicare and Medicaid Services (CMS) in April 2017 with the assistance of the Research Data Assistance Center (ResDAC).
A nationally representative random sample of OASIS-C assessments (N=2,989,451) of 999,000 individual Medicare beneficiaries were received from CMS. OASIS-C assessments were included in the study if the individual was 65 years or older and had a start-of-care (SOC) completed between 1/1/2012 and 12/31/2012. The OASIS-C was linked to the MBSF, (1/1/2012 – 12/31/2013) using an encrypted, de-identified, beneficiary identification “BENE_ID” number provided by CMS. After linking the files on the BENE_ID and removing duplicates, the dataset was limited to the first SOC in 2012. The range in days from the initial SOC date to either the date of death or 12-months from the SOC date was calculated. The outcome variable was dichotomized based on the whether or not the individual was “alive” or “not alive” after one calendar year. After limiting the linked datasets to meet the inclusion criteria, and dichotomizing the outcome variable, 635,590 individual OASIS-C assessments remained, and 112,499 (17.7%) of the file contained individuals who were “not alive” at 12-months.
Next, three unique datasets were created that contained 100,000 randomly selected OASIS-C assessments, which were made up of an equal number of records for patients who were “alive” and “not alive” at 12-months (50,000 cases each). Three datasets were created so that it would become evident whether the model performance was stable across the random samples. It was necessary to over-sample the data for those who were “not alive” because of the imbalance in the outcomes, which can bias the model towards the majority class (Boughorbel, Jarray, & El-Anbari, 2017). Outliers were retained in the analysis, as there was no identifiable pattern of bias, and this nationally representative dataset exemplifies actual patient care, therefore there was no reasonable justification to remove them.
Data Analysis
Data Preprocessing.
All preprocessing and analytic steps in this study used Microsoft Access version 16, Microsoft Excel version 16, and SPSS Grad Pack 25.0 Premium (IBM SPSS, 2017). Preprocessing was conducted iteratively on the entire dataset to meet the assumptions of each analytic method prior to sampling and modeling. Data transformation and reduction decisions were based on a combination of statistical testing and content expertise. Descriptive statistics and correlational analysis were used to examine the data and prepare it for modeling. Prior to transforming any OASIS-C variable, each question was conceptually evaluated for relevance to the outcome “alive”/”not alive” by the first author who has an extensive background working with the OASIS-C in a clinical setting. For example, items used for billing purposes only were eliminated from the dataset. In addition, items that were highly correlated, such as Activity of Daily Living Status (ADL) (M1800–1890) were transformed into a total score (range 0–45), with a higher score indicating decreased functional status, and a weighted severity score was developed for pressure ulcers (M1300–1324) (Westra et al., 2011). The weighted severity score was calculated by multiplying the number of pressure ulcers with the associated stage and unobservable ulcers received an additional point. Therefore, if a person had one stage-two pressure ulcer, two stage-three pressure ulcers, and one unobservable pressure ulcer, the final weighted severity score would equal nine (Westra et al., 2011). Final candidate variables were then evaluated for clinical relevance by the first and second authors and a determination was made to include or exclude the variables. The candidate items were tested individually for their relationship with the outcome variable “alive”/”not alive” and retained if chi-square was significant at p < .01. The final data file contained 36 independent variables after all transformations were completed.
International Classification of Diseases (ICD-9) diagnostic codes in the OASIS-C for inpatient diagnosis or medical treatment change within the past 14 days (M1010 and M1016), and Primary and Payment Diagnoses (M1020-M1024), were combined and categorized into five groups using the COMPLEXedex algorithm (Hewner, Seo, Gothard, & Johnson, 2014). The COMPLEXedex was developed using the H-CUP-Clinical Classifications Software CCS categories available from the Agency for Health Research and Quality (Agency for Health Research and Policy, 2017, October). The algorithm categorizes ICD-9 codes into hierarchies of chronic disease groupings (No Chronic, Minor Chronic, Major Chronic, and System Failure) to classify the relative importance of 19-different combinations of multimorbidity. An updated, unpublished version of the COMPLEXedex that includes the following additional categories: Frailty, Behavioral Health, and Cancer, was also used to group the diagnoses codes.
Model Building using Machine Learning Approaches.
Machine learning is a mathematical approach where probabilistic models are learned from data with known outcomes that can be then applied to predict outcomes on unseen data (Grus, 2015). Machine learning includes classification, association analysis, clustering, and anomaly analysis, which are useful alternatives to traditional statistical approaches, as the algorithms have the capacity to identify non-linear patterns in data (Tan, Steinbach, & Kumar, 2006). In healthcare, machine learning models are emerging as powerful tools for predicting health outcomes such as the risk of dying (Luo et al., 2016).
A decision tree is a classification algorithm that takes a non-parametric approach to identify models that best fit the relationship between the OASIS-C predictor variables and outcome label (“alive”/”not alive”) by recursively dividing training data into increasingly purer subsets (Tan et al., 2006). The final model is visually represented as a tree-like hierarchy where each internal node creates a point for decision-making (yes/no) that can be followed from top to bottom and left to right until a terminal node containing the “pure” category (probability) of the predicted outcome is reached.
During model building, “decisions” are made by the algorithm based on a calculation of “impurity” and how much information is gained each time the data are split (Tan et al., 2006). There are two different decision tree classification algorithm options available in SPSS: the Chi-squared Automatic Interaction Detection (CHAID) and the Classification and Regression Tree (CRT). The CHAID algorithm chooses the predictor that has the strongest interaction with the outcome variable and the CRT algorithm maximizes node homogeneity to achieve purity (IBM SPSS, 2017). The CHAID algorithm determines the best split using p < .05 significance level and the Bonferroni correction. The CRT algorithm measures impurity using the Gini index to maximize homogeneity at each node. This study evaluates three randomly selected, balanced datasets (n=100,000) using nine separate experiments to determine if the models were stable across datasets. The experiments employed two decision tree classification algorithms (CHAID and CRT) which are grown to three, four, and five levels each, and the results are then compared and benchmarked with the gold standards, ANN (training and test), and logistic regression.
Artificial Intelligence, also known as an ANN, represent the most powerful of machine learning algorithms. ANNs work by changing the signal strength of the data as it passes through a “black box” that cannot be seen by the researcher. The automated process is similar to the fluctuation of synaptic transmissions in the brain that facilitates learning (Tan et al., 2006). However, the “black box” nature of the process makes it impossible to know how the algorithm reaches conclusions and the output is not easy to interpret, so it is a poor fit for the clinical setting, but it is useful for benchmarking.
Model Building using Logistic Regression.
Logistic Regression is a traditional statistical approach to data modeling that is used to determine the probabilistic relationship between predictor and dichotomous outcome variables. Logistic Regression has been used extensively in the biomedical sciences and is considered the gold standard for predicting the absence or presence of disease (Tabachnick & Fidell, 2013). Prior to sampling and analysis, the original data (N=635,590) were tested for meeting the statistical assumptions of logistic regression, which includes the presence of multi-collinearity, outliers, and linearity with the outcome variable. The Box-Tidwell procedure was used to assess the assumption of linearity of the continuous variables with respect to the logit of the dependent variable (“alive”/”not alive”) at 12 months. A Bonferroni correction was applied and statistical significance for accepting candidate terms for the model was adjusted to p < .001 (Laerd Statistics, 2015; Tabachnick & Fidell, 2013). The logistic regression model was built using a backwards stepwise approach.
Validity and Reliability
The OASIS was rigorously developed over 10 years at the University of Colorado in the 1990’s and has been updated several times since then (CMS, 2018a; CMS, 2018b; O’Connor & Davitt, 2012). This study uses the OASIS-C version. Most OASIS items report an inter-rater reliability Cohen’s Kappa minimum of .6 and a criterion validity of .49 – .71 (O’Connor & Davitt, 2012). The date of death provided by CMS was the only item retrieved from the MBSF.
The performance of the models across the three datasets were assessed by calculating sensitivity (TPR), specificity (TNR), positive predictive value (PPV), negative predictive value (NPV), Matthews Correlation Coefficient (MCC), and the Area under the Curve (AUC) with 95% Confidence Intervals (CIs) (Tan et al., 2006). Sensitivity (TPR) is defined as the proportion of cases that are correctly predicted by the model to be “not alive” at 12-months (Equation 1) (Laerd Statistics, 2015, Boughorbel et al., 2017). This metric is an indication of the ability of the model to correctly identify the item of interest (“not alive”) at one year. Specificity (TNR) indicates the proportion of people that were correctly predicted to not have the item of interest (“not alive”) at the end of the year (actual negatives) (Equation 2). These individuals, therefore, were both predicted to be, and actually were “alive” at one year. PPV and NPV indicate the ability of the model to predict presence or absence of the item of interest “alive”/”not alive,” compared to the total number of cases predicted to have or not have the characteristic, respectively (Equation 3, Equation 4). The quality, strength, and direction of relationship between observed and predicted binary classifications are measured using MCC, with possible scores ranging from −1 to 1 (Equation 5) (Boughorbel et al., 2017).
Equations
| 1. |
| 2. |
| 3. |
| 4. |
| 5. |
| 6. |
The AUC is a graphic representation of the tradeoff between the sensitivity (TPR) and false positive rate (FPR) of a classifier (Tan et al., 2006). The FPR is the probability of falsely rejecting the null hypothesis, or the probability of making a Type 1 error (Equation 6). A “perfect” AUC has a value of one and chance (random guess) has a value of .5. To measure model accuracy (goodness of fit), an AUC was generated based on the predicted probabilities of the outcome variable to assess discrimination for all methods (decision tree (CHAID/CRT), ANN, and logistic regression). Model discrimination was determined by the following AUC metrics: .50 to .59 indicates poor, .60 to .69 indicates moderate, .70 to .79 indicates good, .80 to .89 indicates very good, and .90 or greater, indicates excellent discrimination (Yourman et al., 2012).
The machine learning models were cross-validated in each of the three datasets by dividing them individually into training and test data samples using k-fold cross-validation methods. The decision tree algorithms (CHAID and CRT) were trained on 90% and tested on 10% of the data in each dataset #1–3 (n=100,000). K-fold cross validation is an automated, iterative process available in SPSS. The algorithm randomly divides the dataset into 10 subsamples. The first sample is set aside and a tree is created using all of the remaining cases. Next, a second tree is created from all of the cases except for those in the second fold. This process is repeated until all 10-folds have been cross-validated (k-fold). A misclassification risk error for each tree is estimated and a final tree model is produced based on an average risk estimate across of all of the trees (IBM SPSS, 2017). To cross-validate the ANN, each of the three datasets were split into a 70/30 ratio where the larger proportion was used to train the data and the remaining proportion was used to test the models. This process was repeated three times in each of the individual data samples.
Results
In this study, four models (CHAID, CRT, ANN, and logistic regression) for predicting 12-month mortality risk among community-dwelling, older adults were developed and validated across three independently sampled datasets #1–3. The study aimed to answer the research question: What machine learning methods yield a parsimonious and clinically interpretable decision support algorithm for use in identifying mortality risk in community dwelling older adults? The final data file (N = 635,590) from which three random samples of 100,000 OASIS-C assessments balanced for the outcome variable “alive”/”not alive” at 12 months included: 63.3% female, 79.7% White, 37.7% ages 75 – 84 years old, 28.3% Healthy, 39.1% At Risk, 28.3% had a Frailty Diagnosis, and 6% had Cancer (Table 1).
Table 1.
Demographic Information Datasets # 1–3
| Characteristic | Full Dataset (N=635,590) |
Dataset # 1 (n =100,000) |
Dataset # 2 (n=100,000) |
Dataset # 3 (n =100,000) |
||||
|---|---|---|---|---|---|---|---|---|
| Outcome | ||||||||
| Died_12 Mo | 112,153 | (17.7) | 50,000 | (50) | 50,000 | (50) | 50,000 | (50) |
| Age Group | ||||||||
| 65 to 74 | 188,705 | (29.7) | 25,535 | (25.5) | 26,397 | (26.4) | 26,514 | (26.5) |
| 75 to 84 | 239,470 | (37.7) | 37,164 | (37.2) | 36,945 | (36.9) | 36,821 | (36.8) |
| >84 | 207,415 | (32.6) | 37,301 | (37.3) | 36,658 | (36.7) | 36,665 | (36.7) |
| Gender | ||||||||
| Female | 402,160 | (63.3) | 60,059 | (60.1) | 59,851 | (59.9) | 59,877 | (59.9) |
| Male | 233,430 | (36.7) | 39,941 | (39.9) | 40,149 | (40.1) | 40,123 | (40.1) |
| Race/Ethnicity | ||||||||
| White | 506,581 | (79.7) | 81,052 | (81.1) | 81,215 | (81.2) | 80,823 | (80.8) |
| Multi/Other | 129,009 | (20.3) | 18,948 | (18.9) | 18,785 | (18.8) | 19,177 | (19.2) |
| Disease Category | ||||||||
| Healthy | 179,827 | (28.3) | 28,764 | (28.8) | 28,800 | (28.8) | 29,110 | (29.1) |
| At Risk | 248,575 | (39.1) | 35,395 | (35.4) | 35,289 | (35.3) | 35,160 | (35.2) |
| Chronic | 124,592 | (19.6) | 20,510 | (20.5) | 20,569 | (20.6) | 20,313 | (20.3) |
| SystFailure | 82,596 | (13.0) | 15,331 | (15.3) | 15,342 | (15.3) | 15,417 | (15.4) |
| NoChronic | 428,402 | (67.4) | 64,159 | (64.2) | 64,089 | (64.1) | 64,270 | (64.3) |
| Chronic | 207,188 | (32.6) | 35,841 | (35.8) | 35,911 | (35.9) | 35,730 | (35.7) |
| NoCancer | 597,406 | (94.0) | 91,687 | (91.7) | 91,689 | (91.7) | 91,645 | (91.6) |
| Cancer Dx | 38,184 | (6.0) | 8,313 | (8.3) | 8,311 | (8.3) | 8,355 | (8.4) |
| NoBehavioralDx | 603,872 | (95.0) | 94,288 | (94.3) | 94,391 | (94.4) | 94,376 | (94.4) |
| BehavioralDx | 31,718 | (5.0) | 5,712 | (5.7) | 5,609 | (5.6) | 5,624 | (5.6) |
| NoFrailtyDx | 455,957 | (71.7) | 74,384 | (74.4) | 74,438 | (74.4) | 74,293 | (74.3) |
| FrailtyDx | 179,633 | (28.3) | 25,616 | (25.6) | 25,562 | (25.6) | 25,707 | (25.7) |
Note. Disease Categories are designated by the ComplexEDEX Algorithm (Hewner, Seo, Gothard, & Johnson, 2014).
Machine Learning Results
Decision trees provide a clinically interpretable model that can be used to identify the probability that an individual will not be alive at 12-months based on the hierarchical relationship of the predictor variables with the outcome variable of “not alive” depicted in the (oval-shaped) terminal nodes (Figure 1). The CHAID and CRT decision trees had similar statistical results, however, the CRT had superior performance so it was selected for further testing. Across datasets #1–3 CRT AUC, M = .71, SD = .013, MCC, M = .31, SD = .015. Overall, the 30-node CRT (4-level) decision tree from dataset #2 was the best model in terms of identifying mortality cases (Figure 1). The model had good discrimination, AUC = .71, 95% CI [.705, .712], and was the most accurate in identifying the item of interest “not alive” at 12-month, sensitivity (TPR) = .73. Model specificity (TNR) = .58, PPV = .63, NPV = .68, and MCC = .31. The model predicted 36,480 people to be “not alive” at 12 months out of 50,000 individuals who died within the year. Therefore, the decision tree accurately predicted mortality risk 73% of the time and it missed identifying a person who was “not alive” at 12-months 27% of the time (Table 2).
Figure 1.
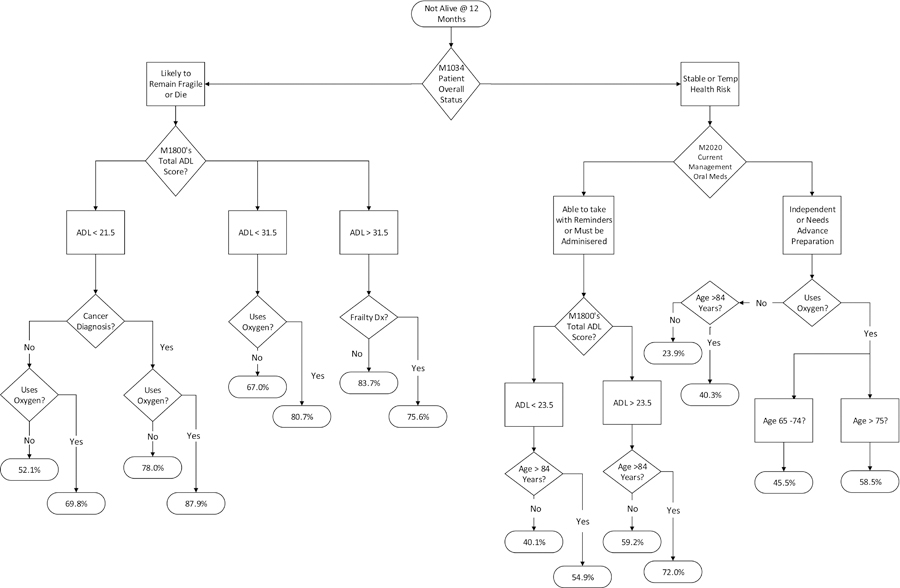
Decision Tree Prognostic Model 12-month Mortality Risk
Note. Terminal (oval-end) nodes indicate the probability of the outcome “not-alive” at 12 months. Dx = diagnosis; ADL = Activities of Daily Living total summary score based on the combined responses of M1800-M1890.
Table 2.
Comparison of Models across Datasets # 1– 3
| Method | Sensitivity (TPR) | Specificity (TNR) | PPV | NPV | MCC | AUC | 95% CI | Pseudo R2 |
|---|---|---|---|---|---|---|---|---|
| Dataset #1 N =100,000 | ||||||||
| CRT-3 Level | .66 | .62 | .64 | .65 | .29 | .69 | [.684, .691] | |
| CRT-4 Level | .69 | .61 | .64 | .66 | .30 | .71 | [.703, .710] | |
| CRT-5 Level | .65 | .67 | .67 | .65 | .32 | .72 | [.716, .722] | |
| ANN Perceptron | .74 | [.74, .74] | ||||||
| Train | .66 | .69 | .67 | .68 | .35 | |||
| Test | .65 | .69 | .66 | .68 | .34 | |||
| Logistic Regression | .64 | .70 | .68 | .67 | .34 | .74 | [.732, .738] | .22 |
|
Dataset #2 N =100,000 | ||||||||
| CRT-3 Level | .65 | .63 | .64 | .65 | .29 | .69 | [.687, .693] | |
| CRT-4 Level | .73 | .58 | .63 | .68 | .31 | .71 | [.705, .712] | |
| CRT-5 Level | .69 | .64 | .66 | .67 | .33 | .72 | [.718, .724] | |
| Ann Perceptron | .74 | [.74, .74] | ||||||
| Train | .68 | .68 | .66 | .69 | .35 | |||
| Test | .68 | .67 | .66 | .69 | .35 | |||
| Logistic Regression | .64 | .70 | .68 | .67 | .34 | .74 | [.733, .739] | .22 |
|
Dataset #3 N =100,000 | ||||||||
| CRT-3 Level | .70 | .61 | .64 | .67 | .31 | .69 | [.688, .694] | |
| CRT-4 Level | .69 | .63 | .65 | .67 | .32 | .71 | [.709, .715] | |
| CRT-5 Level | .66 | .67 | .66 | .66 | .33 | .72 | [.719, .726] | |
| Ann Perceptron | .74 | [.74, .74] | ||||||
| Train | .66 | .68 | .66 | .68 | .35 | |||
| Test | .65 | .69 | .67 | .67 | .34 | |||
| Logistic Regression | .64 | .70 | .68 | .67 | .35 | .74 | [.735, .742] | .22 |
Note. ANN = Artificial Neural Network; CRT = Classification and Regression Tree; TPR = True Positive Rate; TNR = True Negative Rate; PPV = Positive Predictive Value; NPV = Negative Predictive Value; MCC = Matthews Correlation Coefficient; AUC = Area Under the Receiver Operating Characteristic Curve; CI = Confidence Interval.
Figure 1 shows the final decision tree for the 4-level CRT algorithm from dataset #2. According to this algorithm, reading from top-to-bottom like a tree, a person deemed to have the highest risk of dying at 12-months was identified as being likely to remain fragile or die (M1034 Patient Overall Status), had an ADL score <21.5 (M1800–1890) (with higher scores indicating lower functional status), a cancer diagnosis, and used oxygen (M1410 Respiratory Oxygen). These individuals had an 87.9% probability of dying at one year (Figure 1). There were 926 people in this group. Whereas, those identified as being stable or having a temporary health risk (M1034 Patient Overall Status), who independently managed oral medications (M2020 Management of Oral Medication), did not use O2 (M1410 Respiratory Oxygen), and were between the ages of 65 and 84 had the lowest (23.9%) probability of dying at 12 months (Figure 1). There are 22,006 people in this group.
Artificial Neural Network (ANN) Benchmarking
The decision tree was benchmarked against the gold standard for machine learning, the ANN. The ANN results were stable across datasets #1–3, AUC, M = .74, SD = 0, 95% CI [.74, .74], MCC, M = .35, SD = .01 (Table 2). The ANN classifier reported 32.5% incorrect predictions on the training data and 32.6% on the test data. Sensitivity (TPR) for the training data, M = .66, SD = .012 and test data, M = .66, SD = .017. The most accurate ANN has an AUC = .74, 95% CI [.74, .74], was 68% correct in predicting 12-month mortality risk and missed identifying individuals who were “not alive” at 12-months 32% of the time (sensitivity (TPR) = .68). Model specificity (TNR) = .68, PPV = .66, NPV .69, and MCC = .35 (Table 2).
Logistic Regression Results
There were 12 OASIS predictors retained in the final model (Table 3, SDC 1). The AUC M = .74, SD = 0 and MCC, M = .35, SD = .01. Model performance was best in dataset #3, χ2 (19) = 17263.75, p < .001. The final model explained 22% (Nagelkerke/Pseudo R2) of the variance in dying at 12-months, and was a good predictor of mortality risk, AUC = .74, 95% CI [.735, .742]. This model accurately predicted mortality risk 64% of the time and missed 36% of the people who died by 12-months (sensitivity (TPR) = .64) (Tables 2 & 3). Model specificity (TNR) = .70, PPV = .68, NPV = .67, MCC = .35.
Table 3.
Logistic Regression Results for Dataset # 3 (n=100,000)
| Odds Ratio | 95% CI |
||||||
|---|---|---|---|---|---|---|---|
| Predictor | B | SE | Wald | df | p | Lower Upper | |
| Age Range 65 – 74 | 1276.17 | 2 | <.001 | ||||
| Age Range 75 – 84 | .27 | .02 | 216.22 | 1 | <.001 | 1.31 | [1.26, 1.36] |
| Age Range >84 | .67 | .02 | 1218.41 | 1 | <.001 | 1.96 | [1.88, 2.03] |
| Male | .41 | .02 | 754.97 | 1 | <.001 | 1.50 | [1.46, 1.55] |
| Chronic Illness | .27 | .02 | 318.76 | 1 | <.001 | 1.32 | [1.28, 1.36] |
| Cancer | 1.10 | .03 | 1530.62 | 1 | <.001 | 3.02 | [2.85, 3.19] |
| M1034 Overall Status | |||||||
| Stable | 1950.04 | 2 | <.001 | ||||
| Temporary Health Risk | .01 | .02 | 0.07 | 1 | .798 | 1.01 | [0.96, 1.06] |
| Likely to remain in fragile health or die | .68 | .03 | 693.98 | 1 | <.001 | 1.97 | [1.88, 2.07] |
| M1100 Patient Living Situation | |||||||
| Lives Alone | 84.90 | 2 | <.001 | ||||
| Lives with Another Person | .04 | .02 | 4.67 | 1 | .031 | 1.04 | [1.00, 1.08] |
| Lives in a Congregate Setting | .26 | .03 | 79.55 | 1 | <.001 | 1.29 | [1.22, 1.37] |
| M1400 When Dyspneic | |||||||
| No Shortness of Breath (SOB) | 137.18 | 3 | <.001 | ||||
| SOB when Walking or Climbing Stairs | .10 | .02 | 24.40 | 1 | <.001 | 1.10 | [1.06, 1.15] |
| SOB with Moderate Exertion | .11 | .02 | 33.56 | 1 | <.001 | 1.12 | [1.08, 1.16] |
| SOB with Minimum Exertion | .29 | .02 | 137.17 | 1 | <.001 | 1.33 | [1.27, 1.40] |
| M1410 Respiratory Oxygen | |||||||
| Intermittent or Continuous Use | .80 | .02 | 1436.56 | 1 | <.001 | 2.23 | [2.14, 2.32] |
| M1620 Bowel Incontinence Present | .16 | .02 | 55.39 | 1 | <.001 | 1.17 | [1.12, 1.22] |
| M18XX Current ADL/IADL Total Score | .03 | .001 | 438.75 | 1 | <.001 | 1.03 | [1.02, 1.03] |
| M2020 Current Oral Medication Management | |||||||
| Independent | 399.01 | 3 | <.001 | ||||
| Able to Take if Prepared in Advance | .18 | .02 | 78.07 | 1 | <.001 | 1.20 | [1.20, 1.25] |
| Able to Take with Reminders | .26 | .02 | 113.11 | 1 | <.001 | 1.30 | [1.30, 1.36] |
| Unable to Take and Must be Administered | .49 | .03 | 391.50 | 1 | <.001 | 1.64 | [1.64, 1.72] |
| M1308 At least one Pressure Ulcer Present | .64 | .03 | 444.97 | 1 | <.001 | 1.89 | [1.89, 2.01] |
| Constant | −2.01 | .03 | 3696.15 | 1 | <.001 | 0.13 | 0.13 |
Note. Model (likelihood ratio) chi-square = 17263.75, df 19, p < .001; Nagelkerke R2 = .22;
Percent correctly classified 67.4%.
The logistic regression models were consistent across all three datasets. The models indicate that increasing age and male gender is associated with dying at one year. In addition, there is a three-fold odds of dying within the year for people with a cancer diagnosis, and if an individual is determined to be high risk for dying based on the nurse’s subjective assessment of mortality risk (M1034 Patient Overall Status), they are twice as likely to die by year end. Moreover, if an older adult lives in a congregate situation or has dyspnea, there is an increased odds of dying at one year. Using oxygen, even intermittently, indicates that the older adult is more than twice as likely to die as a person who does not use oxygen. Bowel incontinence, increased total ADL score (low functional ability), the inability to manage oral medications, and the presence of at least one pressure ulcer, regardless of stage, are all associated with 12-month mortality risk (p < .001) (Laerd Statistics, 2015).
Discussion
This manuscript introduced cutting-edge machine learning approaches, comparing decision trees with ANN and logistic regression that will advance secondary analysis of electronic health records (EHR) and the use of routinely collected assessment data combined with a unique data source to determine risk of mortality. This study explores the potential of two decision tree algorithms (CHAID and CRT) to provide an interpretable tool for identifying mortality risk among community-dwelling older adults by benchmarking it with gold standards for predictive modeling, the ANN and logistic regression. The results of this study indicate that it is possible to use machine learning approaches to develop and validate a predictive model identifying 12-month mortality risk using the OASIS-C with reasonable discrimination as indicated by the stability of the models across methods.
When comparing decision tree, ANN and logistic regression approaches, it is important to consider the resources required to conduct big data research using the different methods. Machine learning is designed to quickly process very large quantities of data that were not collected for research purposes, such as data contained within the EHR. In contrast, logistic regression approaches require a thoughtful and well-executed research design, manual selection of items, and a significant amount of data preprocessing to meet the assumptions of the statistical modeling methodology. In addition, logistic regression models will provide a mathematical formula for determining risk, rather than an interpretable visual model, effectively limiting their usefulness when performing patient care. Moreover, the study revealed that it is important to consider the sensitivity (TPR) of the model when interpreting results due to the fact that AUC scores did not necessarily represent the model that best identified the item of interest (“not alive” at 12-months). This is an important consideration from a clinical perspective, since the presumed goal is to miss the fewest number of older adults who are at risk for dying, even if that increases the probability of falsely predicting 12-month mortality risk.
The purpose of building a predictive model is to provide an evidence-base for identifying individuals who may benefit from a focused nursing assessment for risks to well-being and safety. If the individual is deemed to be high risk for 12-month mortality, this may be an indication that it is the right time to raise the issue of discussing serious illness goals for care and possibly complete an Advance Care Plan (Billings & Bernacki, 2014). Thus, the OASIS-C is a valuable tool for identifying individual-level risk factors that are specific to homebound older adults that may not be evident in other care settings, such as functional independence and the ability to manage oral medications in the home.
The decision tree is a unique and useful tool when compared to logistic regression because it links 12 variables organized by the highest probability of mortality, which makes it easy to interpret during patient care activities and may enhance clinical judgement by reducing bias. In particular, the relative hierarchical relationship of the variables provided by the decision tree provides insights into the probability of mortality risk that is superior to existing linear frameworks in terms of clinical interpretability (Table 4). In contrast, the logistic regression model merely relates items to a dichotomous outcome using a mathematical formula that would require complex calculations to ascertain risk from the multiple significant predictor variables. Therefore, the decision tree algorithm is an interpretable tool that has the added benefit of providing patient-specific mortality risk scores at a glance.
Table 4.
Comparison of Final Predictors by Method
| Logistic Regression | Decision Tree |
|---|---|
| Age Range | Age Range |
| M0069 Gender | M1010–1016 or M1020–1022 Cancer |
| M1010–1016 or M1020–1022 Chronic Illness | M1010–1016 or M1020–1022 Frailty |
| M1010–1016 or M1020–1022 Cancer | M1034 Overall Status |
| M1034 Overall Status | M1410 Oxygen |
| M1100 Living Situation | M1800’s Activities of Daily Living Total Score |
| M1308 Pressure Ulcer | M2020 Management of Oral Medication |
| M1400 Dyspnea | |
| M1410 Oxygen | |
| M1620 Bowel Incontinence | |
| M1800’s Activities of Daily Living Total Score | |
| M2020 Management of Oral Medication |
Note. Activities of Daily Living Total Score is the sum of the responses to OASIS variables M1800 – M1890.
Limitations
This study has some limitations. First, it uses retrospective data that were not collected with a research intent. Second, extensive data preprocessing was required in order to compare methods, which could have reduced the dimensionality of the data. The AUC and MCC indicate that the models are “good” at predicting mortality risk at one-year, but there is room for improvement. The models reported FPR rates ranging between 30 and 42%, which is an indication of the risk of making a type 1 error. However, this is not a critical shortcoming of the study since most models are able to identify mortality cases with reasonable accuracy, and from a clinical perspective, all homebound older adults have some degree of risk for adverse health outcomes or death. Therefore, the assumption is that even if the older adult is falsely predicted to be at risk for dying, everyone receiving homecare could likely benefit from a careful nursing assessment to determine if there are clinical interventions that could benefit the older adult, such as initiating discussions about EOL goals for care, even if they live longer than a year.
Conclusion
This study compares four models for predicting 12-month morality risk using the OASIS-C. The findings of this study demonstrate that nursing data is a valuable resource for developing predictive models that may be integrated into clinical workflows to support clinical decision-making. Comparing the machine learning approaches to logistic regression helps to establish that data science methods produce comparable results to traditional statistical approaches to predictive modeling when using home health nursing data, while providing helpful insights and improved interpretability.
A strength of the predictive models are that they were built using a federally mandated, standardized health assessment tool, which collects information specific to the home environment. Using the OASIS-C dataset improves generalizability of the models because it does not contribute to documentation burdens, as nurses are already routinely collecting this information. If operationalized into home healthcare, this OASIS-C based predictive model would provide a standardized, pragmatic approach to identifying risk for decline that could potentially be used nationwide. Moreover, this study makes a contribution to the methodological literature because data science methods are only emerging in nursing research. Now that it has been established that it is possible to predict mortality risk using the OASIS dataset, the model needs to be strengthened, perhaps by linking the OASIS with other homecare data, and it needs to be externally validated. Because the purpose of data mining approaches is to discover knowledge in databases, additional research is needed to determine implications for practice such as designating cutoff points for the probability of mortality risk to trigger ACP conversations. Future work also needs to explore how to best integrate the model into clinical workflows so that it can be used to support clinical decision-making.
Advances in the volume, variety, velocity, and veracity of modern health datasets present many exciting possibilities for knowledge discovery for use in personalizing healthcare around the globe (Brennan & Bakken, 2015). The predictive models developed in this study promote precision health initiatives by providing nurses with actionable knowledge from data for identifying individual risk, which in turn, provides an opportunity to raise the issue of discussing serious illness goals for care in the context of the patient’s personal value and belief systems. The findings of this study suggest that the ease of analyzing data using machine learning methods, combined with the relative accuracy and superior interpretability of the models, support the notion that big data science approaches have a legitimate place in the biomedical sciences, and that further research should be conducted using standardized nursing datasets. The results of this study indicate that it is possible to use nursing data to predict 12-month mortality risk with considerable accuracy, and that data generated by nurses can have an impact on improving the lives of real people, while demonstrating the value of nursing care.
Acknowledgement:
Research reported in this publication was supported by the National Institute of Nursing Research of the National Institutes of Health under Award Number F31NR016394. The content is solely the responsibility of the authors and does not necessarily represent the official views of the National Institutes of Health.
The authors thank
Dr. Suzanne Dickerson, DNS, RN
Chair, Presidential Review Board (PRB)
Professor and Chair of Bio Behavioral Health and Clinical Science
School of Nursing, University at Buffalo
Dr. Mary Ann Meeker, DNS, RN
Assistant Dean, PhD Probram
School of Nursing, University at Buffalo
Peter Elkin, MD, MACP, FACMI, FNYAM
Professor and Char, Department of Biomedical Informatics and Professor of Internal Medicine
Department of Biomedical Informatics, University at Buffalo
Jiwei Zhao, PhD
Assistant Professor
Department of Biostatistics, University at Buffalo
Bill Wu, PhD
Associate Professor (retired)
School of Nursing, University at Buffalo
Davina Porock, PhD, RN, FAAN
Assistant Dean, Research and Innovation
Sheffield Hallam University, United Kingdom
University at Buffalo, Research Foundation
University at Buffalo Information Technology Department,
Diane Dempsey, MS, CRA
Grant Manager
Center for Nursing Research and School Nursing, University at Buffalo for their sponsorship, advice, and guidance on this project.
Footnotes
The authors have no conflicts of interest to report.
Ethical Conduct of Research: This study received IRB ethics committee approval from the University at Buffalo Institutional Review Board. The study was deemed to be not human subject research.
Contributor Information
Suzanne S. Sullivan, University at Buffalo School of Nursing, Buffalo, New York, United States of America.
Sharon Hewner, University at Buffalo School of Nursing, Buffalo, New York, United States of America.
Varun Chandola, University at Buffalo Department of Computer Science and Engineering, Buffalo, New York, United States of America.
Bonnie L. Westra, University of Minnesota School of Nursing, Minneapolis, Minnesota, United States of America.
References
- Agency for Health Research and Policy. (2017, October). HCUP Home: Healthcare Cost and Utilization Project (HCUP). Retrieved from www.hcup-us.ahrq.gov/home.jsp [PubMed]
- Aldridge MD, & Bradley EH (2017). Epidemiology and patterns of care at the end of life: Rising complexity, shifts in care patterns and sites of death. Health Affairs, 36(7), 1175–1183. doi: 10.1377/hlthaff.2017.0182 [DOI] [PubMed] [Google Scholar]
- Auriemma CL, Nguyen CA, Bronheim R, Kent S, Nadiger S, Pardo D, & Halpern SD (2014). Stability of end-of-life preferences: a systematic review of the evidence. JAMA Internal Medicine, 174(7), 1085–1092. doi: 10.1001/jamainternmed.2014.1183 [DOI] [PMC free article] [PubMed] [Google Scholar]
- Bandeen-Roche K, Seplaki CL, Huang J, Buta B, Kalyani RR, Varadhan R, … Kasper JD (2015). Frailty in older adults: A nationally representative profile in the United States. Journals of Gerontology Series A: Biomedical Sciences and Medical Sciences, 70(11), 1427–1434. doi: 10.1093/gerona/glv133 [DOI] [PMC free article] [PubMed] [Google Scholar]
- Billings JA, & Bernacki R (2014). Strategic targeting of advance care planning interventions: the goldilocks phenomenon. JAMA Internal Medicine, 174(4), 620–624. doi: 10.1001/jamainternmed.2013.14384 [DOI] [PubMed] [Google Scholar]
- Boughorbel S, Jarray F, & El-Anbari. (2017). Optimal classifier for imbalanced data using Matthews correlation coefficient metric. PLOS One, 12(6): e0177678. doi: 10.1371/journal.pone.0177678 [DOI] [PMC free article] [PubMed] [Google Scholar]
- Brennan PF, & Bakken S (2015). Nursing needs big data and big data needs nursing. Journal of Nursing Scholarship, 47(5), 477–484. doi: 10.1111/jnu.12159 [DOI] [PubMed] [Google Scholar]
- Cardona-Morell M, Kim JCH, Turner RM, Anstey M, Mitchell IA, & Hillman K (2016). Non-beneficial treatments in hospital at the end of life: A systematic review on extent of the problem. International Journal for Quality in Health Care, 0, 1–14. doi: 10.1093/intqhc/mzw060 [DOI] [PubMed] [Google Scholar]
- Centers for Disease Control and Prevention (CDC). (2013). The state of aging and health in America. Centers for Disease Control and Prevention, US Department of Health and Human Services. Retrieved from https://www.cdc.gov/aging/pdf/state-aging-health-in-america-2013.pdf
- Centers for Medicare and Medicaid Services (CMS). (2018a). Archives: Home health quality reporting program 2012 OASIS C guidance manual. Retrieved from https://www.cms.gov/Medicare/Quality-Initiatives-Patient-Assessment-Instruments/HomeHealthQualityInits/HHQIArchives.html
- Centers for Medicare and Medicaid Services (CMS). (2018b). Home health quality initiative. Retrieved from https://www.cms.gov/Medicare/Quality-Initiatives-Patient-Assessment-Instruments/HomeHealthQualityInits/index.html
- Davis MA, Nallamothu BK, Banerjee M, & Bynum JP (2016). Identification of four unique spending patterns among older adults in the last year of life challenges standard assumptions. Health Affairs, 35(7), 1316–1323. doi: 10.1377/hlthaff.2015.1419 [DOI] [PMC free article] [PubMed] [Google Scholar]
- Gambhir SS, Ge TJ, Vermesh O, & Spitler R (2018). Toward achieving precision health. Science Translational Medicine. 10 (eaao3612), 1–5. doi: 10.1126/scitranslmed.aao3612 [DOI] [PMC free article] [PubMed] [Google Scholar]
- Grus J (2015). Data science from scratch: First principles with Python: Sebastopol, CA: O’Reilly Media, Inc. [Google Scholar]
- Harris-Kojetin L, Sengupta M, Park-Lee E, Valverde R, Caffrey C, Rome V, & Lendon J (2016). Long-term care providers and services users in the United States: Data from the National Study of Long-Term Care Providers, 2013–2014. Vital & Health Statistics. Series 3, Analytical and Epidemiological Studies, (38), x-xii, 1–105. [PubMed] [Google Scholar]
- Hewner S, Seo JY, Gothard SE, & Johnson BJ (2014). Aligning population-based care management with chronic disease complexity. Nursing Outlook, 62(4), 250–258. doi: 10.1016/j.outlook.2014.03.003 [DOI] [PubMed] [Google Scholar]
- IBM SPSS. (2017). Validation Subcommand (TREE command) Help Menu. Retrieved from https://www.ibm.com/support/knowledgecenter/en/SSLVMB_24.0.0/spss/tree/syn_tree_overview.html
- Institute of Medicine [IOM]. (2014). Dying in America: Improving Quality and Honoring Individual Preferences Near the End of Life. Retrieved from http://www.nap.edu/catalog.php?record_id=18748 [DOI] [PubMed]
- Laerd Statistics. (2015). Binomial logistic regression using SPSS statistics. Statistical tutorials and software guides. Retrieved from https://statistics.laerd.com/
- Lunney J, Lynn J, Foley DJ, Lipson S, & Guralnik JM (2003). Patterns of functional decline at the end of life. Journal of the American Medical Association, 289(18), 2387–2392. [DOI] [PubMed] [Google Scholar]
- Luo W, Phung D, Tran T, Gupta S, Rana S, Karmakar C, … Ho TB (2016). Guidelines for developing and reporting machine learning predictive models in biomedical research: A multidisciplinary view. Journal of Medical Internet Research, 18(12), e23. doi: 10.2196/jmir.5870 [DOI] [PMC free article] [PubMed] [Google Scholar]
- Matney S, Avant K, Staggers N, (October 30, 2015) Toward an understanding of wisdom in nursing” OJIN: The Online Journal of Issues in Nursing, 21(2). doi: 10.3912/OJIN.Vol21No01PPT02 Available from: http://ojin.nursingworld.org.gate.lib.buffalo.edu/MainMenuCategories/ANAMarketplace/ANAPeriodicals/OJIN/TableofContents/Vol-21-2016/No1-Jan-2016/Articles-Previous-Topics/Wisdom-in-Nursing.html [DOI] [PubMed] [Google Scholar]
- O’Connor M, & Davitt JK (2012). The Outcome and Assessment Information Set (OASIS): A Review of Validity and Reliability. Home Health Care Services Quarterly, 31(4), 267–301. doi: 10.1080/01621424.2012.703908 [DOI] [PMC free article] [PubMed] [Google Scholar]
- Research Data Assistance Center (ResDAC). (2017). Research Data Assistance Center (ResDAC). Retrieved from https://www.resdac.org/cms-data/files/mbsf
- Sullivan SS, Li J, Wu Y-W, & Hewner S (2017). Complexity of chronic conditions impact on end of life expense trajectories of Medicare decedents. Journal of Nursing Administration, 47(11).545–550. doi: 10.1097/NNA.0000000000000541 [DOI] [PMC free article] [PubMed] [Google Scholar]
- Tabachnick BG, & Fidell LS (2013). Using Multivariate Statistics (6th ed.). Upper Saddle River, N.J.: Pearson [Google Scholar]
- Tan P, Steinbach M, & Kumar V (2006). Introduction to Data Mining. Boston, MA: Pearson. [Google Scholar]
- Westra B, Dey S, Fang G, Steinbach M, Kumar V, Oancea C, … Dierich M (2011). Interpretable predictive models for knowledge discovery from home-care electronic health records. Journal of Healthcare Engineering, 2(1), 55–74. doi: 10.1260/2040-2295.2.1.55 [DOI] [Google Scholar]
- Yadav KN, Gabler NB, Cooney E, Kent S, Kim J, Herbst N, … Courtright KR (2017). Approximately one in three US adults completes any type of advance directive for end-of-life care. Health Affairs, 36(7), 1244–1251. doi: 10.1377/hlthaff.2017.0175 [DOI] [PubMed] [Google Scholar]
- Yourman LC, Lee SJ, Schonberg MA, Widera EW, & Smith AK (2012). Prognostic indices for older adults: A systematic review. Journal of the American Medical Association, 307(2), 182–192. doi: 10.1001/jama.2011.1966 [DOI] [PMC free article] [PubMed] [Google Scholar]