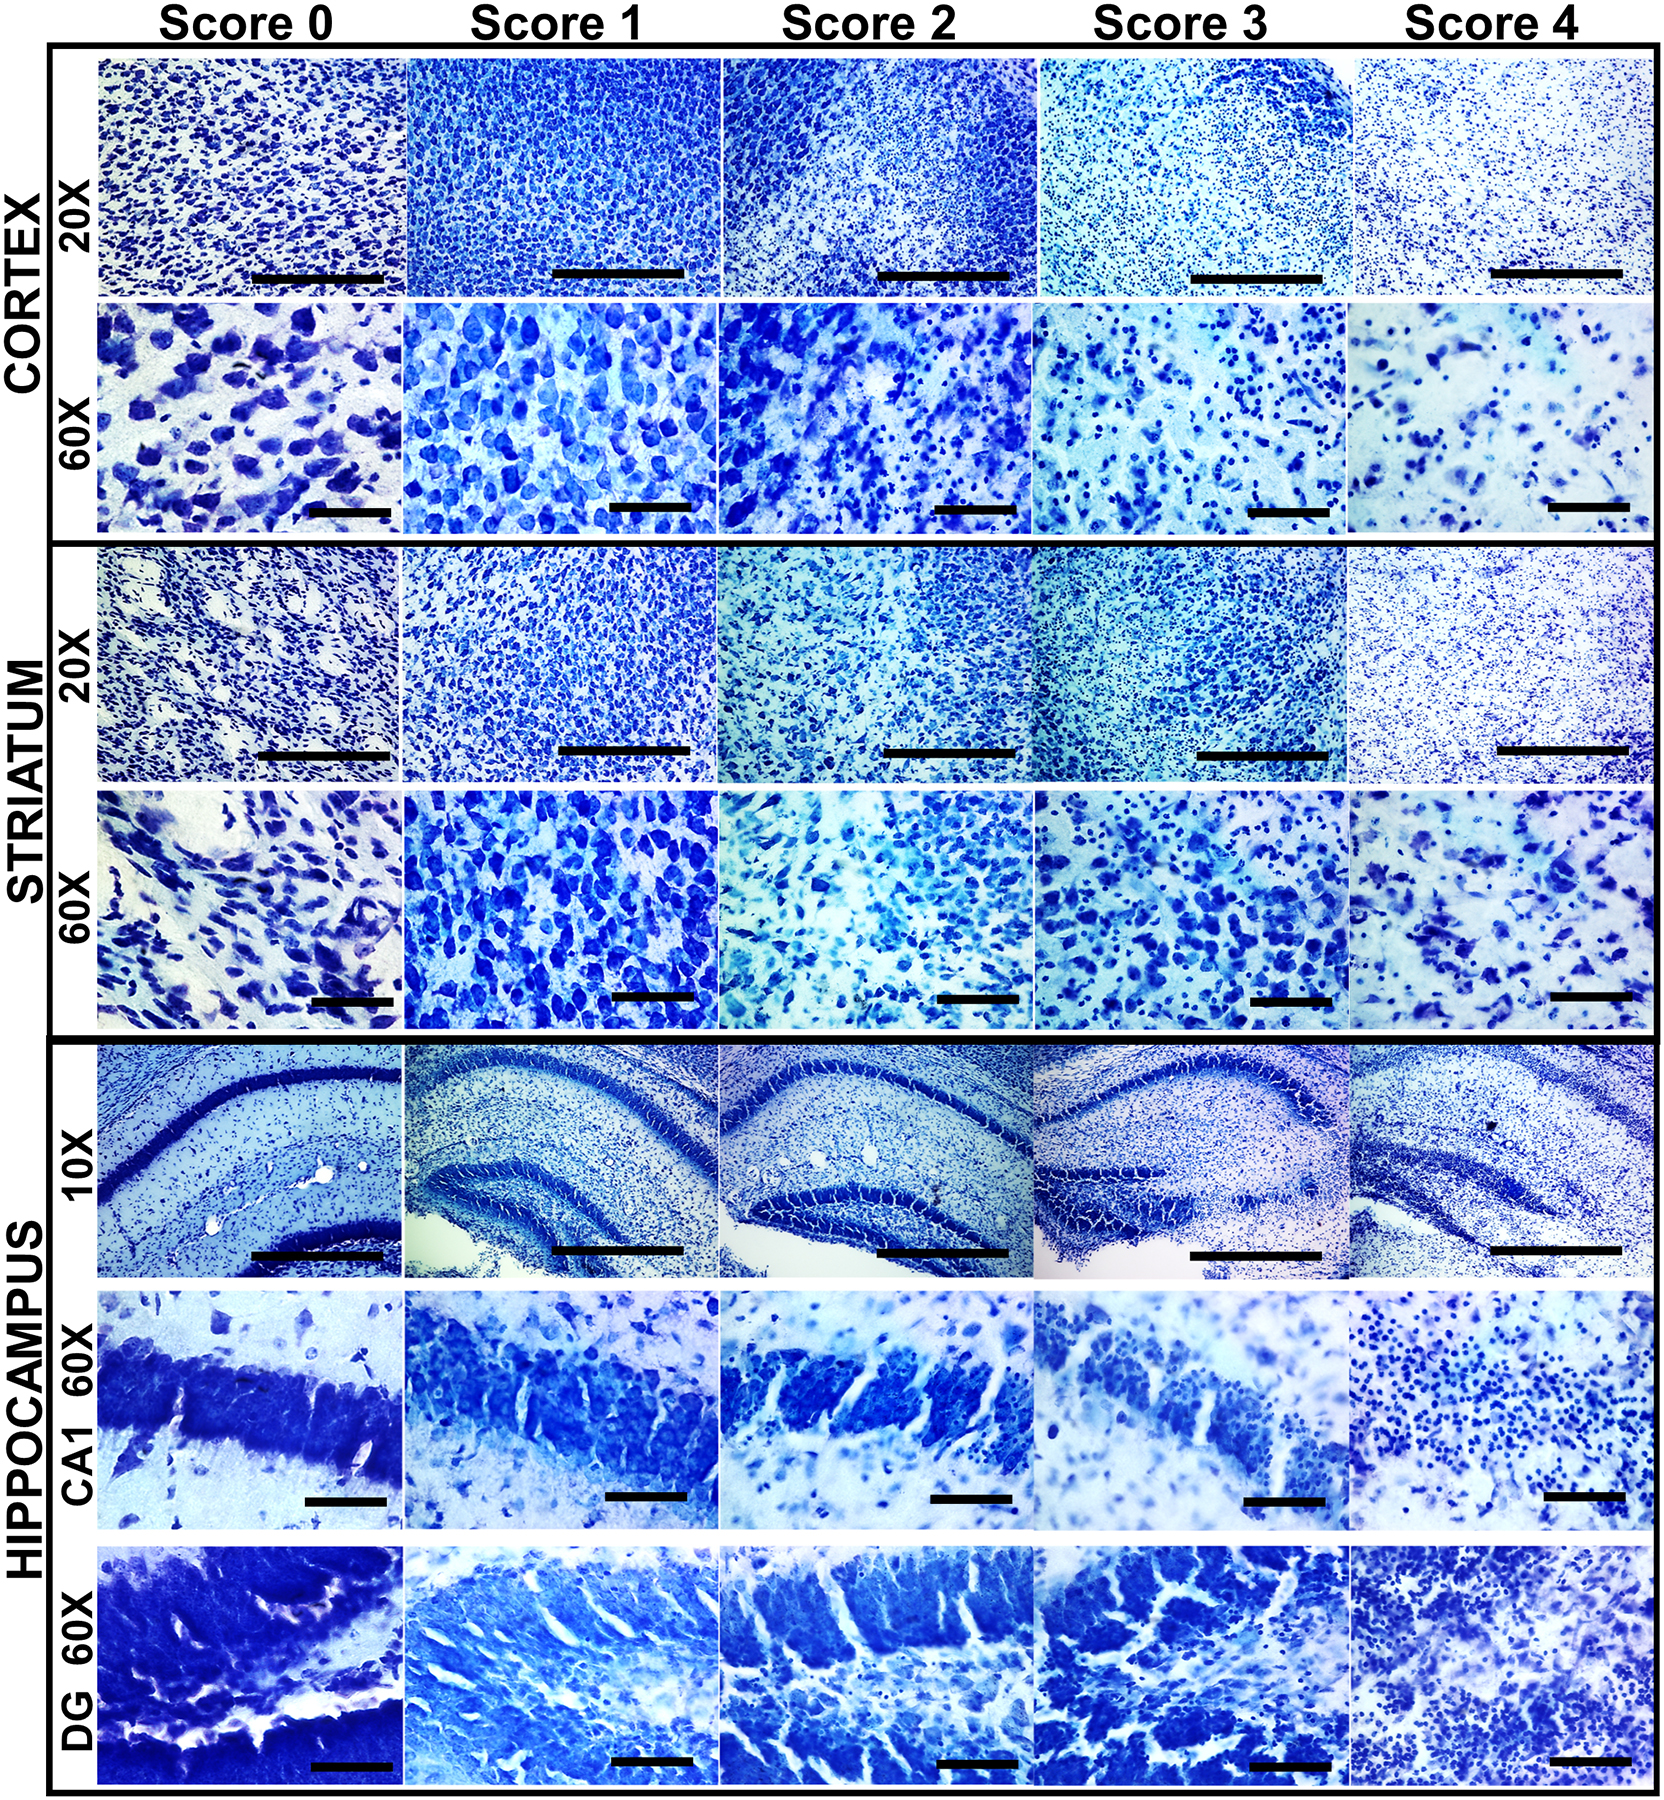
Figure 1.

Qualitative assessment of regional brain injury after neonatal mouse HI. Representative sections displaying the features of each of the qualitative brain injury scores are shown for the cortex, striatum, and hippocampus at p11 after HI at p10. Both low (20x) magnification sections are shown to display overall cell loss, pallor, and massive cell loss and high (60x) magnification sections are shown to display individual cell appearance/pathology. Scale bars: 10x = 100 μm, 20x = 50 μm, 60x = 10 μm.
