

Abstract
Intracellular lipid metabolism occurs in lipid droplets (LDs), which is critical to the survival of cells. Imaging LDs is an intuitive way to understand their physiology in live cells. However, this is limited by the availability of specific probes that can properly visualize LDs in vivo. Here, an LDs-specific red-emitting probe is proposed to address this need, which is not merely with an ultrahigh signal-to-noise (S/N) ratio and a large Stokes shift (up to 214 nm) but also with superior resistance to photobleaching. The probe has been successfully applied to real-time tracking of intracellular LDs behaviors, including fusion, migration, and lipophagy processes. We deem that the proposed probe here offers a new possibility for deeper understanding of LDs-associated behaviors, elucidation of their roles and mechanisms in cellular metabolism, and determination of the transition between adaptive lipid storage and lipotoxicity as well.
Lipid droplets (LDs) are multifunctional organelles consisting of a neutral lipid core surrounded by a phospholipid monolayer and originate from the endoplasmic reticulum (ER) through localized lipogenesis.1−4 Besides being storage depots for fat, LDs have also been recognized as dynamic and metabolically active organelles and their dysfunction has been implicated in many diseases.5−8 Regulations of the size and abundance of LDs are critical processes of metabolic homeostasis. Both the conditions of the increased LDs’ size and amount, and the inability to generate or store LDs, are associated with an increased risk of dyslipidemia, atherosclerosis, type 2 diabetes mellitus, coronary artery disease, and cardiomyopathy.9−13 The biogenesis and degradation of LDs, as well as their associations with other organelles, are tightly coupled to cellular metabolism and are critical for buffering the levels of lipid species. Lipophagy is a key regulatory pathway, through the degradation of excess or damaged LDs in a lysosome-dependent manner and the recycling of nutrients, for maintaining homeostasis of LDs in live cells.14−17 Monitoring LDs-related behaviors in vivo (e.g., distribution, morphology, dynamic evolution, and lipophagy) is fundamental to the characterization of LDs and for additional assistance in unraveling the endogenous mechanisms that determine the transitions between adaptive lipid storage and lipotoxicity, which are still poorly understood.18
Given their size (half to tens of micrometers), LDs are readily detected by transmission electron microscopy (TEM). However, their dynamic changes and behaviors in live cells, for example, associations with other organelles, cannot be visualized by this destructive imaging method.14 Instead, fluorescence imaging techniques with high spatial and temporal resolution provide an ideal solution for investigating the dynamic processes and functions of LDs in vitro and in vivo.19−22 Today, a variety of fluorogenic probes have already been researched for LDs imaging.23−27 However, there are several inherent limitations on photophysical properties that hamper the full potentials of them as sensitive-specific fluorogenic probes. First, photobleaching is a significant problem in live-cell imaging. The applied high-intensity illumination can reduce the ability of a probe to fluoresce or render it completely unable to fluoresce.28 Second, most of the aromatic compounds with high hydrophobicity are taken up by cells and subsequently condensed in the hydrophobic core of LDs at a high concentration, resulting in weakened emission evidently due to the aggregation caused quench (ACQ) effect.29 Third, most LDs-specific probes suffer from severe “self-absorption” because of the small Stokes shift, which certainly compromises the image qualities in the confocal microscopy measurements.30 Last, some classical probes (e.g., Nile Red) have poor specificity to LDs and stain other hydrophobic structures in cells, resulting in unfavorable signal-to-noise (S/N) ratios.31 Therefore, an ideal LDs-specific probe at least demands that it can possess strong emission in low-polarity hydrophobic media, even in the aggregated state, as well as the high ability of antiphotobleaching, large Stokes shift, and high specificity to LDs.32,33 Another key point to remember is that the desired fluorescent probes should have red and near-infrared (NIR) emission as that results in lower background signal, efficient excitation in thicker tissue samples, and reduced light scattering as compared to probes that emit in the blue to yellow range, rendering them suitable for imaging in vivo.34−36
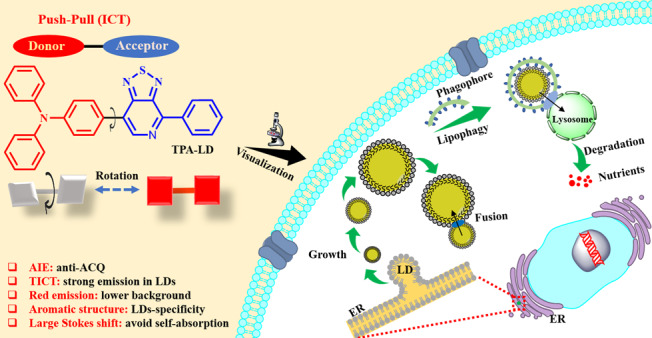
Herein, we propose an LDs-specific red-emitting fluorogenic probe. It is constructed by employing an electron donor (D)–acceptor (A) system [termed TPA–LD (TPA, triphenylamine)] (see Scheme 1).37 Because of its hydrophobic nature, TPA–LD can selectively accumulate in LDs, where it can be embedded into the waterless core via a strong hydrophobic interaction.38 Structurally, because of the D–A architecture and molecular rotor in the molecular skeleton, TPA–LD is prone to exhibiting twisted intramolecular charge-transfer (TICT) characteristics, particularly low fluorescence in high-polarity media. Therefore, we envision a small background emission that is obtained in a high-polarity microenvironment, where strong emission is expected once TPA–LD is incorporated into the LDs because of an inhibition of TICT behavior upon interaction with the hydrophobic domains in LDs, which will certainly offer a favorable S/N ratio.39 Conspicuously, TPA–LD with remarkable antiphotobleaching property and low toxicity enable long-term continuous LDs monitoring. Such features together with high quantum yields in low-polarity hydrophobic solvents (e.g., hexane φ = 0.87) and large Stokes shift up to 214 nm suggest that TPA–LD has great potential for acting as an LDs-specific fluorogenic probe for dynamic tracking and real-time monitoring of LDs-associated processes, once additional evaluations demonstrate it can satisfy the mandatory requirements of biomedical imaging.23,26
Scheme 1. Structure of TPA–LD and the Schematic for the Growth, Fusion, and Lipophagy Process in Live Cells (ICT: Intramolecular Charge Transfer).

Experimental Section
Reagents and Instruments
Unless otherwise specified, all reagents including metal ions, glyceryl trioleate, and other chemicals were purchased from Sigma-Aldrich and used as-received. HCS LipidTOX Deep Red, BODIPY 493/503, and LysoTracker Deep Red were obtained from Thermo Fisher. PLIN5-GFP was purchased from GeneCopoeia Company. Lipofectamine 2000 Reagent was purchased from Magen Company (Guangzhou, China).
The fluorescence spectra were collected on a FluoroMax-4 spectrophotometer. UV–vis spectra were measured on a UV-2450 spectrophotometer. Dynamic light scattering (DLS) measurements were conducted on a Malvern Zetasizer Nano ZS90. Confocal microscopy imaging was acquired with a Leica SP8 confocal microscope and 100/63× oil-immersion objective lens.
Synthesis
TPA–LD was synthesized and purified according to previously reported procedures.37
Cell Culture
Human Hepatocellular Carcinoma HepG2 Cells, Cervical Cancer HeLa cells, Lung Adenocarcinoma A549 cells, and Mouse Embryonic Fibroblasts 3T3 cells were cultured in Dulbecco’s modified Eagle’s medium (DMEM) supplemented with 10% fetal bovine serum (FBS, Gibco) and 1% antibiotics (penicillin and streptomycin) and then incubated in a humidified 5% CO2 incubator at 37 °C with the medium changed every other day. The cells were seeded onto glass-bottom dishes and cultured for 24 h at 37 °C in a humidified atmosphere (95% air and 5% CO2) before use. The constructs for PLIN5-GFP were introduced into HepG2 cells according to the manufacturer’s instructions.40
Cell Treatment with Oleic Acid
HeLa cells were grown on a 35 mm Petri dish overnight; the cells were incubated with oleic acid (OA) (0.1 mM) and without OA as control at different times (0–6 h) and subsequently stained with TPA–LD (10 μM) for 20 min.
Cytotoxicity Assays
MTT (5-dimethylthiazol-2-yl-2,5-diphenyltetrazolium bromide) assay was performed to test for any cytotoxic effect of the probe. HepG2 cells were passed and plated to 70% confluence in 96-well plates 24 h before treatment. Prior to TPA–LD or BODIPY 493/503 treatment, DMEM with 10% FBS was removed and replaced with fresh DMEM, and aliquots of TPA–LD or BODIPY 493/503 stock solutions were added to obtain final concentrations of 5, 10, 15, 20, and 25 μM. The treated cells were incubated for 24 h at 37 °C under 5% CO2. Subsequently, the cells were treated with 5 mg/mL MTT (10 μL/well) and incubated for an additional 4 h (37 °C, 5% CO2). The cells were then dissolved in dimethyl sulfoxide (100 μL/well), and the absorbance at 570 nm was recorded using a microplate reader (Biotek, USA). The cell viability (%) was calculated according to the equation
where OD570 (sample) represents the optical density of the wells treated with various concentrations of TPA–LD or BODIPY 493/503 and OD570 (control) represents that of the wells treated with DMEM containing 10% FBS. The percentage of cell survival values is relative to untreated control cells.
Cellular Imaging and Co-Localization
Cells were seeded onto glass-bottom culture dishes and incubated for 24 h at 37 °C with 5% CO2. To obtain a better fluorescent signal with negligible cytotoxicity, we added TPA–LD solution to obtain a final concentration of 10 μM and incubated the cells solution for 20 min. Subsequently, 1 μM HCS LipidTOX Deep Red or BODIPY 493/503 was added and the cells solution was incubated for another 10 min. After that, the medium was removed, the cells were washed with phosphate buffered saline (PBS) three times, and then 1.0 mL of growth medium was added into the dishes. Under a confocal laser scanning microscope, the fluorescence image from TPA–LD was recorded using excitation at 480 nm and the emission range 590–690 nm, then the fluorescence image of HCS LipidTOX Deep Red was recorded using excitation at 637 nm and the emission range 645–675 nm, and that of BODIPY 493/503 was recorded using excitation at 493 nm and the emission range 500–510 nm. The three-dimensional animation pictures were generated with packed software by Image J.
Starvation-Induced Autophagy
For lipophagy experiments, HepG2 cells were first incubated with TPA–LD (10 μM) for 20 min, then 1 μM LysoTracker Deep Red was added and the cells incubated for another 10 min in serum-free Earle’s Balanced Salt Solution (EBSS). After that, the medium was removed, the cells were washed with PBS three times, and then 1.0 mL of EBSS was added to the dishes. For the control experiments, HepG2 cells were incubated with TPA–LD (10 μM) for 20 min, and then 1 μM LysoTracker Deep Red was added and maintained for another 10 min in a rich nutrients medium supplemented with 10% FBS and 1% antibiotics. The fluorescence image from LysoTracker Deep Red was recorded using excitation at 647 nm and the emission range 660–680 nm.
Zebrafish Imaging
Live zebrafish were raised in an aqueous solution containing 10 μM TPA–LD for 2 h at room temperature. Prior to fluorescence imaging, the fish were washed three times with water. The imaging was conducted using a fluorescence microscope (Leica, Germany).
Results and Discussion
Photophysical Properties of TPA–LD
First and foremost, the photophysical properties of TPA–LD in solvents with different polarities were investigated (Figure S1, Supporting Information). As reported, molecules with D–A structures are characterized by a prominent solvatochromic effect.41 As shown in Figure S1, it is clearly observed that TPA–LD exhibits pronounced strong emissions in the solvents with lower polarity and higher hydrophobicity. A large red shift of emissions from 564 nm in hexane to 689 nm in acetonitrile was observed, accompanied by the color changing from yellow to red, which is attributed to the TICT effect (Figure 1d).37 As shown in Figure S1c, there is a linear relationship between maximum emission wavelength versus the solvent polarities with a slope of 9.32 nm per ET(30) unit.42 The TICT effect of TPA–LD can be further explained by the density functional theory (DFT) calculation by using the single-crystal structure of TPA–LD. As depicted in Figure S2, the molecular orbital density of the highest occupied molecular orbital (HOMO) is mainly located on the triphenylamine moiety, whereas the lowest unoccupied molecular orbital (LUMO) was located predominately on the acceptor framework, suggesting strong charge transfer (CT) from the electron donor to the electron acceptor. In the solvents with high polarity, TPA–LD can approach the CT state with considerable conformational change for a higher twist angle via a freely rotatable single bond, which subsequently lowers the excited state energy, resulting in a red shift in the emission band and an intensity decrement.37,38 As mentioned above, the continuous condensation of a fluorogenic probe in the hydrophobic core of LDs may induce the ACQ effect. It is therefore necessary to study the fluorescent properties of TPA–LD in the aggregation state to screen the optimal LDs probe. As shown in Figure S3, the emissions were enhanced dramatically in intensity under the addition of water from fw = 30–99%, which hints that TPA–LD has the aggregation-induced emission (AIE) property. The DLS was further employed to determine the aggregation of TPA–LD (Figure S4). After that, we investigated the fluorescent behaviors of TPA–LD in a stimulated lipid environment of LDs. Glyceryl trioleate was added into PBS buffer to form an oil/water (O/W) emulsion.43,44 As shown in Figure 1, TPA–LD in O/W emulsion revealed strong red fluorescence with the emission peak around 630 nm and anti-ACQ behavior at high concentration. Meanwhile, the large Stokes shift up to 214 nm of TPA–LD can efficiently avoid self-absorption.37 Such exceptional fluorescence properties together with enhanced red emissions in the aggregation state and O/W emulsion make TPA–LD a desired probe for dynamic tracking of LDs.
Figure 1.

(a) Simulation of interaction of TPA–LD in O/W emulsion. (b) Fluorescence spectra of TPA–LD in O/W emulsion with varied concentrations of TPA–LD under 480 nm excitation. (c) Photographs of TPA–LD in O/W emulsion with different concentrations taken under 365 nm UV irradiation. (d) Photographs of TPA–LD in different solvents taken under 365 nm UV irradiation.
For fluorescent imaging and sensing applications, anti-interference capacity is an important criterion for a probe to act as an effective indicator. To ensure TPA–LD is unaffected by this issue, we tested potential interferences including metal ions and pH. Negligible spectroscopic changes were detected when TPA–LD was exposed to different possible interfering agents (Figure S5). This implies that TPA–LD has high stability in a complex biological system. The cytotoxicity and photostability are two other key parameters for biomedical applications. In contrast to BODIPY 493/503, TPA–LD exhibits insignificant cytotoxicity after 24 h incubation at concentrations up to 25 μM and much better resistance to photobleaching (Figure S6). These indicate that TPA–LD has superior performance for live-cell imaging.
LDs-Specificity of TPA–LD
First, HepG2 cells were incubated with TPA–LD for 20 min and the fluorescence spectra were collected in the range of 590–690 nm with excitation at 480 nm (Figure S7). To confirm the precise distribution of TPA–LD in live cells, we performed colocalization experiments using two commercial LDs staining probes, HCS LipidTOX Deep Red and BODIPY 493/503 (Figure 2 and Figure S8); the merged images revealed that the staining of TPA–LD overlapped very well with that of two commercial markers. The Pearson’s colocalization coefficients (Rr) were calculated to be as high as 0.91 for TPA–LD and HCS LipidTOX Deep Red and 0.89 for TPA–LD and BODIPY 493/503, indicating the high specificity of TPA–LD toward LDs. A three-dimensional image was also obtained to gain insight into the high specificity (Figure 2f). In addition, TPA–LD has also been successfully applied in imaging of LDs in other cell lines as well, such as normal cells 3T3 and cancer cells (HeLa and A549) (Figure S9). The high-fidelity targeting of LDs suggests that TPA–LD can be utilized as a reliable imaging tool for additional investigations of LDs physiology.
Figure 2.

Colocalization images of HepG2 cells with TPA–LD (10 μM) for 20 min subsequently with HCS LipidTOX Deep Red (1 μM) for 10 min. (a) Bright field. (b) Red pseudocolor fluorescence of TPA–LD. (c) Green pseudocolor fluorescence of HCS LipidTOX Deep Red. (d) Merged image of panels (a)–(c.) (e) Correlation of (b) and (c). (f) Three-dimensional image of TPA–LD (red fluorescence) and HCS LipidTOX Deep Red (green fluorescence). TPA–LD: λex = 480 nm, λem = 590–690 nm. HCS LipidTOX Deep Red: λex = 637 nm, λem = 645–675 nm. Scale bar: 7 μm.
Monitoring Fusion and Migration Process of LDs
LDs are dynamic organelles and their behaviors are closely related to cellular metabolism.45 Therefore, we sequentially explored the capacity of TPA–LD in real-time tracking of LDs movements in HepG2 cells. As displayed in Figure 3, dynamic LDs in the observed area have moved distinctly in the period of 3 min, and four different pseudocolors were adopted to demonstrate the movements of LDs at different time nodes. Images combined at different time points illustrate the dynamic behaviors of LDs. The schematic illustration of the selected region in Figure 3a–d depicted in Figure 3i clearly shows the process of LDs motion and fusion as well as the dynamic changes in size. Calculations of the average volume during the LDs–LDs fusion process indicates that there is an increase in the total LDs size, which is consistent with previous reports in the literature.12 To further confirm that LDs remodeling seen in HepG2 cells was the result of LDs fusion, rather than the fusogenic effect of TPA–LD, we performed time-lapse imaging of live cells. Fusion events were both observed in HepG2 cells when stained with chemical fluorescent marker BODIPY 493/503 and protein fluorescent marker PLIN5-GFP (used as a protein fluorescent marker of the LDs surface, which can produce more reliable results) during prolonged imaging under the control conditions (Figure S10).46
Figure 3.
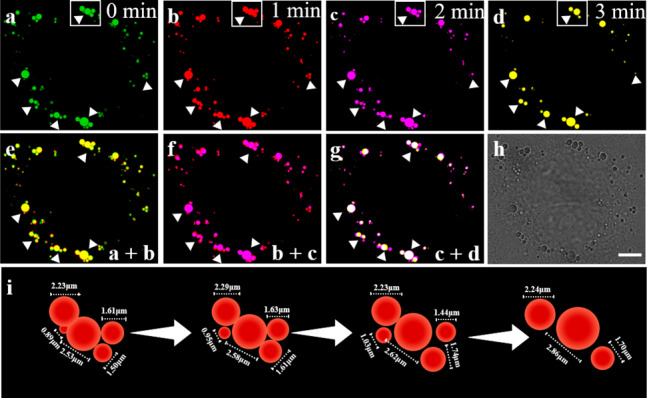
Fluorescence images of HepG2 cells stained with TPA–LD (10 μM). (a–d) Different pseudocolors are used to illustrate the fluorescence images at time nodes of 0, 1, 2, and 3 min. Merged images at two different times: (e) 0 and 1 min. (f) 1 and 2 min. (g) 2 and 3 min. (h) Bright-field image obtained at 0 min. (i) The simulated dynamic diagram and diameter of the selected area. λex = 480 nm, λem = 590–690 nm. Scale bar: 7 μm.
Monitoring Dynamic Changes of LDs in Live Cells
Oleic acid (OA) is known to stimulate LDs production in cells.25 As the LDs content in cervical cancer is comparably less than that in hepatocytes (Figure S9),47 we used HeLa cells as a model, where more distinguishable changes of LDs were expected before and after addition of OA. Subsequently, the detecting capability of TPA–LD of the dynamic changes of LDs in cells could be easily evaluated. Initially, the LDs of untreated cells were comparatively small and dispersed with a mean size of approximately 0.56 μm (Figure 4a,b). In contrast, after 2 h of treatment with OA, the number of LDs increased from the original value of 8 to 45 and the size increased as well. After 4 h of treatment, the average size and number of LDs increased even further (Figure 4b). After 6 h, the number and size of LDs continue to increase and aggregate into larger clusters. The mean fluorescence intensity of LDs showed the same rising tendency as those of quantity and size (Figure 4c). Meanwhile, there was no obvious change in the control group (Figure S11). The above experiments demonstrated that TPA–LD can monitor OA-stimulated LDs production, as well as the enlargement of LDs size during the process. These results also encourage us to explore TPA–LD for real-time imaging of intracellular lipophagy processes, the key regulator of lipid metabolism.
Figure 4.

Confocal fluorescence images of HeLa cells treated with 0.1 mM oleic acid (OA) for different time intervals of 0, 2, 4, and 6 h and then the cells were stained with probe TPA–LD (10 μM). (a) Red pseudocolor fluorescence of TPA–LD. (b) Number of LDs change at different times. (c) Average diameter and fluorescence intensity of LDs at different times. Scale bar: 7 μm.
Imaging Lipophagy in Live Cells
For observation of the lipophagy process, it is of great importance to have available spectra-distinguishable fluorescent marker to stain lysosome. Then the multicolor imaging can be used to investigate the associations between different organelles on the same image. For this purpose, HepG2 cells were costained with Hoechst (a blue marker for the nucleus), LysoTracker Deep Red (a red-emitting lysosome marker), BODIPY 493/503 (a green marker for LDs), and TPA–LD. The obtained multicolor imaging displayed a superior S/N ratio of TPA–LD compared with that of other commercial markers, and no visible cross talk was observed, thus providing clear multichannel imaging (Figures S12–S14). To induce lipophagy, we used nutrient-free medium to culture cells under the starvation condition. The cells were costained with TPA–LD and LysoTracker to visualize LDs and lysosomes, respectively.48 If LDs and lysosomes are fused in treated cells, more distinguishable yellow fluorescence arising from colocalization of lysosomes (green) and LDs (red) will be observed. Confocal imaging of HepG2 cells were performed at varied time nodes (0–4 h) (Figure 5). In the first hour, the morphology of LDs and lysosomes were distinguishable from each other, and the Rr values had only a faint fluctuation (Figure 5a). With prolonged starvation, the morphology of LDs and lysosomes were gradually altered, indicating different lipophagy levels. The Rr values between TPA–LD and LysoTracker underwent a simultaneous vast increase from the original value of −0.03 to 0.46 (Figure 5b). It can be clearly observed that the number of LDs was reduced (Figure 5c), and the reduction in the average size of LDs eliminates the possibility that the decrease in the number of LDs is caused by the fusion process. This indicates an autolysosome formation with the damaged LDs during the lipophagy. We obtained the same results when analyzing the fluorescence images in different regions (Figure S15). HepG2 cells cultured with rich nutrients were used as a control (Figure S16). There were no changes in LDs size or morphology with time and a negligible overlap of TPA–LD and LysoTracker signals with relatively unchanged Rr values from −0.22 to 0.06 were observed, indicating that lipophagy is induced by the starvation. The above results verify that TPA–LD can be used for real-time imaging of the dynamic lipophagy process within live cells.
Figure 5.

Fluorescence images of HepG2 cells with TPA–LD (10 μM) and LysoTracker in serum-free medium at different time nodes. (a) Red pseudocolor fluorescence of TPA–LD, green pseudocolor fluorescence of LysoTracker, and merged image of TPA–LD and LysoTracker. White arrows indicate the magnified area. (b) Rr changes during the lipophagy process. (c) Number and average diameter of LDs changes during the lipophagy process. TPA–LD: λex = 480 nm, λem = 590–690 nm. LysoTracker: λex = 647 nm, λem = 660–680 nm. Scale bar: 7 μm.
In Vivo Imaging of Zebrafish
On the basis of the impressive cell imaging results in live cells and as a proof of concept, TPA–LD was also applied to visualize lipid-rich tissues in live zebrafish (Danio rerio). We first examined the background fluorescence of zebrafish without TPA–LD treatment, and no fluorescence was detected with 480 nm excitation (Figure S17). Then the zebrafish were incubated with TPA–LD at a concentration of 10 μM for 2 h. As shown in Figure 6, significant red fluorescence was observed in a well-known lipid-rich area, the yolk sac area.26 A three-dimensional view in Figure 6b clearly displays the distribution of TPA–LD with a high tissue depth of 134 μm, which is a benefit from the red emission of TPA–LD. Furthermore, the time-dependent fluorescence decrements and dynamically changed locations may be ascribed to the result of the cellular metabolic bioprocess, of which the mechanism should be further investigated in future work.
Figure 6.

Zebrafish embryos incubated with TPA–LD (10 μM) at different time nodes. (a) Bright-field image of the zebrafish embryo, red pseudocolor fluorescence of TPA–LD, and merged images. (b) Three-dimensional imaging of zebrafish larvae. λex = 480 nm, λem = 590–690 nm. Scale bar: 181 μm.
Conclusion
In summary, we have presented an LDs-specific red-emitting fluorogenic probe, TPA–LD, with merits of high red brightness and S/N ratio, strong anti-ACQ ability, high quantum yield, large Stokes shift up to 214 nm, high photostability, and good biocompatibility. The probe is successfully applied not only for the real-time tracking of LDs migration and fusion processes but also for monitoring of the lipophagy process induced by starvation, as well as in vivo three-dimensional imaging of zebrafish. It is demonstrated that TPA–LD has great potential as a tool for exploring the role of extensive lipid storage and dynamics that are highly related to the pathological processes involving LDs in cancer and inflammatory disorders. In addition, the work here also raises the thought that we can screen innovative potential bioprobes from already available chromophores.
Acknowledgments
This work is supported by the STINT Joint China-Sweden Mobility Project Program (CH2017-7243), National Natural Science Foundation of China (21775001 and 21705001), the China Scholarship Council (CSC), the Swedish Research Council (VR 2019-02409), Swedish Government Strategic Faculty Grant in Material Science (SFO, MATLIU) in Advanced Functional Materials (AFM) (VR Dnr. 5.1-2015-5959), and the Centre in Nano Science and Nano Technology at LiTH (CeNano) and LiU Cancer network at Linköping University.
Supporting Information Available
The Supporting Information is available free of charge at https://pubs.acs.org/doi/10.1021/acs.analchem.9b04410.
Photon-physical properties, theoretical calculations, interference experiment, standard MTT assays, photostability experiments, and fluorescence imaging (PDF)
Author Contributions
# X.Z. and L.Y. contributed equally to this work. All authors have given approval to the final version of the manuscript.
The authors declare no competing financial interest.
Supplementary Material
References
- Farese R. V. Jr.; Walther T. C. Lipid Droplets Finally Get a Little RESPECT. Cell 2009, 139, 855–860. 10.1016/j.cell.2009.11.005. [DOI] [PMC free article] [PubMed] [Google Scholar]
- Martin S.; Parton R. G. Lipid droplets: a unified view of a dynamic organelle. Nat. Rev. Mol. Cell Biol. 2006, 7, 373. 10.1038/nrm1912. [DOI] [PubMed] [Google Scholar]
- Thiam A. R.; Farese R. V. Jr.; Walther T. C. The biophysics and cell biology of lipid droplets. Nat. Rev. Mol. Cell Biol. 2013, 14, 775. 10.1038/nrm3699. [DOI] [PMC free article] [PubMed] [Google Scholar]
- Sathyanarayan A.; Mashek M. T.; Mashek D. G. ATGL promotes autophagy/lipophagy via SIRT1 to control hepatic lipid droplet catabolism. Cell Rep. 2017, 19, 1–9. 10.1016/j.celrep.2017.03.026. [DOI] [PMC free article] [PubMed] [Google Scholar]
- Wolinski H.; Kohlwein S. D.. Microscopic analysis of lipid droplet metabolism and dynamics in yeast. Membrane Trafficking; Springer: 2008; pp 151–163. [DOI] [PubMed] [Google Scholar]
- Reddy J. K.; Sambasiva Rao M. Lipid metabolism and liver inflammation. II. Fatty liver disease and fatty acid oxidation. American Journal of Physiology-Gastrointestinal and Liver Physiology 2006, 290, G852–G858. 10.1152/ajpgi.00521.2005. [DOI] [PubMed] [Google Scholar]
- Greenberg A. S.; Coleman R. A.; Kraemer F. B.; McManaman J. L.; Obin M. S.; Puri V.; Yan Q.-W.; Miyoshi H.; Mashek D. G. The role of lipid droplets in metabolic disease in rodents and humans. J. Clin. Invest. 2011, 121, 2102–2110. 10.1172/JCI46069. [DOI] [PMC free article] [PubMed] [Google Scholar]
- Welte M. A. Expanding roles for lipid droplets. Curr. Biol. 2015, 25, R470–R481. 10.1016/j.cub.2015.04.004. [DOI] [PMC free article] [PubMed] [Google Scholar]
- Goldberg I. J.; Reue K.; Abumrad N. A.; Bickel P. E.; Cohen S.; Fisher E. A.; Galis Z. S.; Granneman J. G.; Lewandowski E. D.; Murphy R.; Olive M.; Schaffer J. E.; Schwartz-Longacre L.; Shulman G. I.; Walther T. C.; Chen J. Deciphering the role of lipid droplets in cardiovascular disease: A report from the 2017 National Heart, Lung, and Blood Institute Workshop. Circulation 2018, 138, 305–315. 10.1161/CIRCULATIONAHA.118.033704. [DOI] [PMC free article] [PubMed] [Google Scholar]
- Schulze R. J.; Sathyanarayan A.; Mashek D. G. Breaking fat: The regulation and mechanisms of lipophagy. Biochim. Biophys. Acta, Mol. Cell Biol. Lipids 2017, 1862, 1178–1187. 10.1016/j.bbalip.2017.06.008. [DOI] [PMC free article] [PubMed] [Google Scholar]
- Jo J.; Shreif Z.; Periwal V. Quantitative dynamics of adipose cells. Adipocyte 2012, 1, 80–88. 10.4161/adip.19705. [DOI] [PMC free article] [PubMed] [Google Scholar]
- Olzmann J. A.; Carvalho P. Dynamics and functions of lipid droplets. Nat. Rev. Mol. Cell Biol. 2019, 20, 137–155. 10.1038/s41580-018-0085-z. [DOI] [PMC free article] [PubMed] [Google Scholar]
- Henne W. M.; Reese M. L.; Goodman J. M. The assembly of lipid droplets and their roles in challenged cells. EMBO J. 2018, 37, e98947. 10.15252/embj.201898947. [DOI] [PMC free article] [PubMed] [Google Scholar]
- Walther T. C.; Farese R. V. Jr. Lipid droplets and cellular lipid metabolism. Annu. Rev. Biochem. 2012, 81, 687–714. 10.1146/annurev-biochem-061009-102430. [DOI] [PMC free article] [PubMed] [Google Scholar]
- Tirinato L.; Pagliari F.; Limongi T.; Marini M.; Falqui A.; Seco J.; Candeloro P.; Liberale C.; Di Fabrizio E. An overview of lipid droplets in cancer and cancer stem cells. Stem Cells Int. 2017, 2017, 1656053. 10.1155/2017/1656053. [DOI] [PMC free article] [PubMed] [Google Scholar]
- Dong H.; Czaja M. J. Regulation of lipid droplets by autophagy. Trends Endocrinol. Metab. 2011, 22, 234–240. 10.1016/j.tem.2011.02.003. [DOI] [PMC free article] [PubMed] [Google Scholar]
- Chen H.; Sun H.; Zhang S.; Yan W.; Li Q.; Guan A.; Xiang J.; Liu M.; Tang Y. Monitoring autophagy in live cells with a fluorescent light-up probe for G-quadruplex structures. Chem. Commun. 2019, 55, 5060–5063. 10.1039/C9CC01263J. [DOI] [PubMed] [Google Scholar]
- Benador I. Y.; Veliova M.; Liesa M.; Shirihai O. S. Mitochondria bound to lipid droplets: where mitochondrial dynamics regulate lipid storage and utilization. Cell Metab. 2019, 29, 827. 10.1016/j.cmet.2019.02.011. [DOI] [PMC free article] [PubMed] [Google Scholar]
- Chowdhury R.; Amin M. A.; Bhattacharyya K. Intermittent fluorescence oscillations in lipid droplets in a live normal and lung cancer cell: time-resolved confocal microscopy. J. Phys. Chem. B 2015, 119, 10868–10875. 10.1021/jp5120042. [DOI] [PubMed] [Google Scholar]
- Mota A. A.; Carvalho P. H.; Guido B. C.; de Oliveira H. C.; Soares T. A.; Corrêa J. R.; Neto B. A. Bioimaging, cellular uptake and dynamics in living cells of a lipophilic fluorescent benzothiadiazole at low temperature (4 °C). Chem. Sci. 2014, 5, 3995–4003. 10.1039/C4SC01785D. [DOI] [Google Scholar]
- Zhang C.; Yang L.; Ding Y.; Wang Y.; Lan L.; Ma Q.; Chi X.; Wei P.; Zhao Y.; Steinbuchel A.; Zhang H.; Liu P. Bacterial lipid droplets bind to DNA via an intermediary protein that enhances survival under stress. Nat. Commun. 2017, 8, 15979. 10.1038/ncomms15979. [DOI] [PMC free article] [PubMed] [Google Scholar]
- Klymchenko A. S. Solvatochromic and fluorogenic dyes as environment-sensitive probes: design and biological applications. Acc. Chem. Res. 2017, 50, 366–375. 10.1021/acs.accounts.6b00517. [DOI] [PubMed] [Google Scholar]
- Guo L.; Tian M.; Feng R.; Zhang G.; Zhang R.; Li X.; Liu Z.; He X.; Sun J. Z.; Yu X. Interface-targeting strategy enables two-photon fluorescent lipid droplet probes for high-fidelity imaging of turbid tissues and detecting fatty liver. ACS Appl. Mater. Interfaces 2018, 10, 10706–10717. 10.1021/acsami.8b00278. [DOI] [PubMed] [Google Scholar]
- Yin J.; Peng M.; Ma Y.; Guo R.; Lin W. Rational design of a lipid-droplet-polarity based fluorescent probe for potential cancer diagnosis. Chem. Commun. 2018, 54, 12093–12096. 10.1039/C8CC07398H. [DOI] [PubMed] [Google Scholar]
- Xu H.; Zhang H.; Liu G.; Kong L.; Zhu X.; Tian X.; Zhang Z.; Zhang R.; Wu Z.; Tian Y.; Zhou H. Coumarin-Based Fluorescent Probes for Super-resolution and Dynamic Tracking of Lipid Droplets. Anal. Chem. 2019, 91, 977–982. 10.1021/acs.analchem.8b04079. [DOI] [PubMed] [Google Scholar]
- Zheng X.; Zhu W.; Ni F.; Ai H.; Gong S.; Zhou X.; Sessler J. L.; Yang C. Simultaneous dual-colour tracking lipid droplets and lysosomes dynamics using a fluorescent probe. Chem. Sci. 2019, 10, 2342–2348. 10.1039/C8SC04462G. [DOI] [PMC free article] [PubMed] [Google Scholar]
- Terai T.; Nagano T. Fluorescent probes for bioimaging applications. Curr. Opin. Chem. Biol. 2008, 12, 515–521. 10.1016/j.cbpa.2008.08.007. [DOI] [PubMed] [Google Scholar]
- Lv G.; Cui B.; Lan H.; Wen Y.; Sun A.; Yi T. Diarylethene based fluorescent switchable probes for the detection of amyloid-β pathology in Alzheimer’s disease. Chem. Commun. 2015, 51, 125–128. 10.1039/C4CC07656G. [DOI] [PubMed] [Google Scholar]
- Qin W.; Li K.; Feng G.; Li M.; Yang Z.; Liu B.; Tang B. Z. Bright and photostable organic fluorescent dots with aggregation-induced emission characteristics for noninvasive long-term cell imaging. Adv. Funct. Mater. 2014, 24, 635–643. 10.1002/adfm.201302114. [DOI] [Google Scholar]
- Luo J.; Xie Z.; Lam J. W. Y.; Cheng L.; Tang B. Z.; Chen H.; Qiu C.; Kwok H. S.; Zhan X.; Liu Y.; Zhu D. Aggregation-induced emission of 1-methyl-1, 2, 3, 4, 5-pentaphenylsilole. Chem. Commun. 2001, 1740–1741. 10.1039/b105159h. [DOI] [PubMed] [Google Scholar]
- Rumin J.; Bonnefond H.; Saint-Jean B.; Rouxel C.; Sciandra A.; Bernard O.; Cadoret J.-P.; Bougaran G. The use of fluorescent Nile red and BODIPY for lipid measurement in microalgae. Biotechnol. Biofuels 2015, 8, 42. 10.1186/s13068-015-0220-4. [DOI] [PMC free article] [PubMed] [Google Scholar]
- Gu Y.; Zhao Z.; Su H.; Zhang P.; Liu J.; Niu G.; Li S.; Wang Z.; Kwok R. T. K.; Ni X.-L.; Sun J.; Qin A.; Lam J. W. Y.; Tang B. Z. Exploration of biocompatible AIEgens from natural resources. Chem. Sci. 2018, 9, 6497–6502. 10.1039/C8SC01635F. [DOI] [PMC free article] [PubMed] [Google Scholar]
- Collot M.; Fam T. K.; Ashokkumar P.; Faklaris O.; Galli T.; Danglot L.; Klymchenko A. S. Ultrabright and fluorogenic probes for multicolor imaging and tracking of lipid droplets in cells and tissues. J. Am. Chem. Soc. 2018, 140, 5401–5411. 10.1021/jacs.7b12817. [DOI] [PubMed] [Google Scholar]
- Fam T.; Klymchenko A.; Collot M. Recent advances in fluorescent probes for lipid droplets. Materials 2018, 11, 1768. 10.3390/ma11091768. [DOI] [PMC free article] [PubMed] [Google Scholar]
- Gao M.; Su H.; Lin Y.; Ling X.; Li S.; Qin A.; Tang B. Z. Photoactivatable aggregation-induced emission probes for lipid droplets-specific live cell imaging. Chem. Sci. 2017, 8, 1763–1768. 10.1039/C6SC04842K. [DOI] [PMC free article] [PubMed] [Google Scholar]
- Wang Z.; Gui C.; Zhao E.; Wang J.; Li X.; Qin A.; Zhao Z.; Yu Z.; Tang B. Z. Specific fluorescence probes for lipid droplets based on simple AIEgens. ACS Appl. Mater. Interfaces 2016, 8, 10193–10200. 10.1021/acsami.6b01282. [DOI] [PubMed] [Google Scholar]
- Jiang J.; Hu D.; Hanif M.; Li X.; Su S.; Xie Z.; Liu L.; Zhang S.; Yang B.; Ma Y. Twist Angle and Rotation Freedom Effects on Luminescent Donor-Acceptor Materials: Crystal Structures, Photophysical Properties, and OLED Application. Adv. Opt. Mater. 2016, 4, 2109–2118. 10.1002/adom.201600608. [DOI] [Google Scholar]
- Jiang M.; Gu X.; Lam J. W.; Zhang Y.; Kwok R. T.; Wong K. S.; Tang B. Z. Two-photon AIE bio-probe with large Stokes shift for specific imaging of lipid droplets. Chem. Sci. 2017, 8, 5440–5446. 10.1039/C7SC01400G. [DOI] [PMC free article] [PubMed] [Google Scholar]
- Reja S. I.; Khan I. A.; Bhalla V.; Kumar M. A TICT based NIR-fluorescent probe for human serum albumin: a pre-clinical diagnosis in blood serum. Chem. Commun. 2016, 52, 1182–1185. 10.1039/C5CC08217J. [DOI] [PubMed] [Google Scholar]
- Hsieh K.; Lee Y. K.; Londos C.; Raaka B. M.; Dalen K. T.; Kimmel A. R. Perilipin family members preferentially sequester to either triacylglycerol-specific or cholesteryl-ester-specific intracellular lipid storage droplets. J. Cell Sci. 2012, 125, 4067–4076. 10.1242/jcs.104943. [DOI] [PMC free article] [PubMed] [Google Scholar]
- Gao M.; Su H.; Li S.; Lin Y.; Ling X.; Qin A.; Tang B. Z. An easily accessible aggregation-induced emission probe for lipid droplet-specific imaging and movement tracking. Chem. Commun. 2017, 53, 921–924. 10.1039/C6CC09471F. [DOI] [PubMed] [Google Scholar]
- Reichardt C. Solvatochromic dyes as solvent polarity indicators. Chem. Rev. 1994, 94, 2319–2358. 10.1021/cr00032a005. [DOI] [Google Scholar]
- Nguyen T. B.; Olzmann J. A. Lipid droplets and lipotoxicity during autophagy. Autophagy 2017, 13, 2002–2003. 10.1080/15548627.2017.1359451. [DOI] [PMC free article] [PubMed] [Google Scholar]
- Raudsepp P.; Bruggemann D. A.; Knudsen J. C.; Andersen M. L. Localized lipid autoxidation initiated by two-photon irradiation within single oil droplets in oil-in-water emulsions. Food Chem. 2016, 199, 760–767. 10.1016/j.foodchem.2015.12.070. [DOI] [PubMed] [Google Scholar]
- Khor V. K.; Shen W.-J.; Kraemer F. B. Lipid droplet metabolism. Curr. Opin. Clin. Nutr. Metab. Care 2013, 16, 632–637. 10.1097/MCO.0b013e3283651106. [DOI] [PMC free article] [PubMed] [Google Scholar]
- Murphy S.; Martin S.; Parton R. G. Quantitative analysis of lipid droplet fusion: inefficient steady state fusion but rapid stimulation by chemical fusogens. PLoS One 2010, 5, e15030. 10.1371/journal.pone.0015030. [DOI] [PMC free article] [PubMed] [Google Scholar]
- Li W.; Wang L.; Tang H.; Cao D. An interface-targeting and H2O2-activatable probe liberating AIEgen: enabling on-site imaging and dynamic movement tracking of lipid droplets. Chem. Commun. 2019, 55, 4491–4494. 10.1039/C9CC01404G. [DOI] [PubMed] [Google Scholar]
- Ning P.; Hou L.; Feng Y.; Xu G.; Bai Y.; Yu H.; Meng X. Real-time visualization of autophagy by monitoring the fluctuation of lysosomal pH with a ratiometric two-photon fluorescent probe. Chem. Commun. 2019, 55, 1782–1785. 10.1039/C8CC09517E. [DOI] [PubMed] [Google Scholar]
Associated Data
This section collects any data citations, data availability statements, or supplementary materials included in this article.