Abstract
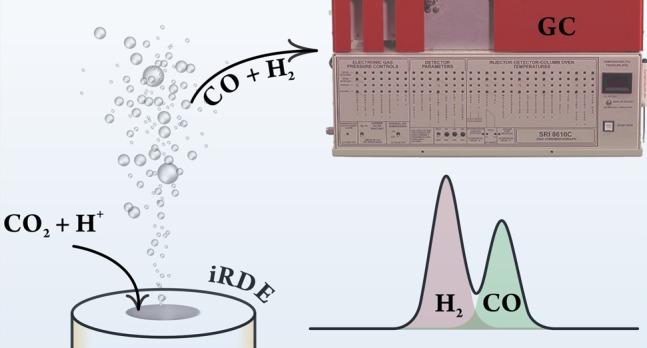
The use of rotating disk electrodes (RDEs) is probably the most convenient way of studying simple electrode reactions under well-defined transport conditions. Standard RDEs become, however, less expedient when the studied electrode process is a complex one, leading to the formation of various reaction products. In these cases, the accurate detection and quantification of the formed products are desirable. If the formed products are gaseous, then the usual way of quantifying them is the use of online gas chromatography (GC), a method that is not compatible with open RDE cells. In order to overcome these difficulties, we present here a sophisticated inverted RDE (iRDE) cell design. The design combines various advantages: it is amenable to the same mathematical treatment as standard (downward-facing) RDEs; it can be operated airtight and coupled to online GC; and due to its upward-facing design, the electrode surface is less prone to blockage by any formed gas bubbles. The iRDE&GC design is tested using simple model reactions and is demonstratively used for studying the electrochemical reduction of CO2, accompanied by parasitic hydrogen evolution, on a silver electrode.
Easy to construct with a variety of electrode materials and amenable to rigorous theoretical treatment, the rotating disk electrode (RDE) is the most widely employed hydrodynamic method used for the investigation of electrode processes.1 In an RDE system, stationary concentration profiles are attained rather quickly and steady-state current/potential characteristics can be measured. The rate of mass transfer in an RDE configuration is typically higher than that of diffusion alone in quiescent systems, which makes RDEs useful for electrocatalysis research. By using RDEs, the supply of reactants to the electrode surface can be controlled, enabling the distinction between mass transport and kinetic limitations, e.g., by means of analysis based on the Koutecký–Levich equation.1,2
The interpretation of RDE measurements becomes less straightforward when the studied reaction has complex kinetics (leading to the formation of more than one reaction product) or if it is accompanied by other (parasitic) side reactions. Examples include the deposition of base metals,3,4 almost inevitably accompanied by hydrogen evolution; the chloralkali process competing with oxygen evolution;5 and the electrochemical reduction of either carbon dioxide6−11 or nitrogen.12,13 These latter processes, apart from being accompanied by hydrogen evolution, can themselves lead to the formation of various products. In these cases, the accurate (quantitative) determination of the formed products is a prerequisite of any valid RDE analysis. Since many of the products are gaseous, online gas chromatographic (GC) headspace analysis14 seems to be an obvious choice; however, applying GC in a traditional (i.e., open-to-air) RDE cell is not straightforward.
To the best of our knowledge, there exist only a few designs in the literature for hermetically closed RDE cells that could be applicable to, although they were not applied to, online GC detection.15,16 These designs utilized magnetic coupling in order to transfer the momentum necessary to rotate an electrode through the cell wall. The approach successfully circumvents the problem of sealing between the rotating shaft and the stagnant cell wall: it may not ensure, however, a full transfer of momentum under high-friction conditions.
A possible alternative to magnetic coupling15,16 is offered by the use of direct momentum transfer through a gland seal. While airtight seals are difficult to design, liquid-tight seals are relatively easy to manufacture, with the only requirement that the RDE is brought into contact with the electrolyte solution by insertion through the cell bottom. In this case, the headspace itself can be tightly connected to a GC instrument, and the top of the cell also allows an insertion point for a (fixed) reference electrode. As in the case of other “H-type” cell designs,14 the counter electrode compartment must be separated, by a membrane, from the inverted RDE (iRDE) compartment so that any counter electrode products are excluded from the GC analysis.
Apart from the direct transfer of momentum, a further advantage of using an iRDE design for GC analysis arises from the fact that in iRDEs the electrode is upward-facing. This has no adverse effect on the validity of the hydrodynamic calculations necessary for the mathematical description of transport17 (i.e., simple expressions such as the Levich and Koutecký–Levich equations remain applicable). It aids, however, in the removal of bubbles that often cause electrode surface blockage in standard (downward-facing) RDE designs.
Some iRDE designs have already been published,18−22 and some of these were operated in airtight cells. Hermetic cells were, however, used only in order to ensure oxygen-free conditions, and so far, no GC-based product detection was carried out in an iRDE configuration. Furthermore, the previous iRDE designs were validated only for simple model reactions (namely, the ferro-/ferricyanide redox system18−20), and either no validation for gas-evolving reactions was used or the interpretation of these measurements was not conclusive.21,22
This contribution aims to fill the gap of combining an iRDE configuration with GC-based product detection. The constructed iRDE&GC design is validated by means of simple test measurements. We show that the limiting currents measured in a ferro-/ferricyanide test system and those measured for the hydrogen evolution reaction (HER) in mildly acidic solutions are in perfect agreement with the Levich equation. In the case of the latter reaction, we are also able to detect 100% of the formed hydrogen by means of GC.
Subsequently, we employ the developed iRDE&GC system, fitted with a polycrystalline Ag electrode, for a demonstrative test measurement on the electrochemical CO2 reduction reaction (CO2RR). The iRDE&GC system is a powerful tool in this case for a combined product distribution–reaction kinetics study. We show that by using the iRDE&GC hyphenation, partial currents of CO2RR and HER can be distinguished and made subject, individually, to kinetic analysis.
Experimental Section
Cell and iRDE Design
The hermetically tight iRDE cell (Figure 1) consists of two separable compartments made of round borosilicate glass flasks (nominal volume: 80 cm3). Necks for inserting the reference and counter electrodes and the gas inlets and outlets are mounted on the flasks and are equipped with custom-winding poly(tetrafluoroethylene) (PTFE) caps and O-ring fittings, allowing gastight operation. A Nafion ion-exchange membrane (Nafion 117, Sigma-Aldrich) connects the working and counter electrode compartments. The housing of the iRDE, machined from polyoxymethylene (POM), provides rigid connection to a standard rotator unit (AFMSRCE, Pine) and bears a cone joint to fit to the outer socket of the electrochemical cell (size 29/32, ground glass joint standard). Rotation is transferred by a modified RDE shaft that fits into the AFMSRCE rotator. It bears two ceramic sleeves, passing through radial shaft seals.
Figure 1.
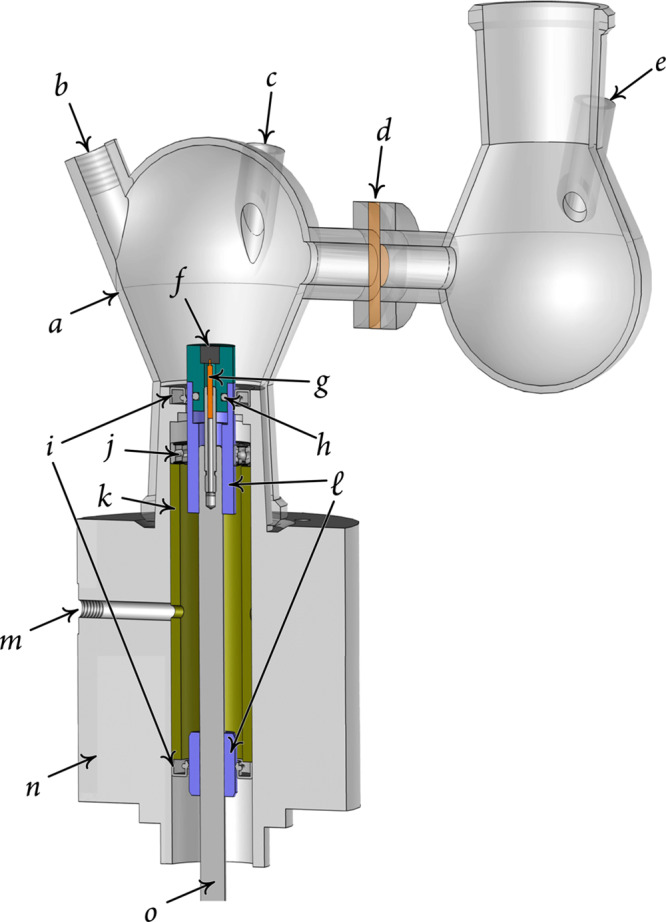
H-type cell equipped
with an iRDE. Parts of the design: (a) glass cell
body, (b) purging gas inlet
(outlet not shown), (c) reference electrode inlet,
(d) membrane and sealing junction, (e) counter electrode inlet, (f) PCTFE iRDE tip with
an electrode embedded, (g) spring contact node, (h) PTFE tip groove for the O-ring fitting, (i) radial shaft seals (upper and lower), (j) ball
bearing, (k) pressurized gland chamber, ( ), ceramic
fittings (upper and lower), (m) pressurizer gas inlet,
(n) POM housing,
and (o) rotating shaft (stainless steel).
As a safety component, the design also includes a pressure chamber: a single POM tube confined between the radial shaft seals, fed by N2 or Ar (99.999%, Carbagas) through a lateral pressurizing gas inlet. Through it, a constant overpressure of 0.2–0.4 bar is maintained in the gland seal, preventing the leakage of electrolyte solution into the seal. The exact coaxial position of the rotating shaft is maintained by a ball bearing, situated in the upper part of the pressure chamber. The radial shaft seals are made of high-quality Viton rubber and operate oil- and grease-free. The upper seal comes in contact with the solution in the working electrode compartment.
The RDE working electrodes are pressed into a laboratory-made poly(chlorotrifluoroethylene) (PCTFE) holder, fitted into the upper ceramic sleeve. Tightness is maintained by an O-ring (not shown in Figure 1), placed in the groove of the PTFE holder. A spring contact in the shaft provides electrical connection to the working electrode. The whole system is easy to maintain, and the radial shaft seals can be exchanged once they are worn out.
Gas Chromatography
Any gaseous products generated in the cell can be detected by connecting the purging gas outlet to a GC analyzer (SRI Instruments Multigas Analyzer no. 3). The continuous flow of a carrier gas (usually Ar or CO2, both 99.999% pure, Carbagas) through the electrolysis cell carries volatile reaction products from the headspace into the sampling loops of the gas chromatograph. The partial current Ii, corresponding to the formation of a gaseous product i, can be calculated as14
| 1 |
where xi denotes the mole fraction of the products, determined by GC using an independent calibration standard gas (Carbagas), ni is the number of electrons involved in the reduction reaction to form a particular product (n = 2 for both CO and H2 formation), F = 96 485.3 C mol–1 is Faraday’s constant, and vm is the molar gas flow rate measured with a universal flowmeter (7000 GC flowmeter, Ellutia) at the exit of the electrochemical cell.
The Faradaic efficiency (FE) of a given reaction product can be determined by dividing the respective partial current, determined from eq 1, by the total current, measured electrochemically. During the operation of the iRDE&GC cell, aliquots are analyzed in intervals of 7 to 20 min during steady-state electrolyses. For the measurements reported, we managed to detect, within the range of error, 100% of the products because no soluble products were formed. The latter was also checked by a postmortem analysis of the electrolyte using ion exchange chromatography (Metrohm).
Electrochemistry
Electrochemical measurements were performed at room temperature with a potentiostat/galvanostat system (Metrohm Autolab 128N) in a three-electrode configuration. A “leakless” Ag|AgCl|3 mol dm–3 KCl reference electrode (Pine) and a Pt foil counter electrode (0.8 cm × 2.0 cm, Goodfellow) were used. The glassy carbon, Pt, and Ag working electrodes were 5-mm-diameter disk electrodes purchased from Pine. When reporting current densities (j) instead of the current (I), we used the geometric surface area (0.196 cm2) for normalization.
All electrodes were polished to a mirror finish with 0.05 μm alumina particles (Micropolish, Buehler) on a polishing cloth (Buehler) and thoroughly rinsed with Milli-Q water (18.2 M cm, TOC ≤ 5 ppb, Millipore) prior to electrochemical measurements.
All of the reported potentiostatic or potentiodynamic measurement results were obtained by using automatic IR compensation, following an impedance-spectroscopy-based determination of the cell resistance.
Chemicals
All solutions were prepared with as-received chemicals and Milli-Q water. Potassium ferrocyanide (K4[Fe(CN)6], ≥99.5), potassium ferricyanide (K3[Fe(CN)6], ≥99%), and potassium chloride (KCl, ≥99.5%) were purchased from Fluka. Potassium sulfate (K2SO4, ≥99%), sulfuric acid (96% H2SO4, suprapure), sodium perchlorate (NaClO4, 99.99%), and perchloric acid (70% HClO4, suprapure) were purchased from Merck.
Results and Discussion
Validation of the iRDE Design in the Absence of Gas Evolution
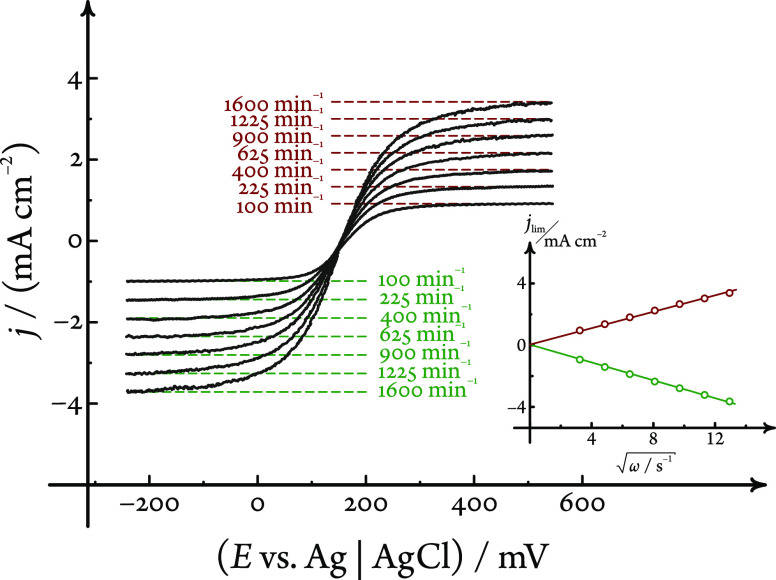
In order to check the hydrodynamic performance of the iRDE design, we measured linear sweep voltammograms (LSVs, sweep rate 20 mV s–1) on a glassy carbon iRDE in a 1 mol dm–3 KCl electrolyte solution containing the ferro-/ferricyanide redox couple in equimolar (5 mmol dm–3) concentrations. The voltammograms, shown in Figure 2, were recorded at seven different rotational rates, distributed equidistantly on a square-root scale between 100 and 1600 min–1. Well-defined limiting currents were reached for both the oxidation and reduction reactions, showing an excellent linear dependence (R2 = 0.9996, with a zero offset) on the square root of the rotational rate. This dependence was analyzed by using the Levich equation1
| 2 |
where n = 1 is the number of electrons transferred, D denotes the diffusion coefficient and c denotes the bulk concentration of the reacting species, ν = 0.008917 cm2 s–1 is the kinematic viscosity of water at 25 °C, and ω is the angular frequency of rotation.
Figure 2.
Validation of the hydrodynamic performance of the iRDE setup with a non-gas-evolving reaction. Limiting currents (both anodic and cathodic) measured by linear sweep voltammetry on a glassy carbon iRDE in a solution containing the K4[Fe(CN)6]/K3[Fe(CN)6] redox couple in equimolar concentrations scale linearly with the square root of the rotation rate. Green and red dashed lines show the cathodic and anodic limiting currents, respectively, predicted by eq 2 and the diffusion coefficient values mentioned in the text, at the given rotation rates. Sweep rate 20 mV s–1.
The analysis yielded the diffusion coefficients, (8.25 ± 0.25) × 10–6 and (9.42 ± 0.17) × 10–6 cm2 s–1, for the [Fe(CN)6]4– and [Fe(CN)6]3– ions, respectively. These are in good agreement with the literature data,23 confirming that in this simple redox system (where no gas evolution is taking place) the hydrodynamic behavior of the iRDE is the same as that of normal RDEs.
Validation of the iRDE Design for a Gas-Evolving Reaction
We used the hydrogen evolution reaction (HER) as a model reaction in order to study the influence of gas formation on the hydrodynamic properties of the iRDE system.
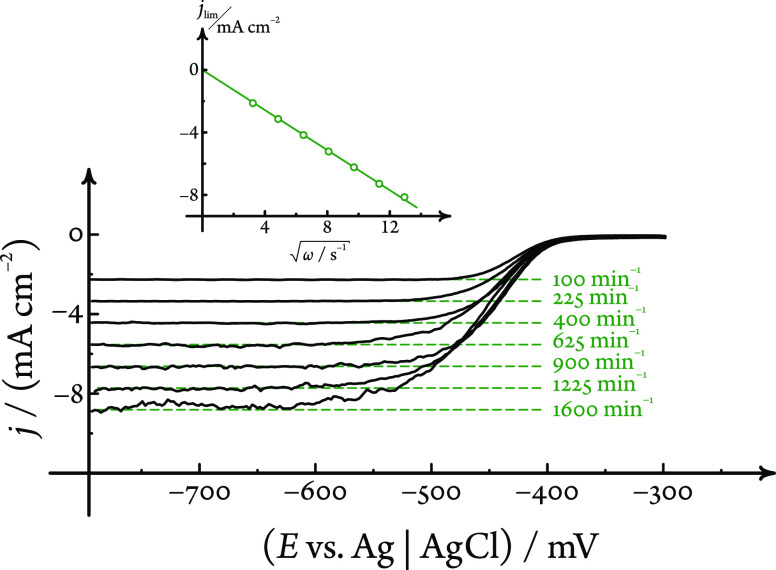
For these measurements, a 0.1 mol dm–3 NaClO4 electrolyte solution was prepared, the pH of which was adjusted to the value of 2.56 (checked with a pH meter) by the addition of a small amount of perchloric acid. Linear sweep voltammograms (sweep rate 50 mV s–1) recorded on a Pt iRDE immersed in this solution exhibited a well-defined diffusion-limited plateau, as shown in Figure 3. Although in the case of this gas-evolving reaction the noise of the current signal was considerably higher compared to that of the previous case, the limiting currents did show a linear dependence on the square root of the rotational rate, and an analysis based on the Levich equation (eq 2) yielded a value of (8.79 ± 0.12) × 10–5 cm2 s–1 for the diffusion coefficient of H+ ions, again matching previous reports well.
Figure 3.
Validation of the hydrodynamic performance of the iRDE setup with HER, a gas-evolving reaction. Limiting currents measured by linear sweep voltammetry (sweep rate 50 mV s–1) on a Pt iRDE in a pH 2.56 HClO4/NaClO4 solution scale linearly with the square root of the rotational rate. The dashed green lines are limiting current predictions of the Levich equation (eq 2), calculated using the diffusion coefficient value mentioned in the text at all of the given rotational rates.
At this point we note that the aforementioned diffusion coefficient value was obtained by assuming that cH+ = 10–pH mol dm–3 in eq 2. In other words, we considered a unity relative activity coefficient of H+ ions, and we assumed that the limiting current is determined solely by the concentration of free H+ in the solution.
While both of the above assumptions are fairly valid for a HClO4/NaClO4 electrolyte solution, they do not hold for more complex (i.e., buffered) systems. In K2SO4 solutions acidified with sulfuric acid, for example, we measured voltammograms that exhibited higher than expected limiting currents, confirming the previous experimental results of Nierhaus et al.22 obtained with another iRDE design. In ref (22), this peculiar current enhancement was explained by an “extra stirring” of the electrolyte due to the produced H2 bubbles. We believe, however, that there exists an alternative, more straightforward explanation, namely, that the current increase is due to the buffered nature of the H2SO4/K2SO4 system that contains not only H+ but also HSO4– ions acting as a proton source.10,24,25
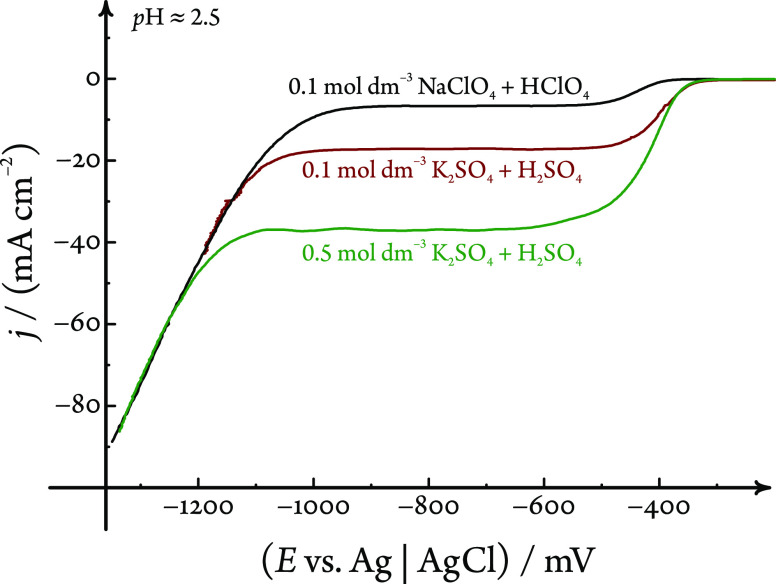
The above argument is supported by Figure 4, where three linear sweep voltammograms are compared. These LSVs were recorded in electrolyte (either NaClO4 or K2SO4) solutions that were acidified to a pH value of about 2.5 by the addition of small volumes of the native, concentrated acid (either HClO4 or H2SO4). Although the bulk pH and also other parameters (such as the sweep and rotational rates) of the recorded LSVs are essentially the same, Figure 4 reveals a pronounced difference in the limiting currents. We ascribe this 2- to 6-fold increase in the limiting current (depending on the sulfate concentration) to the buffering capacity of HSO4– ions.
Figure 4.
Although the bulk pH is about the same, LSVs obtained in different electrolyte solutions exhibit varying limiting currents for H+ reduction. The sweep rate is 50 mV s–1, the rotational rate is 900 min–1, and the electrolyte compositions and the pH are shown in the graph. The given pH was set by adding a few drops of the respective concentrated acid to the electrolyte solution.
Validation of the iRDE&GC Hyphenation
The hydrogen evolution reaction, leading to the formation of a single reaction product (H2), is an ideal platform for validating the hyphenation of the iRDE design with GC detection. In order to achieve this, we applied a continuous Ar flow to the cell and led the gas in the headspace to the sampling loop of a gas chromatograph. After some 30 min of electrolysis, practically independent of the applied rotational rate, we were able to detect 100 ± 5% of the formed hydrogen gas. The latency can be explained by the gaseous product requiring a certain time to reach and fill up the sampling loop.
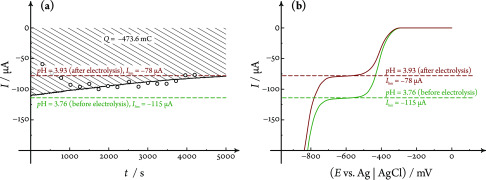
Figure 5a shows electrochemically measured and, based on eq 1, chromatographically determined currents of HER measured in a pH 3.75 HClO4/ NaClO4 solution at potentials in the limiting current region. Note that both currents, although matching each other relatively well, decay significantly and drop by about 28% of their initial values over the approximately 80 min time frame of the electrolysis.
Figure 5.
Results of long-term electrolysis (hydrogen evolution from a HClO4/NaClO4 electrolyte solution) measured by iRDE&GC. Currents measured electrochemically (full black curve) and chromatographically (calculated using eq 1, dots) at E = −625 mV vs Ag|AgCl are shown in (a). A slow drift (decay) over time can be observed as a result of the electrolysis becoming exhaustive. Values of pH measured before and after the electrolysis, along with limiting currents estimated using the respective H+ concentrations and the diffusion coefficient of 8.79 × 10⁻⁵ cm2 s–1 are shown by the dashed horizontal lines. This pH change is in alignment with the shifting of the LSV plateaus shown in (b) and also corresponds to the estimated H+ concentration change calculated by taking into account the charge of the electrolysis, shown as the hatched area in (a), and a cell volume of 87 cm3. The applied rotational rate was 1600 min–1, and the linear sweep voltammograms were recorded at a sweep rate of 50 mV s–1.
This current drop, seen only in H-type iRDE cells equipped with a membrane, can be explained by a permanent pH change (also in the bulk of the solution), caused by the long-lasting electrolysis becoming partially exhaustive. Indeed, as shown by Figure 5b, the linear sweep voltammograms measured before and after electrolysis exhibit different limiting current values, and a corresponding pH change can also be measured directly with a meter. For the experiment shown in Figure 5b, the pH increased from a value of 3.76 to 3.93. This change scales well with the decrease in the limiting current (measured before and after the electrolysis) and is also in agreement with the H+ concentration change that the charge of the electrolysis is expected to cause in the total electrolyte volume of the working compartment (about 87 cm3 for this experiment).
It should further be noted with respect to the iRDE&GC hyphenation that for this system to deliver correct “chromatographic currents” it is crucial to make sure that all of the gas bubbles formed during the electrolysis reach the headspace and do not remain adhered to the tip surface. This can be assured by directing the purging gas inlet tube as close as possible to the tip (however, not directly to the electrode) surface. Although the approach results in an elevated noise level of the electrochemical measurement, it has only a small effect on the hydrodynamics (cf. Figure 3, where this configuration was already used; the measured limiting currents, however, did remain well-defined).
Using the iRDE&GC System to Investigate the CO2RR
In a further demonstrative experiment, we attempt to use the developed iRDE&GC system to study the electroreduction of carbon dioxide as it occurs on a silver iRDE in a 0.1 mol dm–3 K2SO4 solution saturated with CO2 (pH ∼4.17). We chose this specific electrolyte composition in order to get well-defined potential ranges where the predominant reduction product is either H2 or CO.
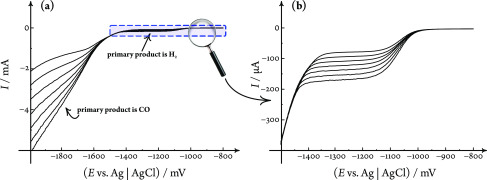
Linear sweep surveys, shown in Figure 6a, revealed that HER goes on and becomes diffusion-limited in the potential range between −1.2 and −1.4 V vs Ag|AgCl: this range is displayed in detail in Figure 6b. It can be assumed that in this potential range the sole electrode reaction taking place is that described by eq 3,
| 3 |
where the reactant H+ ions are present either in the form of free H+ or in the form of HSO4–.
Figure 6.
(a) Survey voltammograms recorded at a sweep rate of 50 mV s–1 on a Ag iRDE in a 0.1 mol dm–3 K2SO4 solution saturated with CO2 (pH ∼4.17). Cathodic currents increase with increasing rotational rates (100, 225, 400, 625, 900, 1225, and 1600 min–1). (b) Hydrogen evolution attains a limiting current at lower overpotentials. At higher cathodic overpotentials, the electroreduction of CO2 competes with the reduction of water. In this potential range, CO is the primary product of electrolysis.
At potentials more cathodic than −1.6 V vs Ag|AgCl, we see the onset of another process: the electroreduction of CO2 that yields CO as the primary product
| 4 |
Although the voltammograms in Figure 6a exhibit no clear plateaus for this process, they do confirm the limiting role of transport because the currents measured below −1.6 V clearly depend, more or less linearly, on the square root of the applied rotational rate. This could be caused by a concentration limitation of either CO2 or H+ or both in the system under study: note that H+ also appears as a reactant in eq 4.
It is very probable that at extremely cathodic potentials (E < −1.8 V vs Ag|AgCl) a third process, namely, the electrolysis of water molecules, should also occur
| 5 |
again favoring the production of H2 over that of CO. With respect to this process, it is important to note that its exact onset potential can be heavily affected by effects such as the buffer (HSO4–) concentration of the solution25 and even the choice of the polishing material. Polishing with alumina particles, for example, was recently shown to shift the onset of water reduction to less cathodic potentials.26 (More about the effect of alumina polishing can be read in the Supporting Information.)
The above-described scenario can be confirmed and even quantified by applying iRDE&GC hyphenation. By carrying out galvanostatic electrolyses of CO2-saturated K2SO4 solutions at a fixed rotational rate (625 min–1), we applied GC detection in order to determine the product distribution of the cathode process. In agreement with literature data,27,28 the only detectable products were H2 and CO, and within the first 40 min of the electrolyses, a 100% detection efficiency was practically achieved. After each electrolysis, the current was switched off and the electrolyte solution was replaced in order to avoid the accumulation of the exhaustion effects described in the previous section.
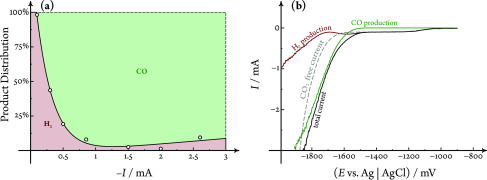
The recorded Faradaic efficiency vs current data were subjected to a numerical interpolation in order to determine the product distribution shown in Figure 7a. This figure allows a distinction among three current density regions with remarkably different product yields.
Figure 7.
IRDE&GC system applied to the study of the electrolysis of a 0.1 mol dm–3 K2SO4 solution saturated with CO2 (pH ∼4.17). Applied rotational rate 625 min–1. (a) Faradaic efficiencies of H2 and CO formation are determined chromatographically (dots) and are interpolated using an arbitrary function (exponential decay superimposed on a straight line, black curve). (b) This interpolation allows the separation of the recorded LSVs: the total current and the partial currents of H2 and CO production are shown as black, red, and green curves, respectively. An LSV measured in a CO2-free (Ar-saturated) K2SO4 solution, the pH of which was set to 4.15 by direct H2SO4 addition, is shown as a reference (dashed gray curve).
First, at currents not exceeding the limiting current of HER from acidic media (i.e., the maximal current that can be supplied by the reaction in eq 3), it seems that H2 is the primary product of electrolysis, and there is very little, if any, detectable CO. At current densities exceeding this limiting current (about 0.1 mA for the system shown in Figure 7), there is a marked increase in CO productivity due to the onset of CO2RR, as described by eq 4. The growing CO productivity trend continues up to the point where the current becomes approximately an order of magnitude higher than the limiting current of (acidic) HER, at which point the Faradaic efficiency of H2 evolution will again increase. This is due to the onset of the direct reduction of water molecules according to eq 5.
The two aforementioned processes (CO2RR and the reduction of water molecules) occur concomitantly, and the LSV recorded in the system (black curve in Figure 7b) exhibits no clear limiting current plateau for CO2RR. Nevertheless, the interpolation shown in Figure 7a does create some means to separate the individual contributions of CO production (electroreduction) and H2 formation (H+ or water reduction) to the total current.
At each and every point on the LSV shown by the black curve in Figure 7b, we can calculate, using the interpolation of Figure 7a, the partial currents that correspond to CO and to H2 formation. These partial currents are plotted as green and red curves, respectively, in Figure 7b. The sum of the partial currents, by definition, equals the total current shown by the black curve.
Identifying the two partial currents, as shown in Figure 7b, allows for a better understanding of the kinetics of CO2RR: a reaction that is inevitably coupled to hydrogen evolution. The figure reveals that at potentials less cathodic than the onset potential of CO2RR, all measured currents can be attributed to hydrogen evolution, and this section of the LSV is identical to that measured in a CO2-free electrolyte solution of the same pH (dashed gray curve shown as a reference in Figure 7b).
The onset of CO2 reduction allows the cathodic current to increase beyond the limiting current of (acidic) hydrogen evolution at E < −1.5 V vs Ag|AgCl. This current increase, at least initially, can be fully ascribed to CO2 electroreduction: the reduction of water molecules only seems to commence at more negative potentials, E < −1.75 V. Note that the apparent onset potential of water reduction is about 150 mV more negative in the CO2-saturated solution than in the CO2-free reference system and that the partial current of H2 production does not rise monotonically with the applied potential. It seems more than plausible to assume that this peculiar feature, revealed by the iRDE&GC hyphenation, can be explained by the H+ consumption of CO2RR, as described by eq 4. Due to the autoprotolysis equilibrium of water, the H+ consumption of CO2RR leads to an increase in near-surface OH– concentrations, and as OH– ions appear as a product in eq 5, this shifts the onset of water reduction toward more cathodic values.
Conclusions
We presented the design of a custom-made, hermetically sealed inverted rotating disk electrode coupled to a gas chromatographic detection system. The developed iRDE&GC system is suitable for electrochemical kinetic studies with the simultaneous analysis of the formed (gaseous) reaction products. The performance of the iRDE&GC hyphenation was evaluated using the ferro-/ferricyanide redox system and the hydrogen evolution reaction as test settings.
Apart from having conducted a successful validation of the iRDE&GC system, we pointed out two major caveats of the design. Probably the most important condition of using the iRDE&GC hyphenation is related to an inherent property of any GC-based headspace analyses in electrochemistry, namely, that the electrolyses must hold long enough that the reaction products can accumulate in the sampling loop in a sufficient amount in order to facilitate 100% detection. Even in the case of an upward-facing iRDE system it seems unavoidable to carefully orient the purging gas flow to remove any formed gas bubbles that could otherwise remain adhered to the electrode tip, resulting in detection deficiencies. Special care must be taken in this situation so that the purging gas flow does not interfere with the convective transport of the rotating disk.
Another important point that deserves emphasis is related to the transport conditions of the iRDE cell. In this hydrodynamic configuration, convection allows for a much higher rate of transport, compared to that in other quiescent systems. Although it is usually assumed that on rotating electrodes stationary current/potential characteristics can be attained, this condition may not hold for long-lasting experiments during which the electrolysis becomes at least partially exhaustive. This second limitation may, however, be overcome if the electrolyte solution is replaced from time to time or when a continuous flow of electrolyte guarantees that no permanent bulk concentration changes can be caused by the electrolysis.
We have further shown, by means of one demonstrative experiment, that the developed iRDE&GC hyphenation can have great potential in understanding the kinetics of technologically relevant electrochemical processes. We demonstrated that in the case of carbon dioxide reduction on silver electrodes the iRDE&GC setup allows for a resolution of the voltammetric response to individual contributions of actual reduction and hydrogen evolution.
Acknowledgments
We kindly acknowledge the efforts dedicated to this project by Mr. Thomas Hübscher and Mr. René Schraner of the mechanical and electronics workshops of the University of Bern. Support by the CTI Swiss Competence Center for Energy Research (SCCER Heat and Electricity Storage) is gratefully acknowledged. P.B. acknowledges financial support from the Swiss National Foundation (grant 200020-172507). S.V. acknowledges support from the National Research, Development and Innovation Office of Hungary (NKFIH grant PD124079). M.d.J.G.-V. and N.K. acknowledge the financial support of the Swiss Government Excellence Scholarships for Foreign Scholars (ESKAS).
Supporting Information Available
The Supporting Information is available free of charge at https://pubs.acs.org/doi/10.1021/acs.analchem.9b04999.
Scanning electron micrographs and energy-dispersive X-ray spectra of alumina and diamond-polished silver RDE surfaces (PDF)
Author Contributions
§ These authors contributed equally.
The authors declare no competing financial interest.
Supplementary Material
References
- Vesztergom S. In Encyclopedia of Interfacial Chemistry: Surface Science and Electrochemistry; Wandelt K., Ed.; Elsevier: Amsterdam, 2018; pp 421–444. [Google Scholar]
- Levich B. The Theory of Concentration Polarisation. Discuss. Faraday Soc. 1947, 1, 37–49. 10.1039/df9470100037. [DOI] [Google Scholar]
- Kuhn A. T.; Chan C. Y. pH Changes at Near-Electrode Surfaces. J. Appl. Electrochem. 1983, 13, 189–207. 10.1007/BF00612481. [DOI] [Google Scholar]
- Ying R. Y. Electrodeposition of Copper-Nickel Alloys from Citrate Solutions on a Rotating Disk Electrode. J. Electrochem. Soc. 1988, 135, 2964–2971. 10.1149/1.2095470. [DOI] [Google Scholar]
- Vos J. G.; Koper M. T. M. Measurement of Competition between Oxygen Evolution and Chlorine Evolution Using Rotating Ring–Disk Electrode Voltammetry. J. Electroanal. Chem. 2018, 819, 260–268. 10.1016/j.jelechem.2017.10.058. [DOI] [Google Scholar]
- Hall A. S.; Yoon Y.; Wuttig A.; Surendranath Y. Mesostructure-Induced Selectivity in CO2 Reduction Catalysis. J. Am. Chem. Soc. 2015, 137, 14834–14837. 10.1021/jacs.5b08259. [DOI] [PubMed] [Google Scholar]
- Bandi A. Electrochemical Reduction of Carbon Dioxide on Conductive Metallic Oxides. J. Electrochem. Soc. 1990, 137, 2157–2160. 10.1149/1.2086903. [DOI] [Google Scholar]
- Aoki A.; Nogami G. Rotating Ring–Disk Electrode Study on the Fixation Mechanism of Carbon Dioxide. J. Electrochem. Soc. 1995, 142, 423–427. 10.1149/1.2044046. [DOI] [Google Scholar]
- Bandi A.; Kühne H.-M. Electrochemical Reduction of Carbon Dioxide in Water: Analysis of Reaction Mechanism on Ruthenium-Titanium-Oxide. J. Electrochem. Soc. 1992, 139, 1605–1610. 10.1149/1.2069464. [DOI] [Google Scholar]
- Ooka H.; Figueiredo M. C.; Koper M. T. M. Competition betweenHydrogen Evolution and Carbon Dioxide Reduction on Copper Electrodes in Mildly Acidic Media. Langmuir 2017, 33, 9307–9313. 10.1021/acs.langmuir.7b00696. [DOI] [PMC free article] [PubMed] [Google Scholar]
- Dutta A.; Kuzume A.; Kaliginedi V.; Rahaman M.; Sinev I.; Ahmadi M.; Roldán Cuenya B.; Vesztergom S.; Broekmann P. Probing the Chemical State of Tin Oxide NP Catalysts during CO2 Electrore- duction: A Complementary Operando Approach. Nano Energy 2018, 53, 828–840. 10.1016/j.nanoen.2018.09.033. [DOI] [Google Scholar]
- Murakami T.; Nishikiori T.; Nohira T.; Ito Y. Electrolytic Synthesis of Ammonia in Molten Salts under Atmospheric Pressure. J. Am. Chem. Soc. 2003, 125, 334–335. 10.1021/ja028891t. [DOI] [PubMed] [Google Scholar]
- Zhou F.; Azofra L. M.; Ali M.; Kar M.; Simonov A. N.; McDonnell- Worth C.; Sun C.; Zhang X.; MacFarlane D. R. Electro-Synthesis of Ammonia from Nitrogen at Ambient Temperature and Pressure in Ionic Liquids. Energy Environ. Sci. 2017, 10, 2516–2520. 10.1039/C7EE02716H. [DOI] [Google Scholar]
- Rudnev A. V. In Encyclopedia of Interfacial Chemistry: Surface Science and Electrochemistry; Wandelt K., Ed.; Elsevier: Amsterdam, 2018; pp 321–325. [Google Scholar]
- Fleige M. J.; Wiberg G. K. H.; Arenz M. Rotating Disk Electrode System for Elevated Pressures and Temperatures. Rev. Sci. Instrum. 2015, 86, 064101 10.1063/1.4922382. [DOI] [PubMed] [Google Scholar]
- Jung S.; Kortlever R.; Jones R. J. R.; Lichterman M. F.; Agapie T.; McCrory C. C. L.; Peters J. C. Gastight Hydrodynamic Electrochem- istry: Design for a Hermetically Sealed Rotating Disk Electrode Cell. Anal. Chem. 2017, 89, 581–585. 10.1021/acs.analchem.6b04228. [DOI] [PubMed] [Google Scholar]
- Riddiford A. C. In Advances in Electrochemistry and Electrochemical Engineering; Delahay P., Ed.; Interscience: New York, 1966; pp 47–116. [Google Scholar]
- Zdunek A. D. A Novel Rotating Disk Electrode Cell Design: The Inverted Rotating Disk Electrode. J. Electrochem. Soc. 1992, 139, 2549–2551. 10.1149/1.2221261. [DOI] [Google Scholar]
- Bressers P. M. M. C.; Kelly J. J. A New Cell Design for the Inverted Rotating Disk Electrode. J. Electrochem. Soc. 1995, 142, L114–L115. 10.1149/1.2044331. [DOI] [Google Scholar]
- Bradley P. E.; Landolt D. New Cell Design for Inverted Rotating Disk Electrode. J. Electrochem. Soc. 1997, 144, L145–L148. 10.1149/1.1837705. [DOI] [Google Scholar]
- Parys H. V.; Tourwé E.; Breugelmans T.; Depauw M.; Deconinck J.; Hubin A. Modeling of mass and charge transfer in an inverted rotating disk electrode IRDE reactor. J. Electroanal. Chem. 2008, 622, 44–50. 10.1016/j.jelechem.2008.05.004. [DOI] [Google Scholar]
- Nierhaus T.; Parys H. V.; Dehaeck S.; van Beeck J.; Deconinck H.; Deconinck J.; Hubin A. Simulation of the Two-Phase Flow Hy- drodynamics in an IRDE Reactor. J. Electrochem. Soc. 2009, 156, P139–P148. 10.1149/1.3155423. [DOI] [Google Scholar]
- Konopka S. J.; McDuffie B. Diffusion Coefficients of Ferri- and Ferrocyanide Ions in Aqueous Media, Using Twin-Electrode Thin- Layer Electrochemistry. Anal. Chem. 1970, 42, 1741–1746. 10.1021/ac50160a042. [DOI] [Google Scholar]
- Grozovski V.; Vesztergom S.; Láng G. G.; Broekmann P. Electro- chemical Hydrogen Evolution: H+ or H2O Reduction? A Rotating Disk Electrode Study. J. Electrochem. Soc. 2017, 164, E3171–E3178. 10.1149/2.0191711jes. [DOI] [Google Scholar]
- Auinger M.; Katsounaros I.; Meier J. C.; Klemm S. O.; Biedermann P. U.; Topalov A. A.; Rohwerder M.; Mayrhofer K. J. J. Near- Surface Ion Distribution and Buffer Effects during Electrochemical Reactions. Phys. Chem. Chem. Phys. 2011, 13, 16384–16394. 10.1039/c1cp21717h. [DOI] [PubMed] [Google Scholar]
- Monteiro M. C.; Koper M. T. Alumina Contamination through Polishing and Its Effect on Hydrogen Evolution on Gold Electrodes. Electrochim. Acta 2019, 325, 134915. 10.1016/j.electacta.2019.134915. [DOI] [Google Scholar]
- Hori Y.; Wakebe H.; Tsukamoto T.; Koga O. Electrocatalytic Process of CO Selectivity in Electrochemical Reduction of CO2 at Metal Electrodes in Aqueous Media. Electrochim. Acta 1994, 39, 1833–1839. 10.1016/0013-4686(94)85172-7. [DOI] [Google Scholar]
- Dutta A.; Morstein C. E.; Rahaman M.; Cedeño López A.; Broekmann P. Beyond Copper in CO2 Electrolysis: Effective Hydrocarbon Production on Silver-Nanofoam Catalysts. ACS Catal. 2018, 8, 8357–8368. 10.1021/acscatal.8b01738. [DOI] [Google Scholar]
Associated Data
This section collects any data citations, data availability statements, or supplementary materials included in this article.


