

Abstract

In this study we have developed biodegradable polymeric nanoparticles (NPs) containing the cytostatic drugs mertansine (MRT) or cabazitaxel (CBZ). The NPs are based on chitosan (CS) conjugate polymers synthesized with different amounts of the photosensitizer tetraphenylchlorin (TPC). These TPC–CS NPs have high loading capacity and strong drug retention due to π–π stacking interactions between the drugs and the aromatic photosensitizer groups of the polymers. CS polymers with 10% of the side chains containing TPC were found to be optimal in terms of drug loading capacity and NP stability. The TPC–CS NPs loaded with MRT or CBZ displayed higher cytotoxicity than the free form of these drugs in the breast cancer cell lines MDA-MB-231 and MDA-MB-468. Furthermore, light-induced photochemical activation of the NPs elicited a strong photodynamic therapy effect on these breast cancer cells. Biodistribution studies in mice showed that most of the TPC–CS NPs accumulated in liver and lungs, but they were also found to be localized in tumors derived from HCT-116 cells. These data suggest that the drug-loaded TPC–CS NPs have a potential in combinatory anticancer therapy and as contrast agents.
1. Introduction
Cancer treatment by chemotherapy and radiotherapy still suffers from systemic toxicity, drug resistance, and low selectivity leading to an unsatisfactory outcome. Nanoparticles (NPs) have been widely used to load diagnostic and therapeutic agents, and one can benefit from their ability to target into tumors via passive accumulation and active targeting approaches. In particular, multimodal and theranostic NPs combining treatment strategies and diagnostic imaging have attracted huge interest.1 Porphyrins have been used as theranostic agents in cancer treatment for photodynamic therapy (PDT), photochemical internalization (PCI),2 photothermal therapy,3 sonodynamic therapy,4 radiotherapy,5 for diagnostic fluorescent imaging, magnetic resonance imaging,6 and photoacoustic imaging.7 Most porphyrins designed as therapeutic agents are hydrophobic and form aggregates in aqueous solution. Thus, porphyrins have been incorporated into NPs to make them more suitable for tissue delivery.8,9
We have here developed a method for producing NPs constituted by a polymer of photosensitizers conjugated to chitosan (CS) that can be used both as carriers of cancer drugs and for PCI and PDT against solid tumors. PCI is a technology that utilizes amphiphilic photosensitizer molecules and light for a site-specific release of endocytosed macromolecules or chemotherapeutics into the cytosol.10,11 Combining PDT with delivery systems for drug administration is being studied by different research groups and has recently been reviewed.12 The toxic drugs used in this study, mertansine (MRT) and cabazitaxel (CBZ), are incorporated into the NPs with the aim of increasing the therapeutic effect, reducing systemic toxicity, and at the same time having the possibility to exploit the photodynamic properties of these NPs.
MRT is structurally similar to maytansine, a potent anticancer agent that inhibits microtubule polymerization, but a too narrow therapeutic window resulted in discontinuation of its development.13 However, when coupled to the anti-HER2 antibody trastuzumab, this antibody-drug conjugate is one of four such substances approved for cancer treatment.14 Taxanes such as CBZ and paclitaxel are clinically approved chemotherapeutic agents acting as mitotic inhibitors with therapeutic efficiency against a range of solid tumors.15−17 Therapeutic application of these microtubule inhibitors is hampered by dose-limiting toxic effects and by the hydrophobicity of the drugs. In this study, MRT and CBZ are loaded into NPs made of CS, which is a biodegradable polysaccharide derived from chitin. It is increasingly used in biomedical applications including drug and gene delivery, tissue engineering, and as an antimicrobial substance.18,19 Interestingly, CS has been shown to target breast cancer stem-like cells overexpressing CD44 receptors.20
Polymer conjugates and NPs have been employed as drug carriers to improve the solubility, stability, drug retention, and to reduce the adverse effect of taxanes,21,22 and paclitaxel-loaded polymeric NPs (Genexol) have been approved for treatment of various cancers.23 Although current drug-polymeric micellar NPs improve drug solubility and decrease drug toxicity, their therapeutic efficacy is often comparable to that of free drug.21
Pharmacokinetic studies of drug-loaded micelle NPs often show rapid drug release in the circulation, probably due to a combination of drug extraction and destabilization of the NPs.24 It is hypothesized that albumin and lipoproteins in blood are able to bind amphiphilic polymer molecules and thereby disrupt the dynamic equilibrium of these NPs.25
It has been demonstrated that a block copolymer with a high degree of aromatic monomer substitution formed micellar NPs with enhanced stability and paclitaxel retention in blood following intravenous injection. These properties were attributed to noncovalent π–π stacking interactions between the drug and the hydrophobic aromatic groups of the polymer chains in the micellar core.26
In this study, we have exploited similar interactions between NPs containing the photosensitizer tetraphenylchlorin (TPC) bound to side chains of CS and the drugs MRT and CBZ. TPC–CS conjugate polymers were synthesized by covalent linking of varying amounts of lipophilic TPC as well as a cationic moiety to glucosamine residues of the CS backbone, as previously described.27 The TPC moieties contain aromatic residues that will form stable hydrophobic π–π interactions upon self-assembly of the TPC–CS polymers into micellar TPC–CS NPs (Figure 1).
Figure 1.

Synthesis of amphiphatic photosensitizer-chitosan (PS-CS) conjugate polymers and their self-assembly into micellar nanoparticles in aqueous buffers. The π–π stacking effect between aromatic groups of the photosensitizer and the lipophilic drugs conferred increased stability and loading capacity of the TPC–CS NPs.
In this study, most experiments were performed using MRT-loaded TPC–CS NPs on the two breast cancer lines MDA-MB-231 and MDA-MB-468 to demonstrate uptake of these NPs into cells, transport of the NPs into lysosomes, and the cytotoxicity of the NPs on these cancer cells. To demonstrate that other drugs than MRT can be loaded into the TPC–CS NPs, we have performed some experiments using CBZ. One experiment was also performed using the breast cancer cell line MCF7, since these cells are expected to be resistant to ferroptosis.28,29 Finally, in vivo biodistribution of the TPC–CS NPs was quantified in liver, lungs, spleen, and tumors 4–72 h after intravenous injection in mice.
2. Experimental Section
2.1. Materials
Ammonium acetate, dimethyl sulfoxide (DMSO), liproxstatin-1, deferiprone and rabbit anti-LAMP1 (L1418) antibody were purchased from Sigma-Aldrich, St. Louis, MO. Acetonitrile, trifluoroacetic acid (TFA), and Tween-80 were from Fluka. MRT was purchased from AbCam Inc. and CBZ from BioChemPartners. The Amicon Ultra-15 ultrafiltration devices (Man. Cat. No. UFC901024) were purchased from Merck Life Science (Millipore ab).
2.2. Methods
2.2.1. Synthesis of Amphiphilic Meso-Tetraphenylchlorin-Chitosan (TPC–CS) Conjugate Polymers
The polymers were synthesized with varying amounts of the photosensitizer TPC, that is, TPC was bound to 10%, 3% or 1% of the CS side chains. In the studies performed to compare analyses or effects of these conjugates, they are called TPC0.10-CS, TPC0.03-CS, and TPC0.01-CS, respectively. Since most studies are performed with NPs made from TPC0.10-CS, these NPs are then for simplicity called just TPC–CS. Starting from a modified CS,30,31 chlorin-based TPC–CS conjugate polymers were synthesized by linking the highly lipophilic photosensitizer, TPC as well as cationic moieties such as 2-(N,N,N-trimethylamino)acyl to the CS biopolymer, as detailed in the Supporting Information, including Figures S1 and S2, and as previously described in ref (27).
2.2.2. Nuclear Magnetic Resonance and Mass Spectrometry Analyses
NMR spectra were recorded using a DRX 400 MHz Bruker NMR spectrometer at 298 K. The chemical shifts are reported in parts per million (ppm) relative to the residual proton signal (for 1H NMR) and the carbon signal for (13C NMR) of the deuterated solvent used [1H NMR: CDCl3 (7.26 ppm), DMSO-d6 (2.50 ppm); 13C NMR: CDCl3 (77.16 ppm), DMSO-d6 (39.52 ppm)]. The acetone peak (2.22 ppm) was used as the internal reference for D2O as solvents, and all coupling constants are reported in Hertz. The identification of aromatic protons characteristic for the porphyrin and chlorin ring systems has previously been described.27 A Bruker Autoflex III or a Bruker micro TOF-Q11 was used to obtain mass spectra. The molecular masses were determined by high-resolution mass spectrometry (HRMS) recorded on a Bruker micrOTOF-Q instrument with electrospray ionization.
2.2.3. Preparation of Empty and Drug-Loaded TPC–CSNPs
Although most experiments in the present study were performed using MRT-loaded NPs, we decided to include some studies with CBZ-loaded NPs to demonstrate that also other drugs can be loaded into the TPC–CS NPs. The three TPC–CS conjugate polymers were dissolved in 90% DMSO at a concentration of 8 mg/mL. Empty TPC–CS micellar NPs were prepared by adding 1 mL of the TPC–CS in DMSO rapidly to 10 mL of Milli-Q water (20 nm filter) under agitation (5 min at 1000 rpm; room temp). MRT- or CBZ-loaded NPs of these three TPC–CS polymers were prepared similarly, with MRT or CBZ dissolved (0.8 mg/mL) in the TPC–CS DMSO solution. The resulting NP dispersions were ultrafiltered using an Amicon spin device (regenerated cellulose filter, MW cutoff 10 kDa; 4 spin cycles with 25-fold up-concentration) using phosphate-buffered saline (PBS: 139 mM NaCl; 10.1 mM Na2HPO4; 1.8 mM NaH2PO4, adjusted to pH 7.4) to remove DMSO and nonencapsulated drug.
2.2.4. Size Distribution and Zeta-Potential of NPs
The size distribution of the NPs was measured using dynamic light scattering (DLS) with a Malvern Zetasizer Nano-ZS (Malvern Instruments, U.K.) and DTS software (version 4.20). The NPs were dispersed in PBS buffer to polymer concentrations of 0.1–0.6 mg/mL and added to microcuvettes. The size distributions are reported as Zave (nm) and the polydispersity index (PDI). The zeta potential was measured using the Malvern Zetasizer Nano-ZS equipped with a zeta-potential cuvette. Size distribution and particle concentration of the TPC–CS formulations were also measured by nanoparticle tracking analysis (NTA) using a NanoSight 500 instrument: TPC–CS was diluted in the amount of PBS (filtered through a 0.02 μM Anotop 25 filter) needed to obtain a concentration within the recommended range (2 × 10⁸ to 1 × 10⁹ particles per mL). The samples were then loaded into an NS500 instrument (Malvern Instruments Ltd., Worcestershire, U.K.). Five videos, each of 45 s, were acquired for every sample. Videos were subsequently analyzed with the NTA 2.3 software, which identifies and tracks the center of each particle under Brownian motion to measure the average distance the particles move on a frame-by-frame basis.
2.2.5. HPLC Quantification of MRT
To assess the quantity of MRT contained within ultrafiltered (Amicon ultracel, MW cut off 10 kDa) TPC–CS micellar NPs, samples were treated with 45% acetonitrile, 5% 0.02 M ammonium acetate (pH 5.5), and 50% DMSO for 30 min at ambient temperature, followed by 2 min vortexing. An Agilent 1290 system (Agilent, Waldbrunn, Germany) setup with an Agilent mRP-C18 HiRes column (#5188–5231:5 μm particle size, 4.6 × 50 mm length) was used at 25 °C for analyzing MRT (10 μL was injected). The separation was performed using a linear 0.5 mL/min flow gradient from 100% solvent A (90% acetonitrile, 5% 0.02 M ammonium acetate, 0.1% TFA, 4.9% water) to 90% solvent B (90% acetonitrile, 5% 0.02 M ammonium acetate, 0.1% TFA, 4.9% water) in 9 min. All samples were run in triplicates with column recalibration for 5 min and blank runs between sample injections. The MRT peak detected at 254 nm (Agilent 1100 VWD G1314A) was observed after 0.6 min, and area-under-curve (AUC) quantification of micellar MRT was calculated using a standard curve obtained by injections of 0.225–3.6 mg/mL MRT; minimum S:N 10.0.
2.2.6. Cell Lines
Three commonly used breast cancer cell lines32 were used in this study: The MDA-MB-231 cell line (triple negative; Claudin low; ductal) was cultured in RPMI 1640, the MDA-MB-468 (triple negative; basal) cell line was cultured in DMEM, and the MCF7 (estrogen and progesterone-positive; ductal) cell line was cultured in RPMI 1640. All media were fortified with 10% (v/v) fetal calf serum albumin (Sigma) and 100 units/mL penicillin/streptomycin (PenStrep, Sigma). The cell lines were obtained from ATCC and were routinely tested for mycoplasma. Cells growing in 96-well plates were incubated with serial dilutions of free form of drug (MRT, CBZ), empty- and drug-loaded TPC–CS NPs for 24, 48, or 72 h at 37 °C in an atmosphere of 5% CO2.
2.2.7. Cytotoxicity of Drug-Loaded TPC–CSNPs
The cytotoxicity of empty polymeric NPs and MRT- and CBZ-loaded TPC–CS NPs were evaluated by the commonly used MTT (3-(4,5-dimethylthiazol-2-yl)-2,5-diphenyltetrazolium bromide) assay using free MRT (from 10 mM DMSO stock) and free CBZ (stock dissolved in Tween-80) as control formulations. MDA-MB-231, MDA-MB-468, and MCF7cells were seeded in 96-well plates (7 × 10³ cells/well) and incubated for 24 h at 37 °C in a 5% CO2 humidified atmosphere. The empty and drug-loaded NP formulations were briefly sonicated (Cole-Parmer CP70T with microtip; 1 min; 2 s pulses at 40% output) and then added to the cells in the corresponding cell culture media to the different concentrations. The cells were incubated at 37 °C in CO2-incubator for 18 h, then the cells were washed 3× with prewarmed growth medium followed by a 4 h chase before light exposure of some of the cells (5 min light dose with 420–435 nm light/13 mW/cm2; LumiSource, PCI Biotech, Oslo, Norway). The cells were incubated further at 37 °C in the CO2 incubator, and the cell toxicity was determined after 48 or 72 h using the MTT assay.
2.2.8. Cellular Uptake of TPC–CS NPs Studied by Confocal Fluorescence Microscopy
MDA-MB-231 cells (seeded 3 × 10⁴ cells/well in 24-well trays) were cultured on coverslips for 24 h prior to the experiments. Cells were incubated with TPC–CS NPs (2 μg/mL) for 2 h in complete growth medium, followed by a 3× wash-out of unbound NPs and chasing for 18 h at 37 °C. Then, the cells were fixed in 10% (v/v) formalin for 15 min and permeabilized and blocked in a 0.1% (v/v) TritonX-100 and 1% (w/v) bovine serum albumin in PBS (“blocking buffer”) for 1 h at room temperature. The fixed cells were immune-stained against the lysosomal marker LAMP-1 with a primary rabbit anti-LAMP-1 antibody (diluted 1:200 in blocking buffer) and followed by the secondary fluorescent donkey antirabbit-alexa488 antibody conjugate (diluted 1:500). Coverslips were mounted in Prolong Gold antifade reagent with DAPI (Life Technologies). Immunolabeled cells were examined using a confocal microscope (LSM 788; Carl Zeiss MicroImaging, Inc.) equipped with a Neo-Fluar 63×/1.45 oil immersion objective or by super-resolution structured illumination microscopy (SIM) imaging using a DeltaVision OMX V4 Blaze 3D-SIM microscope. Image processing and analysis were done with Zeiss LSM 510 software and Adobe Photoshop CS4.
2.2.9. Experimental Animals
Female athymic nude foxn1nu mice were bred at the Comparative Medicine Department, Oslo University Hospital, and kept in a pathogen-free milieu at a constant temperature (21.5 ± 0.5 °C) and humidity (55 ± 5%); 15 air changes/h and a 12 h light/dark cycle. The animals were 5–6 weeks old, and their weight was 18–20 g before they were included in the experiments. Anesthesia was obtained with 5% (v/v) Sevofluran along with 3 l nitrous oxide and 1 l oxygen, given with breathing mask. Cages were equipped with bedding, cardboard houses, and paper. Experiments were approved by the National Animal Research Authority, after first having been approved by the institutional veterinarian. All the procedures involving animals were performed according to protocols approved by the National Animal Research Authority and conducted according to the regulations of the Federation of European Laboratory Animals Science Association (PMID: 22776188). Food and water were supplied ad libitum. Animals were sacrificed performing cervical dislocation at the end of the experiments.
2.2.10. In Vivo Imaging
Empty or MRT-loaded TPC–CS NPs were used to study biodistribution in subcutaneous thigh-located HCT-116 tumor bearing mice using an in vivo imaging system IVIS Spectrum (PerkinElmer, MA, U.S.A.). Mice were injected intravenously with either empty TPC0.10-CS or MRT-loaded (1 mg/mL) TPC0.10-CS in 200 μL. The mice were given the above-mentioned gas anesthesia using multiple masks. The excitation/emission wavelength pair of 675/720 nm was used for imaging of the NPs. Full body images were obtained 4, 24, 48, 72 h, and 21 days after injection; the animals were then sacrificed and organs were harvested. Ex vivo imaging of the organs was also performed with the IVIS Spectrum using the same settings as above. Total signal intensity in the organs, such as liver, spleen, kidneys, lungs, and tumors were calculated, using Living Image software (PerkinElmer), as radiant efficiency (emission light [photons/sec/cm2/str]/excitation light [μW/cm2] × 109) of the region of interest, which was marked around the corresponding organs. Organs from two animals from different treatment at each time point were imaged. Epi-fluorescence color threshold was set between 5.5 × 10⁷ to 2.5 × 10⁸ radiant efficiency for image analysis.
3. Results and Discussion
3.1. Synthesis of TPC–CS Conjugate Polymers with Varying Amounts of TPC
Utilizing a protected CS, we synthesized a key reactive electrophilic intermediate, which facilitated the covalent chlorin modification on CS by a nucleophilic substitution reaction, as detailed in the Supporting Information and Figure S1. Since the reaction is quantitative, we could synthesize TPC–CS with varying amounts of TPC, that is, TPC–CS with 10%, 3%, or 1% of the side chains of CS binding TPC. The remaining free bromide groups were then replaced with the trimethylammonium group, simply by reacting with an excess of trimethylamine. The final TPC–CS conjugates were then obtained by deprotection under mild acidic conditions, as detailed in Supporting Information. All the final compounds were characterized by 1H NMR spectroscopy (Figure 2) and the amount of TPC bound was in each case calculated from the 1H NMR spectra according to the previously reported procedure.27
Figure 2.

1H NMR spectra overlay of the TPC–CS conjugates. The spectra shown demonstrate the changes obtained when changing the degree of substitution of the three formulations, that is, following conjugation of TPC to 1%, 3%, or 10% (from top to bottom) the side chains of CS.
3.2. Encapsulation of MRT in TPC–CS NPs
The TPC–CS conjugates containing different amounts of TPC (10%, 3%, and 1%) were mixed with MRT and solubilized in DMSO, and then the DMSO solution was used to prepare dispersions of MRT-loaded TPC–CS NPs by a self-assembly “nanoprecipitation” process in aqueous medium. The NP formulations were subsequently ultrafiltered to remove DMSO and unincorporated MRT. The micellar TPC–CS NPs with lower amount of TPC (3% and 1%) formed larger NPs and displayed a more polydisperse distribution (Zave: 175 nm; PDI: 0.45) than the NPs with 10% of TPC in the side chains (Zave:110 nm; PDI: 0.25; Figure S3). This is likely because fewer TPC molecules result in NPs with a more loosely packed hydrophobic core.
MRT loading and retention in the different micellar TPC–CS NPs were studied by measuring the concentration of MRT by HPLC and by their toxicity. The encapsulation efficiency of MRT in the TPC–CS NPs with various degrees of substitution of TPC was calculated from the HPLC data. The TPC0.10–CS NPs loaded with 10% MRT showed an encapsulation efficiency larger than 80% at an MRT feed concentration of 0.6 mg/mL compared to encapsulation efficiencies of 40% and 15% for TPC0.03–CS NPs and TPC0.01–CS NPs, respectively (Figure 3A). This indicates that by increasing the amount of TPC bound to CS, more MRT can be loaded and retained in the TPC–CS, which can be explained by strong π–π stacking and hydrophobic interactions between MRT and the hydrophobic chains of the TPC–CS conjugates.21 Moreover, a decrease in encapsulation efficiency (to 70%) was measured when TPC0.10–CS NPs were loaded with 20% MRT (Figure S4). Thus, we did not attempt to further increase the loading capacity of our TPC0.10–CS NP formulations. Illumination of the MRT-loaded TPC0.10–CS NPs (5 min light dose), followed by ultrafiltration, did not change the physiochemical characteristics of the NPs nor did it result in an increased release of MRT from the NPs (measured by HPLC; data not shown).
Figure 3.

Characterization of MRT-loaded TPC–CS NPs containing different amounts of TPC (0%, 1%, 3%, and 10%) bound to the side chains of CS. (A) MRT encapsulation efficiency; mean MRT levels ± SD (n = 3) measured by HPLC. (B) Cytotoxicity of the different MRT-loaded TPC–CS NPs. The cytotoxicity was measured using empty TPC0.1–CS, the three NPs carrying different amount of TPC–CS NPs loaded with 10% MRT, or a similar dose of free MRT. The drug-loaded NPs were ultrafiltered to remove unincorporated MRT. MTT assay was performed in MDA-MB-231 cells after 48 h incubation. The 5 min light pulse was given after 24 h exposure of the NPs. Mean values ± SD (n = 3).
Cytotoxicity of the three MRT-loaded NP formulations (TPC–CS with 10%, 3% or 1% conjugation of TPC) was similar when normalizing with their respective encapsulation efficiencies, so that the actual concentrations of MRT added to cells were plotted (Figure 3B). The cytotoxicity of MRT-loaded TPC0.10–CS upon illumination (5 min pulse) was similar to dark toxicity, except for the highest concentrations where illumination caused higher toxicity due to a PDT effect (see also Figure 5A). Moreover, the MRT-loaded TPC0.03–CS and TPC0.01–CS also showed similar cytotoxicity in presence and absence (not shown) of the illumination. Thus, no significant increase in toxicity of MRT due to a light-induced PCI effect was observed for any of the three different TPC–CS NPs (Figure 3B). Moreover, no significant change in toxicity of the three TPC–CS NP formulations was observed after 3 days of storage and a new round of ultrafiltration (4 cycles of 20-fold spin concentration/dilution; data not shown), indicating that the three different TPC–CS NPs stably retained their encapsulated MRT.
Figure 5.

Toxicities of empty-, MRT (10%)-loaded TPC0.1–CS NPs, and free drug in (A) MDA-MB-231cells and (B) MDA-MB-468 tumor cells after exposure for 48 h, and ±light pulse (5 min) after 24 h. MTT assay was performed after 48 h incubation. The data are shown as percent of control for each cell line not treated with TPC–CS NPs or MRT. The graphs show mean values ± SEM from three different experiments. *p < 0.05; ***p < 0.005 for comparison with empty TPC–CS NPs.
3.3. Characterization of TPC–CS NPs Loaded with MRT or CBZ
The sizes (Zave) of the empty, MRT-, and CBZ-loaded TPC0.10–CS NPs, as measured by DLS, were 112, 111, and 110 nm, respectively (Figure 4), whereas NTA measurements showed sizes of 133, 115, and 145 nm for the empty-, MRT-, and CBZ-loaded TPC–CS NPs, respectively (Figure S5). Thus, the formulations of MRT- and CBZ-loaded TPC0.10–CS NPs had a size rather similar to the empty TPC0.10–CS NPs. The zeta potential of all the TPC0.10–CS formulations was +26 mV ± 4 (in PBS diluted 10 times with water). In PBS supplemented with 10% fetal calf serum, the zeta-potential changed to −9 mV, probably due to absorption of serum proteins forming a corona on the surface of the NPs.33,34 Based on size measurements, the NP formulations were stable in water. Upon storage of the formulations for more than 5 days in PBS some aggregates (200–500 nm) could be measured, but a brief sonication disrupted the aggregates and resulted in a size distribution similar to that of newly made NPs (data not shown). Moreover, the TPC0.10–CS NPs were stable, even when diluted to a polymer concentration of less than 1 μg/mL, and did not change within 24 h, measured as unaltered size and number of NPs by NTA on the NanoSight instrument (data not shown).
Figure 4.
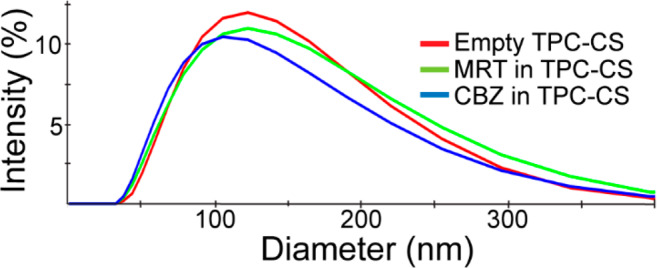
Size distributions of empty and drug-loaded TPC–CS NPs. DLS measurements were performed using the Malvern Zetasizer Nano ZS. The hydrodynamic diameters (Zave) determined for the empty-, MRT-, and CBZ-loaded TPC–CS NPs was 112 ± 3, 111 ± 5, and 110 ± 4 nm, respectively (mean ± SD, n = 3). The PDI was 0.21 for all formulations.
3.4. Cytotoxicity of TPC–CS NPs with and without Drug
The in vitro toxic effect of the drug-loaded TPC–CS NPs compared to the free drug was assessed with MDA-MB-231 and MDA-MB-468 cells using the MTT test. Toxicities of the MRT-loaded TPC–CS NPs were higher than that of free MRT in MDA-MB-231 cells (Figure 5A) and comparable to that of free MRT in MDA-MB-468 cells (Figure 5B). The cytotoxicity of the CBZ-loaded TPC–CS NPs was similar to free CBZ in both MDA-MB-231 and MDA-MB-468 cells (Figure 6A,B). The encapsulation of MRT and CBZ in TPC–CS NPs did not reduce the potency of the drug in vitro, indicating that encapsulated drug is efficiently released in cells. Importantly, even though free drug may act as efficiently as the drug-loaded NPs on cells, the drug encapsulation is likely to improve the pharmacokinetics of the drugs and give less adverse effects in vivo. Moreover, the toxicity of the TPC–CS NPs loaded with either MRT or CBZ did not change after 4 months of storage at 4 °C and ultrafiltration, indicating a stable level of both drugs in these NPs (data not shown).
Figure 6.

Toxicities of empty-, CBZ (10%)-loaded TPC0.1–CS NPs, and free drug in (A) MDA-MB-231cells and (B) MDA-MB-468 tumor cells after exposure for 48 h, and ±light pulse (5 min) after 24 h. MTT assay was performed after 48 h incubation. The data are shown as percent of control for each cell line not treated with TPC–CS NPs or MRT. The graphs show mean values ± SEM from three different experiments.
Interestingly, in contrast to the toxicity of MRT and CBZ that killed only 50–60% of these multidrug resistant breast cancer cells, both the empty and drug-loaded TPC–CS NPs elicited light-induced TPC-mediated phototoxicity (PDT effect) that killed all cells (Figures 5 and 6). It is possible that the toxicity elicited by the added drugs is partially masked by a strong TPC–PDT effect in cell culture and that the drug could be even more important in vivo. We showed that the TPC0.10–CS NPs added to cells at low concentration (20 nM MRT equiv) were able to induce a strong PCI effect of the plant toxin gelonin (Figure S6), demonstrating that the TPC–PC NPs elicited photochemical damage to endosomal membranes thereby allowing cytosolic release of gelonin. In future animal tumor growth inhibition experiments, it will be interesting to investigate whether the injected drug-loaded TPC–CS NPs will be efficient in tumor-targeted drug delivery and to measure potential light dose-dependent PDT effects.
3.5. Ferroptosis as a Cell Death Mechanism
In this experiment we included MCF7 cells, as we recently have shown these cells to be resistant to ferroptosis induced by lipid nanocapsules.28 Furthermore, MDA-MB-231 cells have been shown to be vulnerable to PDT and concomitant lipid peroxidation due to a low expression of the membrane-associated glutathione-dependent lipid hydroperoxidase (GPX4), whereas MCF7 cells have a high expression of GPX4.29 Interestingly, a regulated type of necrosis called ferroptosis has recently been discovered and found to be associated with an iron-dependent accumulation of reactive oxygen species, followed by formation of excessive amounts of lipid hydroperoxides and loss of GSH.35 Lipophilic small-molecule antioxidants have been shown to rescue cells from ferroptosis.36 To test whether the MDA-MB-231 and MCF7 cells (i.e., cells described to lack or to contain high levels of GPX4, respectively) undergo ferroptosis upon light-induced PDT by the TPC–CS NPs, we treated the cells with ferroptosis rescue compounds. We found that the lipophilic antioxidant liproxstatin-1 significantly rescued against PDT toxicity of the TPC–CS NPs in MDA-MB-231 cells (Figure 7A), but had no effect in MCF7 cells (Figure 7B). Furthermore, in agreement with ferroptosis being an iron-dependent process, we observed that iron chelation with deferiprone partially rescued MDA-MB-231 cells (Figure 7A), but not MCF7 cells (Figure 7B). Thus, cell death by ferroptosis may be involved in the PDT effect of the TPC–CS NPs on some cancer cells. We suggest that efficient GPX4 inhibitors, such as RSL3 or FINO2,37,38 could be used in a clinical setting in order to elicit a more efficient PDT effect by sensitizing the cancer cells to undergo ferroptosis.
Figure 7.

PDT effect of empty TPC–CS NPs upon treatment with ferroptosis inhibitors in the breast cancer cell lines MDA-MB-231 (A) and MCF7 (B). The cells were incubated with TPC0.1–CS NPs for 24 h, followed by 1 h preincubation with liproxstatin-1 (Liproxst, 1 μM) or deferiprone (DFP, 100 μM) before a 2 min light treatment. Toxicity of the treated cells was measured by the MTT assay after 48 h incubation. The data are shown as percent of control for each cell line not treated with TPC–CS NPs. The graphs show mean values ± SEM from three independent experiments. *p < 0.05; **p < 0.01; ***p < 0.005 for comparison of cells treated with Liprox, and ##p < 0.01; ###p < 0.005 for comparison of cells treated with DFP.
3.6. Uptake of the TPC–CS NPs in Breast Cancer Cells
From earlier studies it is known that the TPC moieties are tightly packed by stable hydrophobic π–π stacking interactions in the “core” of the TPC–CS NPs, resulting in a significant quenching (>12-fold) of the photosensitizer fluorescence.27 Furthermore, uptake of the TPC–CS NPs and accumulation in endocytic vesicles, together with light-induced photochemical internalization (PCI), were demonstrated through enhanced plasmid DNA transfection.27 Here, we show that the TPC–CS NPs were endocytosed by the MDA-MB-231 cells and displayed significant colocalization with lysosomes after more than 4 h of incubation (Figure 8). Moreover, the higher resolution of super illumination microscopy (SIM) allowed the TPC–CS NPs to be observed specifically localized along the inner membrane of the lysosomes with little staining in their lumen. (Figure 8D, inset). This suggests that the TPC–CS NPs have undergone structural changes in the endolysosomal system such that the amphipathic TPC–CS polymers become associated with the inner leaflet of the lysosomal membrane. Furthermore, confocal microscopy studies of TPC–CS NP cellular uptake after various time points did not reveal any large increase in TPC fluorescence over time that should be expected if the TPC–CS NPs were gradually unfolded in endosomes causing dequenching of the TPC fluorescence (data not shown). In live-cell microscopy, we observed what happened to fluorescent dextran colocalized with TPC–CS NPs in late endosomes with increasing time of illumination (Figure S7): The strong fluorescent signals of both dextran and TPC–CS in endosomes rapidly faded (with 300 s of illumination), indicating a TPC-induced rupture of the endosomes, allowing endosomal escape of dextran. In control cells, where fluorescent dextran localized to late endosomes (but without TPC–CS NPs), the dextran signal did not fade, but was stably retained in the endosomes.
Figure 8.

Uptake of MRT-loaded (A) or empty (B) TPC–CS NPs (25 μg/mL) for 20 h in MDA-MB-231 cells. (C) Confocal microscopy image with orthogonal views generated from a z-stack of images. (D) SIM image showing TPC–CS micelles within lysosomes (image taken 20 h after adding NPs), with TPC–CS staining (red) along the periphery in many of the lysosomes (as in the inset). Cells were incubated with TPC–CS NPs for 2 h, followed by a wash-out and chasing for 18 h at 37 °C. Then the cells were fixed and stained with an antibody against the lysosomal marker LAMP-1 (green). Nuclei are stained with DAPI (blue).
3.7. In Vivo Biodistribution of TPC–CS NPs
Despite the high level of fluorescence self-quenching of intact NPs, the TPC–CS NPs become sufficiently unquenched after intravenous injection, permitting fluorescence imaging. Thus, biodistribution of the TPC–CS NPs in HCT-116 tumor-bearing mice was studied using the IVIS Spectrum Scanner after 4, 24, 48, and 72 h (not shown), after which the mice were sacrificed and organs harvested and subjected to ex vivo imaging. Images of organs harvested 4, 24, 48, and 72 h after injection with empty TPC–CS or MRT-loaded TPC–CS (Figure 9A–D), and total radiant efficiency of the region of interest per organ is plotted (Figure 9E–H). The majority of fluorescence from both TPC–CS NP preparations were recovered in the liver, consistent with observations for other intravenously injected NPs.39 Significant amount of fluorescence was also recovered in spleen and lungs (similarly, as observed for other NPs39). The significant accumulation of the NPs in lungs may be because the lungs are the first capillary network the NPs encounter after intravenous injection. Furthermore, it has been reported that lung accumulation might also be attributed to formation of aggregates in the capillary network of the lungs.40 However, the TPC–CS NPs did not display formation of aggregates in the presence of up to 50% FCS (in PBS), as determined by DLS-measurements using the Zetasizer (data not shown). Positively charged NPs have been described to be more prone to opsonization and sequestration by macrophages in the lungs, liver and spleen.41 Furthermore, the pharmacokinetics of the TPC–CS NPs may be changed and optimized by functionalizing them with hyaluronic acid and/or PEGylation,42,43 resulting in longer circulation half-lives and hence to an improved tumor targeting of the NPs.
Figure 9.

Organs were harvested at 4 h (A), 24 h (B), 48 h (C), and 72 h (D) after no injection (control) or injection with empty TPC–CS or MRT-loaded TPC–CS. The signals were quantified and presented as total radiant efficiency for liver, spleen, kidneys, lungs and tumors. The columns plotted are corresponding to the images above as for 4 h (E), 24 h (F), 48 h (G), and 72 h (H). Data are shown as mean ± SD (n = 3).
Although the biodistribution data indicate that the tissue accumulation of most NPs is completed within the first time point of 4 h (Figure 9E), some increase in tissue fluorescence was observed in liver, spleen, lungs, and tumors up to 24–48 h after injection of both types of NPs (Figure 9F,G). This increased fluorescence might be explained by dissolution of the NPs over time resulting in release of TPC–CS polymers and consequently dequenching of the TPC photosensitizer fluorescence. A significant reduction in TPC fluorescence was observed in all tissues 72 h postinjection (Figure 9H). The fluorescence ceased after 21 days (not shown). This indicated biodegradation of the TPC–CS NPs by enzymatic degradation and excretion of the TPC–CS polymers.
It should be noted that although the tumor accumulation of NPs is low, it is in the same range as we recently published for other NPs, which had a very good effect on a patient-derived xenograft model in mice,44 and also as reported in a review article summarizing tumor accumulation data reported in 224 studies for different types of NPs.45
4. Conclusions
We have established a method for the preparation of NPs based on the photosensitizer-conjugate polymers TPC–CS as carriers of the lipophilic drugs MRT and CBZ. Three distinct amphiphilic TPC–CS polymers with controlled amounts of TPC bound at 10%, 3%, or 1% of the side chains of CS were synthesized. The three TPC–CS polymers and the lipophilic drugs self-assembled into NPs in an aqueous medium with a hydrophobic core of aggregated π–π stacked TPC and drug moieties and a shell of cationic polymer backbones. The TPC–CS NPs with conjugation of TPC to 10% of the CS side chains displayed the highest efficiency of MRT encapsulation (>80%) and were chosen for further studies. Cytotoxicity experiments in breast cancer cell lines show that the drug-mediated toxicity is comparable or better than the free drug. Additionally, the TPC–CS NPs showed a strong photochemical (PDT) effect alone, and the toxic effect seemed to be even stronger with the drug-loaded NPs. The TPC–CS NPs are efficiently taken up by the cancer cells and localize along with the inner leaflet of endolysosomal membranes, suggesting structural changes of the NPs taking place following endocytosis. The biodistribution pattern of TPC–CS NPs reported here suggests that they are biodegradable and promising candidates for delivery of hydrophobic drugs. Possibly, they can also be used for enhanced tumor delivery of anticancer drugs through light-induced photochemical internalization and photodynamic therapy (PCI/PDT) effects.
Acknowledgments
This work was supported by The Research Council of Norway [NANO2021; Project Number 228200/O70] and The Norwegian Cancer Society. We thank Anne Engen for excellent assistance with cell culturing and Monika Håkerud for professional assistance regarding illumination of cells. We would also like to thank The Norwegian Radium Hospital Research Foundation (RADFORSK) for financial support and The Simon Fougner Hartmann Family Fund for providing means to analytical instrumentation. We also acknowledge a contribution from the University of Iceland Research Fund for the work in Iceland.
Supporting Information Available
The Supporting Information is available free of charge at https://pubs.acs.org/doi/10.1021/acs.biomac.0c00061.
The authors declare no competing financial interest.
Supplementary Material
References
- Jing L.; Liang X.; Li X.; Lin L.; Yang Y.; Yue X.; Dai Z. Mn-porphyrin conjugated Au nanoshells encapsulating doxorubicin for potential magnetic resonance imaging and light triggered synergistic therapy of cancer. Theranostics 2014, 4, 858–71. 10.7150/thno.8818. [DOI] [PMC free article] [PubMed] [Google Scholar]
- Haug M.; Brede G.; Håkerud M.; Nedberg A. G.; Gederaas O. A.; Flo T. H.; Edwards V. T.; Selbo P. K.; Høgset A.; Halaas Ø. Photochemical Internalization of Peptide Antigens Provides a Novel Strategy to Realize Therapeutic Cancer Vaccination. Front. Immunol. 2018, 9, na. 10.3389/fimmu.2018.00650. [DOI] [PMC free article] [PubMed] [Google Scholar]
- Jin C. S.; Lovell J. F.; Chen J.; Zheng G. Ablation of Hypoxic Tumors with Dose-Equivalent Photothermal, but Not Photodynamic, Therapy Using a Nanostructured Porphyrin Assembly. ACS Nano 2013, 7, 2541–2550. 10.1021/nn3058642. [DOI] [PMC free article] [PubMed] [Google Scholar]
- Shen J.; Cao S.; Sun X.; Pan B.; Cao J.; Che D.; Jin S.; Cao Y.; Tian Y.; Yu Y. Sinoporphyrin Sodium-Mediated Sonodynamic Therapy Inhibits RIP3 Expression and Induces Apoptosis in the H446 Small Cell Lung Cancer Cell Line. Cell. Physiol. Biochem. 2019, 51, 2938–2954. 10.1159/000496045. [DOI] [PubMed] [Google Scholar]
- Wang J.; Pang X.; Tan X.; Song Y.; Liu L.; You Q.; Sun Q.; Tan F.; Li N. A triple-synergistic strategy for combinational photo/radiotherapy and multi-modality imaging based on hyaluronic acid-hybridized polyaniline-coated WS2 nanodots. Nanoscale 2017, 9, 5551–5564. 10.1039/C6NR09219E. [DOI] [PubMed] [Google Scholar]
- Zhang X. A.; Lovejoy K. S.; Jasanoff A.; Lippard S. J. Water-soluble porphyrins as a dual-function molecular imaging platform for MRI and fluorescence zinc sensing. Proc. Natl. Acad. Sci. U. S. A. 2007, 104, 10780–5. 10.1073/pnas.0702393104. [DOI] [PMC free article] [PubMed] [Google Scholar]
- Maldonado R. A.; LaMothe R. A.; Ferrari J. D.; Zhang A. H.; Rossi R. J.; Kolte P. N.; Griset A. P.; O’Neil C.; Altreuter D. H.; Browning E.; Johnston L.; Farokhzad O. C.; Langer R.; Scott D. W.; von Andrian U. H.; Kishimoto T. K. Polymeric synthetic nanoparticles for the induction of antigen-specific immunological tolerance. Proc. Natl. Acad. Sci. U. S. A. 2015, 112, E156–E165. 10.1073/pnas.1408686111. [DOI] [PMC free article] [PubMed] [Google Scholar]
- Zhou Y.; Liang X.; Dai Z. Porphyrin-loaded nanoparticles for cancer theranostics. Nanoscale 2016, 8, 12394–405. 10.1039/C5NR07849K. [DOI] [PubMed] [Google Scholar]
- Yi G.; Hong S. H.; Son J.; Yoo J.; Park C.; Choi Y.; Koo H. Recent advances in nanoparticle carriers for photodynamic therapy. Quantitative Imaging in Medicine and Surgery 2018, 8, 433–443. 10.21037/qims.2018.05.04. [DOI] [PMC free article] [PubMed] [Google Scholar]
- Berg K.; Weyergang A.; Prasmickaite L.; Bonsted A.; Høgset A.; Strand M. T.; Wagner E.; Selbo P. K. Photochemical Internalization (PCI): A Technology for Drug Delivery. Methods Mol. Biol. (N. Y., NY, U. S.) 2010, 635, 133–145. 10.1007/978-1-60761-697-9_10. [DOI] [PubMed] [Google Scholar]
- Selbo P. K.; Weyergang A.; Hogset A.; Norum O. J.; Berstad M. B.; Vikdal M.; Berg K. Photochemical internalization provides time- and space-controlled endolysosomal escape of therapeutic molecules. J. Controlled Release 2010, 148, 2–12. 10.1016/j.jconrel.2010.06.008. [DOI] [PubMed] [Google Scholar]
- Jerjes W.; Theodossiou T. A.; Hirschberg H.; Høgset A.; Weyergang A.; Selbo P. K.; Hamdoon Z.; Hopper C.; Berg K. Photochemical Internalization for Intracellular Drug Delivery. From Basic Mechanisms to Clinical Research. J. Clin. Med. 2020, 9, 528. 10.3390/jcm9020528. [DOI] [PMC free article] [PubMed] [Google Scholar]
- Chahinian A. P.; Nogeire C.; Ohnuma T.; Greenberg M. L.; Sivak M.; Jaffrey I. S.; Holland J. F. Phase I study of weekly maytansine given by iv bolus or 24 h infusion. Cancer Treat. Rep. 1979, 63, 1953–1960. [PubMed] [Google Scholar]
- Poon K. A.; Flagella K.; Beyer J.; Tibbitts J.; Kaur S.; Saad O.; Yi J.-H.; Girish S.; Dybdal N.; Reynolds T. Preclinical safety profile of trastuzumab emtansine (T-DM1): Mechanism of action of its cytotoxic component retained with improved tolerability. Toxicol. Appl. Pharmacol. 2013, 273, 298–313. 10.1016/j.taap.2013.09.003. [DOI] [PubMed] [Google Scholar]
- Kingston D. G. I. The shape of things to come: Structural and synthetic studies of taxol and related compounds. Phytochemistry 2007, 68, 1844–1854. 10.1016/j.phytochem.2006.11.009. [DOI] [PMC free article] [PubMed] [Google Scholar]
- Vrignaud P.; Semiond D.; Lejeune P.; Bouchard H.; Calvet L.; Combeau C.; Riou J. F.; Commercon A.; Lavelle F.; Bissery M. C. Preclinical antitumor activity of cabazitaxel, a semisynthetic taxane active in taxane-resistant tumors. Clin. Cancer Res. 2013, 19, 2973–2983. 10.1158/1078-0432.CCR-12-3146. [DOI] [PubMed] [Google Scholar]
- Mita A. C.; Figlin R.; Mita M. M. Cabazitaxel: More Than a New Taxane for Metastatic Castrate-Resistant Prostate Cancer?. Clin. Cancer Res. 2012, 18, 6574–6579. 10.1158/1078-0432.CCR-12-1584. [DOI] [PubMed] [Google Scholar]
- Corbet C.; Ragelle H.; Pourcelle V.; Vanvarenberg K.; Marchand-Brynaert J.; Preat V.; Feron O. Delivery of siRNA targeting tumor metabolism using non-covalent PEGylated chitosan nanoparticles: Identification of an optimal combination of ligand structure, linker and grafting method. J. Controlled Release 2016, 223, 53–63. 10.1016/j.jconrel.2015.12.020. [DOI] [PubMed] [Google Scholar]
- Sahariah P.; Masson M. Antimicrobial Chitosan and Chitosan Derivatives: A Review of the Structure-Activity Relationship. Biomacromolecules 2017, 18, 3846–3868. 10.1021/acs.biomac.7b01058. [DOI] [PubMed] [Google Scholar]
- Rao W.; Wang H.; Han J.; Zhao S.; Dumbleton J.; Agarwal P.; Zhang W.; Zhao G.; Yu J.; Zynger D. L.; Lu X.; He X. Chitosan-Decorated Doxorubicin-Encapsulated Nanoparticle Targets and Eliminates Tumor Reinitiating Cancer Stem-like Cells. ACS Nano 2015, 9, 5725–5740. 10.1021/nn506928p. [DOI] [PubMed] [Google Scholar]
- Shi Y.; van Steenbergen M. J.; Teunissen E. A.; Novo L. s.; Gradmann S.; Baldus M.; van Nostrum C. F.; Hennink W. E. Π–Π Stacking Increases the Stability and Loading Capacity of Thermosensitive Polymeric Micelles for Chemotherapeutic Drugs. Biomacromolecules 2013, 14, 1826–1837. 10.1021/bm400234c. [DOI] [PubMed] [Google Scholar]
- Prabu P.; Chaudhari A.; Ko J.; Dharmaraj N.; Park S.; Kim H.; Khil M. Cellular Uptake and In Vitro Drug Release Studies on Paclitaxel-Loaded Poly(caprolactone)-Grafted Dextran Copolymeric Nanoparticles. NanoBiotechnology 2009, 5, 42–49. 10.1007/s12030-010-9031-7. [DOI] [PubMed] [Google Scholar]
- Lee K. S.; Chung H. C.; Im S. A.; Park Y. H.; Kim C. S.; Kim S. B.; Rha S. Y.; Lee M. Y.; Ro J. Multicenter phase II trial of Genexol-PM, a Cremophor-free, polymeric micelle formulation of paclitaxel, in patients with metastatic breast cancer. Breast Cancer Res. Treat. 2008, 108, 241–50. 10.1007/s10549-007-9591-y. [DOI] [PubMed] [Google Scholar]
- Letchford K.; Burt H. M. Copolymer micelles and nanospheres with different in vitro stability demonstrate similar paclitaxel pharmacokinetics. Mol. Pharmaceutics 2012, 9, 248–60. 10.1021/mp2002939. [DOI] [PubMed] [Google Scholar]
- Owen S. C.; Chan D. P. Y.; Shoichet M. S. Polymeric micelle stability. Nano Today 2012, 7, 53–65. 10.1016/j.nantod.2012.01.002. [DOI] [Google Scholar]
- Shi Y.; van der Meel R.; Theek B.; Oude Blenke E.; Pieters E. H.; Fens M. H.; Ehling J.; Schiffelers R. M.; Storm G.; van Nostrum C. F.; Lammers T.; Hennink W. E. Complete Regression of Xenograft Tumors upon Targeted Delivery of Paclitaxel via Pi-Pi Stacking Stabilized Polymeric Micelles. ACS Nano 2015, 9, 3740–52. 10.1021/acsnano.5b00929. [DOI] [PMC free article] [PubMed] [Google Scholar]
- Gaware V. S.; Hakerud M.; Juzeniene A.; Hogset A.; Berg K.; Masson M. Endosome Targeting meso-Tetraphenylchlorin-Chitosan Nanoconjugates for Photochemical Internalization. Biomacromolecules 2017, 18, 1108–1126. 10.1021/acs.biomac.6b01670. [DOI] [PubMed] [Google Scholar]
- Szwed M.; Torgersen M. L.; Kumari R. V.; Yadava S. K.; Pust S.; Iversen T. G.; Skotland T.; Giri J.; Sandvig K. Biological response and cytotoxicity induced by lipid nanocapsules. J. Nanobiotechnol. 2020, 18, 5. 10.1186/s12951-019-0567-y. [DOI] [PMC free article] [PubMed] [Google Scholar]
- Theodossiou T. A.; Olsen C. E.; Jonsson M.; Kubin A.; Hothersall J. S.; Berg K. The diverse roles of glutathione-associated cell resistance against hypericin photodynamic therapy. Redox Biol. 2017, 12, 191–197. 10.1016/j.redox.2017.02.018. [DOI] [PMC free article] [PubMed] [Google Scholar]
- Rúnarsson Ö. V.; Malainer C.; Holappa J.; Sigurdsson S. T.; Másson M. tert-Butyldimethylsilyl O-protected chitosan and chitooligosaccharides: useful precursors for N-modifications in common organic solvents. Carbohydr. Res. 2008, 343, 2576–2582. 10.1016/j.carres.2008.08.014. [DOI] [PubMed] [Google Scholar]
- Song W.; Gaware V. S.; Rúnarsson Ö. V.; Másson M.; Mano J. F. Functionalized superhydrophobic biomimetic chitosan-based films. Carbohydr. Polym. 2010, 81, 140–144. 10.1016/j.carbpol.2010.01.041. [DOI] [Google Scholar]
- Holliday D. L.; Speirs V. Choosing the right cell line for breast cancer research. Breast Cancer Res. 2011, 13, 215. 10.1186/bcr2889. [DOI] [PMC free article] [PubMed] [Google Scholar]
- Monopoli M. P.; Walczyk D.; Campbell A.; Elia G.; Lynch I.; Baldelli Bombelli F.; Dawson K. A. Physical-chemical aspects of protein corona: relevance to in vitro and in vivo biological impacts of nanoparticles. J. Am. Chem. Soc. 2011, 133, 2525–2534. 10.1021/ja107583h. [DOI] [PubMed] [Google Scholar]
- Gräfe C.; Weidner A.; Lühe M. v. d.; Bergemann C.; Schacher F. H.; Clement J. H.; Dutz S. Intentional formation of a protein corona on nanoparticles: Serum concentration affects protein corona mass, surface charge, and nanoparticle–cell interaction. Int. J. Biochem. Cell Biol. 2016, 75, 196–202. 10.1016/j.biocel.2015.11.005. [DOI] [PubMed] [Google Scholar]
- Yang W. S.; Stockwell B. R. Ferroptosis: Death by Lipid Peroxidation. Trends Cell Biol. 2016, 26, 165–176. 10.1016/j.tcb.2015.10.014. [DOI] [PMC free article] [PubMed] [Google Scholar]
- Zilka O.; Shah R.; Li B.; Friedmann Angeli J. P.; Griesser M.; Conrad M.; Pratt D. A. On the Mechanism of Cytoprotection by Ferrostatin-1 and Liproxstatin-1 and the Role of Lipid Peroxidation in Ferroptotic Cell Death. ACS Cent. Sci. 2017, 3, 232–243. 10.1021/acscentsci.7b00028. [DOI] [PMC free article] [PubMed] [Google Scholar]
- Sui X.; Zhang R.; Liu S.; Duan T.; Zhai L.; Zhang M.; Han X.; Xiang Y.; Huang X.; Lin H.; Xie T. RSL3 Drives Ferroptosis Through GPX4 Inactivation and ROS Production in Colorectal Cancer. Front. Pharmacol. 2018, 9, 1371. 10.3389/fphar.2018.01371. [DOI] [PMC free article] [PubMed] [Google Scholar]
- Gaschler M. M.; Andia A. A.; Liu H.; Csuka J. M.; Hurlocker B.; Vaiana C. A.; Heindel D. W.; Zuckerman D. S.; Bos P. H.; Reznik E.; Ye L. F.; Tyurina Y. Y.; Lin A. J.; Shchepinov M. S.; Chan A. Y.; Peguero-Pereira E.; Fomich M. A.; Daniels J. D.; Bekish A. V.; Shmanai V. V.; Kagan V. E.; Mahal L. K.; Woerpel K. A.; Stockwell B. R. FINO2 initiates ferroptosis through GPX4 inactivation and iron oxidation. Nat. Chem. Biol. 2018, 14, 507–515. 10.1038/s41589-018-0031-6. [DOI] [PMC free article] [PubMed] [Google Scholar]
- Skotland T.; Iversen T. G.; Sandvig K. New metal-based nanoparticles for intravenous use: requirements for clinical success with focus on medical imaging. Nanomedicine 2010, 6, 730–737. 10.1016/j.nano.2010.05.002. [DOI] [PubMed] [Google Scholar]
- Blanco E.; Shen H.; Ferrari M. Principles of nanoparticle design for overcoming biological barriers to drug delivery. Nat. Biotechnol. 2015, 33, 941–951. 10.1038/nbt.3330. [DOI] [PMC free article] [PubMed] [Google Scholar]
- Xiao K.; Li Y.; Luo J.; Lee J. S.; Xiao W.; Gonik A. M.; Agarwal R. G.; Lam K. S. The effect of surface charge on in vivo biodistribution of PEG-oligocholic acid based micellar nanoparticles. Biomaterials 2011, 32, 3435–3446. 10.1016/j.biomaterials.2011.01.021. [DOI] [PMC free article] [PubMed] [Google Scholar]
- Wang T.; Hou J.; Su C.; Zhao L.; Shi Y. Hyaluronic acid-coated chitosan nanoparticles induce ROS-mediated tumor cell apoptosis and enhance antitumor efficiency by targeted drug delivery via CD44. J. Nanobiotechnol. 2017, 15, 7. 10.1186/s12951-016-0245-2. [DOI] [PMC free article] [PubMed] [Google Scholar]
- Yang C.; Gao S.; Dagnaes-Hansen F.; Jakobsen M.; Kjems J. Impact of PEG Chain Length on the Physical Properties and Bioactivity of PEGylated Chitosan/siRNA Nanoparticles in Vitro and in Vivo. ACS Appl. Mater. Interfaces 2017, 9, 12203–12216. 10.1021/acsami.6b16556. [DOI] [PubMed] [Google Scholar]
- Fusser M.; Overbye A.; Pandya A. D.; Morch Y.; Borgos S. E.; Kildal W.; Snipstad S.; Sulheim E.; Fleten K. G.; Askautrud H. A.; Engebraaten O.; Flatmark K.; Iversen T. G.; Sandvig K.; Skotland T.; Maelandsmo G. M. Cabazitaxel-loaded Poly(2-ethylbutyl cyanoacrylate) nanoparticles improve treatment efficacy in a patient derived breast cancer xenograft. J. Controlled Release 2019, 293, 183–192. 10.1016/j.jconrel.2018.11.029. [DOI] [PubMed] [Google Scholar]
- Wilhelm S.; Tavares A. J.; Dai Q.; Ohta S.; Audet J.; Dvorak H. F.; Chan W. C. W. Analysis of nanoparticle delivery to tumours. Nat. Rev. Mater. 2016, 1, 16014. 10.1038/natrevmats.2016.14. [DOI] [Google Scholar]
Associated Data
This section collects any data citations, data availability statements, or supplementary materials included in this article.