

Abstract
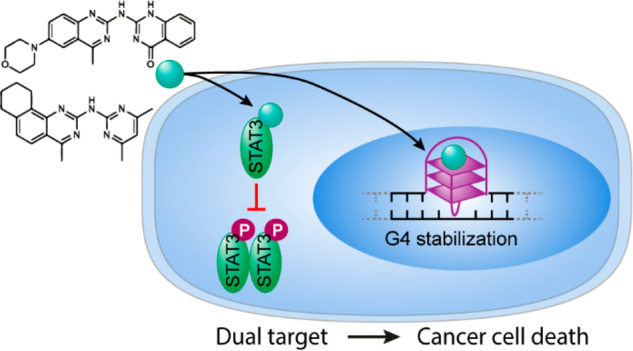
The signal transducer and activator of transcription 3 (STAT3) protein is a master regulator of most key hallmarks and enablers of cancer, including cell proliferation and the response to DNA damage. G-Quadruplex (G4) structures are four-stranded noncanonical DNA structures enriched at telomeres and oncogenes’ promoters. In cancer cells, stabilization of G4 DNAs leads to replication stress and DNA damage accumulation and is therefore considered a promising target for oncotherapy. Here, we designed and synthesized novel quinazoline-based compounds that simultaneously and selectively affect these two well-recognized cancer targets, G4 DNA structures and the STAT3 protein. Using a combination of in vitro assays, NMR, and molecular dynamics simulations, we show that these small, uncharged compounds not only bind to the STAT3 protein but also stabilize G4 structures. In human cultured cells, the compounds inhibit phosphorylation-dependent activation of STAT3 without affecting the antiapoptotic factor STAT1 and cause increased formation of G4 structures, as revealed by the use of a G4 DNA-specific antibody. As a result, treated cells show slower DNA replication, DNA damage checkpoint activation, and an increased apoptotic rate. Importantly, cancer cells are more sensitive to these molecules compared to noncancerous cell lines. This is the first report of a promising class of compounds that not only targets the DNA damage cancer response machinery but also simultaneously inhibits the STAT3-induced cancer cell proliferation, demonstrating a novel approach in cancer therapy.
Introduction
Drug resistance presents a major challenge in cancer therapy. The combination of two or more therapeutic agents with different targets is therefore used with the aim to improve the therapeutic effect and reduce the development of drug resistance. Likewise, a single molecule active on two distinct cancer targets should result in similar therapeutic benefits and also reduce the risk of drug–drug interactions. However, this strategy is rare, likely because it is difficult to develop such dual-target compounds.
A well-known strategy to combat cancer is to cause DNA damage. This is detrimental to the majority of cancer cells because of their dysfunctional DNA repair mechanisms, resulting in apoptosis. For instance, breast cancer cells that are BRCA1/BRCA2 deficient, and therefore defective in repairing their DNA through homologous recombination, are treated in clinics with DNA-damaging agents, such as cis-platin and poly(ADP-ribose) polymerase (PARP) inhibitors.1 However, many cancer cells circumvent this by blocking programmed cell death and become resistant to treatment.2 The use of compounds that target antiapoptotic pathways therefore have great potential for synergism with compounds that cause DNA damage. Two recognized cancer targets along this line that have lately gained a lot of attention are G-quadruplex (G4) DNA structures and the STAT3 protein. G4 DNA structures are four-stranded secondary DNA structures that play important roles in regulating gene expression. In the human genome, it is estimated that G4 structures can form at over 700 000 positions.3 G4 structures are over-represented in oncogenes and regulatory genes, and under-represented in housekeeping and tumor suppressor genes,4,5 and therefore suggested to be promising chemotherapeutic targets. This is further supported by the high occurrence of G4 structures in the telomeres and by their ability to inhibit telomerase action and obstruct DNA replication and repair, which leads to activation of the DNA damage response pathway resulting in apoptosis.6,7 Furthermore, cancer cells possess more G4 DNA structures compared to noncancerous cells,8 and clinical trials have been conducted with the G4-stabilizing compound CX-5461 for treatment of BRCA1/2-deficient tumors9 as well as compound CX-3543 for treatment of carcinoid and neuroendocrine tumors.10
The Janus kinase/signal transducer and activator of transcription (JAK/STAT) signaling pathway plays important roles in cell growth and survival. Activation of the members of the STAT family of proteins through phosphorylation is thus tightly regulated, and loss of this control correlates with pathological conditions. In particular, uncontrolled/constitutive active STAT3 is frequently detected in several cancer types,11,12 and STAT3 is therefore considered to be a promising cancer drug target.13 Unphosphorylated and inactive STAT3 exists in a monomeric state and localizes mainly in the cytoplasm. When STAT3 is phosphorylated, it dimerizes and translocates into the nucleus where it promotes transcription of target genes, of which many are oncogenes.14 Subsequently, downstream pathways act in cancer cell survival, proliferation, invasion, and metastasis.2 Thus, inhibition of STAT3 phosphorylation blocks its activation and represents one of the main strategies in STAT3-related drug development.15
Here, we synthesized 47 quinazoline analogues and analyzed them with biochemical and biophysical methods, molecular modeling, microscopy, and cell experiments. These studies reveal the mechanism by which the quinazolines selectively stabilize G4 DNA structures in cells. Additionally, we show that the same lead compounds also block phosphorylation of the STAT3 protein without affecting STAT1. Treatment of human cells with the compounds increased DNA damage and induced apoptosis. Importantly, treated breast cancer-derived cells showed reduced viability compared to noncancerous cells from breast tissue. Thus, we present quinazoline compounds that selectively bind to two independent chemotherapeutic targets, which represent a novel chemotherapeutic strategy.
Result and Discussion
4f and 8g Selectively Bind and Stabilize G4 Structures in Vitro
We previously screened >30 000 compounds for their ability to bind to three different G4 structures, and we identified quinazoline-based compound 5b as having the ability to both bind and stabilize G4 structures.16 Furthermore, we reported16 that a compound with structural resemblance to 5b had been identified in a screen for compounds that selectively inhibit phosphorylation of STAT3 at tyrosine 705 (pSTAT3).17 Intrigued by this potential for dual targeting, we designed and synthesized a library of 47 analogues (Scheme 1). Initially, we determined the G4 stabilization effect of these analogues by measuring the progression of Taq DNA polymerase on DNA templates carrying G4 structures with different topologies and one non-G4 control DNA template,16,18 and we identified several selective G4-stabilizing compounds and structure–function relationships (Figures S1–S3). For our subsequent experiments, we selected compounds 4f and 8g (Scheme 1) because these were the most effective in stabilizing the different G4 topologies without affecting the non-G4 DNA (Figure S3). Dose-dependent studies of these two compounds showed an up to 10-fold improvement in G4-associated inhibition of DNA polymerization compared to the original hit 5b, suggesting that these two compounds efficiently stabilize G4 structures (Figures 1a, 1b, and S4–S9a). The topologies of the G4 structures had slightly different impacts on the stabilization ability of the compounds, and 5b and 8g had stronger preferences for parallel DNA structures than a hybrid DNA structure. 4f stabilized the ribosomal parallel and hybrid DNA structures equally well and showed very strong preference for the well-characterized parallel c-MYC Pu24T G4 structure (Figures 1a, 1b, and S4–S9a). By surface plasmon resonance (SPR) and microscale thermophoresis (MST) the dissociation constant (KD) of 4f for the c-MYC Pu24T G4 DNA structure was estimated to be ∼180 nM (Figure 1c–f). Moreover, the compounds were selective for G4 DNA over single-stranded DNA (ssDNA) because the affinity of 4f and 8g measured by SPR and/or fluorescence titrations for the ssDNA control oligonucleotide was negligible (Figures S9 and S10).
Scheme 1. Scheme of Compounds Synthesis.

Figure 1.
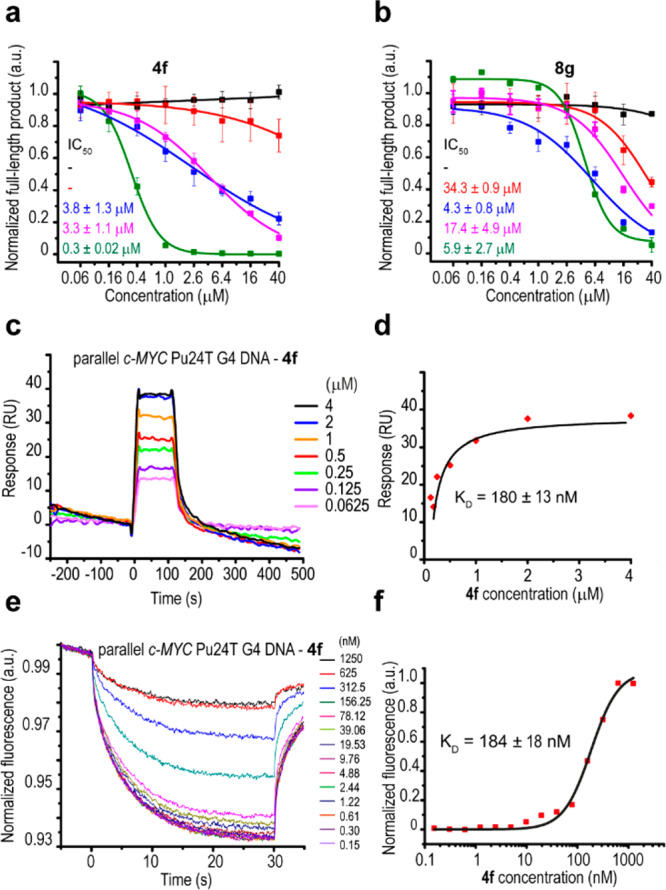
Compounds 4f and 8g selectively stabilize G4 structures in vitro. Dose response analyses of the Taq-polymerase stop assay with (a) 4f and (b) 8g with the different G4 templates (hybrid telomeric G4, magenta; parallel ribosomal G4, blue; parallel c-MYC Pu24T G4, green; antiparallel cdc13+ promoter DNA, red) and non-G4 DNA (black) templates used in the primary Taq-polymerase assay screens (Figures S4, S5, and S8). Numbers represent the estimated IC50 values. Binding of 4f to the c-MYC Pu24T G4 DNA structure was measured by SPR showing the (c) sensorgrams and (d) dose response curve as well as by MST analysis showing the (e) binding curves and (f) dose response curve. IC50 and KD values show mean of three measurements ± SD.
To analyze the compounds’ binding interactions with G4 DNA structures, we performed nuclear magnetic resonance (NMR) studies with the c-MYC Pu24T G4 DNA structure by monitoring chemical shift changes of the imino protons of guanines in the G4 structure.19 In agreement with the SPR, MST, and/or fluorescence titration results, the NMR data showed that both 4f and 8g bound to the c-MYC Pu24T G4 structure (Figures 2a, 2b, and S11a). However, the chemical shift changes could not be quantified for 8g because line broadening of the imino peaks was observed instead of a new set of peaks (Figure S11a), which suggests multiple binding modes or fast on–off rates. By mapping the peak shift changes induced by 4f to the c-MYC Pu24T G4 NMR structure, we found that 4f strongly affected two of the guanines on one side of the top G-tetrad (G-4 and G-8) (Figure 2a–c) and guanine G-5 in the second G-tetrad located below G-4 and G-8 (Figure 2c). The strong effect on one side of the top G-tetrad could potentially be explained by binding interactions with the 5′ DNA sequence flanking the G4 or by a more atypical intercalative binding mode. To investigate these potential binding modes, we next performed molecular dynamics (MD) simulations based on the NMR results. When 4f was modeled on the top of the first G-tetrad, it mostly interacted with G-4 and G-8 in the first G-tetrad but also with G-17, although no chemical shift changes were observed for G-17 in the NMR experiments (Figure 2c–e). When the compound was intercalated between the first and the second G-tetrad it also generated a stable structure where 4f mostly interacted with G-4 and G-8, leaving G-17 largely unaffected in accordance with the NMR results (Figure 2c, 2f, and 2g). The MD-predicted affinity for the top-binding mode was weaker than that for the intercalating conformation (Table S1). The intercalative binding mode would explain 4f’s high affinity despite being neutral and having a low molecular weight, which is rare for compounds that target large and flat binding surfaces such as end stacking with G4 structures. Nevertheless, the intercalative binding mode is unusual for G4-stabilizing compounds, and even though our data match better for this binding mode, the most commonly described end-stacking binding mode cannot be excluded without further structural elucidation.
Figure 2.

Binding modes of 4f to the c-MYC Pu24T G4 structure. (a) Imino region of the 1H NMR spectrum of c-MYC Pu24T in the absence (bottom) and presence of 0.5 equiv of 4f (middle) and 1 equiv of 4f (top). New set of well-defined peaks appeared upon addition of 4f, originating from the 4f:DNA complex. At a 1:2 ratio of 4f to DNA, both free and bound forms of the imino peaks were observed, which were used to assign the bound form. Peaks marked with asterisks originated from the DNA in complex with 4f. Sizes of the induced chemical shift changes could be determined by observing exchange peaks in a 2D NOESY spectrum (b) of 0.5 equiv of 4f binding to c-MYC Pu24T G4 DNA. Off-diagonal peaks represent cross-peaks from the exchange between free and bound form of DNA. (c) Cartoon showing the structure of c-MYC Pu24T G4 DNA and interactions of the different guanines in the presence of 4f based on the NMR data in a and b. (d) Top and (e) side views of an end-stacking binding model compared to (f) top and (g) side views of an intercalative binding model from two of the largest MD clusters of the c-MYC Pu24T G4 DNA-4f complex. Color coding is the same in c–g. Observed chemical shift changes in the NMR data are shown in red (large shifts), yellow (moderate shifts), and blue (no/small shifts).
We also performed MD simulations with 8g, which suggested different types of end-stacking binding modes for this compound (Figure S11b and Table S2). In fact, modeling of 8g in the intercalative binding mode did not give good results and prohibited subsequent MD simulations (data not shown).
HeLa Cells Are Sensitive to 4f and 8g Resulting in Replication Stress, DNA Damage, and Apoptosis
Next, we investigated whether the compounds are able to enter into cultured human cells. We first took advantage of the fluorescence properties of 8g (Figure S12a) and performed in vivo live imaging of HeLa cells by 2-photon excitation microscopy and confocal laser scanning microscopy (CLSM). We detected the accumulation of 8g in the nucleolar G4-rich regions already at 10 min after the start of the treatment (Figure S12b–d). Detection of nucleolar localization is typical for many fluorescent G4 ligands.20−24 Moreover, we confirmed 4f and 8g uptake by Caco-2 cell permeability experiments (Table S3). Together these data show that both 4f and 8g are able to enter into human cells.
Because human cancer cell lines, HeLa cells in particular, have increased amounts of G4 DNA structures compared to noncancerous cells like human primary fibroblasts (HPFs),25 we compared the effect of 5b, 4f, and 8g on these two cell types. Increasing concentrations of all three compounds were toxic to both HPFs and HeLa cells (4f and 8g were both more toxic compared to 5b) (Figure 3a and 3b). Notably, while the dose response of 5b was the same in the two cell types, 4f was slightly more toxic to HeLa cells and 8g had a significantly stronger effect on HeLa cells compared to HPFs (at 2.5–7.5 μM) (Figure S13a–c). The largest difference in cell survival was observed when HPFs (90.4% viable cells) and HeLa cells (8.6% viable cells) were treated with 2.5 μM 8g (Figure S13c), showing that HeLa cells are about 10-fold more sensitive to 8g than HPFs.
Figure 3.
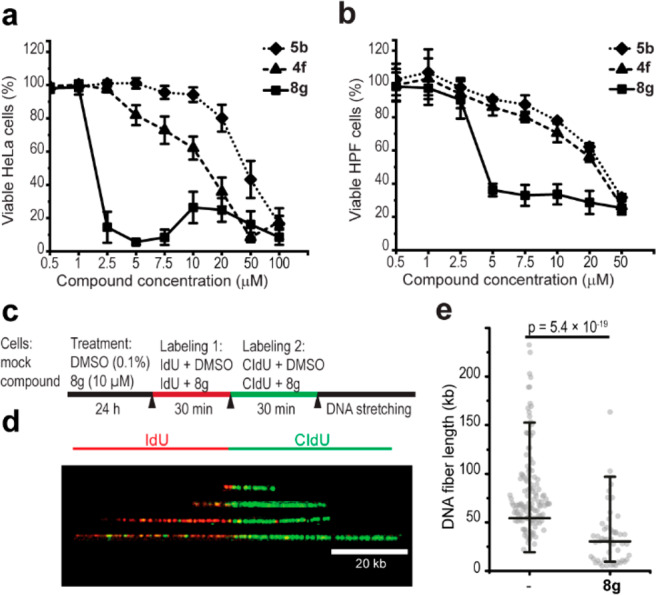
HeLa cells are sensitive to the novel compounds resulting in replication stress. Cell viability assay of (a) HeLa and (b) HPFs treated for 48 h with 5b, 4f, or 8g at the indicated concentrations. Data represent the mean ± SD, n ≥ 3. (c) Schematic of the DNA fiber analysis. (d) Representative images of replication tracts with different lengths. Intact DNA fibers displaying iodo-deoxyuridine (IdU) labels (red) flanked by chloro-deoxyuridine (CldU) labels (green). (e) Quantification of the fiber length (kb) in treated (8g) versus mock cells (−). Data represent populations of individual DNA fibers for each condition of the final experiment (63 for control and 52 for treatment). Mean ± 2SD is indicated. Welch-corrected two-sample t tests of ln-transformed data were used, and p value is indicated.
One explanation for the observed cell viability effects might be perturbed DNA replication.9 To examine the effect of 8g on DNA replication, we performed DNA fiber analysis in HeLa cells (Figure 3c and 3d). The mean DNA replication tract length was significantly shorter in 8g-treated cells compared to mock-treated cells (p = 5.4 × 10⁻¹⁹) (Figure 3e), suggesting that 8g affects the DNA replication speed. DNA replication tract length was not determined in 4f-treated cells. Decreased DNA replication speed could potentially be a sign of DNA damage accumulation, which can be detected by phosphorylated histone H2A.X (γH2A.X) protein levels.26
We treated HeLa cells with increasing concentrations of 5b, 4f, and 8g based on the effects detected in the cell viability assay (Figure 3a), and we found an increased γH2A.X signal compared to the mock-treated cells (Figure 4a and 4b). We also analyzed the upstream phosphorylation of ATM serine/threonine kinase (ATM), the major kinase involved in the phosphorylation of H2A.X.27 The individual presence of all three compounds increased ATM phosphorylation levels, confirming that they all induce a DNA damage checkpoint response (Figure 4a and 4b). Surprisingly, 8g showed a differential dose response for ATM and H2A.X phosphorylation (Figure 4a and 4b). At 5 μM 8g, the γH2A.X levels were increased but the ATM phosphorylation levels were unchanged, whereas at higher compound concentrations both ATM and H2A.X were phosphorylated (Figure 4a and 4b). These data suggest that cells treated with 5 μM 8g undergo ATM-independent phosphorylation of H2A.X, while at higher concentrations the compound causes increased γH2A.X through the ATM-dependent pathway. It has been reported that in cells treated with ionizing radiation a lower radiation dose leads to a strong decrease in the cell survival rate as a result of ATM-independent H2A.X phosphorylation. On the other hand, high radiation doses lead to phosphorylation of ATM and consequently DNA repair activation and thus have a less pronounced effect on cell survival.28 We confirmed a similar mechanism for 8g by measuring apoptosis with increasing compound concentrations. At 5 μM, the proportion of apoptotic cells was about 2-fold higher (23.1%) compared to cells treated with either 10 or 20 μM 8g (10.7% and 13%, respectively) (Figures 4c and S14a). This finding explains the inverted cell viability dose response with 8g (Figure 3a).
Figure 4.

Compounds 4f and 8g induce DNA damage response and genome instability in HeLa cells. (a) Immunoblot analysis of soluble (for pATM, ATM, and PCNA) and chromatin-bound (for γH2A.X and H2AX) protein fractions extracted from HeLa cells treated for 12 h with 5b, 4f, or 8g at the indicated concentrations. PCNA was used as loading control of the soluble protein fractions. (b) Quantification of the immunoblot analysis in a. Error bars represent the mean ± absolute error (n = 2) for 5b and 4f and the mean ± SD (n = 3) for 8g. (c) Number of apoptotic cells (annexin V-positive cells) measured by flow cytometry. HeLa cells were treated for 12 h with 8g at the indicated concentrations and stained with propidium iodide and annexin V. Data represent the mean ± SD (n = 3). Analysis of the data was performed using two-sample t tests with assumed equal variance, and p values are indicated. (d) Representative images of HeLa cells treated for 12 h with 50 μM 4f (right) or DMSO (left). Cell nuclei were stained with DAPI upon cell fixation. Black arrows indicate ICBs. Scale bars indicate 40 μm. (e) Fold change in the number of ICBs in treated versus untreated cells. At least 350 cells from six technical replicates were counted for each treatment, and data represent the mean ± SD of three independent experiments. Analysis of the data was performed using the two-sample t test. (f) Viability of different cell lines. Cells were treated for 48 h with 7 μM 4f. Data represent the mean ± SD (n = 3). Analysis of the data was performed using the two-sample t test.
4f Treatment Is Toxic to Triple-Negative Breast Cancer Tumor Cells
On the basis of our primer extension assays and SPR analysis, we observed efficient stabilization of telomeric G4 DNA by 4f (Figures 1a, S3b, S5a, and S9d). Furthermore, HeLa cells treated with 4f had ∼4-fold increase in the formation of internuclear chromatin bridges (ICBs) (Figure 4d and 4e), a hallmark of telomere instability.29 Similar to 4f, the G4-stabilizing compounds, CX-5461 and CX-3543, also induce replication defects, DNA damage, and telomere instability, all important properties for DNA-targeting cancer drugs.9,10 In fact, the highly aggressive triple-negative breast cancer cell lines, MDA-MB-231 and MDA-MB-436, are among the most sensitive breast cancer cell lines toward CX-5461.9 Furthermore, MDA-MB-436 cells have a BRCA1 mutation that results in loss of nuclear BRCA1 protein expression.30 We treated these cell lines with 4f to examine if MDA-MB-231 and MDA-MB-436 are also more sensitive to 4f than healthy epithelial cell lines derived from benign proliferative breast tissue, MCF-10a. Indeed at 7 μM, a concentration that was not toxic for the control breast cell lines, we found reduced viability of both the MDA-MB-231 and the MDA-MB-436 tumor cell lines, 60% and 55%, respectively (Figure 4f). In addition, and similar to CX-5461, both cell lines were more sensitive to 4f compared to the noninvasive and less aggressive breast cancer cell line MCF-7, which is BRCA1+/+ and does not contain known mutations in DNA damage repair genes (Figure 4f).
These data demonstrate that triple-negative breast cancer cell lines are more sensitive to 4f treatment than cell lines derived from control breast tissue, suggesting that 4f, similar to CX5461, which is in clinical trial phase I,9 may be a good drug candidate in treating triple-negative breast cancer and target tumor cells that are deficient in DNA damage repair pathways. Similar to 4f, the breast cancer cells MCF-7, MDA-MB-231, and MDA-MB-436 are more sensitive to 8g compared to the cell line derived from benign proliferative breast tissue, MCF-10a (Figure S13d).
Treatment with 4f and 8g Results in Increased BG4 Foci in HeLa Cells
To determine if 4f and 8g stabilize G4 DNA structures in human cell culture, we used the anti-G4 DNA antibody BG425 and performed immunofluorescence microscopy to visualize and quantify G4 DNA structures in HeLa cells. At the compound concentrations that resulted in a DNA damage response (Figure 4a and 4b), we found that the number of BG4 foci per cell nucleus increased significantly in the treated cells compared to mock-treated cells (4fp = 5.52 × 10⁻¹³ and 8gp = 1.06 × 10⁻⁶) (Figure 5). The increased number of BG4 foci could already be detected after 1 h of treatment with 20 μM 8g (Figure S14b). In contrast, cells treated with 5 μM 8g, a concentration that caused phosphorylation of H2A.X without ATM activation, did not show an increase in the number of BG4-positive foci/cell, suggesting that the ATM-independent phosphorylation of H2A.X is not dependent on G4 stabilization (Figure S14b). Together, these data support the hypothesis that 8g and 4f are able to stabilize G4 DNA structures in cells and that this induces replication stress and DNA damage and thus reduces cell viability. However, 8g affected the viability more strongly compared to 4f, and this cannot be explained only by G4 DNA stabilization because 4f is at least as effective as 8g in stabilizing G4 DNA structures both in vitro and in human cells (Figures 1a, 1b, 5, and S3a and b).
Figure 5.
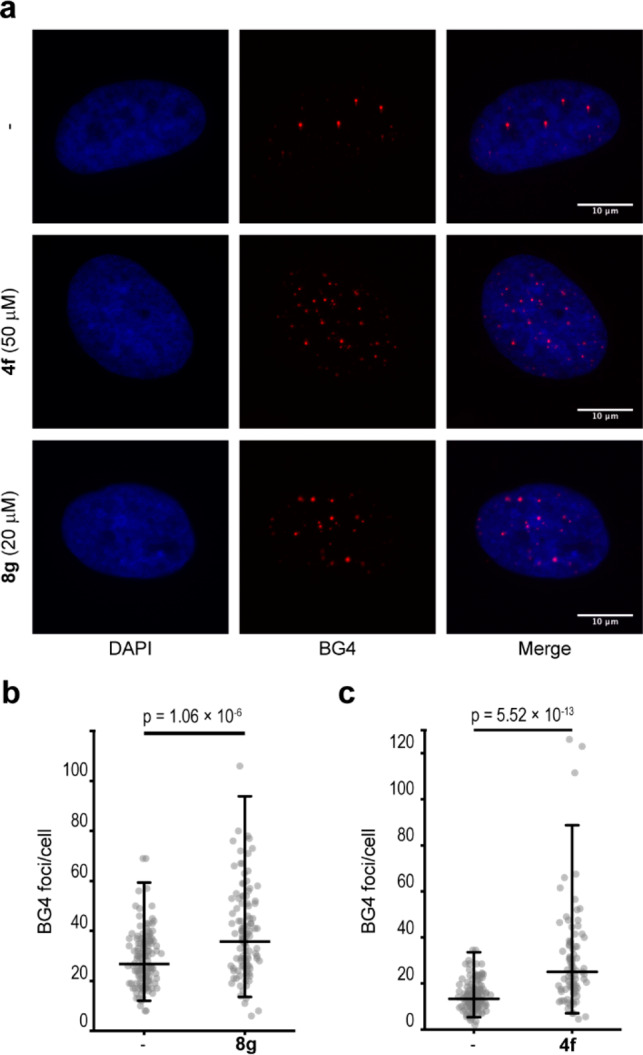
Treatment with 4f and 8g results in increased BG4 foci in HeLa cells. (a) Representative images of HeLa cells stained with the BG4 antibody after treatment for 12 h. (b and c) Quantification of BG4-positive cell nuclei. Data represent populations of individual cells for each condition of the final experiment: (b) DMSO (−) = 133 cells, 8g 20 μM = 111 cells; (c) DMSO (−) = 130 cells, 4f 50 μM = 85 cells). Means ± 2SD are indicated. Analysis of the data was performed using Welch-corrected two-sample t tests of ln-transformed data, and p values are indicated.
Phosphorylation of STAT3 Is Inhibited by 4f and 8g by Direct Binding
To examine if the reduced viability is due to unsuccessful STAT3 activation, we tested if our compounds affect pSTAT3 levels in human cells. We treated HeLa cells with 4f, 5b, or 8g, which indeed resulted in a reduction of the pSTAT3 protein levels for all three compounds (Figure 6a). In 4f-treated cells, pSTAT3 reduction occurred at 50 μM (Figure 6a and 6b), a concentration at which G4 stabilization was also increased (Figure 5c). In contrast, in 8g-treated cells pSTAT3 was inhibited already at 5 μM (Figure 6a and 6b), a concentration at which we did not detect any increase in the number of BG4-positive foci (Figure S14b). Together these data suggest that 4f and 8g act on both G4 structures and pSTAT3, although 8g-dependent pSTAT3 inhibition occurs at lower concentrations than the G4 structure stabilization, resulting in the activation of two different processes that ultimately lead to cell death (Figure 4c). At the highest concentration tested for each of the compounds, total STAT3 levels were also affected (Figure 6a). However, the reduction of pSTAT3 occurred at lower compound concentrations, and a dose-dependent reduction of the pSTAT3/STAT3 ratio was observed (Figure 6b), indicating that the reduced pSTAT3 levels were not dependent on the total STAT3 protein levels. Because STAT3 levels are positively autoregulated,31 STAT3 downregulation might represent a consequence of pSTAT3 inhibition. In agreement, we confirmed a direct interaction between 4f and 8g with STAT3 protein by SPR analysis (4fKD = 45 μM, 8gKD = 15.5 μM) (Figures 6c–e and S15), showing that 4f and 8g bind to the STAT3 protein and might therefore directly interfere with STAT3 phosphorylation.
Figure 6.
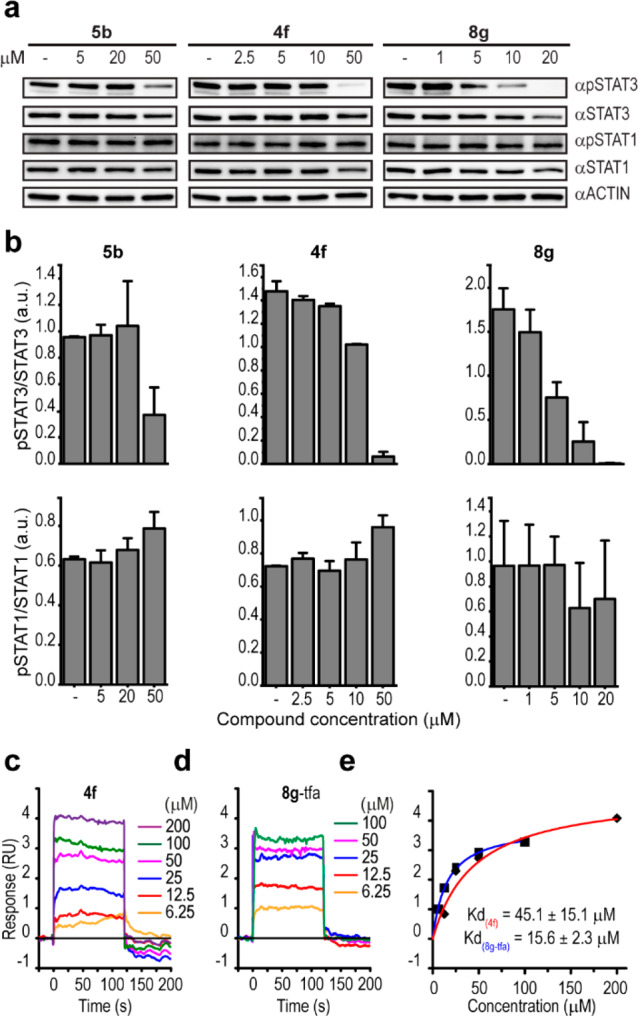
Phosphorylation of STAT3 is inhibited by direct binding of 4f and 8g to the STAT3 protein. (a) Total cell lysate from HeLa cells treated for 12 h at the indicated concentrations of 5b, 4f, or 8g immunoblotted with the indicated antibodies. Actin was used as the loading control. (b) Quantification of the immunoblot analysis in a. Error bars represent the mean ± absolute error of two independent experiments. SPR sensorgrams of (c) 4f and (d) 8g binding to STAT3 protein with corresponding (e) dose response curves (trifluoroacetic acid salt (TFA) of 8g was used (see Supporting Information) to increase the solubility of 8g within the concentration range used in this experiment). Average of three measurements is shown ± SD, and full graphs are presented in Figure S15.
STAT1, another member of the STAT family of proteins that have antiproliferative and pro-apoptotic functions,32 shares around 50% amino acid sequence homology with STAT3.33 Importantly, none of the compounds tested here affected the total or phosphorylated levels of STAT1 (Figure 6a and 6b), indicating that the compounds selectively inhibit STAT3 over STAT1. Therefore, 4f and 8g not only stabilize G4 structures but also selectively inhibit the STAT3-mediated pathway, which is an important pathway in cancer therapeutics.
8g Localizes into the Nucleus in S. pombe Cells and Perturbs Replication Fork Progression
Although the JAK/STAT signaling pathway is essential for multicellular organisms, it is not present in unicellular organisms such as the fission yeast Schizosaccharomyces pombe.34,35 However, the positions of many G4 structures are conserved between S. pombe and multicellular organisms,36,37 and unresolved G4 structures result in fork pausing and DNA damage,37,38 indicating that G4 structures also form in S. pombe. Therefore, to confirm that the effects of 4f and 8g on HeLa cells are a consequence of G4 stabilization and not merely a result of the pSTAT3 inhibition, we tested the effect of these compounds in S. pombe.
For this study, we employed an S. pombe mutant strain in which the multidrug-resistant response pathway has been partly deleted, as wild-type S. pombe cells are multidrug resistant due to very efficient drug efflux pumps.39,40 We found that 8g localized into the nucleus (Figures 7a and S16a) and affected the growth of asynchronous S. pombe cells (Figure 7b). 4f did not affect cell growth, probably due to a limited cell uptake in S. pombe (Figure 7b).39 Cells treated with 8–12 μM 8g showed a 4-fold decrease in the number of doublings and altered cell morphology compared to mock-treated S. pombe cells (Figure 7b and 7c). To determine if the reduced cell growth was due to slower S-phase, we examined whether 8g affects the cell cycle progression of synchronized S. pombe cells (Figure S16b). Synchronized cells released from the G2 phase treated with 5 μM 8g showed both delayed (∼100 min after release instead of ∼80 min) and prolonged (120 min instead of 80 min) S-phase compared to mock-treated cells (Figure 7d). Increasing the concentration of 8g to 10 μM resulted in G2-arrested cells that were unable to progress through the cell cycle (Figure 7d).
Figure 7.

8g localizes into the nucleus in S. pombe cells and slows down cell growth during S-phase. (a) Representative image of S. pombe cells stained by 25 μM 8g and 0.25% DMSO (−). Final pictures are cropped of the full field images shown in Figure S12a. (b) Number of doublings per 12 h of S. pombe cells treated with 8g. Error bars represent ±SD, n = 3. (c) Representative images of S. pombe cells from b treated with 0.25% DMSO (−) or 10 μM 8g. Arrows indicate “pear”-like and other cell morphology deformations. (d) FACS analysis of synchronized S. pombe cells grown in PMG media treated with 5 and 10 μM of 8g. Representative FACS profiles are shown, n = 3. (e) Quantification of the DNA fiber length (kb) in treated (8g) versus mock cells (−). Data represent populations of individual DNA fibers for each condition of the final experiment (n = 40 per treatment). Mean ± SD is indicated. Two-sample t tests were used, and p value is indicated.
To more directly examine the effect of 8g on DNA replication, we performed DNA fiber analysis (Figure 7e). The mean DNA replication tract length was significantly shorter in 8g-treated cells compared to mock-treated cells (p = 1.6 × 10⁻⁷) (Figure 7e), suggesting that 8g affects DNA replication progression in S. pombe in a STAT3-independent manner.
Conclusions
We show that the quinazoline compounds can selectively stabilize G4 structures both in vitro and in human cell culture. In addition, the quinazoline lead compounds also selectively inhibit the STAT3-mediated pathway by binding to the STAT3 protein (Figure S17) without affecting the STAT1 protein. We show that our compounds induce replication stress, telomere and genome instability, and apoptosis and might therefore be beneficial for use in cancer therapy. In fact, we detected reduced viability of aggressive breast cancer cells compared to cells from healthy breast tissue treated with the lead compound.
Although both stabilization of G4 structures and pSTAT3 inhibition have independently shown promising effects in inhibiting cancer growth in different model systems,14,41 neither strategy has yet resulted in successful clinical trials.10,42−44 The ability to affect these two targets with a single low molecular weight compound represents a chemotherapeutic concept with potential benefits such as synergism and reduced drug resistance and thus may be of high therapeutic relevance in the clinics.
Experimental Section
Compound Synthesis
Detailed procedures for compound synthesis are described in the Supporting Information.
Statistical Analysis
The minimal sample sizes for the microscopy experiments (BG4 immunostaining of human cells and S. pombe and fiber analysis) were determined by pilot experiments. Distribution plots and quantile–quantile plots were used to graphically examine the normality of the sample distributions. Transformation to natural logarithms was performed if required. p values were calculated by a two-sided Welch-corrected t test in the case of unequal variance. Unequal variance was determined by the F test. Effect sizes and the means with asymmetric ±2SD were calculated. In the ICB experiment and flow cytometry, a two-sided Student’s t test with assumed equal variance was used to determine significant differences. A p value < 0.05 was considered significant. All calculations were performed in Microsoft Excel and OriginPro 2016 software. Microscopy of BG4 immunostaining of human cells was single blinded using the DAPI channel for sample acquisition. Fiber analysis and ICB experiments were not blinded.
Taq DNA Polymerase Assay
All DNA molecules used in the assay were purchased from Eurofins Genomic (Table S4), and the experiment was performed as described previously.16 In brief, each reaction contained 40 nM template DNA incubated with 25 μM compound, and the control reaction used 5% DMSO in place of the compound. Each reaction was run for 10 min. The final quantification was the average value of two independent experiments along with the absolute error. For the dose response analysis, 40 nM template DNA was incubated with a 0.06, 0.16, 0.4, 1, 2.6, 6.4, 16, or 40 μM concentration of the compounds or with 5% DMSO as a control reaction. The experiments were performed in the same way as in the primary screening. The final quantification was the average value of three independent experiments along with the standard deviation. IC50 values were calculated by fitting the data from each experiment to the dose response function in the OriginPro 2016 software.
Surface Plasmon Resonance
The SPR experiment with DNA molecules was performed on a ProteOn XPR (Biorad) at 25 °C. A final concentration of 5 μM biotin-labeled oligonucleotides (Table S4) was folded into G4 structures in 10 mM potassium phosphate buffer, pH = 7, 150 mM KCl at 95 °C for 5 min and cooled down to room temperature overnight. Folded oligonucleotides were immobilized on a neutravidin-coated NLC sensor chip (Biorad) at a rate of 30 μL/min until maximal response unit (RU) values were reached (ribosomal G4 DNA, 780 RU; telomeric G4 DNA, 720 RU; c-MYC Pu24T G4 DNA, 1020 RU; c-kit G4 DNA, 780 RU; ssDNA, 1150 RU). Compounds 4f and 8g were diluted in SPR buffer (10 mM potassium phosphate buffer, pH = 7, 150 mM KCl, 0.05% Tween 20, and 5% DMSO) and injected at a flow rate of 50 μL/min for 120 s. Signal from a reference surface was subtracted, and data were solvent corrected for DMSO in order to obtain the true RU values. The apparent dissociation constants (KD) were calculated by fitting the data to a single-site binding function in the OriginLab 2016 software. All data were smoothed for visualization purposes only. The SPR experiment with STAT3 protein was performed on a Biacore T200 (GE Healthcare). A total of 10 ng/μL of his-STAT3 protein (SignalChem) (diluted in 1× phosphate-buffered saline (PBS), 0.005% Tween 20, and 5% DMSO) was immobilized on the NTA sensor chip at a flow rate of 5 μL/min until 1500 maximal RU. Compounds 4f, 8g, and 8g as TFA salt were injected in triplicate at a flow rate of 50 μL/min for 120 s. Compound 8g showed signs of aggregation, so 8g as TFA salt with improved solubility was used instead to get clean kinetics. The signal from a reference surface was subtracted, and the KD values were calculated by fitting the averaged data from the sensorgrams to a single-site binding function in GraphPad Prism 8.0.
Microscale Thermophoresis
c-MYC Pu24T DNA labeled with CY5 at the 5′ end was folded in 10 mM potassium phosphate and 100 mM KCl (pH 7.4) by heating at 95 °C for 5 min followed by cooling to room temperature. All experiments were performed in 10 mM potassium phosphate (pH 7.4), 100 mM KCl, 0.05% Tween 20, and 4% BSA, the DNA concentration was held constant at 25 nM, and the 4f concentration varied from 0.15 nM to 1.25 μM (14 dilution steps). The samples were loaded into standard MST-grade glass capillaries, and the MST experiment was performed using a Monolith NT.115 (Nano Temper, Germany) with 40% LED power. Data were analyzed using the Nano Temper analysis software, and KD was calculated by fitting the data to the Hill equation in OriginPro 8.0.
Nuclear Magnetic Resonance
The G4 DNA stock solution was prepared by folding 200 μM c-MYC Pu24T in 10 mM potassium phosphate buffer (pH = 7.4) and 35 mM KCl by heating to 95 °C and slowly cooling to room temperature overnight. An effective DNA concentration of 180 μM was obtained by adding 10% D2O. NMR samples were prepared in 3 mm NMR tubes by adding 1 equiv of 4f or 8g to the DNA stock solution. For 4g, an additional sample with 0.5 equiv of compound was also prepared. All spectra were recorded at 298 K on a Bruker 850 MHz Avance III HD spectrometer equipped with a 5 mm TCI cryoprobe. Excitation sculpting was used in the 1D 1H experiments, and 256 scans were recorded. The 2D NOESY experiment was recorded with 32 scans, 256 t1 increments, a relaxation delay of 1.1 s, and a mixing time of 200 ms. Processing was performed with zero filling in the indirect dimension and using 90°-shifted squared sine-bell apodization in both dimensions for the NOESY spectrum. Processing was performed in Topspin 3.5 (Bruker Biospin, Germany). The NMR peaks for c-MYC Pu24T G4 DNA were assigned according to a previously published structure.19
Molecular Dynamics Simulations
The c-MYC Pu24T solution structures (PDB ID: 2MGN) were downloaded from the Protein Data Bank.19 Eight c-MYC Pu24T-4f structures were modeled based on various 4f binding modes (Figure S18) and four binding modes of 8g (Figure S19) using the Openbabel,45 Avogadro,46 and Chimera47 software packages. Each complex was placed inside the center of a dodecahedron box, solvated by adding water molecules, and neutralized by adding an excess of 100 mM KCl using GROMACS tools.48 The DNA was simulated with the Amber99SB49 force-field parameters with PARMBSC150 improvements, and the tip3p model51 was used for water molecules. Before assigning GAFF force-field parameters52 to 4f and 8g, its partial atomic charges were computed by the RESP method53 using AmberTool54 after geometry optimization by PM6 and B3LYP/6-31g(d,p) methods in two stages using the Gaussian package.55 Subsequently, MD simulations were performed using GROMACS-201648 as previously described.56 The obtained MD trajectories were combined and clustered on the basis of principle component analysis using gmx_clusterByFeatures (https://gmx-clusterbyfeatures.readthedocs.io). The binding energy was calculated with the MM/PBSA method using the g_mmpbsa tool.57,58 Standard errors were calculated using the block-averaging method.59
Spectrophotometric Measurements
A 10 μM concentration of 8g was diluted into 100 mM KCl and 10.0 mM TRIS pH = 7.5 with and without the same equivalent of folded c-MYC Pu24T G4 DNA, and UV–vis absorption spectra were recorded by a T90+ UV/vis spectrometer (PG instruments Ltd.).
Spectrofluorimetric Measurement
Emission and excitation spectra of 5 μM 8g in 100% DMSO were recorded in a quartz cuvette with a 1 cm path length on a Jasco Spectrofluorometer FP-6500.
Fluorimetric Titrations
A 2.0 μM concentration of 8g (in 100 mM KCl and 10.0 mM TRIS pH = 7.5, 0.025% DMSO) was titrated by DNA or RNA oligonucleotides folded in the same buffer. The isosbestic point, λexc = 305 nm, was used for 8g excitation, and fluorescence spectra (λem = 315–675 nm) were recorded by a Jasco FP-6500 spectrofluorometer. DNA/RNA background fluorescence was subtracted from all data. Peak values at λem = 546 nm were fitted into hyperbolic binding function in Graphpad Prism 8.0 available at https://www.graphpad.com/support/faq/fitting-binding-of-fluorescent-ligands/.
S. pombe Growth and Doubling Time
The S. pombe (bfr1::hygr pmd1::natr ade6-M210 leu1) strain39 that had genes deleted in the multidrug-resistance response was the kind gift of the laboratory of Dr. Tarun Kapoor (Rockefeller University). The cells were exponentially grown at 30 °C in minimal medium EMMII (Formedium), and 1 × 10⁶ cells/mL were treated with 8g (1.6, 3.1, 6.3, 8, 10, 12.5, 25, 50, and 100 μM) or 0.25% DMSO for 12 h. The number of doublings per 12 h was calculated.
S. pombe Cell Synchrony and Flow Cytometry Analysis
S. pombe (bfr1::hygr pmd1::natr, cdc25–22) cells were used, and the experiment was performed as described previously.38 Cells were treated with 5 or 10 μM 8g immediately after G2 release. Samples were taken as described in Figure 5, and analysis was performed on a Beckman Coulter Cytomics FC500 flow cytometer. The experiment was repeated at least three times for each condition.
S. pombe Fluorescence Microscopy
Cells were exponentially grown at 30 °C in minimal medium PMG (Formedium). An amount of 5 ×10⁶ cells/mL was treated with 8g (final concentration 25 μM) or 0.25% DMSO (control) for 30 min, washed in PMG medium, and immobilized on poly-l-lysine-coated glass slides. Localization of 8g was immediately analyzed by a confocal microscope Leica SP8 FALCON using a HC PL APO 63×/1.40 OIL CS2 objective, hybrid detector, and Diode 405 nm laser with recorded emission between 520 and 620 nm. Final image was captured with an opened pinhole to 4. To determine nuclear localization of 8g, the background intensity of the fluorescence signal was decreased in both samples by identically treating the images with the ImageJ software.60
S. pombe DNA Fiber Analysis
For the DNA fiber analysis, we used the S. pombe strain (bfr1::hygr pmd1::natr cdc25–22 pfh1+::ura4+-nmt-pfh1-GFP leu1–32::[hENT1 leu1+] his7–366::[hsv-tk his7+] ade6-M21? his3-D1? telo-his3?).
Cells were grown to 107 cells/mL in the presence of 1.5 μM 8g or 0.015% (v/v) DMSO at 25 °C in liquid EMMII (Formedium) media for about 12 h. Next, the cultures were diluted to 5 × 10⁶ cells/mL, and the concentration of 8g was increased to 3 μM before arresting the cells in G2 phase at 37 °C for 4 h. The cells were released from G2 phase by shifting the temperature back to 25 °C. A 66 μM final concentration of bromodeoxyuridine (BrdU) was added 30 min after release from the G2 phase, and cells were allowed to incorporate BrdU into their DNA for 35 min. After addition of a stop solution (250 mM EDTA, pH 8.0, 0.16% sodium azide), cells were harvested by centrifugation and resuspended in cold 70% ethanol. A 200 U/mL lyticase from Arthrobacter luteus (Sigma-Aldrich) was used to digest the cell wall prior to stretching DNA fibers on microscopic slides. BrdU incorporated into DNA was detected using rat anti BrdU clone BU1/75 (ICRI) primary antibody (ABD Serotec) and Goat anti Rat IgG Alexa Fluor 568 secondary antibody (Life technologies), while anti-DNA antibody single-stranded clone 16–19 primary antibody (Sigma-Aldrich) and Goat Anti Mouse IgG2a (γ2a) Alexa Fluor 488 secondary antibody (Life technologies) were used to detect ssDNA. Stained DNA fibers were visualized using an Axio Imager Z1 microscope (Zeiss), and images of untangled DNA fibers were taken at random from different fields. Only DNA fibers with BrdU label having intact ssDNA ends or DNA fibers with BrdU label measuring more than 70 μm were selected for analysis using Zen 2.6 blue edition (Zeiss) and ImageJ software packages. The experiments were repeated independently twice with two biological replicates.
Cell Culture and Compound Preparation
HeLa cells (epitheloid cervix carcinoma, purchased from Sigma-Aldrich) and HPFs from healthy adults (a kind gift from Leonardo Salviati, University of Padova, Italy) were cultured at 37 °C in 7% CO2 in DMEM high glucose medium with Glutamax (Gibco) supplemented with 1 mM sodium pyruvate, penicillin-streptomycin, and 10% (for HeLa) or 20% (for HPFs) fetal bovine serum. The MDA-MB-436 cell line (ATCC No. HTB-130) was obtained from the American Type Culture Collection (ATCC). The breast cancer cell lines MCF-7 (ATCC No. HTB-22) and MDA-MB-231 (ATCC No. HTB-26) and the nontumorigenic epithelial cell line MCF 10A (ATCC No. CRL-10317) were kindly provided by Professor Jenny Persson (Department of Molecular Biology, Umeå University, Sweden). Cells were tested to confirm the absence of mycoplasma. Compounds were dissolved in DMSO to 10 (4f) or 20 mM (8g and 5b), aliquoted, and stored at −20 °C. Prior to the addition to cells, the compounds were dissolved in the culture medium at the final concentration required.
Cell Viability
Cell viability was measured using the PrestoBlue cell viability reagent (Invitrogen) according to the manufacturer’s recommendations. Briefly, 5000 (for HeLa), 4000 (for HPFs, MDA-MB-231, MCF-7, and MDA-MB-436), or 3500 (for MCF-10a) cells/well were seeded in complete medium on 96-well plates the day before the treatment. Compounds were dissolved in medium at the indicated concentrations and added to cells. At 48 h after treatment, 10 μL of PrestoBlue was added to each well and the cells were incubated at 37 °C for three additional hours. Fluorescence (excitation 560 nm, emission 590 nm, 10 nm bandwidth) was recorded using a Synergy H4 microplate reader (Biotek).
DNA Fiber Analysis for HeLa Cells
Asynchronous HeLa cells at 70% confluence were seeded at 1 × 10⁵ cells 18 h prior to the 24 h treatment with 10 μM 8g or 0.1% DMSO (control cells). Cells were pulse labeled with 25 μM iodo-deoxyuridine (IdU) in fresh medium containing 10 μM 8g or 0.1% DMSO for 30 min. Subsequently, cells were incubated for 30 min in fresh medium containing 200 μM chloro-deoxyuridine (CIdU) and 10 μM 8g or 0.1% DMSO followed by a 1 h incubation in fresh medium with 200 μM thymidine. Cells were then harvested and resuspended in cold PBS. DNA fiber stretching was performed as previously described.61 Briefly, stretched DNA fibers were immunostained with primary antibodies for IdU detection, for CIdU detection, and for ssDNA detection along with their respective Alexa Fluor antibodies. The antibodies used and their dilutions are shown in Table S5. Stained DNA fibers were visualized using an Axio Imager Z1 microscope (Zeiss), and images were captured randomly from different fields containing untangled fibers. Only fibers containing IdU labels flanked by CIdU labels with intact ssDNA ends were selected for analysis using the ZEN 2.3 (Zeiss) and ImageJ software packages.60 A minimum of 131 individual DNA fibers were measured for each experimental condition in two independent experiments. Measurements were made in micrometers and converted to kilobases using a conversion factor for the length of a labeled track of 1 μm corresponding to roughly 2 kb.62
Protein Extraction and Immunoblotting
For H2A.X and ATM analysis, HeLa cells were seeded on 10 cm dishes the day before treatment in order to have 80–90% confluency the day after. Cells were treated for 12 h at the indicated concentrations. Detergent-solubilized protein fractions (for ATM/pATM analysis) and nuclear histone-bound protein fractions (for H2A.X/γH2A.X analysis) were extracted as previously described.63 For STAT protein analysis, HeLa cells were seeded on 6-well plates the day before treatment in order to have 80–90% confluency the day after. Cells were treated for 12 h at the indicated concentrations and solubilized for 30 min on ice in RIPA buffer (150 mM NaCl, 1% NP-40, 0.1% SDS, 0.5% sodium deoxycholate, and 50 mM Tris-HCl (pH 8.0)). After high-speed centrifugation, the supernatant was collected for further analysis. Buffers for protein extraction were supplemented with 1× EDTA-free Halt protease inhibitor cocktail (ThermoFisher Scientific), 1 mM NaOV4, and 3 mM NaF. Protein amounts were quantified using a BCA protein assay kit (ThermoScientific). Equal amounts (15 μg) of protein were separated on 4–20% SDS-TGX (Bio-Rad) gels and transferred to 0.45 μM nitrocellulose membranes (GE Healthcare Life Sciences) using a Mini-Protean electrophoresis system (Bio-Rad). Membranes were blocked in 5% nonfat milk for 2 h. Primary antibodies were incubated overnight at 4 °C, and horseradish peroxidase-conjugated-secondary antibodies were incubated 1 h at room temperature. The antibodies used and their dilutions are shown in Table S5. All washes and incubations were performed in Tris-buffered saline with Tween 20. Chemiluminescent detection was performed using ECL Western blotting substrates (ThermoScientific) and a ChemiDoc Touch Imaging System (Bio-Rad). Signal quantification was performed using the ImageQuant TL software (GE Healthcare Life Sciences).
Apoptosis Assay
HeLa cells (120 000 cells/well) were seeded on 6-well plates the day before the treatment. Cells were treated for 12 h with 8g at the indicated concentrations, and the number of apoptotic cells was detected by flow cytometry using the FITC/Annexin V Dead Cell Apoptosis Kit (Molecular Probes) according to the manufacturer’s instructions. Stained cells were measured with a Cytomics FC500 (Beckman Coulter) equipped with a 488 nm argon laser. A total of 30 000 cells were collected for each sample. Propidium iodide emission was detected on the FL4 channel (675 nm), FITC emission was detected on the FL1 channel (525 nm), and the FL4 channel was manually compensated over the FL1 channel. Data were analyzed with the CXP Analysis software (Beckman Coulter). The analysis was performed on ungated cells, quadrants were determined on the untreated sample, and the same parameters were used for analyzing all samples.
BG4 Immunostaining
BG4 immunostaining was performed using a protocol modified from ref (25). Briefly, 60 000 cells were seeded on 13 mm glass coverslips the day before treatment. After treatment with the compounds, the cells were fixed in 2% paraformaldehyde and permeabilized in 0.1% Triton X-100 at room temperature. Cells were blocked in 2% nonfat milk followed by incubation with BG4-FLAG, anti-FLAG, and Alexa Fluor-conjugated antibodies. Each incubation was for 1 h at 37 °C in a humidified chamber. The antibodies used and their dilutions are shown in Table S5. All washes and incubations were performed in 1× PBS buffer. Cell nuclei were stained with 0.2 μg/mL diamidino-2-phenylindole (DAPI) solution prior to mounting the coverslips on glass slides with DAKO mounting medium (Agilent Technologies). Cells were imaged with a Zeiss AxioImager Z1 equipped with an Apotome and a 63× oil objective (NA 1.40) using identical acquisition settings. Cell nuclei were focused on the DAPI channel, and BG4-positive foci were counted in a semiautomatic mode using a customized Cell Profiler (Broad Institute) pipeline. All images were processed using ImageJ software.
In Vivo Cell Microscopy
Around 100 000 cells were seeded the day before treatment on glass-bottomed microwell dishes (MaTek Corp.). The cells were treated with 50 μM 8g for the indicated time points, then washed with 1× PBS, and resuspended in complete DMEM medium without phenol red and supplemented with 25 mM Hepes. Fluorescence was imaged within 20 min from the end of compound treatment with a Scientifica 2P galvo microscope equipped with a Spectra Physics Mai Tai DeepSee Ti:sapphire laser. Acquisition was made with a 20× water immersion objective designed for 2-photon applications (Olympus XLUMPLFN 20XW, NA = 1). Fluorescence was detected with two GaAsP PMTs from Hamamatsu (emission filter green 525 nm/50, red 585 nm/40). The voltage was kept at 700 V. For CLSM, HeLa cells were treated with 20 μM 8g for 30 min in DMEM medium. After 30 min, DMEM medium was replaced by DMEM medium without phenol red and cells were imaged by the confocal microscope Leica SP8 FALCON using a HC PL APO 63× /1.40 water CS2 objective and Diode 405 nm laser with 4% power to avoid autofluorescence of cells. Emission was recorded between 520 and 620 nm by hybrid detector (HyD). Maximum intensity projection of Z-stack images was used for visualization, and final images were processed using Fiji (ImageJ) software. Fluorescence signal in treated and untreated images was enhanced for visualization purpose only. For quantification, regions of interest were selected in cell cytoplasm and nucleoli, and the average fluorescence signal from the selected areas was used.
ICB Assay
About 60 000 HeLa cells were seeded on 13 mm glass coverslips the day before treatment. Cells were treated for 12 h with 50 μM 4f, and the ICB assay was performed as previously described.64 Images were processed by ImageJ Software using the gray scale and invert functions, and cell nuclei and ICBs were counted.
Caco-2 Cell Permeability Assay
Caco-2 cell monolayers (passage 94–105) were grown on permeable filter supports and used for the transport study on day 21 after seeding. Prior to the experiment, a drug solution of 10 μM was prepared and warmed to 37 °C. The Caco-2 filters were washed with prewarmed HBSS prior to the experiment, and the experiment was started by applying the donor solution to the apical or basolateral side. The transport experiments were carried out at pH 7.4 in both the apical and the basolateral chambers. The experiments were performed at 37 °C and with a stirring rate of 500 rpm. The receiver compartment was sampled at 15, 30, and 60 min, and at 60 min a final sample was also taken from the donor chamber in order to calculate the mass balance of the compound. The samples (100 μL) were transferred to a 96-well plate containing 100 μL of methanol and warfarin as IS and were sealed until LC-MS/MS analysis.65
Acknowledgments
This work was supported by the Knut and Alice Wallenberg Foundation (to N.S., S.W., and D.Ö.), the Swedish Society for Medical Research (to N.S.), the Swedish Research Council (to D.Ö., E.C., N.S., and S.W.), the Medical Faculty of Umeå University (to N.S.), the Wenner-Gren Foundation (to S.W., E.C., and M.Do.), the Kempe Foundations (to E.C., grant SMK-1632), the Åke Wiberg Foundation (to E.C.), the Swedish Cancer Society (to N.S. and D.Ö.), the HORIZON 2020-MSC Individual fellowship (to M.Do., grant agreement No 751474), JSPS Overseas Research Fellowships (to K.K), and MIMS Excellence by Choice Postdoctoral Programme (to M.De.). D.Ö. was also supported by the Swedish Society of Medicine (SLS-786661), federal funds through the county council of Västerbotten (VLL-643451, VLL-832001), the Cancer Research Foundation in Northern Sweden (LP 18-2202), the Swedish Foundation for International Cooperation in Research and Higher Education (PT2015-6432), and The Sjöberg Foundation. We thank the Kapoor lab at Rockefeller University for providing the multidrug-resistant S. pombe strain, Susan Forsburg and Sarah Sabatinos for providing the parental strains for DNA fiber analysis, Leonardo Salviati (Padova University, Italy) for providing HPF cells, Jenny Persson (Umeå University) for providing the breast cell lines, Chiara Frasson (Padova University, Italy) for advice on cytofluorimetry, Igor Iashchishyn (Umeå University) and Lenka Kuglerova (SLU) for advice on statistical analysis, Gorazd Stojkovic (Umeå University) for help with sequencing gels, and the SciLifeLab Drug Discovery and Development Platform ADME of the Therapeutics Facility, Department of Pharmacy, Uppsala University. We also thank Irene Martinez Carrasco, Naga Venkata Gayathri Vegesna, the Knut and Alice Wallenberg foundation program “NMR for Life” for NMR spectroscopy support, and the Biochemical Imaging Center at Umeå University and the National Microscopy Infrastructure (VR-RFI 2016-00968) for providing support and assistance in microscopy. The MD simulations were performed on resources provided by the Swedish National Infrastructure for Computing (SNIC) at HPC2N Umeå, Sweden.
Supporting Information Available
The Supporting Information is available free of charge at https://pubs.acs.org/doi/10.1021/jacs.9b11232.
Supporting figures and tables; compound synthesis (PDF)
Author Contributions
§ J.J., M.D., and K.C.: These authors contributed equally.
The authors declare no competing financial interest.
Supplementary Material
References
- Gorodetska I.; Kozeretska I.; Dubrovska A. BRCA Genes: The Role in Genome Stability, Cancer Stemness and Therapy Resistance. J. Cancer 2019, 10 (9), 2109–2127. 10.7150/jca.30410. [DOI] [PMC free article] [PubMed] [Google Scholar]
- Holohan C.; Van Schaeybroeck S.; Longley D. B.; Johnston P. G. Cancer drug resistance: an evolving paradigm. Nat. Rev. Cancer 2013, 13 (10), 714–26. 10.1038/nrc3599. [DOI] [PubMed] [Google Scholar]
- Chambers V. S.; Marsico G.; Boutell J. M.; Di Antonio M.; Smith G. P.; Balasubramanian S. High-throughput sequencing of DNA G-quadruplex structures in the human genome. Nat. Biotechnol. 2015, 33 (8), 877–81. 10.1038/nbt.3295. [DOI] [PubMed] [Google Scholar]
- Eddy J.; Maizels N. Gene function correlates with potential for G4 DNA formation in the human genome. Nucleic Acids Res. 2006, 34 (14), 3887–3896. 10.1093/nar/gkl529. [DOI] [PMC free article] [PubMed] [Google Scholar]
- Huppert J. L.; Balasubramanian S. G-quadruplexes in promoters throughout the human genome. Nucleic Acids Res. 2007, 35 (2), 406–413. 10.1093/nar/gkl1057. [DOI] [PMC free article] [PubMed] [Google Scholar]
- Shay J. W.; Bacchetti S. A survey of telomerase activity in human cancer. Eur. J. Cancer 1997, 33 (5), 787–791. 10.1016/S0959-8049(97)00062-2. [DOI] [PubMed] [Google Scholar]
- Fouquerel E.; Parikh D.; Opresko P. DNA damage processing at telomeres: The ends justify the means. DNA Repair 2016, 44, 159–168. 10.1016/j.dnarep.2016.05.022. [DOI] [PMC free article] [PubMed] [Google Scholar]
- Biffi G.; Tannahill D.; Miller J.; Howat W. J.; Balasubramanian S. Elevated Levels of G-Quadruplex Formation in Human Stomach and Liver Cancer Tissues. PLoS One 2014, 9 (7), e102711. 10.1371/journal.pone.0102711. [DOI] [PMC free article] [PubMed] [Google Scholar]
- Xu H.; Di Antonio M.; McKinney S.; Mathew V.; Ho B.; O’Neil N. J.; Santos N. D.; Silvester J.; Wei V.; Garcia J.; Kabeer F.; Lai D.; Soriano P.; Banath J.; Chiu D. S.; Yap D.; Le D. D.; Ye F. B.; Zhang A.; Thu K.; Soong J.; Lin S. C.; Tsai A. H.; Osako T.; Algara T.; Saunders D. N.; Wong J.; Xian J.; Bally M. B.; Brenton J. D.; Brown G. W.; Shah S. P.; Cescon D.; Mak T. W.; Caldas C.; Stirling P. C.; Hieter P.; Balasubramanian S.; Aparicio S. CX-5461 is a DNA G-quadruplex stabilizer with selective lethality in BRCA1/2 deficient tumours. Nat. Commun. 2017, 8, 14432. 10.1038/ncomms14432. [DOI] [PMC free article] [PubMed] [Google Scholar]
- Drygin D.; Siddiqui-Jain A.; O’Brien S.; Schwaebe M.; Lin A.; Bliesath J.; Ho C. B.; Proffitt C.; Trent K.; Whitten J. P.; Lim J. K.; Von Hoff D.; Anderes K.; Rice W. G. Anticancer activity of CX-3543: a direct inhibitor of rRNA biogenesis. Cancer Res. 2009, 69 (19), 7653–61. 10.1158/0008-5472.CAN-09-1304. [DOI] [PubMed] [Google Scholar]
- Al Zaid Siddiquee K.; Turkson J. STAT3 as a target for inducing apoptosis in solid and hematological tumors. Cell Res. 2008, 18 (2), 254–67. 10.1038/cr.2008.18. [DOI] [PMC free article] [PubMed] [Google Scholar]
- Sansone P.; Bromberg J. Targeting the interleukin-6/Jak/stat pathway in human malignancies. J. Clin. Oncol. 2012, 30 (9), 1005–14. 10.1200/JCO.2010.31.8907. [DOI] [PMC free article] [PubMed] [Google Scholar]
- Yu H.; Lee H.; Herrmann A.; Buettner R.; Jove R. Revisiting STAT3 signalling in cancer: new and unexpected biological functions. Nat. Rev. Cancer 2014, 14 (11), 736–46. 10.1038/nrc3818. [DOI] [PubMed] [Google Scholar]
- Wong A. L. A.; Hirpara J. L.; Pervaiz S.; Eu J. Q.; Sethi G.; Goh B. C. Do STAT3 inhibitors have potential in the future for cancer therapy?. Expert Opin. Invest. Drugs 2017, 26 (8), 883–887. 10.1080/13543784.2017.1351941. [DOI] [PubMed] [Google Scholar]
- Fagard R.; Metelev V.; Souissi I.; Baran-Marszak F. STAT3 inhibitors for cancer therapy: Have all roads been explored?. JAK-STAT 2013, 2 (1), e22882. 10.4161/jkst.22882. [DOI] [PMC free article] [PubMed] [Google Scholar]
- Jamroskovic J.; Livendahl M.; Eriksson J.; Chorell E.; Sabouri N. Identification of Compounds that Selectively Stabilize Specific G-Quadruplex Structures by Using a Thioflavin T-Displacement Assay as a Tool. Chem. - Eur. J. 2016, 22 (52), 18932–18943. 10.1002/chem.201603463. [DOI] [PubMed] [Google Scholar]
- LaPorte M. G.; da Paz Lima D. J.; Zhang F.; Sen M.; Grandis J. R.; Camarco D.; Hua Y.; Johnston P. A.; Lazo J. S.; Resnick L. O.; Wipf P.; Huryn D. M. 2-Guanidinoquinazolines as new inhibitors of the STAT3 pathway. Bioorg. Med. Chem. Lett. 2014, 24 (21), 5081–5. 10.1016/j.bmcl.2014.09.001. [DOI] [PMC free article] [PubMed] [Google Scholar]
- Han H.; Hurley L. H.; Salazar M. A DNA polymerase stop assay for G-quadruplex-interactive compounds. Nucleic Acids Res. 1999, 27 (2), 537–42. 10.1093/nar/27.2.537. [DOI] [PMC free article] [PubMed] [Google Scholar]
- Chung W. J.; Heddi B.; Hamon F.; Teulade-Fichou M. P.; Phan A. T. Solution structure of a G-quadruplex bound to the bisquinolinium compound Phen-DC(3). Angew. Chem., Int. Ed. 2014, 53 (4), 999–1002. 10.1002/anie.201308063. [DOI] [PubMed] [Google Scholar]
- Doria F.; Nadai M.; Zuffo M.; Perrone R.; Freccero M.; Richter S. N. A red-NIR fluorescent dye detecting nuclear DNA G-quadruplexes: in vitro analysis and cell imaging. Chem. Commun. 2017, 53 (14), 2268–2271. 10.1039/C6CC08492C. [DOI] [PMC free article] [PubMed] [Google Scholar]
- Lubitz I.; Zikich D.; Kotlyar A. Specific high-affinity binding of thiazole orange to triplex and G-quadruplex DNA. Biochemistry 2010, 49 (17), 3567–74. 10.1021/bi1000849. [DOI] [PubMed] [Google Scholar]
- Lefebvre J.; Guetta C.; Poyer F.; Mahuteau-Betzer F.; Teulade-Fichou M. P. Copper-Alkyne Complexation Responsible for the Nucleolar Localization of Quadruplex Nucleic Acid Drugs Labeled by Click Reactions. Angew. Chem., Int. Ed. 2017, 56 (38), 11365–11369. 10.1002/anie.201703783. [DOI] [PubMed] [Google Scholar]
- Domarco O.; Kieler C.; Pirker C.; Dinhof C.; Englinger B.; Reisecker J. M.; Timelthaler G.; Garcia M. D.; Peinador C.; Keppler B. K.; Berger W.; Terenzi A. Subcellular Duplex DNA and G-Quadruplex Interaction Profiling of a Hexagonal Pt(II) Metallacycle. Angew. Chem., Int. Ed. 2019, 58 (24), 8007–8012. 10.1002/anie.201900934. [DOI] [PMC free article] [PubMed] [Google Scholar]
- Deiana M.; Chand K.; Jamroskovic J.; Obi I.; Chorell E.; Sabouri N. A Light-up Logic Platform for Selective Recognition of Parallel G-Quadruplex Structures via Disaggregation-Induced Emission. Angew. Chem., Int. Ed. 2020, 59 (2), 896–902. 10.1002/anie.201912027. [DOI] [PubMed] [Google Scholar]
- Biffi G.; Tannahill D.; McCafferty J.; Balasubramanian S. Quantitative visualization of DNA G-quadruplex structures in human cells. Nat. Chem. 2013, 5 (3), 182–6. 10.1038/nchem.1548. [DOI] [PMC free article] [PubMed] [Google Scholar]
- Kuo L. J.; Yang L. X. Gamma-H2AX - a novel biomarker for DNA double-strand breaks. In Vivo 2008, 22 (3), 305–309. [PubMed] [Google Scholar]
- Burma S.; Chen B. P.; Murphy M.; Kurimasa A.; Chen D. J. ATM phosphorylates histone H2AX in response to DNA double-strand breaks. J. Biol. Chem. 2001, 276 (45), 42462–7. 10.1074/jbc.C100466200. [DOI] [PubMed] [Google Scholar]
- Collis S. J.; Schwaninger J. M.; Ntambi A. J.; Keller T. W.; Nelson W. G.; Dillehay L. E.; Deweese T. L. Evasion of early cellular response mechanisms following low level radiation-induced DNA damage. J. Biol. Chem. 2004, 279 (48), 49624–32. 10.1074/jbc.M409600200. [DOI] [PubMed] [Google Scholar]
- Veldman T.; Etheridge K. T.; Counter C. M. Loss of hPot1 function leads to telomere instability and a cut-like phenotype. Curr. Biol. 2004, 14 (24), 2264–70. 10.1016/j.cub.2004.12.031. [DOI] [PubMed] [Google Scholar]
- Elstrodt F.; Hollestelle A.; Nagel J. H.; Gorin M.; Wasielewski M.; van den Ouweland A.; Merajver S. D.; Ethier S. P.; Schutte M. BRCA1 mutation analysis of 41 human breast cancer cell lines reveals three new deleterious mutants. Cancer Res. 2006, 66 (1), 41–5. 10.1158/0008-5472.CAN-05-2853. [DOI] [PubMed] [Google Scholar]
- Narimatsu M.; Maeda H.; Itoh S.; Atsumi T.; Ohtani T.; Nishida K.; Itoh M.; Kamimura D.; Park S. J.; Mizuno K.; Miyazaki J.; Hibi M.; Ishihara K.; Nakajima K.; Hirano T. Tissue-specific autoregulation of the stat3 gene and its role in interleukin-6-induced survival signals in T cells. Mol. Cell. Biol. 2001, 21 (19), 6615–25. 10.1128/MCB.21.19.6615-6625.2001. [DOI] [PMC free article] [PubMed] [Google Scholar]
- Avalle L.; Pensa S.; Regis G.; Novelli F.; Poli V. STAT1 and STAT3 in tumorigenesis: A matter of balance. JAK-STAT 2012, 1 (2), 65–72. 10.4161/jkst.20045. [DOI] [PMC free article] [PubMed] [Google Scholar]
- Szelag M.; Czerwoniec A.; Wesoly J.; Bluyssen H. A. Identification of STAT1 and STAT3 specific inhibitors using comparative virtual screening and docking validation. PLoS One 2015, 10 (2), e0116688. 10.1371/journal.pone.0116688. [DOI] [PMC free article] [PubMed] [Google Scholar]
- Miller W. T. Tyrosine kinase signaling and the emergence of multicellularity. Biochim. Biophys. Acta, Mol. Cell Res. 2012, 1823 (6), 1053–7. 10.1016/j.bbamcr.2012.03.009. [DOI] [PMC free article] [PubMed] [Google Scholar]
- Tong K.; Wang Y.; Su Z. Phosphotyrosine signalling and the origin of animal multicellularity. Proc. R. Soc. London, Ser. B 2017, 284 (1860), 20170681. 10.1098/rspb.2017.0681. [DOI] [PMC free article] [PubMed] [Google Scholar]
- Wallgren M.; Mohammad J. B.; Yan K. P.; Pourbozorgi-Langroudi P.; Ebrahimi M.; Sabouri N. G-rich telomeric and ribosomal DNA sequences from the fission yeast genome form stable G-quadruplex DNA structures in vitro and are unwound by the Pfh1 DNA helicase. Nucleic Acids Res. 2016, 44 (13), 6213–31. 10.1093/nar/gkw349. [DOI] [PMC free article] [PubMed] [Google Scholar]
- Sabouri N.; Capra J. A.; Zakian V. A. The essential Schizosaccharomyces pombe Pfh1 DNA helicase promotes fork movement past G-quadruplex motifs to prevent DNA damage. BMC Biol. 2014, 12 (1), 101. 10.1186/s12915-014-0101-5. [DOI] [PMC free article] [PubMed] [Google Scholar]
- McDonald K. R.; Guise A. J.; Pourbozorgi-Langroudi P.; Cristea I. M.; Zakian V. A.; Capra J. A.; Sabouri N. Pfh1 Is an Accessory Replicative Helicase that Interacts with the Replisome to Facilitate Fork Progression and Preserve Genome Integrity. PLoS Genet. 2016, 12 (9), e1006238. 10.1371/journal.pgen.1006238. [DOI] [PMC free article] [PubMed] [Google Scholar]
- Kawashima S. A.; Takemoto A.; Nurse P.; Kapoor T. M. Analyzing Fission Yeast Multidrug Resistance Mechanisms to Develop a Genetically Tractable Model System for Chemical Biology. Chem. Biol. 2012, 19 (7), 893–901. 10.1016/j.chembiol.2012.06.008. [DOI] [PMC free article] [PubMed] [Google Scholar]
- Arita Y.; Nishimura S.; Matsuyama A.; Yashiroda Y.; Usui T.; Boone C.; Yoshida M. Microarray-based target identification using drug hypersensitive fission yeast expressing ORFeome. Mol. BioSyst. 2011, 7 (5), 1463–72. 10.1039/c0mb00326c. [DOI] [PubMed] [Google Scholar]
- Cimino-Reale G.; Zaffaroni N.; Folini M. Emerging Role of G-quadruplex DNA as Target in Anticancer Therapy. Curr. Pharm. Des. 2017, 22 (44), 6612–6624. 10.2174/1381612822666160831101031. [DOI] [PubMed] [Google Scholar]
- Oh D. Y.; Lee S. H.; Han S. W.; Kim M. J.; Kim T. M.; Kim T. Y.; Heo D. S.; Yuasa M.; Yanagihara Y.; Bang Y. J. Phase I Study of OPB-31121, an Oral STAT3 Inhibitor, in Patients with Advanced Solid Tumors. Cancer Res. Treat. 2015, 47 (4), 607–15. 10.4143/crt.2014.249. [DOI] [PMC free article] [PubMed] [Google Scholar]
- Hong D.; Kurzrock R.; Kim Y.; Woessner R.; Younes A.; Nemunaitis J.; Fowler N.; Zhou T.; Schmidt J.; Jo M.; Lee S. J.; Yamashita M.; Hughes S. G.; Fayad L.; Piha-Paul S.; Nadella M. V.; Mohseni M.; Lawson D.; Reimer C.; Blakey D. C.; Xiao X.; Hsu J.; Revenko A.; Monia B. P.; MacLeod A. R. AZD9150, a next-generation antisense oligonucleotide inhibitor of STAT3 with early evidence of clinical activity in lymphoma and lung cancer. Sci. Transl. Med. 2015, 7 (314), 314ra185. 10.1126/scitranslmed.aac5272. [DOI] [PMC free article] [PubMed] [Google Scholar]
- Yoo C.; Kang J.; Lim H. Y.; Kim J. H.; Lee M. A.; Lee K. H.; Kim T. Y.; Ryoo B. Y. Phase I Dose-Finding Study of OPB-111077, a Novel STAT3 Inhibitor, in Patients with Advanced Hepatocellular Carcinoma. Cancer Res. Treat. 2019, 51 (2), 510–518. 10.4143/crt.2018.226. [DOI] [PMC free article] [PubMed] [Google Scholar]
- O’Boyle N. M.; Banck M.; James C. A.; Morley C.; Vandermeersch T.; Hutchison G. R. Open Babel: An open chemical toolbox. J. Cheminf. 2011, 3, 33. 10.1186/1758-2946-3-33. [DOI] [PMC free article] [PubMed] [Google Scholar]
- Hanwell M. D.; Curtis D. E.; Lonie D. C.; Vandermeersch T.; Zurek E.; Hutchison G. R. Avogadro: an advanced semantic chemical editor, visualization, and analysis platform. J. Cheminf. 2012, 4 (1), 17. 10.1186/1758-2946-4-17. [DOI] [PMC free article] [PubMed] [Google Scholar]
- Pettersen E. F.; Goddard T. D.; Huang C. C.; Couch G. S.; Greenblatt D. M.; Meng E. C.; Ferrin T. E. UCSF Chimera--a visualization system for exploratory research and analysis. J. Comput. Chem. 2004, 25 (13), 1605–12. 10.1002/jcc.20084. [DOI] [PubMed] [Google Scholar]
- Abraham M. J.; Murtola T.; Schulz R.; Páll S.; Smith J. C.; Hess B.; Lindahl E. GROMACS: High performance molecular simulations through multi-level parallelism from laptops to supercomputers. SoftwareX 2015, 1–2, 19–25. 10.1016/j.softx.2015.06.001. [DOI] [Google Scholar]
- Hornak V.; Abel R.; Okur A.; Strockbine B.; Roitberg A.; Simmerling C. Comparison of multiple Amber force fields and development of improved protein backbone parameters. Proteins: Struct., Funct., Genet. 2006, 65 (3), 712–25. 10.1002/prot.21123. [DOI] [PMC free article] [PubMed] [Google Scholar]
- Ivani I.; Dans P. D.; Noy A.; Perez A.; Faustino I.; Hospital A.; Walther J.; Andrio P.; Goni R.; Balaceanu A.; Portella G.; Battistini F.; Gelpi J. L.; Gonzalez C.; Vendruscolo M.; Laughton C. A.; Harris S. A.; Case D. A.; Orozco M. Parmbsc1: a refined force field for DNA simulations. Nat. Methods 2016, 13 (1), 55–8. 10.1038/nmeth.3658. [DOI] [PMC free article] [PubMed] [Google Scholar]
- Jorgensen W. L.; Chandrasekhar J.; Madura J. D.; Impey R. W.; Klein M. L. Comparison of simple potential functions for simulating liquid water. J. Chem. Phys. 1983, 79 (2), 926–935. 10.1063/1.445869. [DOI] [Google Scholar]
- Wang J.; Wolf R. M.; Caldwell J. W.; Kollman P. A.; Case D. A. Development and testing of a general amber force field. J. Comput. Chem. 2004, 25 (9), 1157–74. 10.1002/jcc.20035. [DOI] [PubMed] [Google Scholar]
- Bayly C. I.; Cieplak P.; Cornell W.; Kollman P. A. A well-behaved electrostatic potential based method using charge restraints for deriving atomic charges: the RESP model. J. Phys. Chem. 1993, 97 (40), 10269–10280. 10.1021/j100142a004. [DOI] [Google Scholar]
- Case D.A.; Cerutti D. S.; Cheatham T. E. III; Darden T. A.; Duke R. E.; Giese T. J.; Gohlke H.; Goetz A. W.; Greene D.; Homeyer N.; Izadi S.; Kovalenko A.; Lee T. S.; LeGrand T.; Li P.; Lin C.; Liu J.; Luchko T.; Luo R.; Mermelstein D.; Merz K. M.; Monard G.; Nguyen H.; Omelyan I.; Onufriev A.; Pan F.; Qi R.; Roe D. R.; Roitberg A.; Sagui C.; Simmerling C. L.; Botello-Smith W. M.; Swails J.; Walker R. C.; Wang J.; Wolf R. M.; Wu X.; Xiao L.; York D. M.; Kollman P. A.. AMBER; University of California: San Francisco, CA, 2017. [Google Scholar]
- Frisch M. J.; Trucks G. W.; Schlegel H. B.; Scuseria G. E.; Robb M. A.; Cheeseman J. R.; Scalmani G.; Barone V.; Petersson G. A.; Nakatsuji H.; Li X.; Caricato M.; Marenich A. V.; Bloino J.; Janesko B. G.; Gomperts R.; Mennucci B.; Hratchian H. P.; Ortiz J. V.; Izmaylov A. F.; Sonnenberg J. L.; Williams; Ding F.; Lipparini F.; Egidi F.; Goings J.; Peng B.; Petrone A.; Henderson T.; Ranasinghe D.; Zakrzewski V. G.; Gao J.; Rega N.; Zheng G.; Liang W.; Hada M.; Ehara M.; Toyota K.; Fukuda R.; Hasegawa J.; Ishida M.; Nakajima T.; Honda Y.; Kitao O.; Nakai H.; Vreven T.; Throssell K.; Montgomery J. A. Jr.; Peralta J. E.; Ogliaro F.; Bearpark M. J.; Heyd J. J.; Brothers E. N.; Kudin K. N.; Staroverov V. N.; Keith T. A.; Kobayashi R.; Normand J.; Raghavachari K.; Rendell A. P.; Burant J. C.; Iyengar S. S.; Tomasi J.; Cossi M.; Millam J. M.; Klene M.; Adamo C.; Cammi R.; Ochterski J. W.; Martin R. L.; Morokuma K.; Farkas O.; Foresman J. B.; Fox D. J.. Gaussian 16, Gaussian: Wallingford, CT, 2016. [Google Scholar]
- Prasad B.; Jamroskovic J.; Bhowmik S.; Kumar R.; Romell T.; Sabouri N.; Chorell E. Flexible Versus Rigid G-Quadruplex DNA Ligands: Synthesis of Two Series of Bis-indole Derivatives and Comparison of Their Interactions with G-Quadruplex DNA. Chem. - Eur. J. 2018, 24 (31), 7926–7938. 10.1002/chem.201800078. [DOI] [PubMed] [Google Scholar]
- Kumari R.; Kumar R.; Lynn A. g_mmpbsa--a GROMACS tool for high-throughput MM-PBSA calculations. J. Chem. Inf. Model. 2014, 54 (7), 1951–62. 10.1021/ci500020m. [DOI] [PubMed] [Google Scholar]
- Baker N. A.; Sept D.; Joseph S.; Holst M. J.; McCammon J. A. Electrostatics of nanosystems: application to microtubules and the ribosome. Proc. Natl. Acad. Sci. U. S. A. 2001, 98 (18), 10037–41. 10.1073/pnas.181342398. [DOI] [PMC free article] [PubMed] [Google Scholar]
- Hess B. Determining the shear viscosity of model liquids from molecular dynamics simulations. J. Chem. Phys. 2002, 116 (1), 209–217. 10.1063/1.1421362. [DOI] [Google Scholar]
- Schneider C. A.; Rasband W. S.; Eliceiri K. W. NIH Image to ImageJ: 25 years of image analysis. Nat. Methods 2012, 9 (7), 671–5. 10.1038/nmeth.2089. [DOI] [PMC free article] [PubMed] [Google Scholar]
- Nieminuszczy J.; Schwab R. A.; Niedzwiedz W. The DNA fibre technique - tracking helicases at work. Methods 2016, 108, 92–8. 10.1016/j.ymeth.2016.04.019. [DOI] [PubMed] [Google Scholar]
- Bianco J. N.; Poli J.; Saksouk J.; Bacal J.; Silva M. J.; Yoshida K.; Lin Y. L.; Tourriere H.; Lengronne A.; Pasero P. Analysis of DNA replication profiles in budding yeast and mammalian cells using DNA combing. Methods 2012, 57 (2), 149–57. 10.1016/j.ymeth.2012.04.007. [DOI] [PubMed] [Google Scholar]
- Li Z.; Liu B.; Jin W.; Wu X.; Zhou M.; Liu V. Z.; Goel A.; Shen Z.; Zheng L.; Shen B. hDNA2 nuclease/helicase promotes centromeric DNA replication and genome stability. EMBO J. 2018, 37 (14), e96729. 10.15252/embj.201796729. [DOI] [PMC free article] [PubMed] [Google Scholar]
- Duxin J. P.; Dao B.; Martinsson P.; Rajala N.; Guittat L.; Campbell J. L.; Spelbrink J. N.; Stewart S. A. Human Dna2 is a nuclear and mitochondrial DNA maintenance protein. Mol. Cell. Biol. 2009, 29 (15), 4274–82. 10.1128/MCB.01834-08. [DOI] [PMC free article] [PubMed] [Google Scholar]
- Hubatsch I.; Ragnarsson E. G.; Artursson P. Determination of drug permeability and prediction of drug absorption in Caco-2 monolayers. Nat. Protoc. 2007, 2 (9), 2111–9. 10.1038/nprot.2007.303. [DOI] [PubMed] [Google Scholar]
Associated Data
This section collects any data citations, data availability statements, or supplementary materials included in this article.