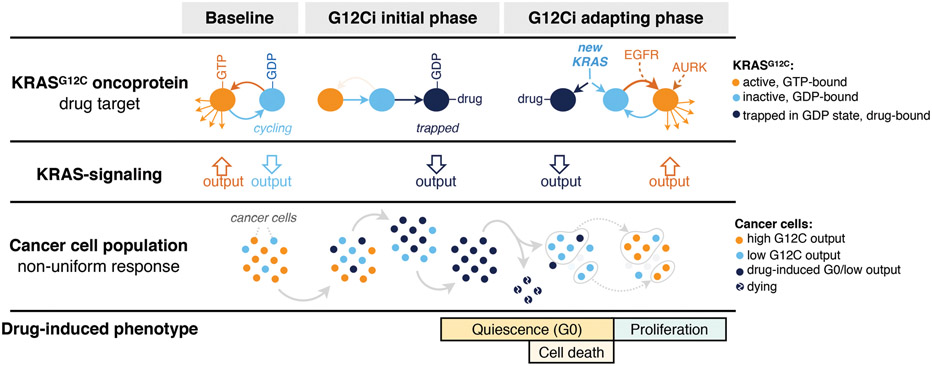
Abstract
KRAS GTPases are activated in one-third of cancers and KRASG12C is the most common activating alteration in lung adenocarcinoma1,2. KRASG12C inhibitors3,4 are in Phase-I clinical trials and early data show partial responses in ~50% of lung cancer patients. How cancer cells bypass inhibition, to prevent maximal response to therapy, is not understood. Because KRASG12C cycles between an active and inactive conformation4-6, and the inhibitors only bind to the latter, we tested if isogenic cell populations respond non-uniformly by studying the effect of treatment at single-cell resolution. Here we report that shortly after treatment, some cancer cells are sequestered in a quiescent state with low KRAS activity, while others bypass this effect to resume proliferation. This rapid divergent response occurs because some quiescent cells produce new KRASG12C in response to suppressed mitogen-activated protein kinase output. New KRASG12C is maintained in its active/drug-insensitive state by epidermal growth-factor receptor and aurora kinase signaling. Cells without these adaptive changes (or cells where they are pharmacologically inhibited) remain sensitive to drug treatment, because new KRASG12C is either not available, or it exists in its inactive/drug-sensitive state. Directly targeting KRASoncoproteins has been a longstanding objective in precision oncology. Our study uncovers a flexible non-uniform fitness mechanism that enables groups of cells within a population to rapidly bypass the effect of treatment. This adaptive process must be overcome if we are to achieve complete and durable responses in the clinic.
KRASG12C undergoes nucleotide cycling between its active (GTP-bound) and inactive (GDP-bound) states in cancer cells4,5,7. First-in-class mutant GTPase inhibitors target KRASG12C (G12Ci) in a conformation-specific manner: they bind only to the inactive state and trap the oncoprotein by preventing its re-activation by nucleotide-exchange3-5,8,9. Upon G12Ci-treatment, KRASG12C-mutant cells had an initial inhibition followed by a re-accumulation of active KRAS (i.e. KRAS-GTP) and its downstream signaling (Extended Data Fig. 1), a pattern that is consistent with adaptation10-12. The KRASG12C nucleotide cycle and the conformation-specific nature of inhibition led us to test if adaptation to G12Ci-treatment occurs in a non-uniform manner across cancer cells in a population (see Methods for rationale).
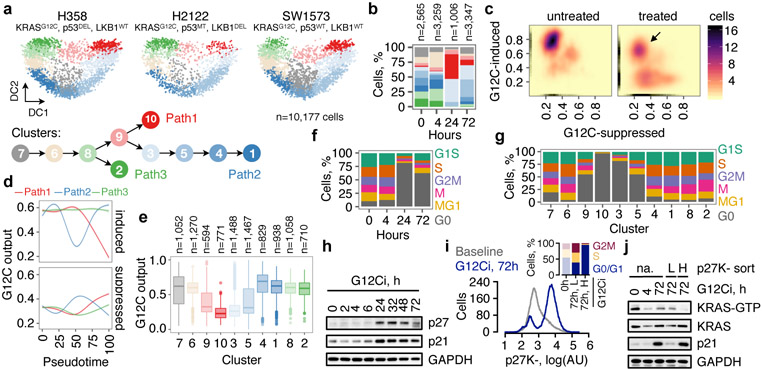
To this end, we performed single-cell RNA sequencing (scRNAseq)13,14 on three KRASG12C lung cancer models treated with the G12Ci for 0, 4, 24 and 72h (see Methods). After controlling for potentially confounding variables (Extended Data Fig. 2a-e) and reducing the dimensionality of the dataset with an algorithm15 that accounts for the zero-inflated nature of scRNAseq data (Extended Data Fig. 2f), cells were clustered and projected in a two-dimensional space, using either t-distributed stochastic neighbor embedding (tSNE) or diffusion component (DC) mapping (Extended Data Fig. 2g-j). Trajectory-inference analysis16,17 was used to order cells along a process (i.e. pseudotime) and identify cell fates in an unsupervised manner. This analysis revealed three trajectories (Fig. 1a: paths 1-3 and Extended Data Fig. 2k). Two of these represented a shift from an initial state (grey cluster) to a drug-induced state (path 1, red clusters/arrow) and then back (path 2, blue clusters/arrow). The distribution of clusters over treatment time (Fig. 1b) suggested that these are inhibited or adapting cell states.
Fig. 1. Divergent single-cell fates after conformation-specific KRASG12C inhibition.
a, Diffusion component (DC) analysis of single-cells from KRASG12C tumor models treated with a G12Ci for 0, 4, 24 and 72h. The arrows indicate inhibitory trajectories derived by the Slingshot algorithm. b, Cluster composition across treatment time. c, The distribution of KRASG12C-dependent transcriptional output score across single-cells. d, The trend in G12C output as a function of pseudotime was established by fitting a spline to single-cell data. The 95% confidence interval is shown (n=4,759, n=8,653 and n=4,050 in paths 1-3, respectively; where n denotes the number of cells). e, G12C output score across clusters. Median, upper- and lower- quartiles and outliers are shown. f, g, Cell cycle phase distribution over time (f) or across clusters (g). h, Extracts from drug-treated KRASG12C-mutant cells (H358) were analyzed to determine the expression of the indicated proteins. i, H358 cells expressing a quiescence biosensor based on a CDK-binding deficient p27 mutant (p27K-, mVenus), were analyzed by FACS. Inset: The cell cycle distribution of the indicated populations. j, Biosensor-expressing cells were treated, sorted and analyzed to determine the levels of active and total KRAS. A representative of three independent experiments is shown in h-j.
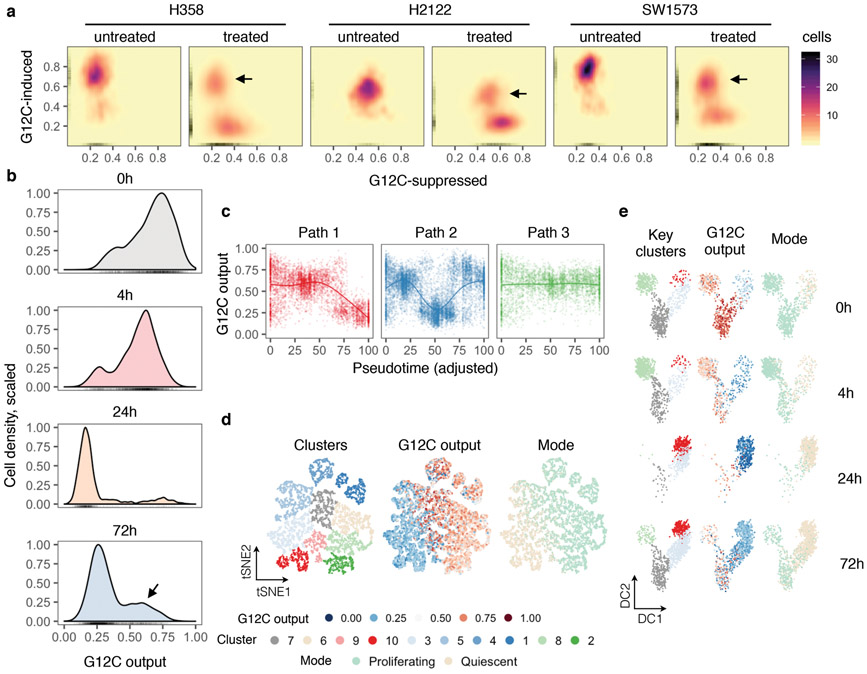
To test this, ~200 KRASG12C-dependent genes were used to derive a KRASG12C-specific transcriptional output score (see Methods), which was used as an indicator of KRAS-signaling across single-cells. At baseline, most cells had high output, evidenced by their high G12C-induced and low G12C-suppressed scores (Fig. 1c and Extended Data Fig. 3a, b). G12Ci-treatment sequestered most cells in a state with low output. Some drug-treated cells had high output (arrow), indicating diverging responses across the population. The change in output score revealed different fates along the trajectories (Fig. 1d, e and Extended Data Fig. 3c-e): cells in path 1 had inhibited output and cells in path 2 had an initial inhibition followed by reactivation.
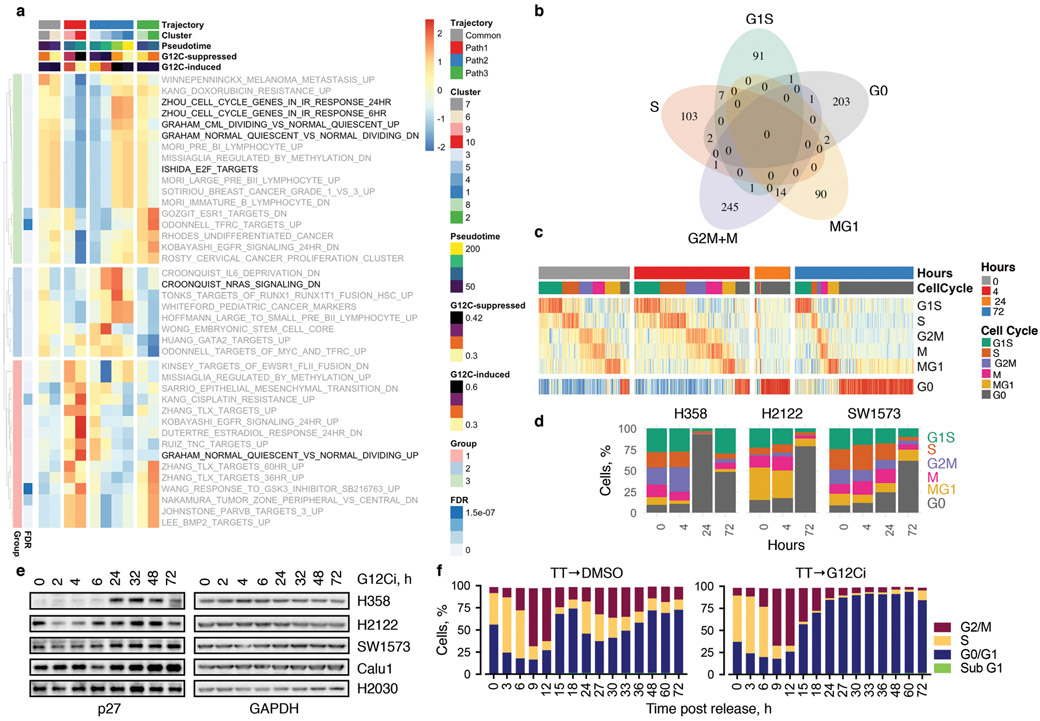
The trajectories correlated with changes in cell cycle-specific expression signatures (Extended Data Fig. 4a). By classifying cells along the cell cycle, we found that G12Ci-treatment induced a quiescent state (G0) that was transcriptionally-distinct from G1 (Fig. 1f and Extended Data Fig. 4b-d). This induction mirrored the inhibition of KRASG12C-output along the trajectories (Fig. 1g). G12Ci-treatment also induced p21 and p27 protein levels (Fig. 1h and Extended Data Fig. 4e), two markers of quiescence18. In agreement, cell cycle analysis of double-thymidine-synchronized cells, showed that the G12Ci arrests cells in a G0/G1 state (Extended Data Fig. 4f).
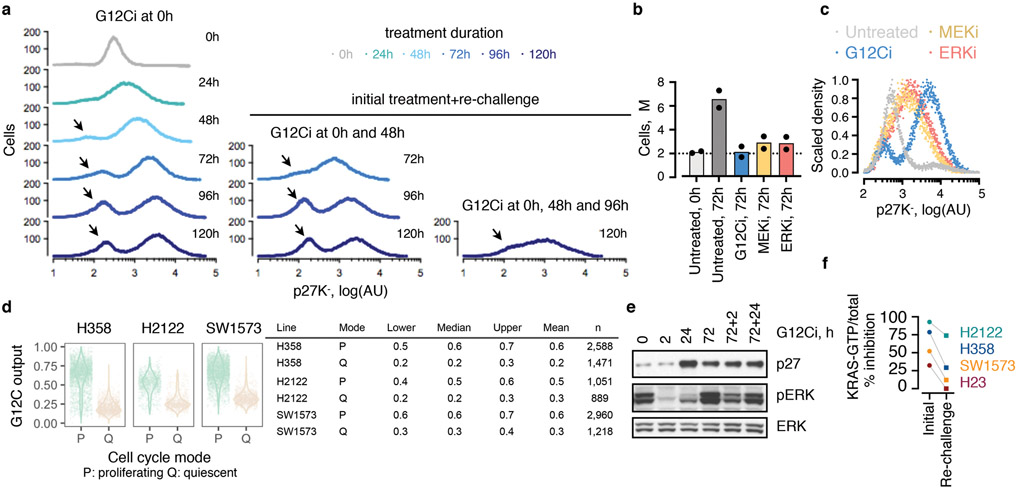
A quiescence biosensor19, based on a cyclin-dependent kinase (CDK) binding-defective p27-mutant (p27K-), was used to monitor the subpopulations and to validate the results of the scRNAseq analysis (Fig. 1i and Extended Data Fig. 5a). As predicted, G12Ci-treatment led to a bimodal cell distribution comprising of a subpopulation of quiescent cells with high p27K- (~80%) and a subpopulation of rapidly-adapting cells with low p27K- (~20%). This differed from the effect of inhibitors targeting MEK or ERK, two kinases downstream of KRASG12C (Extended Data Fig. 5b, c). Although exposed to G12Ci-treatment for the same duration, p27K-low cells had higher active KRAS, compared to p27K-high cells (Fig. 1j and Extended Data Fig. 5d) and were able to progress past the G1 restriction-point (Fig. 1i: inset). Re-challenge with the G12Ci attenuated the adapting response to some degree, but it could not eliminate this population (Extended Data Fig. 5a, e). Also, the inhibition of KRAS-GTP levels by the G12Ci during re-challenge was less than its initial effect (Extended Data Fig. 5f).
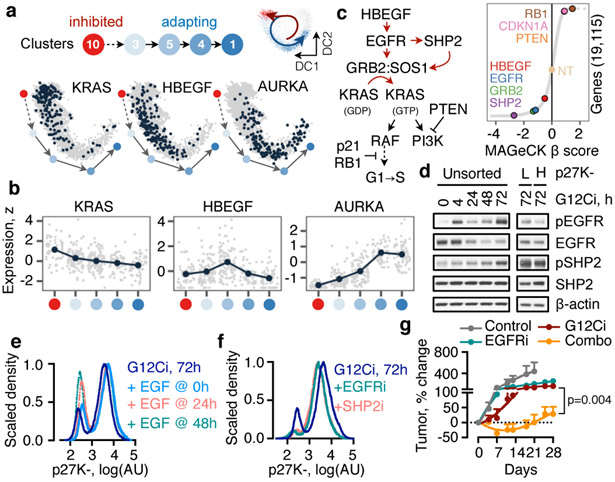
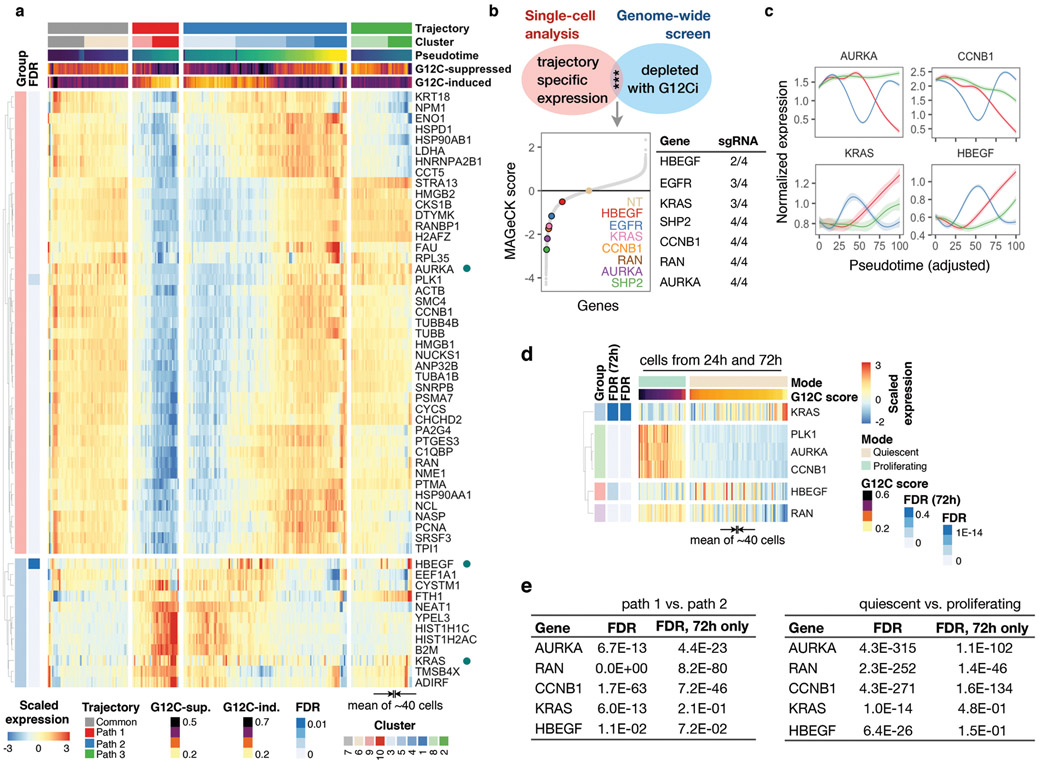
To identify adaptive signals responsible for the divergent response to G12Ci-treatment, we used two orthogonal approaches (see Methods). A differential expression analysis, contrasting single-cells from the inhibited and adapting trajectories, revealed many transcripts with trajectory-specific expression (Extended Data Fig. 6a). A genome-wide knockout-screen identified single-guide RNA (sgRNA) targets that enhanced the effect of G12Ci-treatment (Extended Data Fig. 6b). After integrating the results from both approaches, we focused on genes with subpopulation-specific expression that were also functionally related to proliferation (Fig. 2a, b and Extended Data Fig. 6c-e). Of these, heparin-binding epidermal growth-factor (HBEGF), aurora kinase A (AURKA) and KRAS, were studied in more detail.
Fig. 2. Adaptation to G12Ci-treatment is dependent on EGFR signaling.
a, b, The peak (a) or mean (b) expression of genes with trajectory-specific expression. a, Cells from the indicated clusters were projected in their DC coordinates. Cells with peak expression in the indicated genes are shown in navy. b, Cells were grouped by cluster, ordered in pseudotime and the mean expression was calculated for pools of 15 cells (gray) or the entire cluster (navy). c, A genome-wide CRISPR/Cas9 screen in H358 cells identified EGFR signaling intermediates as potential regulators of G12Ci-treatment. NT: non-targeting sgRNAs. d, Immunoblots of extracts from G12Ci-treated and FACS-sorted H358/p27K- cells. e, f, The cells were treated with the G12Ci for 72h alone or in the presence of EGF stimulation at the indicated times (e) or in the presence of the indicated EGFR signaling inhibitors (f). g, H2122 xenograft-bearing mice were treated as shown to determine the effect on tumor growth (mean + s.e.m, n=4). A two-sided t-test p value is shown. A representative of two independent experiments is shown in d-f.
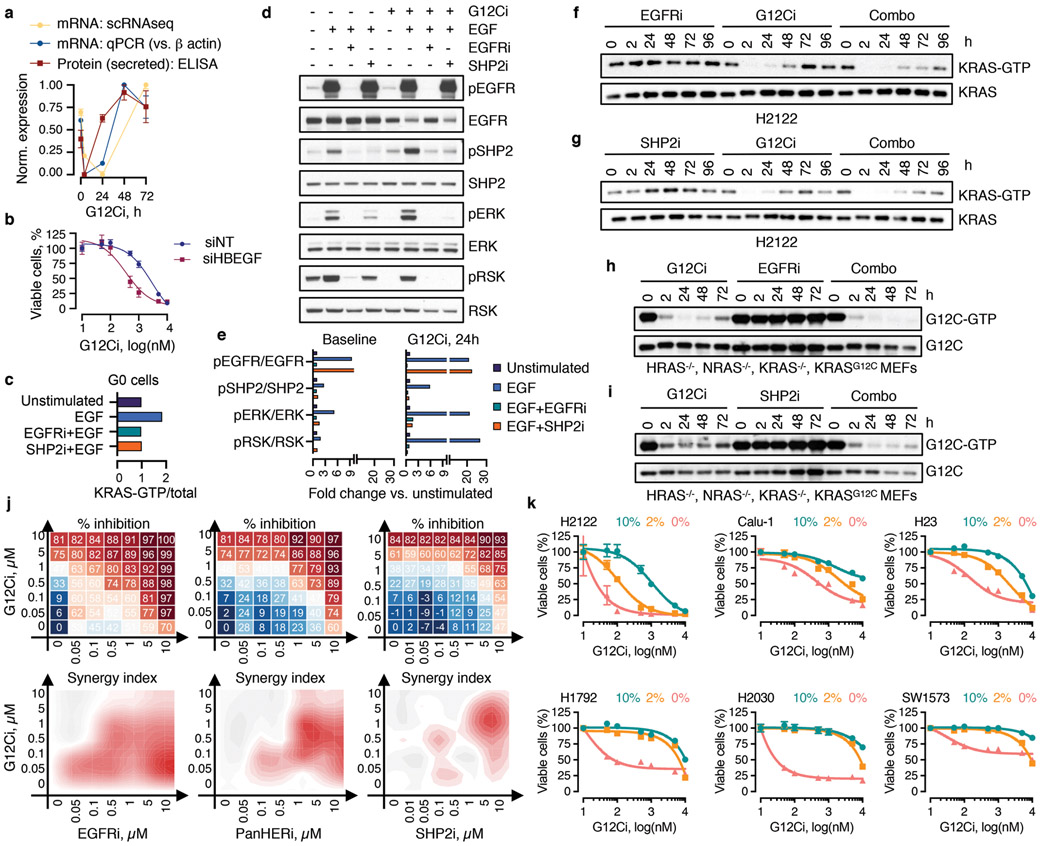
The expression of HBEGF mRNA, which encodes a ligand of the epidermal growth-factor receptor (EGFR)20, was down-regulated shortly after G12Ci-treatment but rebounded at 48-72h (Extended Data Fig. 7a). The single-cell analysis ‘localized’ this rebound to a cluster of quiescent cells (Fig. 2a, b and Extended Data Fig. 6d). This change was associated with a ~2-fold increase in secreted HBEGF during G12Ci-treatment (Extended Data Fig. 7a). In line with a potential role in mediating adaptation to G12Ci-treatment, sgRNAs targeting EGFR-signaling intermediates were depleted with G12Ci-treatment (Fig. 2c). Likewise, siRNA-mediated knockdown of HBEGF enhanced the antiproliferative effect of the drug (Extended Data Fig. 7b).
The secretion of HBEGF could impact a broader population of cells in an autocrine/paracrine fashion by activating EGFR, which like other receptor tyrosine kinases (RTKs), drives nucleotide-exchange to activate RAS20. Indeed, adapting cells had higher EGFR pathway activation than quiescent cells (Fig. 2d). Stimulation with recombinant EGF induced KRAS activation in sorted quiescent cells and enhanced signaling in an EGFR/SHP2-dependent manner (Extended Data Fig. 7c-e). EGF also enhanced the escape from quiescence (Fig. 2e), when the ligand was added during the adaptive phase of G12Ci-treatment (24/48h) but not at the beginning (0h). These suggest that EGFR signaling is required for escape from drug-induced quiescence.
Inhibition of EGFR signaling, either by targeting EGFR or SHP2, attenuated the adaptive reactivation of KRAS-GTP in KRASG12C-mutant lung cancer cells and ‘RASless’21 murine embryonic fibroblasts (MEFs) (Extended Data Fig. 7f-i). Co-targeting EGFR or SHP2 together with KRASG12C attenuated the escape from drug-induced quiescence (Fig. 2f) and enhanced the antiproliferative and/or antitumor effect (Fig. 2g and Extended Data Fig. 7j). Broad RTK suppression by serum-deprivation enhanced the antiproliferative effect of G12Ci in several models (Extended Data Fig. 7k), suggesting other growth-factors may also contribute in a tumoror subpopulation-specific manner. Thus, EGFR signaling coordinates, at least in part, the heterogeneous response to G12Ci-treatment.
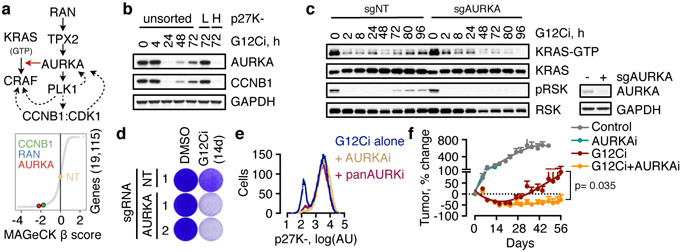
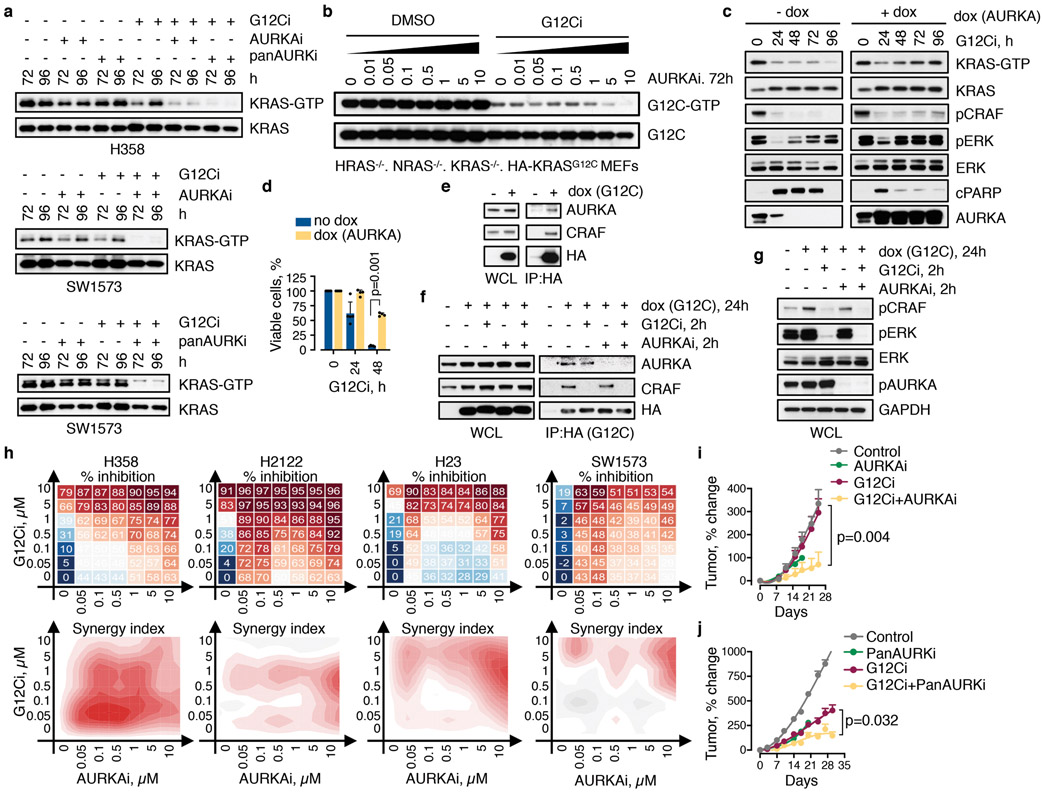
While predominantly activated in G2M to control cell division, AURK has also been implicated in the regulation of mitogenic signaling22-25 (Fig. 3a) and acquired resistance to EGFR or PI3K inhibition26,27. AURKA was up-regulated along the adapting trajectory (Extended Data Fig. 6) and expressed at higher levels in sorted adapting vs. quiescent cells (Fig. 3b). Again, AURKA sgRNAs ranked highly in the screen (Fig. 3a). Individual knockout of AURKA augmented the antiproliferative effect of the G12Ci and prevented the reactivation of KRAS over time (Fig. 3c, d). Inhibitors targeting AURKA28 suppressed the reactivation of KRAS-GTP during G12Ci-treatment, both in KRASG12C-mutant cancer cells (Extended Data Fig. 8a) and ‘RASless’ MEFs (Extended Data Fig. 8b). Doxycycline (dox)-inducible AURKA expression not only enhanced the adaptive reactivation of KRAS-GTP and CRAF/MEK/ERK signaling during G12Ci-treatment, but also attenuated the antiproliferative effect of G12Ci-treatment (Extended Data Fig. 8c, d).
Fig. 3. AURKA is involved in the adaptive reactivation of KRAS and escape from drug-induced quiescence.
a, AURK signaling intermediates identified in the CRISPR/Cas9 screen as potential regulators of G12Ci-treatment response. b, Immunoblots of extracts from FACS-sorted H358/p27K-cells. c, d, KRASG12C-mutant lung cancer cells (H358) expressing a non-targeting (NT) or AURKA-specific sgRNAs were treated with the G12Ci and analyzed by immunoblotting (c) or by crystal violet staining (d). e, Cells were treated with the indicated inhibitors for 72h and analyzed by FACS. f, H358 xenograft-bearing mice were treated with the indicated inhibitors to determine the effect on tumor growth (mean + s.e.m, n=4). A two-sided t-test p value is shown. A representative of three independent experiments is shown in b-e.
AURKA interacts with wild-type HRAS in non-malignant cells to enhance its interaction with CRAF24. Here we found that AURKA also interacts with KRASG12C in cancer cells (Extended Data Fig. 8e). G12Ci- or AURKi-treatment respectively displaced only CRAF, or only AURK, from KRASG12C. The G12Ci/AURKi combination displaced both interactions to enhance pCRAF/pERK inhibition relative to each drug alone (Extended Data Fig. 8f, g). This suggests that AURK complexes with KRAS to stabilize its interaction with downstream effector CRAF. As expected, targeting AURK prevented the escape from G12Ci-induced quiescence (Fig. 3e). Combined inhibition of AURK and KRASG12C had a synergistic antiproliferative effect across KRASG12C-mutant models (Extended Data Fig. 8h) and resulted in a stronger antitumor effect in vivo, compared to G12Ci monotherapy (Fig. 3f and Extended Data Fig. 8i, j). Thus, the heterogeneous bypass of G12Ci-induced quiescence also depends on the AURK-mediated adaptive reactivation of KRAS.
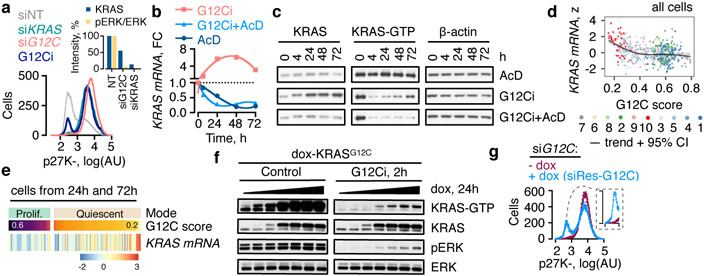
The non-uniform response to G12Ci-treatment may occur in a KRASG12C-dependent or -independent manner. Unlike the G12Ci, a KRASG12C-specific siRNA (siG12C)29, yielded a uniform induction of quiescence (Fig. 4a). The siG12C differs from the inhibitor in that it suppresses signaling in a non-conformation dependent manner but is otherwise susceptible to KRASG12C-independent adaptive pressures. The uniform effect of siG12C suggests that reactivation of KRASG12C is sufficient for the divergent response. Drug-bound KRASG12C, however, cannot undergo nucleotide-exchange to the active state3-5. How then is KRASG12C reactivated, when almost the entire initial pool is covalently-bound and inhibited by the drug?
Fig. 4. Newly-synthesized KRASG12C is reactivated to escape trapping by the drug.
a, Quiescence biosensor-expressing cells (H358/p27K-, KRASG12C+/−) were transfected with KRAS- specific siRNAs targeting both wild-type and G12C alleles or only G12C for 72h and analyzed by FACS. The effect of a 72h G12Ci-treatment is shown. Inset: Cell extracts were immunoblotted and quantified to determine the intensity of KRAS expression and ERK phosphorylation. b, Effect of the indicated treatments on KRAS mRNA. FC: fold change, AcD: actinomycin D. c, Inhibitortreated cell extracts were analyzed by immunoblotting. d, e, Normalized KRAS expression across single-cells as a function of KRASG12C-output score (d) or in quiescent vs. proliferating cells (e). f, H358 cells engineered to express HA-KRASG12C under a dox-inducible promoter were treated with the G12Ci in the presence of dox (0-2 μg/mL). g, Biosensor expressing cells, engineered to stably express dox-inducible siRNA-resistant (siRes) KRASG12C, were transfected with G12C-specific siRNA followed by dox treatment (100 ng/mL). A representative of three independent experiments are shown in a-c, f, g.
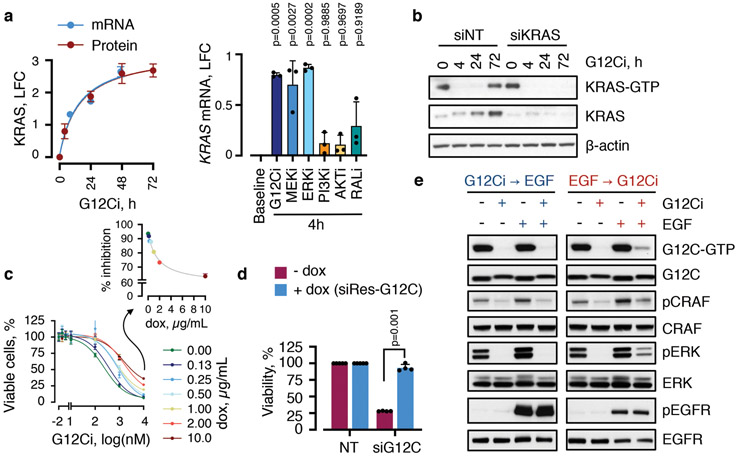
G12Ci-treatment induced KRAS mRNA and protein expression (Fig. 4b, c and Extended Data Fig. 9a). This induction was heterogeneous across the population (Fig. 2a, b and Extended Data Fig. 6). It was inversely proportional to KRAS/RAF/MEK/ERK signaling activity (Extended Data Fig. 9a) and was most pronounced in clusters of quiescent cells with maximal inhibition of G12C output (Fig. 4d, e). Inhibiting new KRAS synthesis with the transcription inhibitor actinomycinD, or KRAS-specific siRNAs, prevented the KRAS-GTP rebound during G12Ci-treatment (Fig. 4b, c and Extended Data Fig. 9b). Conversely, dox-induced KRASG12C expression attenuated the effect of drug treatment (Fig. 4f and Extended Data Fig. 9c).
To confirm that KRASG12C is sufficient for the divergent response to G12Ci-treatment, we used siG12C to mimic the initial inhibitory phase, and dox-induced expression of siRNA-resistant KRASG12C (siRes-G12C) to mimic the adaptive phase triggered by new KRASG12C. As evidenced in Fig. 4g and Extended Data Fig. 9d, expression of siRes-G12C led to a bimodal distribution in siG12C-transfected cells, with a proportion of cells escaping quiescence (~30%). This phenocopies the effect of the G12Ci, even though no drug was added in this experiment.
The data suggest that some newly-synthesized KRASG12C undergoes nucleotide-exchange to the active/drug-insensitive state before it can be bound/inhibited by the drug. Indeed, EGF stimulation attenuated the inhibition of KRASG12C when EGF was added before the G12Ci, but not when it was added after (Extended Data Fig. 9e). This suggests that exposure to growth factors is the initial stimulus affecting the inhibitory fate of cells with new KRASG12C. AURK likely operates later to maintain active KRASG12C and effector signaling.
Our study thus sheds light into why predominantly partial responses are observed in lung cancer patients treated with a KRASG12C inhibitor30. We identify an adaptive fitness mechanism that allows groups of cancer cells within a population to rapidly escape inhibition (Extended Data Fig. 10 and Supplementary Discussion). The synthesis of new KRASG12C and its distribution between the active or inactive states modulates the divergent response. Drug-induced quiescent cells without adequate new KRASG12C expression are eliminated from the population by treatment. Cells with new KRASG12C, that is rapidly converted to the active/drug-insensitive state, escape inhibition and resume proliferation. This occurs through upstream-acting signals: RTKs trigger nucleotide-exchange, whereas AURK signaling facilitates effector activation and cell cycle progression. In cells where these signals are not active, or in cells where they are pharmacologically suppressed, new KRASG12C spends a longer time in its inactive conformation, where it can be bound and inhibited by the drug. These cell-intrinsic events are sufficient for a rapid, multifactorial and non-uniform adaptive process that limits the therapeutic potential of conformation-specific KRASG12C inhibition. This mechanism must be suppressed for complete and durable responses in the clinic.
Methods
Cell culture and reagents
All cell lines used in this study were maintained in DMEM medium supplemented with 10% FBS, penicillin, streptomycin and 2mM L-glutamine. Cell lines were obtained from ATCC (H358: CRL-5807; H2122: CRL-5985; SW1573: CRL-2170), expanded immediately and frozen in aliquots. The cell lines tested negative for mycoplasma. All experiments were performed within 20 passages. The KRASG12C inhibitor (ARS1620) was obtained from ChemGood and administered at 10 μM or as otherwise specified in culture and at a dose of 200 mpk in mice. The maximum selective concentration for in vitro dosing was experimentally determined to be 10 μM. At concentrations greater than 10 μM, antiproliferative effects were observed in non-KRASG12C mutant cells, such as HEK293 cells. Inhibitors targeting AURKA (alisertib) and AURKA/B/C (tozasertib) were obtained from Selleckem. These were administered at 10μM, or as otherwise specified, in culture and at doses of 30 mpk bid or 50 mpk, respectively, in mice. The EGFR inhibitor (gefitinib), pan HER kinase inhibitor (afatinib) and SHP2 inhibitor (SHP099) were obtained from Selleckem. Unless otherwise indicated, they were administered in culture at a concentration of 10 μM, 1 μM and 10 μM, respectively. Gefitinib was administered at a dose of 100 mpk in mice. ActinomycinD was purchased from Sigma Aldrich and used at a concentration of 2.5 μg/mL.
Rationale and approach
The goal of this study was to determine how KRASG12C-mutant cancer cell populations adapt to treatment with a conformation-specific KRASG12C inhibitor. G12Ci bind only to the inactive conformation and spare the active state of KRASG12C. They inactivate KRASG12C by trapping the oncoprotein in its inactive state and preventing its reactivation by nucleotide exchange. Inhibition occurs because, rather than existing in a constitutively active state, KRASG12C hydrolyzes GTP to GDP and undergoes nucleotide-cycling in cancer cells. We reasoned that cells across a population do not have synchronized KRASG12C nucleotide-cycles. Various perturbations, such as drug treatment, are likely to diversify the population, altering the distribution of cells with predominantly active or inactive KRASG12C. Based on these, we hypothesized that the adaptive reactivation during G12Ci-treatment occurs by shifting the KRASG12C equilibrium to the active/drug insensitive state and reflects a non-uniform behavior of cancer cells; in a manner that is determined by the distribution of the nucleotide-bound states of KRASG12C (i.e. the distribution of cells with predominantly active or inactive KRASG12C following treatment).
The cells were treated with the G12Ci for a short time in order to minimize the chance of acquired or selected genomic alterations. Treatment was carried out in the absence of the tumor microenvironment in order to minimize the potential confounding effect of stromal interactions. Single-cell RNA sequencing (scRNAseq) was chosen because it allows for: 1) an analysis of thousands of single-cells in order to determine phenotypic differences in treatment response; and 2) the determination of transcriptional changes across the population. It is well established that only the GTP-bound conformation of KRAS activates effector signaling, which in turn leads to changes in transcriptional output1,2. With this in mind, the collective expression of KRASG12C-dependent genes was used to infer the activation status of KRAS signaling in each single-cell.
Single-cell RNA sequencing
Experiment.
KRASG12C-mutant tumor cell models (H358, H2122 and SW1573) were treated with the KRASG12C inhibitor (ARS1620, 10μM) for 0, 4, 24 and 72h, followed by rapid collection of attached cells in cryopreservation medium. The cells were stored in −80°C until the completion of the experiment. scRNAseq was carried out using the Chromium 10X platform (3-prime v1), following the manufacturer’s protocol, as described previously31-34. Briefly, single-cell suspensions were loaded on a GemCode single-cell instrument to generate single-cell gel bead emulsions (GEMs). Each GEM contains sequencing adapters and primers, a barcode used to index cells, a randomer or unique molecular identifier (UMI) used to count transcripts and an anchored oligodT to prime polyadenylated RNA transcripts. Cells were loaded at a limiting dilution to minimize the co-occurrence of two or more cells in the same GEM. The cells were lysed, and their mRNA was reverse transcribed followed by disruption of the emulsions. Subsequently, barcoded cDNA was pooled followed by shearing, end repair and A-tailing, ligation of adaptors and another round of PCR amplification to generate samples carrying properly oriented adaptors. The libraries were then sequenced with HiSeq 2500 in pair-end mode. Alignment, barcode assignment and UMI counting were carried out using the Cell Ranger Single-Cell Software Suite. Then, sample demultiplexing was performed to generate FASTQs for the 14 bp barcode, the 10bp UMI tag and the cDNA insert. The latter was aligned to the human reference genome using STAR. Cell barcodes and UMIs were filtered to ensure correct assignment and elimination of mismatches, and PCR duplicates were marked and removed. The number of reads that provided meaningful information was calculated as the product of four metrics: valid barcodes, valid UMI, associated with a cell barcode, and confidently mapped to exons.
Initial processing.
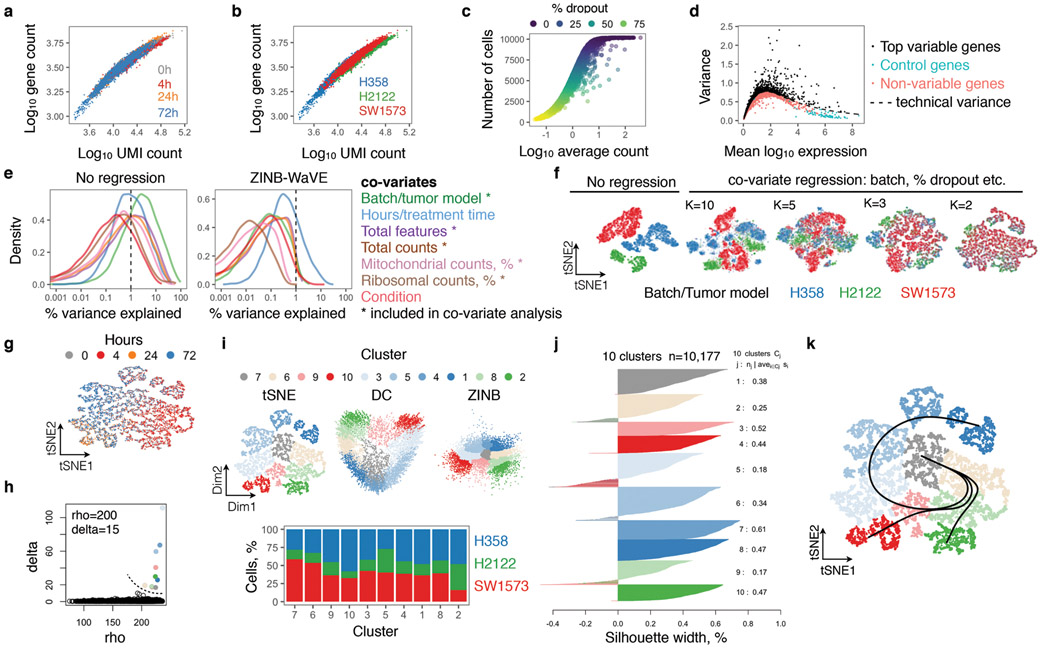
The gene-cell count data matrix generated for each treatment collection time were consolidated into a single matrix representing each cell line/tumor model and assembled into a SingleCellExperiment (SCE) object in R/Bioconductor35. A number of quality control metrics were derived using the scater package36. Before merging the datasets from different KRASG12C models, we performed quality control on each model separately. Cells that had a total UMI count or total gene count or percent mitochondrial count greater or lower than 3 mean absolute standard deviations were excluded from the analysis, as these cells may represent doublets or cell debris. To account for the possibility that differences in these variables may be treatment-related, filtering was carried out individually for each treatment time-point. Despite two independent experimental replicates leading to sequencing of several thousand single-cells, no good quality cells (i.e. suitable for downstream analysis) were identified from the 24h treatment time point in H2122 cells. Genes expressed only in a small proportion of cells (i.e. less than 5% of the cells) were excluded from downstream analysis. Once filtered, the datasets from each tumor model were joined together. Only genes detected in all three models were included in the joined dataset. Together, this filtering resulted in a dataset with 10,177 cells and 8,687 genes, where each cell had an average of ~3,000 expressed transcripts.
Dimensionality reduction.
This was carried out on the merged datasets from above using a zero-inflated negative binomial-based wanted variation extraction (ZINB-WaVE) method15,37. Briefly, the method fits a model that accounts for dropouts, over-dispersion, and the count nature of the data (such as those recorded in scRNAseq experiments). The model enables both cell-level and gene-level intercepts, which serve as global-scaling normalization factors. With this in mind, we controlled for both gene-level (i.e. percent dropout) and cell-level (i.e. batch/tumor of origin, transcript count, mitochondrial transcript count and ribosomal transcript count) effects, adding them as covariates in the model. The K parameter was chosen empirically, by evaluating K equals 10, 5, 3 and 2. K=2 was found to optimally reduce batch effects. The effect of the regression is shown in Extended Data Fig. 2a-f.
Normalization.
Size factors were computed by using the scran normalization method38. Briefly, cells were first clustered using the quickCluster command. Cells in each cluster were normalized using a deconvolution method embedded in the scran package, which improves normalization accuracy by reducing pooling together cells in the same cluster. Only genes with a mean count of greater than 0.1 across the dataset were used in this process. The size factors generated through this approach were then used to compute normalized expression values as logtransformed count data (Supplemental Data 1-3).
Modeling technical variance.
After normalization, we modeled technical noise by fitting a meandependent trend to the variances of a set of endogenous control genes, e.g. ribosomal genes. This was carried out as described38. Genes whose variability surpassed that expected on technical grounds alone, were deemed to have a high degree of biological variability. Highly variable genes were used to construct two-dimensional projections as described below.
Two-dimensional projections.
In order to carry out downstream analysis and visualize the single-cells we employed the two-dimensional output of ZINB-WaVE (as described above), t-distributed stochastic neighbor embedding (tSNE) or diffusion component (DC) analysis39. The latter two projections were carried out using commands embedded in the scatter package with default parameters, which included using the top 500 most variable genes to carry out the projection. tSNE was performed on low-rank approximations of the two-dimensional output of ZINB-WaVE (which controls for the potential confounding factors noted above). Initial runs were carried out with default parameters. The final projections were generated by using a perplexity parameter of 50 and a theta parameter of 0. A local sigma parameter was used for the DC projection.
Clustering.
The tSNE projection derived from above was used to establish a distance matrix, followed by clustering of cells by density peaks, as described40. We then used rho and delta thresholds (200 and 15, respectively) to determine cluster peaks and assign single-cells to these clusters (Supplementary Data 2). The performance of the clustering algorithm was examined by silhouette-width analysis (Extended Data Fig. 2j), which reported a mean width per cluster ranging between 0.18 to 0.52.
Trajectory inference analysis.
The Slingshot algorithm17 was used to order and project cells into principal curves representing distinct trajectories. The arc length, along each principal curve, represents pseudotime, a computational parameter denoting progress along a biological process41. To establish trajectories associated with KRASG12C inhibition, the cells collected from all treatment time points were clustered in the 2-dimensional reduced space (as described above). The Slingshot algorithm was then used to reconstruct the clusters into trajectories. The algorithm was anchored by indicating a starting cluster, i.e. the cluster with the greatest number of cells collected at 0h (cluster 7). The trajectories and end-points were otherwise estimated in an unsupervised manner and are graphically represented in Extended Data Fig. 2k. When comparing expression changes between trajectories (e.g. Fig. 1d, Extended Data 6c) single-cells were grouped by trajectory and assigned the pseudotime value corresponding to that trajectory (see below). In this comparison, cells before the bifurcation points were assigned to both trajectories, while cells after the bifurcation were assigned to a single trajectory (Supplementary Data 4). When comparing expression changes between clusters or cell cycle modes (e.g. Fig. 1e, Extended Data Fig. 6d), the cells were grouped by these factors and pseudotime was not considered in the differential expression model (but used for visualization, as described below). In graphs, pseudotime was adjusted across trajectories (range: 0-100) to allow comparisons in expression trends.
Differential expression.
Dropout events in scRNAseq experiments make differential gene expression (DE) analysis challenging. We used the zero-inflated negative binomial model described above to identify excess zero counts and generate gene- and cell-specific weights. These can be used to adapt bulk RNAseq DE pipelines for zero-inflated data42. With this mind, we applied methods from the limma package43 to perform DE, using observational weights to adjust for zero inflation. First, we identified genes whose expression differed as a function of pseudotime between inhibited (path 1) and adapting (path 2) trajectories. The cells were grouped by trajectory, and gene expression over pseudotime was contrasted between path 1 and path 2, while controlling for potentially confounding factors (batch, total features, total counts, percent mitochondrial counts and percent ribosomal counts) and correcting for multiple-hypothesis testing. The false discovery rates (FDR) from this test are listed in the br.qval column in Supplementary Data 3. A similar analysis was carried out in the subset of cells collected only at 72h, in order to determine if the differences persisted in cells collected at the same treatment time. We also explored differences in gene expression between cell clusters, or cell cycle modes, i.e. quiescent (G0) vs. proliferating cells (G1S, S, G2M, M, MG1). Significant differences were tested using limma38, as described above. These results are listed in the cluster.qval and mode.qval columns in Supplementary Data 3. Top DE genes are mapped in Extended Data Fig. 6a and d. The FDR corresponding to KRAS, HBEGF and AURKA are shown in Extended Data Fig. 6e. Given the limitations in performing DE analysis in scRNAseq datasets, efforts were made to experimentally validate key findings from this analysis, as described in the main article.
Visualization.
In order to visualize KRAS, HBEGF and AURKA, the cells were ordered by cluster and pseudotime and then the normalized log expression values were averaged across pools of n adjacent cells (n=15 for the plots in Fig. 2b and Fig. 4d or n=40 for the heat maps in Extended Data Fig. 6). In some instances, the last pool per cluster contained more than n but less than 2n cells. This was done in an effort to compensate for random dropout events in each single-cell and minimize the risk of visualizing technical outliers. The averaged expression was scaled across all pools and then presented graphically. The projection of peak gene expression levels into 2-dimensional coordinates (Fig. 2a) was carried out by identifying and labeling the cells with scaled expression equal or greater than 2 standard deviations from the mean of the entire dataset. Projections of expression signature scores (Extended Data Fig. 3) were carried out in a similar manner without a cutoff. The expression trend for a gene or a geneset was established by fitting a spline along with its 95% confidence interval to the single-cell data.
Bulk RNA sequencing and output score determination
Bulk RNAseq.
KRASG12C-mutant lung cancer cells were treated with the G12Ci for 0, 4, 24 and 48h in biological triplicates. RNA was extracted using RNeasy Mini Kit (QIAGEN catalog # 74104) according to manufacturer’s instructions. After RiboGreen quantification and quality control by Agilent BioAnalyzer, 500ng of total RNA per sample underwent polyA selection and TruSeq library preparation according to instructions provided by Illumina (TruSeq Stranded mRNA LT Kit, catalog # RS-122-2102), with 8 cycles of PCR. Samples were barcoded and run on HiSeq 4000 in a 50bp/50bp paired end run, with an average of 30 million paired reads per sample. Ribosomal reads represented less than 0.5% of the total reads generated. The sequencing output files from different lanes were concatenated, aligned to GRCH38 using HISAT2 and transcripts were counted using HTSeq in Python. The count data matrix was then processed by using limma43 and edgeR44 in R/Bioconductor, as described45. Briefly, the data were filtered by removing transcripts that were not detected in all replicates. Size factor normalization was carried out and differential expression (DE) analysis was performed contrasting each time point to the untreated condition. The count data were transformed to log2-counts per million (logCPM) followed by an estimation of the mean-variance relationship, which was then used to compute appropriate observation-level weights data. The data for each gene was used to fit a linear model and to compute various statistical parameters for a given set of contrasts. DE genes were considered those with log2 fold change equal or greater than 2 in any contrast and an adjusted p value of less than 0.05. These genes (563 induced and 447 suppressed by KRASG12C) comprised the lung cancer-specific KRASG12C-dependent gene expression signature that was used to calculate the G12C-score across single-cells (Supplementary Data 5).
Output score determination.
The list of KRASG12C-dependent genes identified above was filtered to remove genes with undetected or very low expression in the single-cell dataset (i.e. average log count of less than 0.1). The G12C-score in each single-cell was the average logcount expression of the remaining KRASG12C-dependent genes (212 genes, Supplementary Data 6), normalized across all cells in the dataset. The G12C-induced and suppressed scores were calculated from genes that were respectively down- or up-regulated by G12Ci-treatment in the bulk RNAseq experiment. When not specified, G12C-output refers to the score derived by genes that were down-regulated during G12Ci-treatment (these comprised the majority of the G12C-dependent genes detected in the scRNAseq dataset). The trend in G12C score as a function of pseudotime was visualized by fitting a spline and its 95% confidence interval (Fig. 1d). The G12C score in each single-cell is shown in Extended Data 3b-d. The rotation gene set test46 was used to compare the KRASG12C-induced or -suppressed genesets across pseudotime in path 1 v. path 2 (p=0.001 for the G12C-induced geneset and p=0.001 for the G12C-suppressed geneset, Fig. 1d). The G12C output score in clusters (Fig. 1e) was compared by using ANOVA (p=0.001) and then in a pair-wise fashion by using the Turkey test and correcting for multiple hypothesis testing (p=0.001 for each of, but not limited to, the following cluster comparisons: 7 vs. 9, 7 vs. 10, and 10 vs any other). The difference in G12C score between quiescent or proliferating cells (Extended Data Fig. 5d) was compared by a two-tailed t test (p<0.001, in each cell line). Again, these findings were validated experimentally, as described in the main article.
Cell cycle classification was performed by using published cell cycle phase specific gene expression signatures (G0, G1S, G2M, M, MG1)19,32. The overlap between the genesets is shown in Extended Data Fig. 4b. These were used to calculate a phase specific score, in a similar manner to that described for the G12C score, followed by scaling the scores across cells and cell cycle phases. The cells were classified by assigning the cell cycle phase corresponding to the highest scaled value, as described previously. The scaled values are graphically depicted in the heat map in Extended Data Fig. 4c).
Identification of candidate genes for further analysis
The objective for this part of the study was to identify genes responsible for the divergent response to treatment. We identified a large number of genes that were differentially expressed between the inhibited and adapting single-cell trajectories. The zero-inflated nature of scRNAseq data makes it difficult to reliably estimate the magnitude of changes in expression. With this in mind, in an effort to unbiasedly select candidate genes for further validation and analysis we resorted to a CRISPR-Cas9 screen. By integrating the results from the screen and single-cell analyses, we aimed to identify genes and/or pathways that are differentially expressed between the single-cell trajectories and that are also functionally related to proliferation during G12Ci-treatment.
CRISPR-Cas9 screen
Library lentivirus production and purification.
The Brunello human genome sgRNA library47 was obtained from the gene editing and screening core facility at Memorial Sloan Kettering Cancer Center. This library consists of 4 sgRNAs per gene, optimized to reduce off-target effects. To produce the lentivirus expressing the sgRNA library, HEK293FT cells were transfected with the DNA library using XtremeGene HP (Sigma-Aldrich), according to the manufacturer’s instructions. After 24 hours, the media was replaced with fresh complete DMEM. Following another 48-hour incubation, the media was collected and centrifuged at 500g at 4 °C for 5 min to pellet cell debris. The supernatant was passed through a 0.45μm filter and snap frozen in aliquots for future use.
Establishment of Cas9 expressing cells.
Lentivirus expressing spCas9 was produced as above and transduced into H358 cells at a multiplicity of infection (MOI) of 1. Cells were sorted into 96-well plates at one cell/well and selected for growth in complete medium containing 10 μg/mL blasticidin. Cas9-expressing cell lines were validated for Cas9 expression, Cas9 activity and a similar sensitivity to the G12Ci as the parental cell line (data not shown).
Titration of the library expressing virus.
To determine the titer of the viral library, Cas9-expressing H358 cells were seeded in 15 cm dishes in complete medium and transduced with increasing amounts of virus. Number of viable cells after puromycin selection was determined and used to calculate titer.
G12Ci screen.
Cas9-expressing H358 cells were transduced with the sgRNA library-expressing virus at a MOI of 0.3 and a coverage of 500X. Puromycin was added 2 days after transduction at a concentration of 2 μg/mL. Eight days after selection (set as T0), cells were harvested and a portion (i.e. 40 million cells which represents a 500X coverage of the library) was collected for genomic DNA (gDNA) extraction (Qiagen Gentra Puregene Cell Kit). The remaining cells were reseeded into 150 mm3 dish at 4 million cells per dish and treated with DMSO or G12Ci (ARS1620, 10μM). The medium was changed every three days. Cells were passaged at 80% confluence, and at least 500X coverage of the library was maintained at each passage. Fourteen days after treatment, cells were harvested and gDNA extracted.
NGS library preparation.
The gDNA extracted above were used to generate NGS libraries. The sgRNA sequences were amplified and prepared for deep sequencing through a two-step PCR. The first step was performed with 10 μg input gDNA in a 100 μl reaction (260 μg gDNA per sample) with 1 μl of Herculase polymerase (Agilent). The PCR primers included adapters: ATGGACTATCATATGCTTACCGTAACTTGAAAGTATTTCG (v2 adapter forward) and CTTTAGTTTGTATGTCTGTTGCTATTATGTCTACTATTCTTTCC (v2 adapter reverse). The thermocycling parameters were: 95°C for 5 min, then 95°C: 20s; 60°C: 20s; 72°C: 30s for 30 cycles, and 72°C for 3 min. The number of cycles was tested to ensure it fell within the linear phase of amplification. Amplicons for each sample were pooled and the second step of PCR was performed with 8 x100 μL reactions containing 5 μl of pooled 1st PCR amplicons to attach Illumina adaptors and indexes with NEBNext® High-Fidelity 2X PCR Master Mix. The thermocycling parameters were: 98°C for 3 min, then 98°C: 20s; 68°C: 20s; 72°C: 20s for 12 cycles, and 72°C for 5 min. All parallel PCRs were pooled and purified by one round of phenol extraction using PhaseLock tubes (ref 2302820 VWR) according to manufacturer’s instruction. PCR products were eluted with 30 μL of EB buffer and resolved on a 2% agarose gel. Amplicons with desired size were purified from the gel with Qiagen’s gel-purification kit. Final NGS amplicons were eluted from column with EB buffer and concentrations were determined via Qubit. Samples were diluted to 30 nM before sending for sequencing.
Data analysis.
This was carried out by using MAGeCK48 in Python. MAGeCK uses the beta score to estimate gene dependencies: a positive beta indicates that a gene is positively selected, and a negative beta indicates that a gene is negatively selected. The fold change in expression was also calculated to help interpret/filter the results. This approach was used to determine sgRNAs that are depleted during treatment. Gene-specific values were calculated as the mean change in expression for the four sgRNAs in the library targeting that gene. The non-targeting average was calculated from 1000 non-specific sgRNAs. We prioritized genes with 2 or more sgRNAs that were down-regulated by 2 or more-fold in the G12Ci v. t0 comparison and which were also identified as having trajectory specific expression in the scRNAseq analysis. Preference was given to pathways being represented by several intermediates. Key findings were validated by independent genetic or pharmacologic approaches.
Cloning and plasmids
sgRNAs targeting AURKA (guide 1: 5’-CCATATAGAAAATAATCCTG and guide 2: 5’-CCTGAAAACTCACCGAAGGT) were cloned into lentiGuide-Puro vector (a gift from Feng Zhang; Addgene plasmid #52963) using the BsmBI site. pMXs-IP-mVenus-p27K- vector was a gift from Toshio Kitamura. siRNA resistant HA-KRASG12C (siRes-G12C) construct was generated by modifying the siRNA-targeted sequence (5’-G GTG GGT GCA TGC GGA GT-3’, G12C codon is underlined), and the modified HA-KRASG12C was synthesized and cloned into the pENTR/DTOPO vector (Invitrogen). The gene was then inserted into the pInducer20 vector (a gift from Stephen Elledge; Addgene plasmid # 44012) or pLIX_403 vector (a gift from David Root; Addgene plasmid # 41395) using the Gateway LR Clonase II kit (Invitrogen). AURKA was amplified with primers (F: 5’-CACCATGGACCGATCTAAAGAAAACT; R: 5’-CTAAGACTGTTTGCTAGCTG) from the template pAuroraA-GFP-AURKA-mCherry (a gift from Marc Tramier; Addgene plasmid # 99878) and cloned into pInducer20 vector (as above).
Virus production and generation of stable cell lines
HEK293T cells were seeded at 90% density in a 10 cm dish and transfected with the expression vector and packaging vectors pMD2.G and psPAX2 using Lipofectamine 3000 (Invitrogen) according to manufacturer’s instructions. Conditioned medium containing recombinant viruses was collected and filtered through 0.45 μm filters (Millipore). The virus containing medium was added to cells with 8 μg/ml Polybrene (Millipore) overnight. Approximately 24h after infection, the cells were selected with 2 μg/ml puromycin or 500 ng/ml G418.
Flow cytometry
Quiescence biosensor distribution.
3 x 10⁶ H358 cells expressing the mVenus-p27K- biosensor22 were plated in 6 cm dishes and treated with the indicated inhibitors for 72h. For siRNA experiments, 5x10⁵ cells were seeded in 6 cm dishes and transfected with 25nM siRNA targeting G12C (sense: GUU GGA GCU UGU GGC GUA G-dTdT; antisense: CUA CGC CAC AAG CUC CAA C -dTdT; underline highlights the G12C codon) using Lipofectamine RNAiMAX (Invitrogen). Doxycycline was added to a final concentration of 100 ng/mL and incubated for 72h. Cells were harvested with TrypLE Express (Gibco) and fixed for 10 min at room temperature with 4% paraformaldehyde. Samples were washed twice with PBS and filtered through 35 μm meshcaped collection tubes. If cell cycle analysis was performed, cells were subsequently treated with 70% ethanol and stained with 5 μg/mL DAPI. Cells were analyzed on BD Biosciences LSR Fortessa. Forward (FSC) and side scatter (SSC) plots were used to exclude debris, damaged cells, and doublets. Data analysis was performed with FCS Express 6 Flow and GraphPad Prism 7.0 software. Where indicated, the p27K- biosensor distribution was subjected to min/max normalization in Prism, in order to compare between different conditions. Cell sorting was performed on unfixed cells on BD Biosciences FACSAriaII. Post sort purity was 95+% and was determined by running a small aliquot of the collected sample.
Synchronization experiments.
H358 cells were seeded at low density (10-20%) and incubated with 2mM thymidine for 22h. Next, the cells were released in complete media supplemented with 25μM 2’-deoxycytidine for 10h, followed by another 20h incubation with 2 mM thymidine. Following synchronization at the G1/S boundary, cells were released in either complete medium containing DMSO or G12Ci (10 μM) and harvested for analysis at the indicated times. Cells were fixed in 70% ethanol, washed twice with PBS, and stained in propidium iodide staining solution (PBS with 100 μg/mL RNAse and 50 μg/mL propidium iodide). Samples were analyzed as above. Cell cycle distribution was determined using the Multicycle DNA function embedded in FCS Express 6 Flow.
Clonogenic assay
The cells were seeded in 6-well plates at densities of 4 x 10⁵ or 1 x 10⁵ cells per well and treated as indicated for 6 or 12 days, respectively. Media was changed every 3 days. Cells were fixed with ice-cold methanol for 10 min and stained with 0.5% crystal violet solution for 30min at room temperature on shaker. Plates were washed thoroughly and scanned.
KRASG12C expressing ‘Rasless’ MEFs
‘Rasless’ MEFs, i.e. NRAS−/−, HRAS−/−, Lox-KRAS-Lox, 4HT-CRE MEFs were generated and kindly provided by Mariano Barbacid24. These were infected with a retrovirus expressing HA-tagged KRASG12C (generated from a pBABEPuro DNA vector) followed by puromycin selection to establish MEFs expressing exogenous KRASG12C and endogenous KRASWT. The cells were then treated with 4-hydroxy-tamoxifen for one week to ablate the endogenous KRAS allele. The latter were used to determine the effect of various treatments on KRASG12C reactivation.
RAS activation assay
These were performed as described previously49 using the Active Ras Pull-Down and Detection Kit (Thermo Fisher Scientific). Briefly, whole cell lysates were incubated with GST-RAF1 Ras binding domain (RBD) and glutathione agarose resin for 1h at 4 °C, followed by three washes and elution with SDS PAGE loading buffer. The samples were then subjected to western blotting with a KRAS specific antibody. When HA-KRASG12C was exogenously expressed, an HA-specific antibody enabled specific determination of KRASG12C in its GTP-bound conformation.
Immunoprecipitation
H358 dox-inducible HA-KRASG12C cells were plated in 6 cm dishes at 50% confluence. After induction with 2 ug/mL of doxycycline for 24 hours, cells were treated with G12Ci or AURKi or the combination for another 2h. Cells were then harvested and 200 μg of protein lysate was used to immunoprecipitate HA-KRASG12C with Pierce Anti-HA magnetic beads according to manufacturer’s protocol (Thermo scientific # 88836). Beads were eluted with SDS PAGE loading buffer and the IP product was subjected to western blotting analysis.
Immunoblotting
Immunoblotting was performed as described previously49-51, with the antibodies listed in Supplementary Table 1. All antibodies have been validated either in our previous work (KRAS, HA-tag, pEGFR, EGFR, pCRAF, CRAF, pERK, ERK, pRSK, RSK, and GAPDH) or in other publications (β-actin, pSHP2, SHP2, pAURKA, AURKA, PLK1, CCNB1, cleaved PARP, p21 and p27).
Cell Viability Assay
Cells were seeded in 96 well plates at 2 x 10³ cells/well in at minimum triplicates and treated with the indicated concentrations of drugs. After 72h, cell viability was assayed by CellTiter-Glo Luminescent Cell Viability Assay (Promega). For siRNA experiments, cells were reverse transfected with 25nM siRNA for 3 days prior to the addition of drug. siRNA targeting HBEGF and KRAS are ON-TARGETplus Smartpool siRNA from Dharmacon, and the non-targeting siRNA (Control siRNA-A) is from Santa Cruz Biotechnology. Data analysis was performed with GraphPad Prism 7.0.
Synergy determination
To determine the presence of synergy between two drug treatments, cells were treated with increasing concentrations of either drug for 72h followed by determination of viable cells using the CellTiter-Glo Luminescent Cell Viability Assay (Promega). The experiment was carried out in biological triplicates. The data were expressed as % inhibition relative to baseline and the presence of synergy was determined by the Bliss method using the synergy finder R package52.
Quantitative RT-PCR
Cells were treated as shown and total RNA was extracted using Quick-RNA Miniprep Kit (Zymo Research). 1 μg of RNA was used for cDNA synthesis using High-Capacity cDNA Reverse Transcription Kit (Applied Biosystems). qPCR reactions were performed using the Applied Biosystem PowerUP SYBR Green Master Mix (Applied Biosystems) on the QuantStudio 6 Flex Real-Time PCR System (Applied Biosystems). Samples were run in triplicate, and mRNA levels were normalized to ACTB. Primer sequences are: KRAS (F: ggactggggagggctttct; R: gcctgttttgtgtctactgttct), HBEGF (F: ATCGTGGGGCTTCTCATGTTT; R: TTAGTCATGCCCAACTTCACTTT) and ACTB (F: CATGTACGTTGCTATCCAGGC; R: CTCCTTAATGTCACGCACGAT).
Animal studies
This was carried out as described previously50,51. Briefly, nu/nu athymic mice were obtained from the Envigo Laboratories and maintained in compliance with IACUC guidelines under protocol 1805–007 approved by MSKCC IACUC. The maximum tumor measurement permitted was 1.5 cm and this was not exceeded in any of our experiments. Animals implanted with xenografts were chosen for efficacy studies in an unbiased manner. Once tumors reached 100 mm3 volume, mice were randomized and treated with drug or the appropriate vehicle control. Treatments and tumor measurements were performed as described51 in a non-blinded manner by a research technician who was not aware of the objectives of the study. Prism (GraphPad Software Inc.) was used for data analysis. For each study arm, the fractional difference in tumor growth relative to time 0 was plotted over time. Statistically significant differences were determined for each treatment time points by using the two-tailed t-test function embedded in Prism.
Extended Data
Extended Data Fig. 1. The effect of G12Ci-treatment on KRAS signaling across lung cancer cell lines.
The indicated models were treated with increasing concentrations of G12Ci (ARS1620) for 2h (top) or with 10 μM over time (bottom) and immunoblotted to determine the effect on KRAS signaling intermediates. Key genetic alterations found at baseline in the KRASG12C mutant cell lines used in this study. A representative of two independent experiments for each cell line is shown.
Extended Data Fig. 2. Quality assessment and processing of scRNAseq data.
a, b, Gene counts as a function of unique molecular identifier (UMI) count. Cells were grouped by G12Ci-treatment time (a) or tumor model (b). c, The number of cells expressing a gene as a function of its average count across the dataset. d, Variance as a function of mean expression. Technical variance, i.e. variability attributed to technical factors, was calculated by the expression of ribosomal genes. n=10,177 single-cells in a-d. e, The percent of variance explained by various experimental factors. A number of variables had a meaningful contribution to the variance of the dataset (i.e. they accounted for greater than 1% of the variation), suggesting the need to correct for these potentially confounding factors in downstream analysis. f, Dimensionality reduction and co-variate regression using the ZINB-WaVE (ZinB) algorithm. The K parameter of 2 was chosen as this minimizes batch and other covariate effects. g, tSNE projection showing single-cells colored by time of inhibitor treatment. h, Parameters employed to cluster cells by using the Density Cluster algorithm. i, Cluster distribution in the indicated projections (top) and cell line composition of each cluster (bottom) showing a similar representation of cells from different tumor models in each cluster. j, Silhouette width analysis to assess the appropriateness of clustering. Negative values indicate cells that have been inappropriately assigned. k, tSNE projection of KRASG12C single-cells with the three inhibitory trajectories identified by the Slingshot algorithm.
Extended Data Fig. 3. KRASG12C-dependent transcriptional output score in 10,177 lung cancer cells.
a, The distribution of KRASG12C-specific gene expression output score across single-cells in the three tumor models under study. The arrows denote cohorts of cells with high output despite treatment. b, Density plots showing the effect of G12Ci-treatment on the KRASG12C output score (n=2,565 single-cells from 0h, n=3,259 single-cells from 24h, n=1,006 single-cells from 24h and n=3,347 single-cells from 72h). At 72h the cells assume an asymmetric distribution, suggesting that a subpopulation of KRASG12C cells has adapted to treatment by reactivating KRASG12C-dependent output (arrow). c, The KRASG12C-output score as a function of pseudotime (which was adjusted in order to allow comparisons between trajectories). The trendline was derived by fitting a spline to the G12C score for each cell (n=4,759 in path 1, n=8,653 in path 2 and n=4,050, where n denotes the number of singe-cells). d, e, The indicated variables are plotted for each cell in a 2-dimensional tSNE (d) or DC (e) space. For simplicity, only the key clusters delineating each trajectory are shown in e.
Extended Data Fig. 4. G12Ci-treatment induces quiescence in a subpopulation of cancer cells.
a, Single-cells were analyzed to determine gene expression signatures that correlated with the inhibitory fates. The top 20 signatures in each direction are shown. b, The overlap in the cycle-specific gene expression signatures used to classify cells along their cell cycle phase. The G0 and G1 comprise of mostly non-overlapping genes. c, A heatmap of cell cycle-specific gene expression scores across each cell. Values were scaled across columns. d, Effect of G12Ci on cell cycle distribution across treatment time and tumor models. e, The cell lines were treated as shown to determine the level of p27 expression by immunoblotting. A representative of two independent experiments is shown for all except H2030, which was assayed once. f, KRASG12C mutant cells (H358) were synchronized with double thymidine treatment and then released in the presence or absence of G12Ci-treatment, followed by cell cycle analysis using propidium iodide (PI) staining. Note that this assay cannot distinguish G0 from G1. TT: double thymidine. A representative of two independent experiments is shown.
Extended Data Fig. 5. Biosensor validation of the divergent response to G12Ci-treatment.
a, Quiescence biosensor-expressing cells (H358/p27K-) were treated and re-challenged with the G12Ci to determine the effect on quiescence (i.e. p27K-high peak) at the indicated times. b, c, The cells were treated with the indicated inhibitors for 72h to determine the effect on cell number (b, n=2 biological replicates) or the distribution of biosensor expression (c). d, Comparison of the KRASG12C-output score between proliferating and quiescent cells. Note the similarity of the transcriptional output signature score derived from scRNAseq analysis with the KRAS-GTP levels determined by RBD pulldown in Fig. 1j. e, The cells were exposed to single treatment (0-72h) or drug re-challenge (+) for 2h or 24h. Cell extracts were evaluated by immunoblotting. f, The indicated KRASG12C-mutant lung cancer cell lines were treated with the G12Ci for 72h followed by drug re-challenge for 4h. The % inhibition in KRAS-GTP/total was determined by comparing baseline vs. 4h G12Ci and 72h G12Ci vs 72h+4h G12Ci. A representative of two experimental repeats is shown in a and e.
Extended Data Fig. 6. Genes with trajectory-specific expression profiles.
a, Single-cells were analyzed to identify differentially expressed genes by contrasting paths 1 and 2. The top 50 genes are shown. The teal dots indicate genes that were validated in subsequent experiments. b, A CRISPR-Cas9 screen was carried out in H358 cells in order to help narrow down the list of genes with trajectory-specific expression (by identifying and focusing on genes modulating the antiproliferative effect of the G12Ci). Note that the schematic is not drawn to scale. Preference was given to genes with 2 or more sgRNAs that were down-regulated by at least 2-fold in the G12Ci v. t0 comparison and that were also identified as having trajectory specific expression in the scRNAseq analysis. Pathways with several intermediates represented were prioritized. The number of gene-specific sgRNAs that were depleted during G12Ci-treatment is also shown. NT: non-targeting control. c, The trend in expression for the indicated genes as a function of pseudotime was established by fitting a spline to single-cell data. The 95% confidence interval is shown. The pseudotime was adjusted to compare between trajectories. The number of cells in each trajectory is noted below. d, The expression of the indicated genes in proliferating or quiescent cells. Only cells collected during the adaptive phase (24-72h) of G12Ci-treatment are shown. e, The gene false discovery rate (FDR) in the indicated comparisons either across the entire cohort of cells, or the subset of cells collected at the 72h time point only (n=4,759 in path 1, n=8,653 in path 2, n=4,050 in path 3, n=6,599 in G1S, S, G2M, M or MG1 (proliferating) and n=3,578 in G0 (quiescent), where n denotes the number of singe-cells in each group).
Extended Data Fig. 7. The adaptive reactivation of KRAS during G12Ci-treatment is dependent on EGFR signaling.
a, The cells were treated with the G12Ci over time to determine the effect on HBEGF expression. mRNA expression was determined by scRNAseq (mean, n>1000 single-cells per time point, see Fig. 1b), or by quantitative PCR (qPCR, mean ± s.e.m, n=3). The amount of protein secreted in the medium was quantified by ELISA (mean ± s.e.m, n=3). Norm.: normalized (min-max). b, Cells transfected with HBEGF-specific siRNAs were treated with increasing concentrations of G12Ci for 72h to determine the effect on viability (mean ± s.e.m, n=3). c, Cells treated with the G12Ci for 72h were stimulated with EGF for 10 min, alone or in combination with the indicated inhibitors. Quiescent cells (p27K-high) were isolated by FACS and their extracts were assayed for active KRAS by RBD pull-down. Immunoblots were quantified by densitometry and reported as fold-change relative to unstimulated. d-e, Untreated or G12Ci-treated (24h) H358 cells were stimulated with EGF (200 ng/mL) for 10 min alone or in combination with the indicated inhibitors. Cell extracts were analyzed by immunoblotting (d). The effect of EGF stimulation at baseline (lanes 2-4 vs. lane 1) or after G12Ci-treatment (lanes 6-8 vs. lane 5) was quantified by densitometry (e). f-i, The indicated KRASG12C mutant lung cancer cells (f, g) or HA-KRASG12C expressing ‘RASless’ MEFs (h, i) were treated with the G12Ci alone or in combination with EGFR or SHP2 inhibitors as shown. Cell extracts were subjected to RBD pull-down to determine the level of active (GTP-bound) and total KRAS. The HA-tag was used to determine the specific effect on KRASG12C (h, i). j, H358 cells were treated with the G12Ci alongside gefitinib (EGFRi), afatinib (PanHERi) or SHP099 (SHP2i) to determine the effect on cancer cell growth (top) and the presence of treatment synergy (bottom), by using the Bliss index. Red denotes synergy. The mean of 3 biological replicates is shown on top. k, The indicated KRASG12C mutant cells were treated with increasing concentration of the G12Ci in the presence of 10%, 2% or 0% serum to determine the effect on cell viability (mean ± s.e.m, n=3). A representative of two independent experiments is shown in d, f, g, h and i. Unless otherwise indicated n denotes biological replicates.
Extended Data Fig. 8. AURKA is involved in the reactivation of KRAS-GTP during G12Ci-treatment.
a, KRASG12C mutant lung cancer cells were treated with the G12Ci alone or in combination with AURKA (alisertib, 10 μM) or panAURK (tozasertib, 10 μM) inhibitors to determine the effect on KRAS-GTP levels over time. Note the lack of a significant effect on KRAS-GTP levels with AURKi treatment in the absence of G12Ci-treatment. b, ‘RASless' murine embryonic fibroblast expressing KRASG12C were treated as shown to determine the effect on KRASG12C-GTP. c, H358 cells stably transfected with dox-inducible AURKA (dox-AURKA) were treated with the G12Ci in the presence or absence of dox (2 μg/mL). Extracts from cells were analyzed by immunoblotting to determine the effect on the indicated intermediates. d, H358 dox-AURKA cells were treated as shown and assayed to determine the effect on cell viability (mean + s.e.m, n=5). A two-tailed t test p value is shown. e-g, H358 stably expressing HA-tagged KRAS G12C under a dox-inducible promoter were treated with dox for 24h alone (e) or with the indicated inhibitors (f, g). Cell extracts were immunoprecipitated and immunoblotted as indicated. h, KRASG12C mutant cell lines were treated as shown to determine the effect on cancer cell growth (top) and the presence of treatment synergy (bottom), by using the Bliss index. Red denotes synergy. The mean of three biological replicates is shown on top. i, j, Mice bearing SW1573 (i) or H2122 (j) xenografts were treated with the indicated inhibitors to determine the effect on tumor growth (mean + s.e.m, n=6 in SW1573, n=5 in H2122). A two-tailed t-test p value is shown. A representative of at least two independent experiments is shown in a-g. Unless otherwise indicated n denotes biological replicates.
Extended Data Fig. 9. Inhibition of MAPK signaling stimulates new KRAS synthesis.
a, The cells were treated with the indicated inhibitors and analyzed to determine the level of KRAS mRNA or protein expression (mean ± s.e.m., n=3) LFC: log2 fold change relative to 0h. The indicated p values were determined by ANOVA (p=0.001) followed by pairwise comparisons vs. baseline, while correcting for multiple hypotheses (using Dunnett’s test in Prism). b, SW1573 (KRASG12C+/+) cells were transfected with non-targeting (NT) or KRAS-specific siRNAs followed by treatment with the G12Ci and immunoblotting. c, H358 cells engineered to express HA-KRASG12C under a dox-inducible promoter were treated with the G12Ci, alone or in the presence of dox, to determine the effect on cell viability at 72h (mean ± s.e.m., n=3). d, H358 p27K- cells were stably transfected with dox-inducible siRNA-resistant KRASG12C (siRes-G12C). The cells were transfected with KRASG12C-specific siRNA (siG12C) followed by dox (2 μg/mL) induction. The effect on cell viability is shown as mean ± s.e.m (n=5 for −dox and n=4 for +dox). A two-tailed t test p value is shown. e, H358 cells with dox-inducible HA-KRASG12C were treated with dox (2 μg/mL) for 24h in serumfree medium. Then, the cells were exposed to either EGF (200 ng/mL) followed by the G12Ci (10 μM), or vice versa. Cell extracts were analyzed by RBD pull-down and immunoblotting. The specific effect on KRASG12C was determined by the HA-tag. A representative of at least two independent experiments is shown in b, d, e. Unless otherwise indicated n denotes biological replicates.
Extended Data Fig. 10. Rapid non-uniform adaptation to conformation-specific KRASG12C inhibition.
Left: At baseline, KRASG12C cycles between its active (GTP-bound) and inactive (GDP-bound) conformations. Active KRASG12C engages effector signaling, which regulates a transcriptional repertoire (i.e. KRAS-output) responsible for controlling various cellular functions. Middle: Shortly after exposure to G12Ci-treatment, KRASG12C is trapped in its inactive state, and eventually the cancer cell population is sequestered in a low-KRAS-output state. These cells stop proliferating and enter quiescence (G0). Right: In time, some cells undergo cell-death, while others adapt to the G12Ci to reactivate KRAS-transcriptional output, bypassing drug-induced quiescence to resume proliferation. Our model suggests that this occurs because cells with low KRAS output produce new KRASG12C protein, which is not bound by the drug. Then, upstream signals operating in distinct cancer cell subpopulations, such as those mediated by EGFR or AURKA, maintain the new protein in its active/drug-insensitive state. By comparison, in cells where these upstream signals are not active (or in cells where these signals are pharmacologically inactivated), the new KRASG12C spends a longer time in its inactive conformation, where it can be bound by the drug and be inhibited. This multifactorial process gives rise to a non-uniform treatment response with diverging effects across the cancer cell population.
Supplementary Material
Acknowledgements:
The authors thank Charles Sawyers and Megan Mroczkowski for their insight on the manuscript. The authors also thank Ralph Garippa for his advice on the CRISPR screen and Prasad Jallepalli for his help with the interpretation of the AURK findings. This work has been supported in part by the NIH/NCI (1R01CA23074501 to P.L., 1R01CA23026701A1 to P.L.; K08CA191082-01A1 to P.L. and 1F30CA232549-01 to J.X.). P.L. is also supported in part by The Pew Charitable Trusts, the Damon Runyon Cancer Research Foundation and the American Lung Association. E.d.S. is supported in part by the MSKCC Pilot Center for Precision Disease Modeling program (U54 OD020355). D.R. is supported by Programma per Giovani Ricercatori Rita Levi Montalcini granted by the Italian Ministry of Education, University, and Research. The authors acknowledge the Josie Robertson Investigator Program at MSKCC, a Medical Scientist Training Program grant to the Weill Cornell-Rockefeller-Sloan Kettering Tri-Institutional MD-PhD Program (T32GM007739) and the MSKCC Support Grant-Core Grant program (P30 CA008748).
Footnotes
The authors declare no competing interests. MSKCC has received research funds from companies developing G12C inhibitors and has confidentiality agreements with these companies. A part of these funds is allocated for research to be conducted in the P.L. lab. No such funds were used to support the work in this paper. All the experiments in this paper were performed with commercially available inhibitors and the drugs pertaining to the noted research funding were not reported in this study. P.L. has not received honoraria, consultation fees, stock options or travel reimbursement from any company.
Data availability
The data that support the findings of this study are available within the paper and its supplementary information files. The scRNAseq data have been deposited in the Gene Expression Omnibus (GEO) with the accession code GSE137912. Data or other materials are available upon reasonable request.
Code availability
The analysis was performed using standard protocols with previously described computational tools. The scripts, along with the processed files described in the methods, are available upon reasonable request.
References:
- 1.Pylayeva-Gupta Y, Grabocka E & Bar-Sagi D RAS oncogenes: weaving a tumorigenic web. Nature reviews. Cancer 11, 761–774, doi: 10.1038/nrc3106 (2011). [DOI] [PMC free article] [PubMed] [Google Scholar]
- 2.Li S, Balmain A & Counter CM A model for RAS mutation patterns in cancers: finding the sweet spot. Nat Rev Cancer 18, 767–777, doi: 10.1038/s41568-018-0076-6 (2018). [DOI] [PubMed] [Google Scholar]
- 3.Ostrem JM, Peters U, Sos ML, Wells JA & Shokat KM K-Ras(G12C) inhibitors allostericaNy control GTP affinity and effector interactions. Nature 503, 548–551, doi: 10.1038/nature12796 (2013). [DOI] [PMC free article] [PubMed] [Google Scholar]
- 4.Patricelli MP et al. Selective Inhibition of Oncogenic KRAS Output with Small Molecules Targeting the Inactive State. Cancer discovery 6, 316–329, doi: 10.1158/2159-8290.CD-15-1105 (2016). [DOI] [PubMed] [Google Scholar]
- 5.Lito P, Solomon M, Li LS, Hansen R & Rosen N Allele-specific inhibitors inactivate mutant KRAS G12C by a trapping mechanism. Science 351, 604–608, doi: 10.1126/science.aad6204 (2016). [DOI] [PMC free article] [PubMed] [Google Scholar]
- 6.Simanshu DK, Nissley DV & McCormick F RAS Proteins and Their Regulators in Human Disease. Cell 170, 17–33, doi: 10.1016/j.cell.2017.06.009 (2017). [DOI] [PMC free article] [PubMed] [Google Scholar]
- 7.Hunter JC et al. Biochemical and Structural Analysis of Common Cancer-Associated KRAS Mutations. Mol Cancer Res 13, 1325–1335, doi: 10.1158/1541-7786.MCR-15-0203 (2015). [DOI] [PubMed] [Google Scholar]
- 8.Zeng M et al. Potent and Selective Covalent Quinazoline Inhibitors of KRAS G12C. Cell Chem Biol 24, 1005–1016 e1003, doi: 10.1016/j.chembiol.2017.06.017 (2017). [DOI] [PubMed] [Google Scholar]
- 9.Janes MR et al. Targeting KRAS Mutant Cancers with a Covalent G12C-Specific Inhibitor. Cell 172, 578–589 e517, doi: 10.1016/j.cell.2018.01.006 (2018). [DOI] [PubMed] [Google Scholar]
- 10.Corcoran RB et al. EGFR-mediated re-activation of MAPK signaling contributes to insensitivity of BRAF mutant colorectal cancers to RAF inhibition with vemurafenib. Cancer discovery 2, 227–235, doi: 10.1158/2159-8290.CD-11-0341 (2012). [DOI] [PMC free article] [PubMed] [Google Scholar]
- 11.Prahallad A et al. Unresponsiveness of colon cancer to BRAF(V600E) inhibition through feedback activation of EGFR. Nature 483, 100–103, doi: 10.1038/nature10868 (2012). [DOI] [PubMed] [Google Scholar]
- 12.Lito P, Rosen N & Solit DB Tumor adaptation and resistance to RAF inhibitors. Nature medicine 19, 1401–1409, doi: 10.1038/nm.3392 (2013). [DOI] [PubMed] [Google Scholar]
- 13.Grun D & van Oudenaarden A Design and Analysis of Single-Cell Sequencing Experiments. Cell 163, 799–810, doi: 10.1016/j.cell.2015.10.039 (2015). [DOI] [PubMed] [Google Scholar]
- 14.Stuart T & Satija R Integrative single-cell analysis. Nat Rev Genet, doi: 10.1038/s41576-019-0093-7 (2019). [DOI] [PubMed] [Google Scholar]
- 15.Risso D, Perraudeau F, Gribkova S, Dudoit S & Vert JP A general and flexible method for signal extraction from single-cell RNA-seq data. Nat Commun 9, 284, doi: 10.1038/s41467-017-02554-5 (2018). [DOI] [PMC free article] [PubMed] [Google Scholar]
- 16.Trapnell C et al. The dynamics and regulators of cell fate decisions are revealed by pseudotemporal ordering of single cells. Nat Biotechnol 32, 381–386, doi: 10.1038/nbt.2859 (2014). [DOI] [PMC free article] [PubMed] [Google Scholar]
- 17.Street K et al. Slingshot: cell lineage and pseudotime inference for single-cell transcriptomics. BMC Genomics 19, 477, doi: 10.1186/s12864-018-4772-0 (2018). [DOI] [PMC free article] [PubMed] [Google Scholar]
- 18.Cheung TH & Rando TA Molecular regulation of stem cell quiescence. Nat Rev Mol Cell Biol 14, 329–340, doi: 10.1038/nrm3591 (2013). [DOI] [PMC free article] [PubMed] [Google Scholar]
- 19.Oki T et al. A novel cell-cycle-indicator, mVenus-p27K-, identifies quiescent cells and visualizes G0-G1 transition. Sci Rep 4, 4012, doi: 10.1038/srep04012 (2014). [DOI] [PMC free article] [PubMed] [Google Scholar]
- 20.Lemmon MA & Schlessinger J Cell signaling by receptor tyrosine kinases. Cell 141, 1117–1134, doi: 10.1016/j.cell.2010.06.011 (2010). [DOI] [PMC free article] [PubMed] [Google Scholar]
- 21.Drosten M et al. Genetic analysis of Ras signalling pathways in cell proliferation, migration and survival. The EMBO journal 29, 1091–1104, doi: 10.1038/emboj.2010.7 (2010). [DOI] [PMC free article] [PubMed] [Google Scholar]
- 22.Katayama H et al. Phosphorylation by aurora kinase A induces Mdm2-mediated destabilization and inhibition of p53. Nat Genet 36, 55–62, doi: 10.1038/ng1279 (2004). [DOI] [PubMed] [Google Scholar]
- 23.Lim KH et al. Aurora-A phosphorylates, activates, and relocalizes the small GTPase RalA. Molecular and cellular biology 30, 508–523, doi: 10.1128/MCB.00916-08 (2010). [DOI] [PMC free article] [PubMed] [Google Scholar]
- 24.Umstead M, Xiong J, Qi Q, Du Y & Fu H Aurora kinase A interacts with H-Ras and potentiates Ras-MAPK signaling. Oncotarget 8, 28359–28372, doi: 10.18632/oncotarget.15049 (2017). [DOI] [PMC free article] [PubMed] [Google Scholar]
- 25.Gong X et al. Aurora A Kinase Inhibition Is Synthetic Lethal with Loss of the RB1 Tumor Suppressor Gene. Cancer Discov 9, 248–263, doi: 10.1158/2159-8290.CD-18-0469 (2019). [DOI] [PubMed] [Google Scholar]
- 26.Donnella HJ et al. Kinome rewiring reveals AURKA limits PI3K-pathway inhibitor efficacy in breast cancer. Nature chemical biology 14, 768–777, doi: 10.1038/s41589-018-0081-9 (2018). [DOI] [PMC free article] [PubMed] [Google Scholar]
- 27.Shah KN et al. Aurora kinase A drives the evolution of resistance to third-generation EGFR inhibitors in lung cancer. Nature medicine 25, 111–118, doi: 10.1038/s41591-018-0264-7 (2019). [DOI] [PMC free article] [PubMed] [Google Scholar]
- 28.Keen N & Taylor S Aurora-kinase inhibitors as anticancer agents. Nature reviews. Cancer 4, 927–936, doi: 10.1038/nrc1502 (2004). [DOI] [PubMed] [Google Scholar]
- 29.Sunaga N et al. Knockdown of oncogenic KRAS in non-small cell lung cancers suppresses tumor growth and sensitizes tumor cells to targeted therapy. Mol Cancer Ther 10, 336–346, doi: 10.1158/1535-7163.MCT-10-0750 (2011). [DOI] [PMC free article] [PubMed] [Google Scholar]
- 30.Fakih M et al. Phase 1 study evaluating the safety, tolerability, pharmacokinetics (PK), and efficacy of AMG 510, a novel small molecule KRASG12C inhibitor, in advanced solid tumors. Journal of Clinical Oncology 37:15_suppl, 3003–3003 (2019). [Google Scholar]
Additional full text HTML references:
- 31.Klein AM et al. Droplet barcoding for single-cell transcriptomics applied to embryonic stem cells. Cell 161, 1187–1201, doi: 10.1016/j.cell.2015.04.044 (2015). [DOI] [PMC free article] [PubMed] [Google Scholar]
- 32.Macosko EZ et al. Highly Parallel Genome-wide Expression Profiling of Individual Cells Using Nanoliter Droplets. Cell 161, 1202–1214, doi: 10.1016/j.cell.2015.05.002 (2015). [DOI] [PMC free article] [PubMed] [Google Scholar]
- 33.Azizi E et al. Single-Cell Map of Diverse Immune Phenotypes in the Breast Tumor Microenvironment. Cell 174, 1293–1308 e1236, doi: 10.1016/j.cell.2018.05.060 (2018). [DOI] [PMC free article] [PubMed] [Google Scholar]
- 34.van Dijk D et al. Recovering Gene Interactions from Single-Cell Data Using Data Diffusion. Cell 174, 716–729 e727, doi: 10.1016/j.cell.2018.05.061 (2018). [DOI] [PMC free article] [PubMed] [Google Scholar]
- 35.Huber W et al. Orchestrating high-throughput genomic analysis with Bioconductor. Nat Methods 12, 115–121, doi: 10.1038/nmeth.3252 (2015). [DOI] [PMC free article] [PubMed] [Google Scholar]
- 36.McCarthy DJ, Campbell KR, Lun AT & Wills QF Scater: pre-processing, quality control, normalization and visualization of single-cell RNA-seq data in R. Bioinformatics 33, 1179–1186, doi: 10.1093/bioinformatics/btw777 (2017). [DOI] [PMC free article] [PubMed] [Google Scholar]
- 37.Vallejos CA, Risso D, Scialdone A, Dudoit S & Marioni JC Normalizing single-cell RNA sequencing data: challenges and opportunities. Nat Methods 14, 565–571, doi: 10.1038/nmeth.4292 (2017). [DOI] [PMC free article] [PubMed] [Google Scholar]
- 38.Lun AT, McCarthy DJ & Marioni JC A step-by-step workflow for low-level analysis of single-cell RNA-seq data with Bioconductor. F1000Res 5, 2122, doi: 10.12688/f1000research.9501.2 (2016). [DOI] [PMC free article] [PubMed] [Google Scholar]
- 39.Haghverdi L, Buettner F & Theis FJ Diffusion maps for high-dimensional single-cell analysis of differentiation data. Bioinformatics 31, 2989–2998, doi: 10.1093/bioinformatics/btv325 (2015). [DOI] [PubMed] [Google Scholar]
- 40.Rodriguez A & Laio A Machine learning. Clustering by fast search and find of density peaks. Science 344, 1492–1496, doi: 10.1126/science.1242072 (2014). [DOI] [PubMed] [Google Scholar]
- 41.Cannoodt R, Saelens W & Saeys Y Computational methods for trajectory inference from single-cell transcriptomics. Eur J Immunol 46, 2496–2506, doi: 10.1002/eji.201646347 (2016). [DOI] [PubMed] [Google Scholar]
- 42.Van den Berge K et al. Observation weights unlock bulk RNA-seq tools for zero inflation and single-cell applications. Genome Biol 19, 24, doi: 10.1186/s13059-018-1406-4 (2018). [DOI] [PMC free article] [PubMed] [Google Scholar]
- 43.Ritchie ME et al. limma powers differential expression analyses for RNA-sequencing and microarray studies. Nucleic Acids Res 43, e47, doi: 10.1093/nar/gkv007 (2015). [DOI] [PMC free article] [PubMed] [Google Scholar]
- 44.Robinson MD, McCarthy DJ & Smyth GK edgeR: a Bioconductor package for differential expression analysis of digital gene expression data. Bioinformatics 26, 139–140, doi: 10.1093/bioinformatics/btp616 (2010). [DOI] [PMC free article] [PubMed] [Google Scholar]
- 45.Risso D, Ngai J, Speed TP & Dudoit S Normalization of RNA-seq data using factor analysis of control genes or samples. Nat Biotechnol 32, 896–902, doi: 10.1038/nbt.2931 (2014). [DOI] [PMC free article] [PubMed] [Google Scholar]
- 46.Wu D et al. ROAST: rotation gene set tests for complex microarray experiments. Bioinformatics 26, 2176–2182, doi: 10.1093/bioinformatics/btq401 (2010). [DOI] [PMC free article] [PubMed] [Google Scholar]
- 47.Sanson KR et al. Optimized libraries for CRISPR-Cas9 genetic screens with multiple modalities. Nat Commun 9, 5416, doi: 10.1038/s41467-018-07901-8 (2018). [DOI] [PMC free article] [PubMed] [Google Scholar]
- 48.Li W et al. MAGeCK enables robust identification of essential genes from genome-scale CRISPR/Cas9 knockout screens. Genome Biol 15, 554, doi: 10.1186/s13059-014-0554-4 (2014). [DOI] [PMC free article] [PubMed] [Google Scholar]
- 49.Lito P et al. Disruption of CRAF-mediated MEK activation is required for effective MEK inhibition in KRAS mutant tumors. Cancer cell 25, 697–710, doi: 10.1016/j.ccr.2014.03.011 (2014). [DOI] [PMC free article] [PubMed] [Google Scholar]
- 50.Lito P et al. Relief of profound feedback inhibition of mitogenic signaling by RAF inhibitors attenuates their activity in BRAFV600E melanomas. Cancer Cell 22, 668–682, doi: 10.1016/j.ccr.2012.10.009 (2012). [DOI] [PMC free article] [PubMed] [Google Scholar]
- 51.Xue Y et al. An approach to suppress the evolution of resistance in BRAF(V600E)-mutant cancer. Nature medicine 23, 929–937, doi: 10.1038/nm.4369 (2017). [DOI] [PMC free article] [PubMed] [Google Scholar]
- 52.He L et al. Methods for High-throughput Drug Combination Screening and Synergy Scoring. Methods Mol Biol 1711, 351–398, doi: 10.1007/978-1-4939-7493-1_17 (2018). [DOI] [PMC free article] [PubMed] [Google Scholar]
Associated Data
This section collects any data citations, data availability statements, or supplementary materials included in this article.


