Abstract
Tissue sculpting during development has been attributed mainly to cellular events through processes such as convergent extension or apical constriction1,2. Recent work, however, has revealed roles for basement membrane remodelling in global tissue morphogenesis3–5. Upon implantation, the epiblast and extra-embryonic ectoderm of the mouse embryo become enveloped with a basement membrane. Signalling between the basement membrane and these tissues is critical for cell polarization and the ensuing morphogenesis6,7. However, the mechanical role of the basement membrane for post-implantation embryogenesis remains unknown. Here, we demonstrate the importance of spatiotemporally regulated basement membrane remodelling during early embryonic development. Specifically, we show that Nodal signalling directs the generation and dynamic distribution of perforations in the basement membrane by regulating expression of matrix metalloproteinases. This basement membrane remodelling facilitates embryo growth before gastrulation. The establishment of the anterior-posterior axis8,9 further regulates basement membrane remodelling by localizing Nodal signalling, and therefore activity of matrix metalloproteinases and basement-membrane perforations, to the posterior side of the embryo. Perforations on the posterior side are essential for primitive streak extension during gastrulation by rendering the prospective primitive streak’s basement membrane more prone to breaching. Thus spatio-temporally regulated basement membrane remodelling contributes to the coordination of embryo growth, morphogenesis and gastrulation.
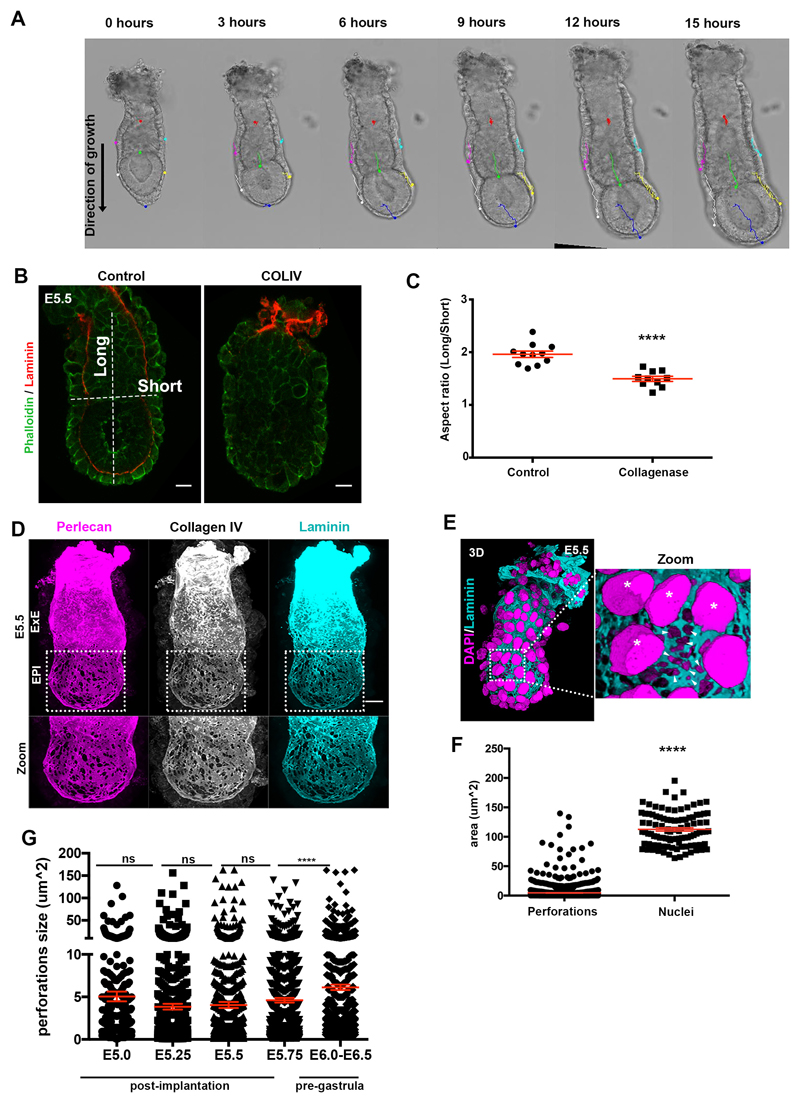
The early post-implantation mouse embryo is a hollowed cylindrical structure, the so-called egg cylinder, which comprises two abutting tissues, the pluripotent epiblast (EPI) and the extra-embryonic ectoderm (ExE), and are overlaid by a layer of another extra-embryonic tissue, the visceral endoderm (VE)10. After implantation, EPI and ExE grow along the embryo’s proximal-distal axis despite being surrounded by a laminin/collagen-rich basement membrane11, which is important to maintain the shape of the embryo (Extended data Fig.1A-C).
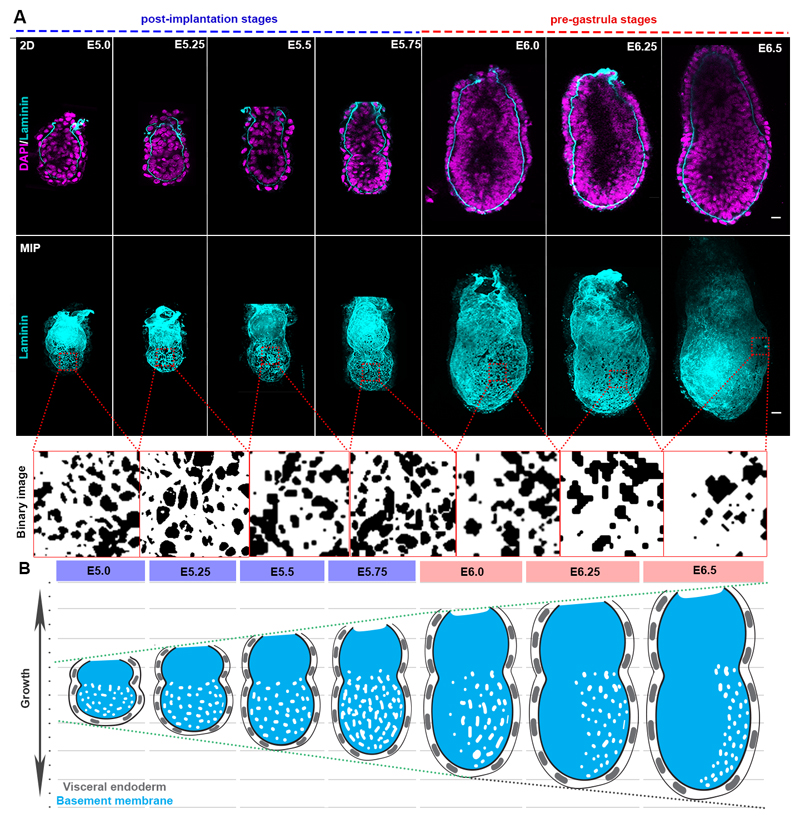
Remarkably, embryo growth occurs with no evidence of basement membrane dissolution until gastrulation. Since a non-deformable basement membrane would present a barrier to tissue expansion, we hypothesized that it must have special features to permit embryo growth. To address this hypothesis, we examined the development of mouse embryos from implantation until gastrulation (E5.0-E6.5) and discovered perforations in the basement membrane surrounding the EPI (Fig. 1A-B, Extended data Fig. 1D), the region that experiences higher forces due to the direction of embryo growth. The great majority of these perforations (99%, n=1502 perforations quantified) were smaller than the average size of cell nuclei, limiting EPI cell transmigration into the VE, reported to occur at the distal part of in vitro cultured embryo (Extended data Fig. 1E-G)12,13. Similar basement membrane perforations have been observed during branching morphogenesis of several embryonic mouse tissues5, but their presence during early post-implantation development was previously unknown.
Figure 1. Basement membrane architecture during pre-gastrula stages.
A) The early post-implantation embryos show a uniform distribution of perforations which becomes progressively asymmetric in the pre-gastrula stages. Binary images (bottom panel) highlight apparent perforations on the basement membrane; n=10 embryos per stage. B) Schematic representation of basement membrane architecture. Grid and dotted line show relative increase in embryo size. Blue-labelled stages: post-implantation stages; Red-labelled stages: pre-gastrula stages.
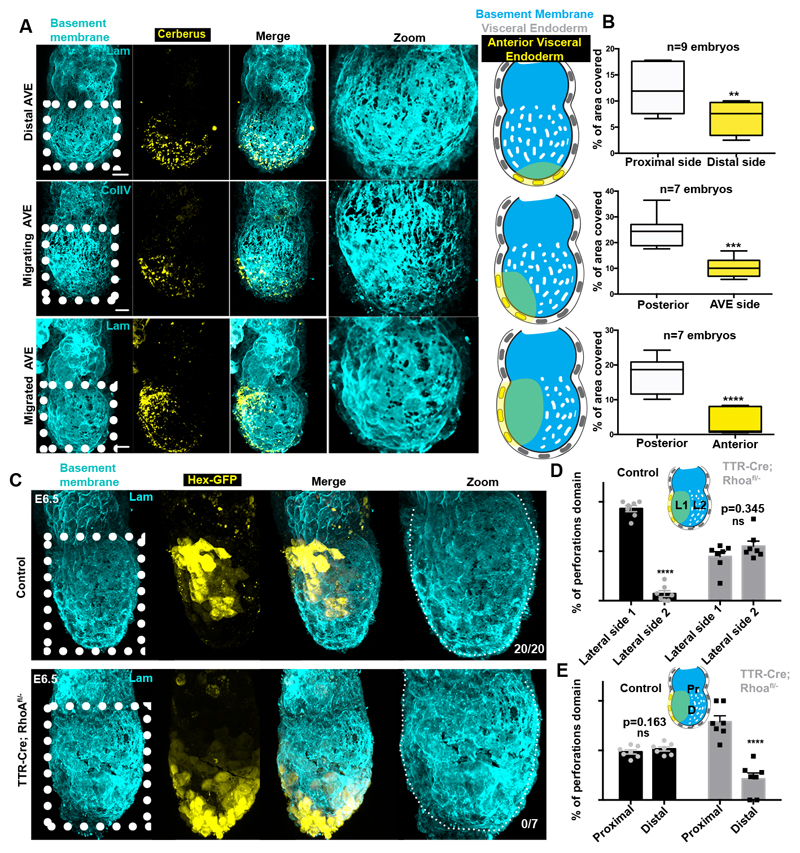
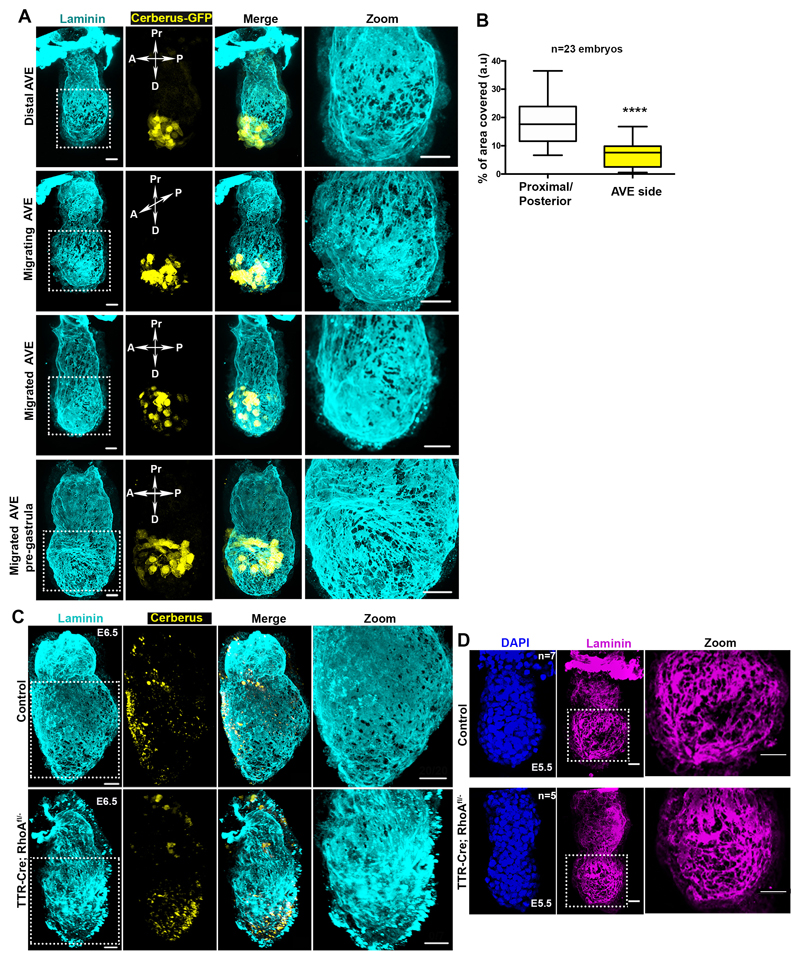
Our analyses revealed that the basement membrane perforations were initially evenly distributed around the EPI but became skewed towards one side of the embryo as it grew (Fig. 1A-B, n=90, Video 1). To assess whether the onset of this asymmetry might follow the establishment of the anterior-posterior (AP) axis, we examined the distribution of perforations relative to the position of the anterior visceral endoderm (AVE), which migrates towards one side of the embryo and initiates AP patterning by inhibiting Nodal and Wnt signalling in adjacent EPI14 (Fig. 2A, Extended data Fig. 2A). We found that the AVE region had fewer basement membrane perforations and upon completion of AVE repositioning, basement membrane perforations were localized on the posterior side (Fig. 2A-B, Extended data Fig. 2A-B, Video 2-4).
Figure 2. AVE positioning and basement membrane remodelling.
A) Correlation of AVE migration (visualised by anti-Cerberus antibody) and basement membrane remodelling. n=40 embryos B) Quantification of basement membrane area covered by perforations at regions away or close to AVE population at different stages of AVE migration. Two tailed unpaired student’s t-test: **p=0.0068; ***p=0.0002, ****p<0.0001; mean±SEM. Centre lines show median values, box limits represent the upper and lower quartiles, and whiskers show min to max range. C) Representative examples of pre-gastrula control and TTR-Cre:Rhoafl/- embryos. Inhibition of AVE migration results in abnormal distribution of basement membrane perforations and their accumulation at the proximal side. n=20 control; n=7 TTR-Cre:Rhoafl/- embryos. Dotted white line outlines embryonic basement membrane. D,E) Quantification of the localization of the domains of perforation. L1/L2=lateral sides 1/2, Pr =proximal, D=distal. Two tailed unpaired student’s t-test: ****p=<0.0001; mean±SEM. n=7 control; n=7 TTR-Cre:Rhoafl/- embryos. Scale bars= 20um.
To test whether AP axis specification regulates the position of perforations, we next examined the consequences of inhibiting AVE migration by disrupting RhoA, which is required for collective cell migration15. To this end, we examined the development of VE-specific RhoA knockout embryos (TTR-Cre:RhoAfl/-). As expected, the AVE migrated unilaterally in control embryos, but remained positioned distally in TTR-Cre:RhoAfl/- embryos (Fig. 2C, Extended data Fig. 2C). Importantly, basement membrane perforations accumulated proximally and failed to localise asymmetrically along an axis perpendicular to the TTR-Cre:RhoAfl/- embryo’s proximal-distal axis (Fig. 2C-E, Extended data Fig. 2C-D). These results indicate that the distribution of basement membrane perforations might be linked to AVE migration and AP axis establishment.
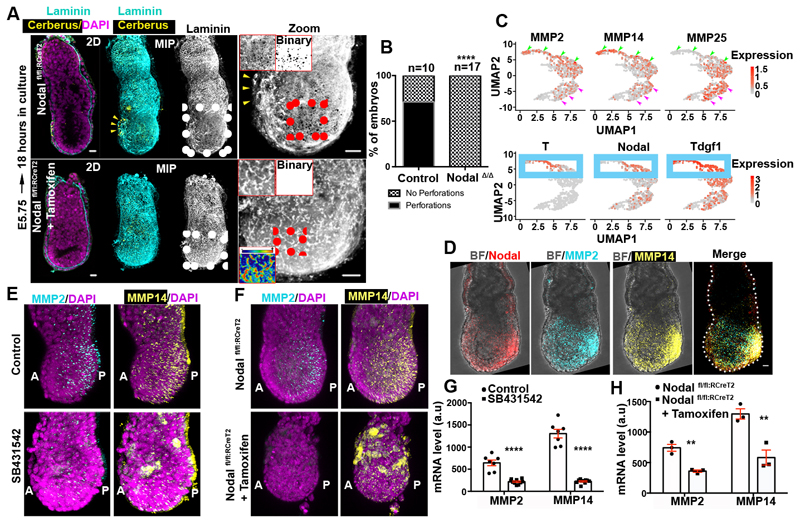
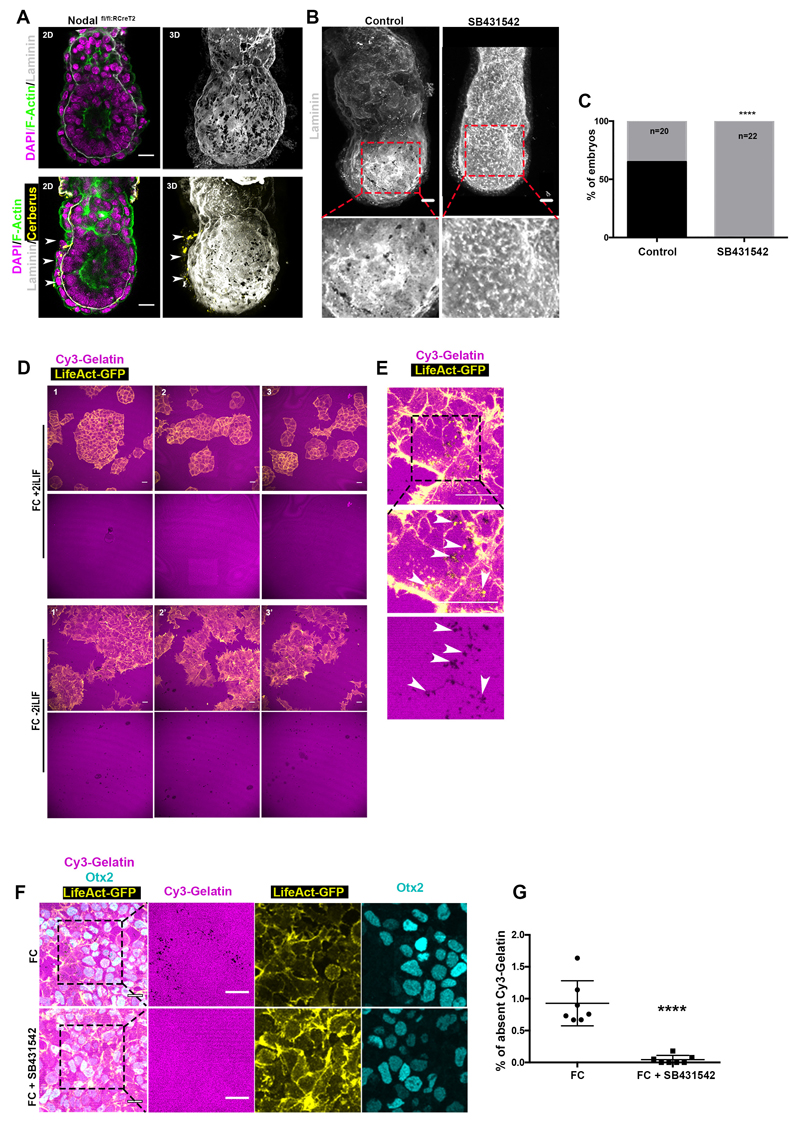
The AVE contributes to the establishment of a Nodal activity gradient across the AP axis8,9, which is instrumental for positioning the primitive streak and initiating gastrulation16. We hypothesised that the AVE-mediated regulation of Nodal signalling could control the distribution of basement membrane perforations. To test this hypothesis, we cultured tamoxifen-inducible Nodal knock-out E5.75 embryos (Nodal fl/fl:RCreT2)17 in the presence of 4-hydroxytamoxifen for 18 hours. We found that Nodal knock-out embryos lacked basement membrane perforations and accumulated laminin around the EPI in contrast to control embryos (Fig. 3A-B; Extended data Fig. 3A). Pharmacological inhibition of Nodal resulted in a similar phenotype (Extended data Fig. 3B-C). These results indicate that Nodal activity is required for the basement membrane remodelling.
Figure 3. Nodal signalling regulates basement membrane remodelling through regulation of MMPs expression.
A) Control (n=10) and Nodal knock-out (n=17,NodalΔ/Δ) embryos. Yellow arrowheads: AVE region; MIP=maximum intensity projection. Top insets: zoomed EPI with binary image. Lower inset: Intensity colour-coded image revealing the accumulation of basement membrane in NodalΔ/Δ embryos. B) Quantification of basement membrane perforations in control and NodalΔ/Δ embryos. χ2 test: ****p<0.0001. C) Expression levels for MMP2, MMP14 & MMP25 and posterior marker genes (T, Nodal, Tdgf1) are plotted on the UMAP for E6.25 and E6.5 EPI cells (n=527 cells) as analysed from21. Expression values: log(counts). Green arrowheads: posterior EPI, Purple arrowheads: anterior EPI, Blue box lower panel: posterior EPI. D) Whole mount fluorescent RNA in-situ of a representative E6.5 embryo; BF=brightfield; n=5 embryos. E-F) Representative examples of control, Nodal inhibitor-treated and NodalΔ/Δ embryos analysed by whole mount FISH for MMP2 and MMP14 expression. A: anterior, P: posterior. G-H) Quantification of MMP2 and MMP14 mRNA levels in control, Nodal inhibitor-treated (18 hours) and NodalΔ/Δ embryos, two sided unpaired student’s t-test: ****p<0.0001; **MMP2 p=0.0031; **MMP14 p=0.0086; mean±SEM. For (E,G) n=7 control and 10 Nodal inhibitor-treated embryos. For (F,H) n=3 control and 3 NodalΔ/Δ embryos. Scale bars=20um.
We next wished to determine whether the EPI is sufficient to induce basement membrane remodelling. To this end, we used embryonic stem cells (ESCs), which model the transcriptional profile of the early post-implantation EPI18. Thus, we plated ESCs on fluorescent gelatin (Cy3-Gelatin), as an artificial substitute for the basement membrane and induced pluripotency exit in ESCs by removing the pluripotency maintenance factors LIF and 2i (CHIR99021 and PD0325901) (Extended data Fig. 3D-F). Under these conditions, ESCs induced perforations in gelatin whereas they failed to do so in the presence of 2i-LIF ESCs (Extended data Fig. 3D-E). Thus, ESCs cultured in an early post-implantation-like state can remodel the underlying extracellular matrix (ECM). Treatment with the Nodal inhibitor SB431542 blocked the formation of perforations in the gelatin layer, confirming that Nodal signalling is required for basement membrane remodelling in vitro and in vivo (Extended data Fig. 3F-G). These data suggest that ESCs can directly remodel the basement membrane in a Nodal-dependent manner upon pluripotency exit.
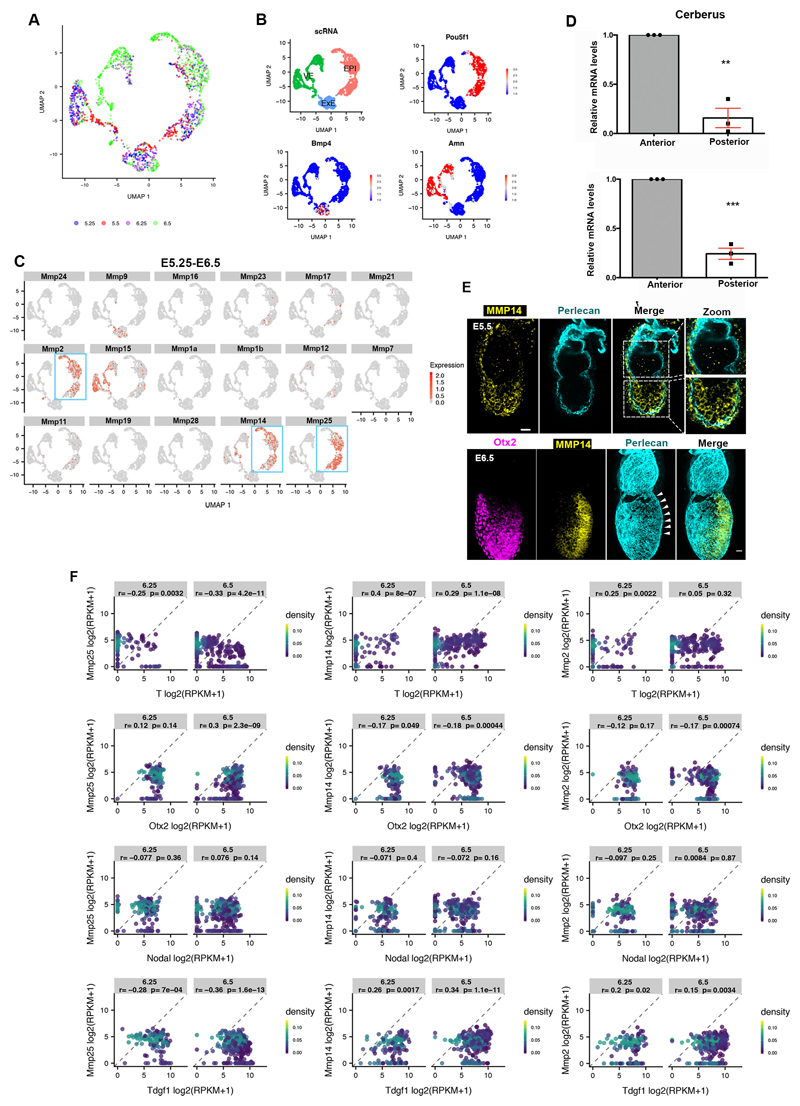
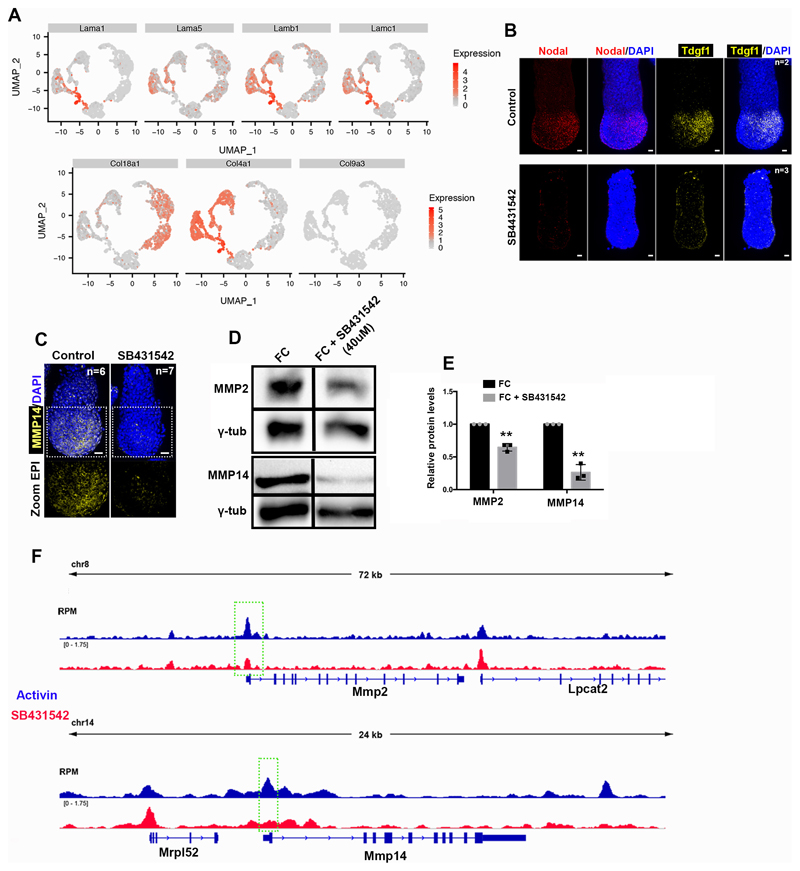
The matrix metalloproteinase (MMPs) family of proteins promote basement membrane breakdown in various cell types. MMPs are instrumental in enabling cancer metastasis19,20 and the developmental remodelling of basement membranes20. Since inhibition of MMPs impairs the formation of basement membrane perforations in mouse salivary glands5, we considered that MMPs might be involved in generating basement membrane perforations during mouse embryogenesis. To test this, we analysed the expression of the MMP family members during post-implantation development using a single cell sequencing data-set21 (Extended data Fig. 4A-B). To select target genes, we set three criteria. First, the candidate MMP genes had to be expressed in the EPI throughout post-implantation development. Second, MMP candidate genes had to show posterior localization of their expression in pre-gastrula stages in a similar position to the basement membrane perforations. Finally, the MMP candidate gene products had to be able to cleave both laminin and collagen. Our analysis revealed that three MMP genes (MMP2, MMP14, MMP25) are expressed in the EPI of post-implantation embryos (Extended data Fig. 4C). Of these candidate genes, only MMP2 and MMP14 are expressed in the posterior region in the pre-gastrula stage (Fig. 3C-D, Extended data Fig. 4D-F). Furthermore, while MMP2 and 14 are able to cleave both laminin and collagens22, MMP25 cleaves only collagen but not laminin23. Based on these findings we excluded MMP25 as a candidate gene product and focused on MMP2 and MMP14.
We found that ECM components have no preferential anterior expression in the EPI or the VE upon redistribution of perforations to the embryo’s posterior side (Extended data Fig. 5A)21, suggesting that the expression of ECM components is not regulated by Nodal signalling. Thus, the loss of basement membrane perforations in Nodal knock-out embryos cannot be accounted for by increased expression of constituent ECM proteins, in agreement with previous results showing that the expression of ECM components surrounding the EPI is not affected in Smad4 knock-out embryoid bodies24. The fact that Nodal signalling regulates basement membrane remodelling and that expression of MMP2, MMP14, and genes involved in Nodal signalling follow the same pattern led us to hypothesize that Nodal regulates the expression of MMPs. To test this hypothesis, we examined the expression of MMP2 and MMP14 in control, Nodal inhibitor (SB431542)-treated and Nodal knock-out embryos. Our analyses indicated that Nodal regulates MMP2 and MMP14 expression during post-implantation development (Fig. 3E-H, Extended data Fig. 5B-C). In accord with these results, MMP2 and MMP14 levels were also reduced in ESCs treated with Nodal inhibitor upon exit from pluripotency (Extended data Fig. 5D-E). To examine whether Nodal regulates MMP2 and MMP14 expression directly, we analysed Smad2/3 Chip-seq data sets25, generated using embryoid bodies treated with Activin to activate Nodal or with SB431542 to inhibit Nodal. This analysis indicated that Smad2/3 binds to the promoters of MMP2 and MMP14 in a Nodal dependent manner (Extended data Fig. 5F). In agreement with these results, MMP14 was shown to be downregulated in Smad4 knock-out embryoid bodies24. Our results indicate that Nodal signalling directly regulates expression of MMP2 and MMP14 through Smad2/3 during early post-implantation development, although it is possible that independent mechanisms regulated by Nodal signalling can also contribute to the regulation of MMPs expression.
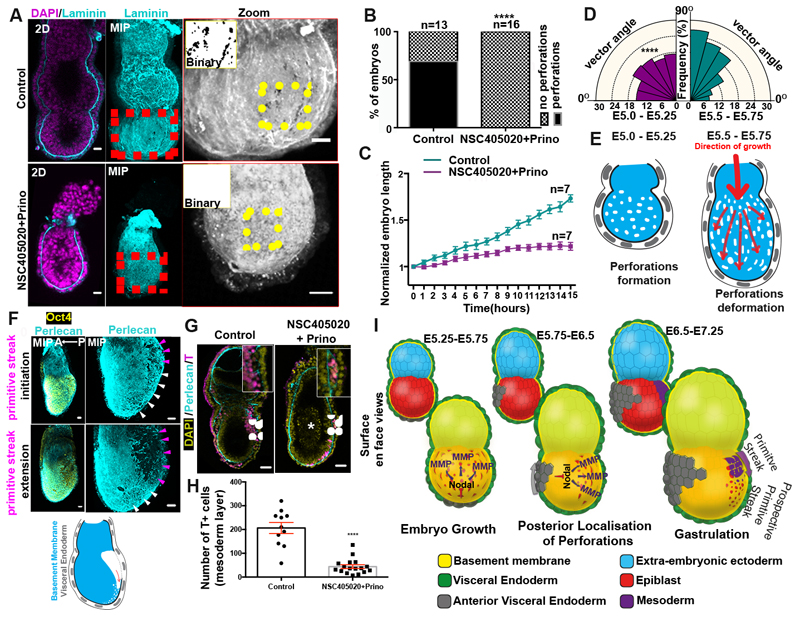
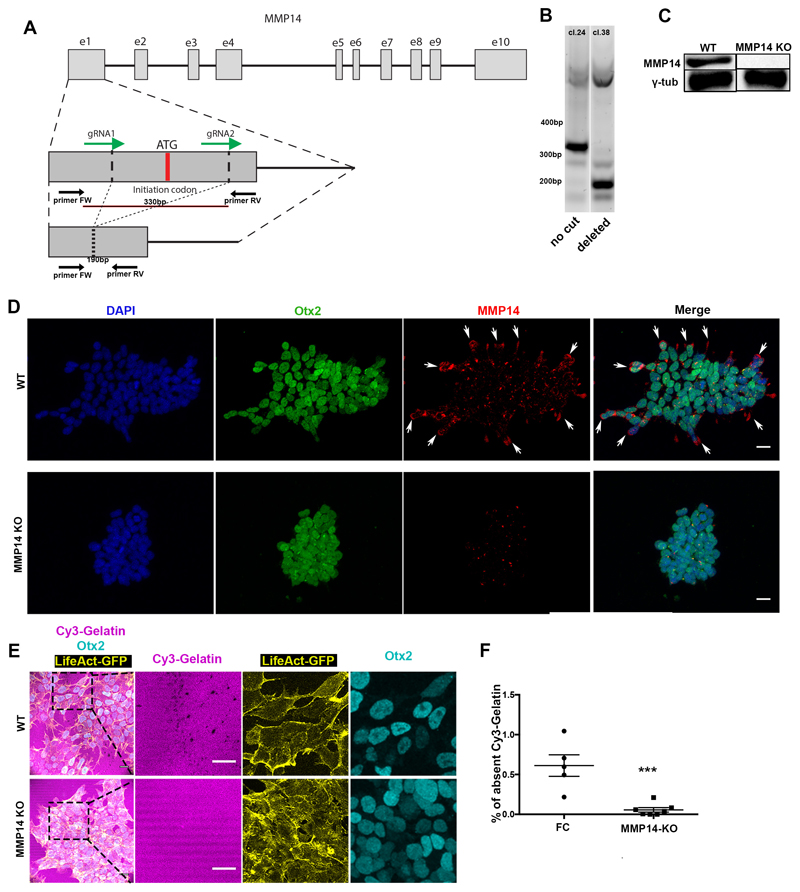
If our hypothesis is correct and Nodal drives basement membrane remodelling by promoting MMP expression, we would expect that MMP activity would be required to remodel the underlying ECM. To address whether this is the case, we generated MMP14 knock-out ESCs and plated them on gelatin (Extended data Fig. 6A-D). We found that upon exit from pluripotency, the MMP14 knock-out ESCs failed to generate perforations in the gelatin, unlike the wild-type control (Extended data Fig. 6E-F). Since MMP14 is also an activator of MMP219, these data indicate that abrogating two major MMPs is sufficient to block perforations in vitro. In vivo, however, neither MMP14 single knock-out nor MMP2/14 double knock-out embryos have been reported to show early developmental phenotypes26,27. Since enzymatic redundancy among MMP family members can mask developmental phenotypes26,27, we next sought to investigate the role of MMPs in basement membrane remodelling by inhibiting MMPs pharmacologically. To this end, we cultured E5.75 embryos for 18 hours in the presence of the broad spectrum MMP inhibitor, Prinomastat28 complemented with the MMP14 specific inhibitor NSC405020, which inhibits MMP14 homodimerization necessary for its collagenolytic function29. Embryos treated with MMP inhibitors lacked basement membrane perforations and phenocopied the basement membrane architecture of Nodal knock-out embryos (Fig. 4A-B).
Figure 4. MMP-mediated basement membrane remodelling permits growth and primitive streak extension.
A) Control(n=13) and MMP inhibitors-treated embryos(n=16). B) Quantification of basement membrane perforations. χ2 test: ****p<0.0001. C) Quantification of embryo length over time. mean±SEM. D) Rose diagrams for vectors angles in E5.0-E5.25 (before growth) and E5.5-E5.75 (during growth) embryos. E5.0-E5.25: n=10 embryos, 1288 vectors; E5.5-E5.75: n=10 embryos, 1481 vectors. Kolmogorov-Smirnov test: ****p<0.0001. E) Model for the correlation between basement membrane perforations and embryo growth. F) Representative E6.5 embryos. White arrowheads: prospective Primitive streak (PS). Purple arrowheads: PS/breached basement membrane. n= 30 embryos. Schematic: ‘run in the stocking’ model for PS extension along the perforations’ domain G) Representative examples of embryos cultured (18 hours) from early E6.5 (pre-PS stage); Scale bars:50um; White arrows: PS; White asterisk: dead cells. H) Quantification of gastrulation progression. Two sided unpaired student’s t-test; ****p<0.0001; mean±SEM. n for G and H=11 control, 17 MMP inhibitor-treated embryos I) Model for regulation of basement membrane remodelling until gastrulation. Scale bars for A,C,H = 20um.
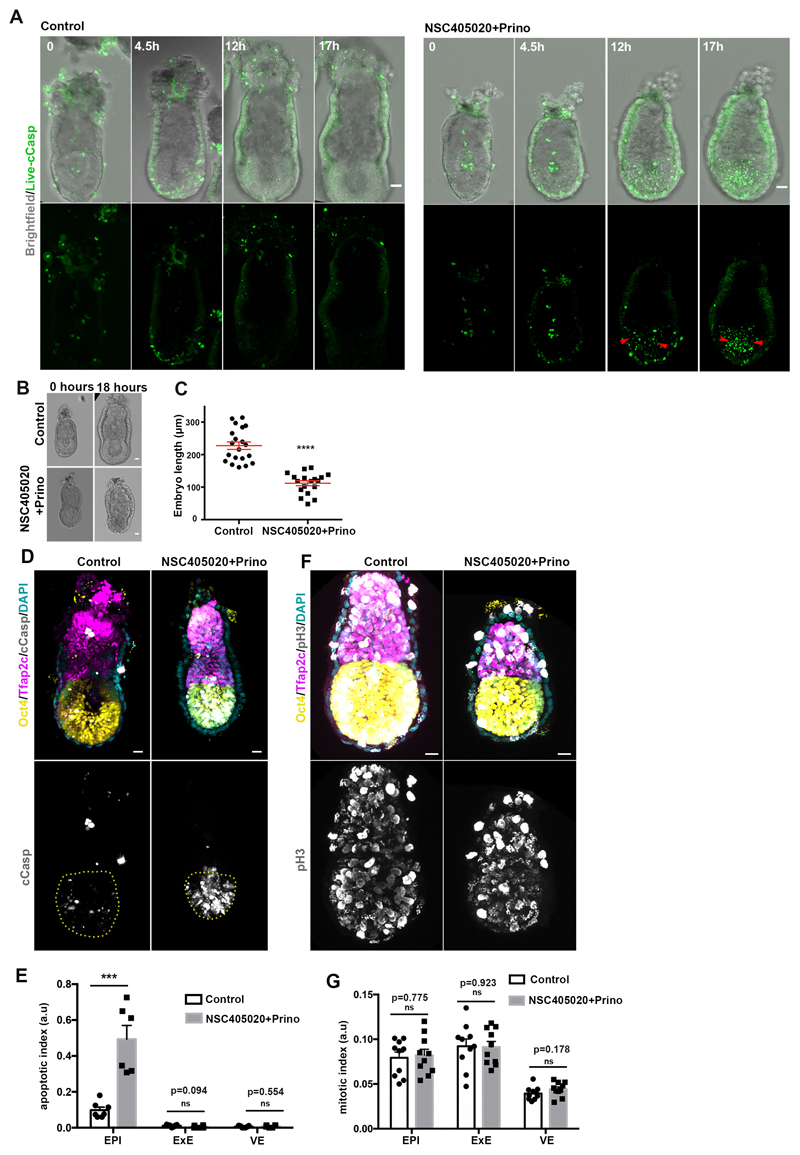
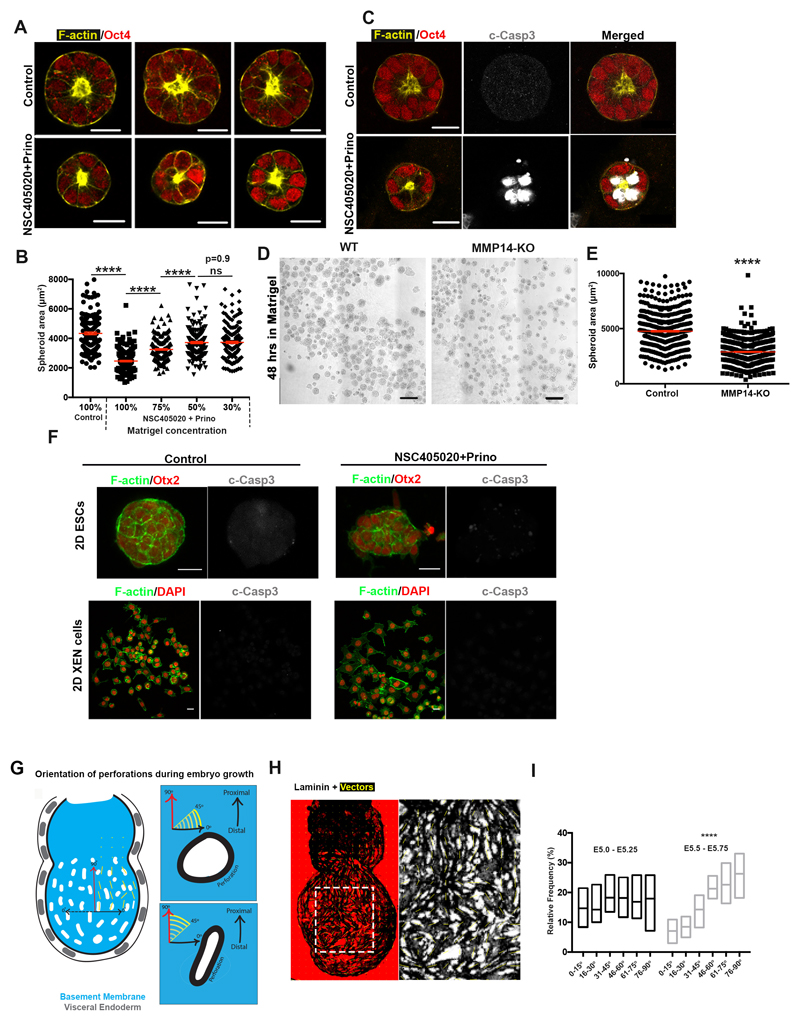
Since our results indicated that MMP inhibition also led to reduced growth and increased apoptosis in the EPI (Fig. 4C, Extended data Fig. 7A-G, Video 5-6), we also examined ESCs growth in 3D, which recapitulates the growth of the post-implantation EPI30. We found that broad inhibition of MMP activity or genetic loss of MMP14 led to significantly reduced growth of ESC spheroids and increased apoptosis (Extended data Fig. 8A-E). To evaluate the possibility that the inhibitor treatment is toxic, we treated ESCs and extra-embryonic endoderm stem cells (XEN cells) in 2D cultures with the same concentration of inhibitors. We found that MMP inhibition had no effect on cell survival (Extended data Fig. 8F), suggesting that phenotypes observed in embryos and ESCs cultured in 3D are specific to growth restriction. In support of the latter, we could partially rescue the growth deficiency of ESC spheroids treated with MMP inhibitors by reducing the concentration of Matrigel (Extended data Fig. 8B). Together, these results suggest that MMPs through generation of basement membrane perforations lead to reduced cellular confinement allowing embryonic growth.
The above data and suggested that basement membrane perforations might make the basement membrane able to accommodate tissue growth, allowing deformation in the presence of forces along the embryo growth axis. To examine this possibility, we generated vector maps on maximum intensity projection images of the basement membrane to approximate how the perforations are distributed in the embryo with respect to its long axis (denoting direction of stretch during growth) (Extended data Fig. 8G-H). We found that the orientation of the long axis of perforations was skewed towards alignment with the embryo’s growth axis (Fig. 4D, Extended data Fig. 1A, 8I), suggesting that deformation of the perforations may indeed accommodate embryo expansion (Fig. 4E).
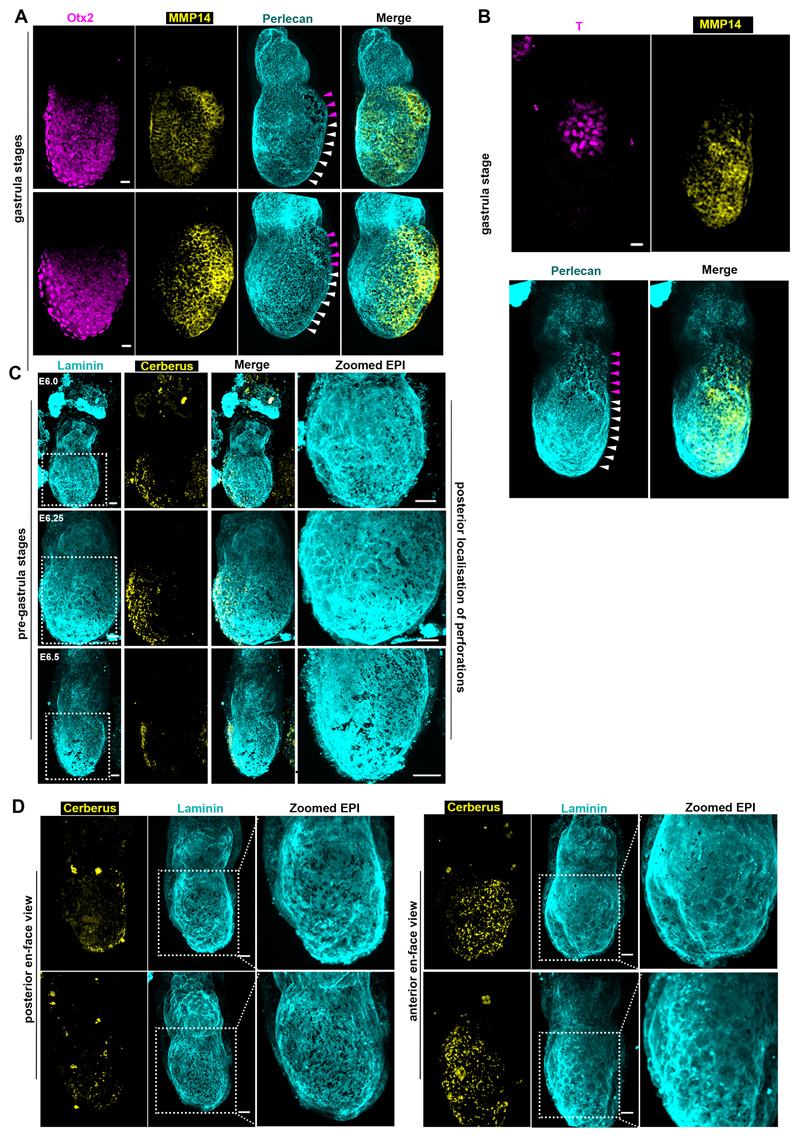
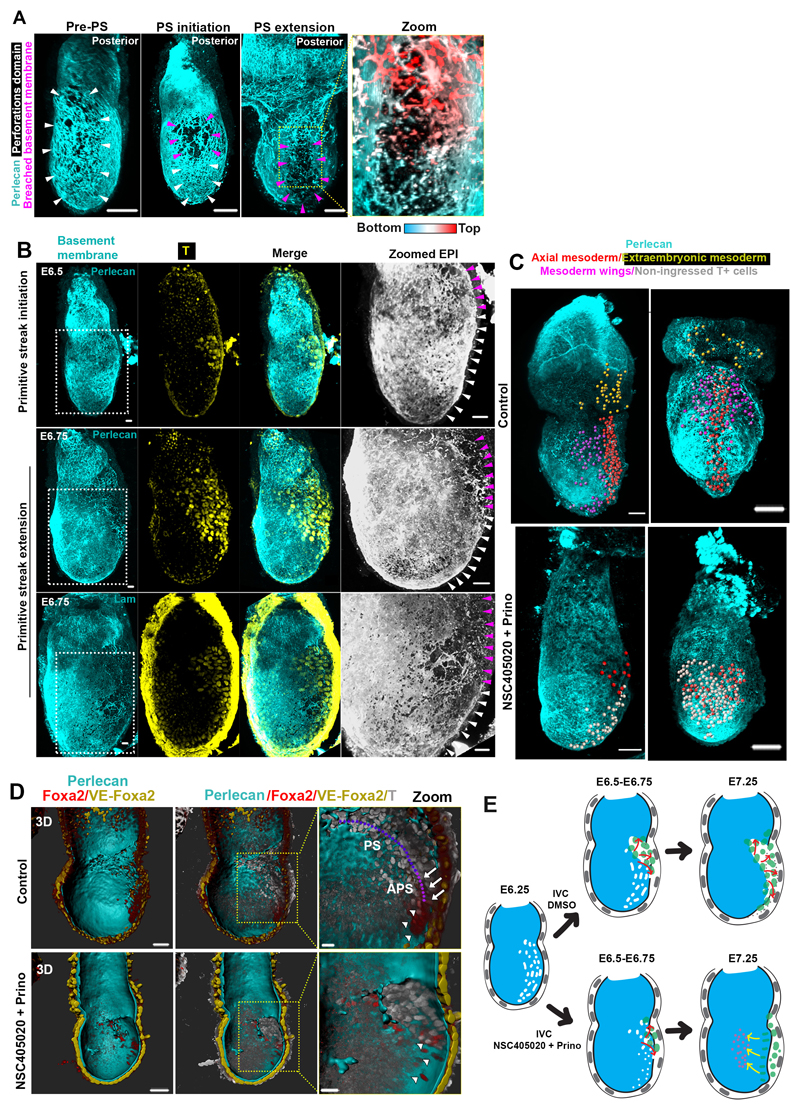
As the embryo grows and establishes its AP axis, it becomes prepared for gastrulation. Immediately before and during gastrulation, the expression of MMPs and basement membrane perforations localize at the posterior side of the embryo, where Nodal is expressed31 (Fig.3 C-D, Extended data Fig. 9A-D, Video 2-4). The presence of perforations at the posterior from 12 hours before the initiation of gastrulation (Extended data Fig, 9C), suggest that basement membrane perforations might permit the formation of the primitive streak. In accord with this possibility, we observed that proximo-posterior breaching of the basement membrane, denoting the initiation of gastrulation, aligned with the perforations (Fig. 4F, Extended data Fig. 10A-B, Video 7). Based on these observations, we hypothesized that the perforations at the position of the prospective primitive streak might render the basement membrane more prone to breakage to facilitate gastrulation (Fig. 4F, bottom panel). This can be explained by the ‘run in the stocking model’, which proposes that localized remodelling of the basement membrane leads to its weakening at a specific domain, which will open and expand upon exposure to tension induced by tissue growth32. To test whether this model could apply to primitive streak progression, we cultured E6.5 embryos in the presence of MMP inhibitors, just prior to initiation of primitive streak. We found that inhibition of MMPs led to incomplete mesoendoderm (T-expressing cells) ingression, defective primitive streak extension, and, consequently, the failure of gastrulation. This failure of the primitive streak to extend resulted in the accumulation of mesoendoderm cells in the EPI, the presence of dead cells in the pro-amniotic cavity, and the lack of extra-embryonic mesoderm, anterior primitive streak, and of any laterally migrating mesoderm (Fig. 4G-H, Extended data Fig. 10 C-E, Video 8-11). These results suggest that the perforations in the posterior domain of the basement membrane are important to enable primitive streak extension and normal gastrulation.
In conclusion, we have uncovered a previously unknown mechanism linking the remodelling of the basement membrane with Nodal signalling and the establishment of the AP axis (Fig. 4I). We show that at early post-implantation stages, basement membrane perforations are evenly distributed accommodating embryo growth. These perforations are produced through MMP expression. As the AVE migrates to future anterior, Nodal activity becomes restricted to the opposite side enriching MMP expression and thus perforations in the future posterior. Finally, the perforations persist after initiation of gastrulation to line the prospective primitive streak. This pre-patterning of the basement membrane at the site of the primitive streak is important for correct progression of gastrulation and primitive streak extension. Thus remodelling of the basement membrane co-ordinates the embryo’s growth and morphogenesis to enable proper gastrulation.
Material and Methods
Embryo recovery and culture
In accordance with national and international guidelines, the mice used were kept in the animal facility. All experiments performed have been regulated by the Animals (Scientific Procedures) Act 1986 Amendment Regulations 2012 and additional ethical review by the University of Cambridge Animal Welfare and Ethical Review Body (AWERB). Experiments were authorised by the Home Office (Licence number: 70/8864). Upon any identification of health concern, mice were culled by cervical dislocation.
Embryos were recovered from wild type MF1 and CD1 female mice mated with MF1 males, dissected out of deciduae and transferred in drops of culture medium (Advanced DMEM/F12 (Thermo Fisher Scientific, 12634-010) with 30% FBS (Stem Cell Institute, Cambridge, UK) and supplemented with 2mM L-Glutamine (Life Technologies, 35050-038), 1mM sodium pyruvate (Life Technologies, 11360039), penicillin (25 units/ml)/streptomycin (25ug/ml) (Thermo Fisher Scientific, 15140122), 1x Insulin-Transferrin-Selenium-Ethanolamine (ITS-X; Thermo Fisher Scientific, 51500056) for overnight culture or directly fixed in 4% PFA (Electron Microscopy Sciences, 11586711; diluted in 1X phosphate buffered saline; PBS) for 20 minutes at room temperature or 100% Methanol for 15 minutes at -20°C (for MMP14 staining). Embryos cultured for imaging, were transferred to drops of medium on a glass bottom dish (MatTek, P35G-1.5-14-C) covered with mineral oil (Biocare, 9305). For MMP-inhibited embryo culture a combination of MMP inhibitors NSC405020 (Tocris, 4902; 100uM) and Prinomastat hydrochloride (Sigma-Aldrich, PZ0198; 20uM) was used overnight (18 hours). For visualising cell death in MMP inhibitor-treated embryos in culture during live imaging the cleaved caspase live dye CellEvent Caspase-3/7 Green Detection Reagent (Thermo, C10723) was used at a concentration of 1uM.
For the enzymatic removal of the basement membrane, embryos were cultured in the presence of Collagenase IV (500ug/ml) for 3 hours and then transferred in cultured medium supplemented with 50ug/ml Collagenase IV 15 hours.
To induce deletion of Nodal in the Nodalfl/fl:RCreT2, recovered embryos were cultured in 2uM of (Z)-4-hydroxytamoxifen (in ethanol; Abcam, ab141943). Genotyping of single embryos following conversion of Nodalfl/fl:RCreT2 was done using primers for detecting Cre and primers for the wildtype and floxed allele:
Cre: Forward primer: 5’-GCAGAACCTGAAGATGTTCGC-3’, Reverse primer: 5’-AGGTATCTCTGACCAGAGTCA-3’
Wildtype and floxed allele: Forward primer: 5’-ATGATTGTGGAGGAGTGTGGGTGC-3’, Reverse primer: 5’-TCTCTGGCTTGGCAGGTCTAAG-3’.
Knockout embryos had a Cre band and were homozygous for the floxed allele. Embryos were cultured at 37°C in 5% CO2.
Visceral endoderm-specific RhoA KOs
RhoAfl/fl females were crossed with RhoAwt/-:TTR-Cre males. Single embryo genotyping for the Rhoafl/-:TTR-Cre was performed using one set of primers to check for presence of Cre and another for detecting wildtype and floxed allele:
Cre: Forward primer: 5’-GCAGAACCTGAAGATGTTCGC-3’, Reverse primer: 5’-AGGTATCTCTGACCAGAGTCA-3’
Wildtype and floxed allele: Forward primer: 5’-GACCAGCCTCTTGACCGATTTA-3’, Reverse primer: 5’-TGTGGGATACCGTTTGAGCAT-3’.
Knockout embryos had a Cre band and were homozygous for the floxed allele. Embryos were cultured at 37°C in 5% CO2.
Immunostaining
4% PFA-fixed embryos were first permeabilized for 30 minutes in 0.3% Triton X- 100 / 0.1M Glycin in PBS at room temperature. Methanol-fixed sample was not further permeabilized. The primary antibodies were added to the permeabilized embryos (washed three times in PBS) in blocking buffer (0.1% Tween-20 / 10% filtered FCS in PBS) at 4°C overnight. The primary antibodies were washed out by washing the embryos three times in PBS before adding the secondary antibodies in blocking buffer for 3-4 hours at room temperature.
Primary antibodies
E-cadherin (1:300; Thermofisher Scientific, 13-1900), Oct4 (1:400; Santa Cruz Biotechnologies, sc-5279), Tfap2c (1:200; Santa Cruz, Santa Cruz Biotechnologies sc-8977)Laminin (1:400; Sigma, L9393), Collagen IV (1:100; Millipore, AB769), HSPG2 (1:100; Millipore, MAB1948P), Otx2 (1:100; R&D Systems, AF1979), Cerberus (1:500; R&D Systems, MAB1986), Foxa2 (1:200; Cell Signalling Technologies, D56D6), T/Brachyury (R&D Systems, MAB1556), c-Casp3 (1:200; Cell Signalling Technologies, 9664S), MMP14 (1:150; Abcam, ab51074).
Secondaries antibodies
Alexa 488 donkey anti-mouse (1:500; Thermo Fisher Scientific, A21202), Alexa 594 donkey anti-rat (1:500; Thermo Fisher Scientific, A21209), Alexa 647 donkey anti-rabbit (1:500; Thermo Fisher Scientific, A31573), Alexa 488 donkey anti-goat (1:500; Thermo Fisher Scientific, A11055).
F-actin staining
Phalloidin 488 (1:500; Thermo Fisher Scientific, A12379). Nuclear staining: minimum 30 minutes incubation in DAPI (Thermo Fisher Scientific, D3571) + PBS (5mg/ml).
Cell culture
E14 and LifeAct-GFP ESCs (MMP14-KO or wild type) were used for this study. ESCs were cultured on 1% gelatin-coated dishes (Sigma-Aldrich, G2500) in the presence of 2i (3uM GSK3 inhibitor CHIR99021 (Stem Cell Institute, Cambridge, UK), 1uM MEK inhibitor PD0325901 (Stem Cell Institute, Cambridge, UK) and 10ng/ml mouse LIF (Biochemistry Department, University of Cambridge). E14 base medium used was N2B27 (1:1 v/v DMEM/F12 (Thermo Fisher Scientific, 12634-010) and Neurobasal A (without vitamin A; Life Technologies, 10888-022), 1% v/v B27 supplement (Thermo Fisher Scientific, A1895601), 0.5% v/v N2 (DMEM/F12 (Thermo Fisher Scientific, 12634-010), 2.5mg/ml Insulin(Sigma-Aldrich, I9287), 10mg/ml Apo-transferrin (Sigma-Aldrich, T1147), 0.75% v/v BSA Fraction V (Thermo Fisher Scientific, 15260037), 20ug/ml Progesterone (Sigma-Aldrich, p8783), 1.6mg/ml Putrescine dihydrochloride (Sigma-Aldrich, P5780), 6ug/ml Sodium selenite (Sigma-Aldrich, S5261), 100uM beta-mercaptoethanol (Life Technologies, 31350-010), Penicillin/Streptomycin (Thermo Fisher Scientific, 15140122), GlutaMAX (Life Technologies, 35050-038)). LifeAct-GFP base medium used was feeder cell (FC) medium (DMEM (Life Technologies, 41966052), 15% FBS (Stem Cell Institute, Cambridge, UK), Penicillin/Streptomycin (Thermo Fisher Scientific, 15140122), GlutaMAX (Life Technologies, 35050-038), non-essential aminoacids (Life Technologies, 11140035), Sodium pyruvate (Life Technologies, 11360039), 100UuM beta-mercaptoethanol (Life Technologies, 31350-010)). Cells were passaged by detaching them with 0.05% Trypsin-EDTA (Life Technologies, 25300054) for 3 minutes at 37°C. Trypsinization reaction was neutralized with 4x volume addition of FC medium and cells were collected and spun down at 1000 rcf for 5 minutes. Supernatant was then discarded, and cell pellet was resuspended in base medium and 2i + LIF. Cells were then split 1:10 or 1:20 depending on the cell density. Cells were maintained in conditions to preserve stem cell character and prevent differentiation. The self-renewal properties of WT ESCs were confirmed by immunofluorescence routinely and morphological characterstics. WT ESC colonies maintained a domed morphology and XEN cells showed a mixed morphology of fibroblast-like and rounded cells as expected. All cell lines used in this study were routinely tested for mycoplasma contamination by PCR and confirmed that they were negative for mycoplasma contamination.
ESC spheroid generation
E14 or LifeAct-GFP cells (MMP14-KO or wild type) were trypsinized with 0.05% Trypsin-EDTA (Life Technologies, 25300054) for 3 minutes at 37°C when reached ~80% confluency. Cells were spun at 1000 rcf for 5 minutes and supernatant discarded. The cell pellet was then resuspended in 1ml of base medium and were counted using a haemocytometer. The volume of cells taken for each experiment was calculated for 3500-5000 cells per 20ul drop of Matrigel (Corning, 354230). The appropriate volume was spun down again at 1000 rcf for 5 minutes and supernatant removed. The cell pellet was resuspended in appropriate Matrigel concentration at a volume sufficient to plate 20ul drops of Matrigel on ibiTreat 8-well ibidi plates (Ibidi, 80826). The suspended cells in Matrigel were placed at 37°C for 2 minutes to allow Matrigel polymerization. The drops were then covered with 250ul of appropriate medium.
Western Blot
Protein lysates were recovered from cells in 2D cultures using RIPA Buffer (1M Tris-HCL, 1M NaCl, 0.5M EDTA, 10% TX-100, 10% Sodium Deoxycholate, 10% SDS) with protease inhibitor cocktail (cOmplete Mini; Roche, 11836153001) on ice. After spinning at 16900 rcf for 30 minutes at 4°C the supernatant was collected and quantified for protein using a BCA assay kit (Pierce BCA Protein Assay Kit, 23227). 20ug of the sample was boiled at 96°C for 12 minutes in Laemlli buffer before being loaded in an 8% SDS-PAGE gel (stacking gel: 5% acrylamide mix (Severn Biotech, 20-210010), 120mM Tris-pH 6.8, 0.1% Sodium dodecyl (lauryl) sulfate (SDS; BioPath, S1030), 0.1% Ammonium persulfate (Sigma-Aldrich, 215589), 0.02% v/v TEMED (Thermo Fisher Scientific, 17919); 8% resolving gel: 8% acrylamide mix, 375mM Tris-pH 8.8, 0.1% SDS, 0.1% Ammonium persulfate, 0.06% v/v TEMED). After running and transfer on nitrocellulose paper (0.2um; BioRad, 160-0112), blotting was performed in 5% milk with the following antibodies: MMP2 (1:2000; Abcam, ab92536), MMP14 (1:2000; Abcam, ab51074), γ-tubulin (1:10000; Sigma, T5168). HRP-conjugated antibodies: goat anti-rabbit (HRP) (1:10000; Stratech, 43C-CB1106-FIT), goat anti-mouse (HRP) (1:10000; Stratech, 43-GM30-FIT). HRP detection was performed using Clarity Western ECL Substrate (BioRad, 170-5060) and imaged on a gel imager with serial exposure. For the complete gels as imaged see Supplementary Figure 13. For band intensity quantification see “Image Analysis”.
RNAScope® v2
The sample was fixed overnight at 4°C in DEPC-4% PFA and then serially dehydrated in increasing concentrations of Methanol-PBST(DEPC-PBS+0.1%Tween) (25%, 50%, 75% and 100%; 10 minutes incubation in each concentration). Sample was either stored in 100% Methanol in -20°C or directly rehydrated in preparation for in situ hybridization. For rehydration the sample was incubated for 30 minutes in 100% Methanol+0.2M HCl, followed by serial dehydration in Methanol+PBST (75%, 50% and 25%). After washing the rehydrated sample in PBST+BSA (1%; Sigma-Aldrich, A3311-50G), it was incubated in Protease Plus (Bio-Techne, 322330) for 30 minutes at 40°C and rinsed in channel 1 (C1) probe. The sample was placed in the probe mixture, which was prepared by diluting channel 2 (C2) and channel 3 (C3) 1:50 in the C1 probe. The probe mixture was warmed up to 40°C and allowed to cool to room temperature before placing the sample in. After a 2 hour incubation of the sample in the probe mixture at 40°C it was washed for 10 minutes in 0.5X ACD wash buffer (WB; prepared by warming 50X WB stock at 40°C for 20 minutes and diluted 1:100 in DEPC-water; Bio-Techne, PN310091) and stored in 5X SSC (prepared from 20X stock in DEPC-water; Thermo Fisher Scientific, 15557044) overnight at room temperature. Sample was then removed from 5X SSC and washed twice in WB for 10 minutes each before placing it to AMP1 (Bio-Techne, 320851) for 30 minutes at 40°C. After 2x10 minute washes in WB the sample was placed in AMP2 for 30 minutes at 40°C. For the last step of the amplification, the sample was washed twice for 10 minutes each in WB and placed in AMP3 for 15 minutes. To start developing the signal the sample was placed in HRP-C1 incubated for 15 minutes at 40°C followed by moving the sample into TSA with diluted fluorophore (used 1:500) and followed by 15 minute incubation at 40°C in HRP blocker to stop the reaction. The same procedure was followed for all three channels (HRP-C1, HRP-C2 and HRP-C3).
TSA fluorophores used with respective channel:
Opal™-570nm – C1
Opal™-650nm – C2
Opal™-520nm – C3
RNAScope® probes used:
RNAscope® Probe - Mm-Mmp14 (Bio-Techne, 479061)
RNAscope® Probe - Mm-Mmp2-C2 (Bio-Techne, 315931-C2)
RNAscope® Probe - Mm-Nodal-C3 (Bio-Techne, 436321-C3)
RNAscope® Probe - Mm-Tdgf1 (Bio-Techne, 506411)
All washes and dehydration / rehydration steps were done in 12-well plates (2ml/well). Protease treatment, amplification and developing signal were done in 96-well plates (4 drops/well)
RT-PCR
E6.5 embryos were recovered from pregnant mice and the extraembryonic ectoderm was removed and discarded. Then the remaining embryonic part (EPI+VE) was cut in half along the proximal-distal axis making sure that the long axis of the EPI is parallel to the plate. Each half was transferred into 20ul of Extraction buffer from the PicoPure RNA Isolation kit and snap frozen on dry ice. After having been transferred to -80°C overnight, embryos were thawed on ice and incubated at 42°C for 30 minutes. To the 20ul of the lysate, 20ul of 70% ethanol was added and transferred to a pre-conditioned PicoPure column. Then the column was centrifuged at 100 rcf for 2 minutes and 14500 rcf for 30 seconds. Then 100ul of wash buffer 1 was added and spun at 100 rcf for 1 minute. DNAse was then applid to the column for 30 minutes and spun down at 100 rcf for 1 minute. The column was washed again with wash buffer 1 and spun down at 100 rcf before being washed twice with wash buffer 2 (one spin at 100 rcf for 1 minute and the second at 14500 rcf for 2 minutes). The columns were centrifuged once more at 14500 rcf for 2 minutes to remove residual liquid before eluting the RNA. RNA was eluted by adding 20ul of nuclease free water and centrifuging into an RNAse-free tube for 1 minute at 14500rcf.
For qPCR plate preparation the master mix was prepared from the Power SYBR Green RNA-to CT 1-Step kit. Quantities were calculated for 10ul per well: 2x SYBR mix, 125x enzyme mix, 2ul of RNA sample and nuclease free water. In every well 5.3 ul of primer mix was added made up of 0.3 ul of 10uM forward and reverse primers, and 5ul of nuclease free water.
Cerberus: FW = 5’-CTCTGGGGAAGGCAGACCT-3’,
RV = 5’-CCACAAACAGATCCGGCTT-3’
MMP25:FW = 5’-CCCTGACCTCCTCCAGACTT-3‘,
RV = 5‘-GACCTTCGCATCGGGATTCT-3’
For normalising expression, the housekeeping gene GAPDH was used.
Primers used:
GAPDH: FW = 5’-AGGTCGGTGTGAACGGATTTG-3’,
RV = 5’-TGTAGACCATGTAGTTGAGGTCA-3
To calculate relative expression, the difference of quantification cycles (Cq) between GAPDH and gene of interest was first calculated for every replicate of the reaction (ΔCq). Then the average ΔCq expression (which is 2ΔCq) is calculated and divided by the ΔCq of the Cerberus-high half (ΔΔCq). Relative gene expression is then calculated based on the differences of ΔΔCq between samples.
All primers were validated by performing qPCRs using different concentrations of sample and assessing linearity of Cq difference. Additionally, analysis of melting curves showed single amplicon production.
Fluorescent gelatin degradation assay
Cy3-gelatin was plated on ibiTreat microscopy plates (Ibidi, 80826) and embryonic stem cells were seeded on top at ~5000 cells/well. Cy3-gelatin reagents and protocol for coating were provided in the QCM Gelatin Invadopodia Assay Kit (Millipore, ECM671).
MMP14-KO ESC line generation
The deletion of MMP14 was targeted to exon 1 at the translation initiation site. Two gRNAs to flank the initiation codon were designed using the online CRISPR Design Tool (http://tools.genome-engineering.org) by inputting the sequence for exon 1 of MMP14. From the list of possible gRNAs designed by the tool the following sequences were selected based on their position on the exon (to flank the initiation codon) and their score of inverse likelihood of off-target binding. The gRNAs selected to flank the initiation codon are: gRNA1: 5’-GTGGATTCCTAGAGCGCGGT-3’, gRNA2: 5’-GGAGGCTGCGGGAGGGTCGA-3’
Each gRNA was cloned into the plasmid pSpCas9(BB)-2A-Puro (PX459) (deposited in Addgene by the Zhang lab; Addgene, 62988). Both gRNAs were co-transfected in LifeAct-GFP ESCs using the Lipofectamine 3000 transfection reagent (Thermo Fisher Scientific, L3000001) according to manufacturer’s directions (250ng of each plasmid).
After two days of antibiotic selection using 2ug/ml Puromycin (Invivogen, ant-pr-1), the transfected cells were washed in fresh medium and allowed two more days to recover from the antibiotic treatment. To isolate individual clones, the remaining colonies surviving the antibiotic selection were trypsinised (3 minutes in Trypsin-EDTA (Life Technologies, 25300054) and stopped with feeder cell medium) and plated at 1 cell/well in two 96-well plates. The plates were checked every day until colonies became visible. From 192 wells, 48 had a single colony growing. Each of the 48 wells was trypsinised and split into 3 new wells in 3 different 96-well plates to create triplicates of all clones. Once the colonies in the new plates became confluent, two plates were frozen down by first trypsinising and inactivating, followed by addition of equal volume of freezing medium (FBS (Stem Cell Institute, Cambridge, UK) + 20% DMSO (Sigma-Aldrich, D2650). The cells in the remaining plate were allowed to grow for two more days before extracting DNA from each clone and genotyping.
Lysis of cells to extract DNA was performed using the following protocol: Medium was removed from the wells and replaced with 250ul of TNES (50uM Tris (pH7.4), 100uM EDTA (pH8.0), 400mM NaCl, 0.5% SDS) + 5ul of Proteinase K (Qiagen, 19131). Cell were detached by pipetting up and down and transferred to a 1.5ml tube followed by incubation at 55°C for 30 minutes. To precipitate cell membrane 75ul of 6M NaCl was added and vigorously shaken for 30 seconds before spinning for 10 minutes at 16900 rcf. A 1:1 volume of 100% ethanol was added to the supernatant and inverted ~20 times before spinning down for 5 minutes at maximum speed at 4°C. The supernatant was then discarded, and the pellet was washed with 70% ethanol and span down again for 5 minutes at maximum speed at 4°C. The supernatant was removed again and left the tubes to airdry for 10 minutes at room temperature. To dissolve the DNA pellet, 20ul of DNAse-free water was added and incubated at 65°C for 20 minutes. From the resulting DNA sample, 2ul were used per PCR reaction.
For genotyping the primers used were: Forward primer: 5’-CAGTTCGCCGACTAAGCAGA-3’, Reverse primer: 5’-TACTTCGGGGCTGAAGTTGC-3’.
Imaging
Leica SP8 inverted confocal microscope was used to image fixed embryos. For live imaging the same set up was used with laser power not exceeding 2.5% of solid state Ti:Sapphire laser. Lifeact-GFP, T-GFP and CellEvent Caspase-3/7-treated embryos were imaged using 488nm excitation. For maximum intensity projections of basement membrane, laminin, Collagen IV or Perlecan were imaged with optical slicing at 0.6um and projected using the Fiji function “Z Project”.
Image analysis
Images were acquired using the Leica software LASX and were processed and analysed on Fiji image processing software (ImageJ 1.52h) or Imaris 9.1.2 for 3D reconstruction and 3D analysis. For perforations size quantification, binary images were generated from MIP images of basement membrane. Subsequently, the perforations were identified and their size was extracted using the Fiji function Particles. To establish correlation between perforations domain and AVE position, a maximum projection image was used to determine the area of AVE coverage based on signal from Cerberus. Then a binary image of maximum intensity projected basement membrane was created and the “particles” function in Fiji was used to calculate total area covered by perforations in the anterior or posterior domain (as indicated by area of AVE coverage). Similarly, for gelatin degradation assay a binary image of maximum intensity projected Cy3-gelatin was generated and % of area absent in the total area of the field of view was calculated. For western blot band analysis the ‘Gel Analysis’ Fiji tool was used. The bands being quantified were manually selected and an intensity plot was generated. The area under the plot, representing total intensity, was measured using the magic wand tool. Protein bands in question were normalized against respective tubulin band total intensity and compared. For vector mapping, the OrientationJ Fiji plugin was used. Maximum intensity projected images of basement membrane were used to generate vector maps using this plugin. The vector angles were exported and used to create histograms to assess skewness. For 3D analysis of gastrulated embryos in the presence or absence of MMPs inhibitors, Imaris was used to detect cells with the spot detection function and allocate them manually based on their relative position to the basement membrane. For presentation purposes, the basement membrane was surface rendered in Fig. 4L, to visually demonstrate position of anterior primitive streak, using the surface render Imaris function. To quantify mRNA levels in control SB431542-treated and Nodalfl/fl:RCreT2+Tamoxifen embryos, in toto images were acquired with Z-compensation function. The individual signal spots per embryo were automatically detected by the spot detection function of Imaris software using a prediction for the spot diameter at 2um. Spot detection quality was adjusted and curated manually.
Single cell sequencing analysis
Re-analysis of the GSE109071(from 10.1016/j.celrep.2019.02.031) dataset was performed using R (v3.4.4) and Seurat (v3.0.1). The matrix of read counts was input into Seurat, normalised (log), and scaled. Three thousand variable genes were used to identify clusters. Dimensional reduction was performed using UMAP. Cell identifiers were parsed from the GEO entry and added to the Seurat Object using (make_sample2Age_table.sh). All expression values are log(counts). Marker genes were used to identify the EPI (Pou5f1), ExE (Bmp4) and VE (Amn) cells in the UMAP. The matrix of RPKM values from GSE109071 was used to calculate gene expression correlation between pairs of selected genes. EPI cells at ages 6.25 and 6.5 were extracted from the matrix and Pearson's correlation coefficient (R) with p-value are given for each comparison. The points are coloured by density using a kde2d kernel. Scripts and data to recreate analysis and figures are available from https://github.com/darogan/Kyprianou_Zernika-Goetz.
ChiP-Seq analysis
ChIP tracks for Smad2/3 from GSE70486(from 10.1016/j.stem.2016.10.002) in TDF (tiled data file) format were visualised in IGV (Integrative Genomics Viewer, 10.1038/nbt.1754) and signal intensities were normalised by 1x10^6/total reads to give RPM (Reads per million). Scripts to recreate ChIP-Seq analysis and figures can be found at https://github.com/darogan/Kyprianou_Zernika-Goetz. Analysis was performed using R (v3.4.4).
Statistics
Statistical analyses was performed on GraphPad Prism 6.0. Quantitative data are presented as the mean ± s.e.m. Quantitative data were analysed using a two-sided unpaired Student’s t-test and qualitative data were analysed with χ2 tests. To compare the distributions of vector angles Kolmogorov-Smirnov test was used. Unless otherwise noted, each experiment was performed at least three times. Circular statistics in Fig. 4F were generated using the circular statistics software Oriana.
Extended Data
Extended Data Figure 1. Post implantation embryo growth and basement membrane morphology.
A) Tracked brightfield stills from a time lapse video of an E5.5-E5.75 embryo showing egg-cylinder growth along the embryo proximo-distal axis. Tracks are arbitrarily color-coded and follow growth in xy dimensions of specific anatomical characteristics: red=ectoplacental cone/extraembryonic ectoderm boundary; magenta/cyan=Extraembryonic ectoderm; green=epiblast/extraembryonic ectoderm boundary; white/yellow=epiblast; blue=distal epiblast. n=5 embryos. B) E5.5 embryos cultured for 8 hours in the presence or absence of collagenase IV. C) Egg cylinder aspect ratio comparison in control and collagenase IV treated embryos; Unpaired student’s t-test: ****p<0.0001, mean±SEM. For B and C n=11 control and 11 collagenase IV treated embryos. D) Representative example of an E5.5 embryo stained for different components of basement membrane. Basement membrane perforations can be identified with all markers. EPI – epiblast, ExE – extraembryonic ectoderm. n=10 embryos E) Representative examples of E5.5 embryos (n=20) showing the size of basement membrane perforations relative to the size of nuclei. Asterisks = visceral endoderm nuclei; Arrowheads = basement membrane perforations. F) Quantification of basement membrane perforations and cell nuclei area. n=1501 perforations and 100 nuclei from 6 embryos. Two sided unpaired student’s t-test: ****p<0.0001; mean±SEM. G) Quantification of basement membrane perforations’ size during post-implantation development. Perforation average size remains the same in early post-implantation stages but increases in the pre-gastrula stages. E5.0 n= 423, E5.25 n=1046, E5.5 n=1327, E5.75 n=1501, E6.0-E6.5 n=1615. One way ANOVA ****p<0.0001, mean±SEM. Scale bars=20um.
Extended Data Figure 2. AVE migration regulates the distribution of basement membrane perforations.
A) AVE position and basement membrane remodelling using transgenic Cerberus-GFP embryos for AVE identification. n=23 embryos B) Quantification of BM area covered by perforations at regions away (proximal/posterior) or close to AVE side as Figure 2B with embryos from different AVE migration stages pooled together. Two sided unpaired student’s t-test: ***p<0.0001. Centre lines show median values, box limits represent the upper and lower quartiles, and whiskers show min and max range. C) Representative examples of E6.5 pre-gastrula control (n=20 embryos) and TTR-Cre:Rhoafl/- embryos(n= 7 embryos). Blocking AVE migration results in abnormal distribution of basement membrane perforations. D) Representative examples of Control (n=5) and TTR-Cre:RhoAfl/- (n=5) E5.5 embryos. Scale bars=20um.
Extended Data Figure 3. Nodal controls basement membrane remodelling in embryos and ESCs.
A) Representative examples of control Nodal fl/fl:RCreT2 embryos (n=8 embryos) fixed and stained immediately upon recovery. In the absence of tamoxifen treatment, Nodal fl/fl:RCreT2 embryos have normal basement membrane appearance as Nodal expression is not affected. Lower panel shows position of anteroposterior axis and basement membrane perforations patterning. Arrowheads: anterior visceral endoderm. B) Representative examples of control (n=20) and Nodal inhibitor treated embryos (n=22). Note the absence of basement membrane perforations and the appearance of accumulated fibrillar laminin in Nodal inhibitor-treated embryos (SB431542). C) Percentage of embryos with basement membrane perforations appearance in control and Nodal inhibitor-treated embryos (SB431542). χ2 test: ****p<0.0001. D) LifeAct-GFP ESCs cultured in conditions to maintain pluripotency (FC+2iLIF) and conditions to induce exit from pluripotency (FC-2iLIF) plated on Cy3-Gelatin; three examples for each condition (1,2,3 and 1’,2’,3’). The stripy appearance of gelatin is a result of its manner of plating. 3 independent experiments E) Representative example from 3 independent experiments of Cy3-gelatin remodelling by LifeAct-GFP ESCs upon exit from pluripotency. Arrowheads points to actin enrichment (invadopodia like structures) colocalising with region of remodelled ECM. FC=feeder cell medium. F) Control and SB431542-treated ESCs plated on Cy3-gelatin and cultured in conditions to allow exit from pluripotency. Right panel: Magnified images showing co-localization of control ESCs with Cy-3 gelatin perforations. G) Quantification of (F) of amount of Cy3-Gelatin remodelling based on % of absent fluorescence. n=7 regions for each condition. Two sided unpaired student’s t-test; ****p<0.0001; mean±SEM. FC: feeder cell medium. Scale bars=20um
Extended Data Figure 4. MMPs expression profile.
A) UMAP showing distribution of cells by embryonic age. n=1724 cells; E5.25: 331 cells; E5.5: 269 cells; E6.25: 331 cells; E6.5: 803 cells. B) Marker genes identify EPI (Pou5f1), ExE (Bmp4) and VE (Amn) cells in the UMAP. n= 775 EPI cells, 283 ExE cells and 666 VE cells. C) Expression levels of MMP genes on UMAP plot for E5.25-E6.5. Expression values: log(counts). Blue box: EPI. D) mRNA levels of Cerberus and MMP25 at the anterior and posterior side of the embryo. Anterior and posterior identity was defined based on Cerberus expression. MMP25 is highly expressed at the embryo’s anterior side. n=3 embryos. Two sided unpaired student’s t-test. Cerberus:**p=0.001; MMP25 ***p=0.0002; mean±SEM E) E5.5 and E6.5 pre-gastrula embryos stained for MMP14; white arrowheads: prospective primitive streak. n=10 embryos for each stage. Scale bars=20um F) The matrix of RPKM values from GSE109071 was used to calculate gene expression correlation between pairs of genes. Epiblast cells at ages 6.25 and 6.5 (n=527 cells) were extracted from the matrix and Pearson's correlation coefficient (r) with two sided p-value are given for each comparison. The points are coloured by density (kde2d).
Extended Data Figure 5. MMP2 and 14 expression is regulated by Nodal.
A) Expression levels for extracellular matrix (ECM) genes are plotted on the UMAP for all cell types from E5.25-E6.5(n=1724 cells). All expression values are log(counts). B) Representative examples of fluorescent RNA in-situ for control (n=3) and SB431542-treated embryos(n=3). Embryos were recovered at E5.75 and cultured for 18 hours before fixation. Nodal signalling is inhibited after treatment with SB431542 evident from the absence of Nodal and Tdgf1 mRNA. Scale bars = 20um. C) Representative examples of control(n=5) and Nodal inhibitor-treated(n=5) (18 hours) embryos stained for MMP14. D) Western blot analysis for MMP2 and MMP14 in control and Nodal-inhibited (SB431542 treated) ESCs. n=3 independent experiments. For gel source data see Supplementary Figure 1. E) Quantification of relative protein levels based on western blots of ESCs in the presence or absence of Nodal inhibitor SB431542. Two sided unpaired student’s t-test. MMP2: **p=0.0088; MMP14: **p=0.0086; n=3 independent experiments; mean±SEM. F) ChIP tracks for Smad2/3. Smad2/3 binding on MMP2 & 14 is lost upon Nodal inhibition (green rectangles). Scale bars=20um
Extended Data Figure 6. MMP14 is necessary for basement membrane remodelling in ESCs.
A) CRISPR-Cas9 exon 1 ATG initiation codon deletion strategy. gRNAs designed to flank a 330bp region which includes the ATG initiation codon. Genotyping primers positions shown as arrows below the exon region. B) Genotyping results of two clones in which in one the exon remained uncut (clone 24) and in the other (clone 38) it was successfully cut. C) Western blot for MMP14 in clone 38 shows successful MMP14 protein abolishment. For gel source data see Supplementary Figure 1. D) Representative examples of control and MMP14 knock-out (KO) Lifeact-GFP ESCs stained for MMP14. MMP14 protein is not detected in the KO cells. 3 independent experiments E) Representative examples of control and MMP14 knock-out (KO) Lifeact-GFP ESCs plated on Cy3-Gelatin. Right panels: Magnified images showing co-localization of control/wildtype ESCs with Cy-3 gelatin perforations. Note the defective extra-cellular matrix remodelling in MMP14-knock-out ESCs. The stripy appearance of gelatin is a result of its manner of plating. 3 independent experiments F) Quantification of (E) of Cy3-Gelatin remodelling based on % of absent fluorescence. Two sided unpaired student’s t-test; ***p<0.001; n=5 regions for FC and 7 regions for MMP14 KO; mean±SEM. FC = feeder cell medium. Scale bars: 20um.
Extended Data Figure 7. MMP activity is indispensable for proper embryo growth.
A) Stills from time lapse video of representative control(n=5 embryos) and MMP inhibitors-treated(n=4 embryos) (100uM NSC405020 + 20uM Prinomastat) embryos cultured from E5.75 for 18 hours. Red arrowheads show cell death initiation after growth restriction in the absence of MMPs activity. B) Control (n=20) and MMP inhibitors-treated(n=18) embryos (18 hours). C) Quantification of embryo length (18 hours of culture). n=20 control and 18 MMP inhibitors-treated embryos; Two sided unpaired student’s t-test; ****p<0.0001; mean±SEM. D) Representative examples of control (n=7) and MMP inhibitors treated embryos(n=6) stained with the apoptotic marker c-casp. E) Quantification of apoptotic index (number of apoptotic cells/ total cell number). n=7 control and 6 MMP inhibitors treated embryos.Two sided unpaired student’s t-test; ***p=0.0002, mean±SEM F) Representative examples of control(n=10) and MMP inhibitors treated(n=10) embryos stained with the mitotic marker phospho-Histone H3(Ser 10). G) Quantification of mitotic index (number of mitotic cells/ total cell number). n=10 control and 10 MMP inhibitors treated embryos. Two sided unpaired student’s t-test, mean±SEM. Scale bars=20um.
Extended Data Figure 8. Basement membrane remodelling is necessary for ESCs spheroid growth.
A) Representative examples of control and MMP inhibitors (100uM NSC405020 + 20uM Prinomastat) treated (treatment started at 48 hours after removal of 2iLIF for 18 hours) ESCs spheroids in Matrigel. n=3 independent experiments B) Quantification of ESCs spheroid area in control and NSC405020+Prino conditions. Reduction of Matrigel concentration results in partial rescue of the phenotype produced upon inhibition of MMP activity. Two sided unpaired student’s t-test: ****p<0.0001; mean±SEM. n= 200 spheroids for each condition C) Examples of control and NSC405020+Prino-treated (treatment at 48 hours) ESC spheroids stained for cleaved caspase3 (c-Casp3) to monitor apoptosis.n=3 independent experiments D) Brightfield images of wild type and MMP14 knock-out ESCs spheroids in Matrigel 48h after 2iLIF removal. N=3 independent experiments E) Quantification of ESC spheroid area in wild type and MMP14 knock out ESCs. n=607 WT and 600 MMP knock out spheroids. Two sided unpaired student’s t-test: ****p<0.0001; mean±SEM. F) Representative examples of control and MMP inhibitors (100uM NSC405020 + 20uM Prinomastat) treated ESCs and XEN cells cultured on 2D. For ESCs treatment started at 48 hours after 2iLIF removal for 18 hours as in B. XEN cells were treated with MMP inhibitors for 18 hours. MMP inhibitor treatment does not induce cell death in 2D cell cultures. n= 3 independent experiments G) Schematic showing the method for the quantification of vector maps angles during embryo growth. H) Representative example of an E5.75 embryo showing a vector map following the direction of perforations in the epiblast. n=10 embryos I) Quantification of vector angles presented as a frequency plot; each 15° bin includes points of relative frequencies from 10 embryos. Same data are presented as circular histogram in Figure 4F. Kolmogorov-Smirnov test: ****p<0.0001. Centre lines show median values, box limits represent the max and min values. Scale bars: 20um.
Extended Data Figure 9. Posterior localisation of basement membrane perforations and MMP14 expression in pre-gastrula and gastrula stages.
A) Representative examples of early gastrula embryos showing posterior expression of MMP14. n=15 embryos B) En-face posterior view of early gastrula embryo. n= 10 embryos For A,B: MMP14 expression follows the pattern of basement membrane perforations. White arrowhead: Posterior and prospective primitive streak. Purple arrowheads: breached basement membrane/primitive streak. C) Representative examples of E6.0-E6.5 embryos showing the pattern of basement membrane perforations in pre-gastrula stages. Basement membrane perforations pre-pattern the primitive streak in pre-gastrula stages. n=30 embryos D) En face posterior and anterior views of pre-gastrula embryos showing that basement membrane perforations are found only at the embryo’s posterior side. n=10 embryos. Scale bars= 20um.
Extended Data Figure 10. MMP mediated basement membrane remodelling regulates primitive streak extension.
A) Posterior en-face views of gastrula embryos. Purple arrowheads: PS; white arrowheads: perforations. Right panel: depth-coded view, EPI basement membrane: cyan; Endoderm basement membrane: white-red. n=10 embryos. Scale bars = 50um. B) Representative examples of gastrula stage embryos showing the pattern of basement membrane perforation in correlation with T (encoding Brachyury) expression (nuclear localisation, halo around the embryo is due to background staining). White arrowheads: prospective primitive streak. Purple arrowheads: breached basement membrane/primitive streak. n=20 embryos. Scale bar= 20um. C) Representative examples of embryos cultured (18 hours) from early E6.5 (pre-PS stage); n= 11 control and 17 MMP inhibitor treated embryos. Scale bars: Left panel=50um; Right panel(Video 8 and 9)= 80um. D)Surface-rendered images of embryos cultured from early E6.5 (18 hours). Foxa2: anterior PS (APS) marker. Ingressed (white arrows) and non-ingressed (white arrowheads) Foxa2-expressing cells. APS: magenta dotted line; PS: purple dotted line. n=10 control and 10 MMP inhibitors treated embryos. Scale bars=80um; zoomed-in=20um. E) Schematic representation of primitive streak extension along the perforation path and interpretation of primitive streak appearance after inhibition of MMPs (NSC405020 + Prinomastat) just prior to gastrulation.
Supplementary Material
Acknowledgments
We are grateful to D. Glover, M. Shahbazi and M. Zhu for valuable discussion; A. Cox for drawing the model in Fig 4M; M. Kuehn for the Nodal-fl2 mice and V. Kouskoff for the T-GFP mice. D.S.B. is supported by the FNRS; W.N. by WELBIO; I.M. is a FNRS research associate and an investigator of WELBIO. The M.Z.-G. lab is supported by grants from the European Research Council (669198) and the Welcome Trust (098287/Z/12/Z).
Footnotes
Code Availability
The code used in this study are available at https://github.com/darogan/Kyprianou_Zernika-Goetz and https://doi.org/10.5281/zenodo.3610335.
Data availability
Scripts and data for single cell RNA-seq and Chip-seq analysis are available from GSE109071,GSE70486 and https://github.com/darogan/Kyprianou_Zernika-Goetz. The source data used in all the presented graphs are provided as a Source Data files. Raw image files are available from the corresponding author upon request.
Author Contributions
C.K. and N.C. designed and carried out the experiments and data analysis. R.H performed the bioinformatics analysis. G.A performed the RNA in-situ experiments. W.N, D.S.B. and I.M. generated the TTR-Cre:Rhoafl/- embryos. M.Z-G., C.K. and N.C conceived the study and wrote the manuscript. M.Z.-G supervised the study.
Competing Interests
The authors declare no competing interests.
References
- 1.Keller R. Shaping the vertebrate body plan by polarized embryonic cell movements. Science. 2002;298:1950–1954. doi: 10.1126/science.1079478. [DOI] [PubMed] [Google Scholar]
- 2.Martin AC, Goldstein B. Apical constriction: themes and variations on a cellular mechanism driving morphogenesis. Development. 2014;141:1987–1998. doi: 10.1242/dev.102228. [DOI] [PMC free article] [PubMed] [Google Scholar]
- 3.Crest J, Diz-Munoz A, Chen DY, Fletcher DA, Bilder D. Organ sculpting by patterned extracellular matrix stiffness. Elife. 2017;6 doi: 10.7554/eLife.24958. [DOI] [PMC free article] [PubMed] [Google Scholar]
- 4.Haigo SL, Bilder D. Global tissue revolutions in a morphogenetic movement controlling elongation. Science. 2011;331:1071–1074. doi: 10.1126/science.1199424. [DOI] [PMC free article] [PubMed] [Google Scholar]
- 5.Harunaga JS, Doyle AD, Yamada KM. Local and global dynamics of the basement membrane during branching morphogenesis require protease activity and actomyosin contractility. Dev Biol. 2014;394:197–205. doi: 10.1016/j.ydbio.2014.08.014. [DOI] [PMC free article] [PubMed] [Google Scholar]
- 6.Bedzhov I, Zernicka-Goetz M. Self-organizing properties of mouse pluripotent cells initiate morphogenesis upon implantation. Cell. 2014;156:1032–1044. doi: 10.1016/j.cell.2014.01.023. [DOI] [PMC free article] [PubMed] [Google Scholar]
- 7.Christodoulou N, et al. Sequential formation and resolution of multiple rosettes drive embryo remodelling after implantation. Nat Cell Biol. 2018;20:1278–1289. doi: 10.1038/s41556-018-0211-3. [DOI] [PubMed] [Google Scholar]
- 8.Yamamoto M, et al. Nodal antagonists regulate formation of the anteroposterior axis of the mouse embryo. Nature. 2004;428:387–392. doi: 10.1038/nature02418. [DOI] [PubMed] [Google Scholar]
- 9.Brennan J, et al. Nodal signalling in the epiblast patterns the early mouse embryo. Nature. 2001;411:965–969. doi: 10.1038/35082103. [DOI] [PubMed] [Google Scholar]
- 10.Christodoulou N, et al. Morphogenesis of extra-embryonic tissues directs the remodelling of the mouse embryo at implantation. Nat Commun. 2019;10 doi: 10.1038/s41467-019-11482-5. 3557. [DOI] [PMC free article] [PubMed] [Google Scholar]
- 11.Copp AJ. Interaction between inner cell mass and trophectoderm of the mouse blastocyst. I. A study of cellular proliferation. J Embryol Exp Morphol. 1978;48:109–125. [PubMed] [Google Scholar]
- 12.Hiramatsu R, et al. External mechanical cues trigger the establishment of the anterior-posterior axis in early mouse embryos. Dev Cell. 2013;27:131–144. doi: 10.1016/j.devcel.2013.09.026. [DOI] [PubMed] [Google Scholar]
- 13.Bedzhov I, et al. Development of the anterior-posterior axis is a self-organizing process in the absence of maternal cues in the mouse embryo. Cell Res. 2015;25:1368–1371. doi: 10.1038/cr.2015.104. [DOI] [PMC free article] [PubMed] [Google Scholar]
- 14.Thomas PQ, Brown A, Beddington RS. Hex: a homeobox gene revealing peri-implantation asymmetry in the mouse embryo and an early transient marker of endothelial cell precursors. Development. 1998;125:85–94. doi: 10.1242/dev.125.1.85. [DOI] [PubMed] [Google Scholar]
- 15.Reffay M, et al. Interplay of RhoA and mechanical forces in collective cell migration driven by leader cells. Nat Cell Biol. 2014;16:217–223. doi: 10.1038/ncb2917. [DOI] [PubMed] [Google Scholar]
- 16.Conlon FL, et al. A primary requirement for nodal in the formation and maintenance of the primitive streak in the mouse. Development. 1994;120:1919–1928. doi: 10.1242/dev.120.7.1919. [DOI] [PubMed] [Google Scholar]
- 17.Kumar A, Lualdi M, Lewandoski M, Kuehn MR. Broad mesodermal and endodermal deletion of Nodal at postgastrulation stages results solely in left/right axial defects. Dev Dyn. 2008;237:3591–3601. doi: 10.1002/dvdy.21665. [DOI] [PMC free article] [PubMed] [Google Scholar]
- 18.Kalkan T, et al. Tracking the embryonic stem cell transition from ground state pluripotency. Development. 2017;144:1221–1234. doi: 10.1242/dev.142711. [DOI] [PMC free article] [PubMed] [Google Scholar]
- 19.Lemaitre V, D'Armiento J. Matrix metalloproteinases in development and disease. Birth Defects Res C Embryo Today. 2006;78:1–10. doi: 10.1002/bdrc.20065. [DOI] [PubMed] [Google Scholar]
- 20.Lu P, Takai K, Weaver VM, Werb Z. Extracellular matrix degradation and remodeling in development and disease. Cold Spring Harb Perspect Biol. 2011;3 doi: 10.1101/cshperspect.a005058. [DOI] [PMC free article] [PubMed] [Google Scholar]
- 21.Cheng S, et al. Single-Cell RNA-Seq Reveals Cellular Heterogeneity of Pluripotency Transition and X Chromosome Dynamics during Early Mouse Development. Cell Rep. 2019;26:2593–2607 e2593. doi: 10.1016/j.celrep.2019.02.031. [DOI] [PubMed] [Google Scholar]
- 22.Klein T, Bischoff R. Physiology and pathophysiology of matrix metalloproteases. Amino Acids. 2011;41:271–290. doi: 10.1007/s00726-010-0689-x. [DOI] [PMC free article] [PubMed] [Google Scholar]
- 23.English WR, Velasco G, Stracke JO, Knauper V, Murphy G. Catalytic activities of membrane-type 6 matrix metalloproteinase (MMP25) FEBS Lett. 2001;491:137–142. doi: 10.1016/s0014-5793(01)02150-0. [DOI] [PubMed] [Google Scholar]
- 24.Costello I, Biondi CA, Taylor JM, Bikoff EK, Robertson EJ. Smad4-dependent pathways control basement membrane deposition and endodermal cell migration at early stages of mouse development. BMC Dev Biol. 2009;9:54. doi: 10.1186/1471-213X-9-54. [DOI] [PMC free article] [PubMed] [Google Scholar]
- 25.Wang Q, et al. The p53 Family Coordinates Wnt and Nodal Inputs in Mesendodermal Differentiation of Embryonic Stem Cells. Cell Stem Cell. 2017;20:70–86. doi: 10.1016/j.stem.2016.10.002. [DOI] [PMC free article] [PubMed] [Google Scholar]
- 26.Holmbeck K, et al. MT1-MMP-deficient mice develop dwarfism, osteopenia, arthritis, and connective tissue disease due to inadequate collagen turnover. Cell. 1999;99:81–92. doi: 10.1016/s0092-8674(00)80064-1. [DOI] [PubMed] [Google Scholar]
- 27.Oh J, et al. Mutations in two matrix metalloproteinase genes, MMP-2 and MT1-MMP, are synthetic lethal in mice. Oncogene. 2004;23:5041–5048. doi: 10.1038/sj.onc.1207688. [DOI] [PubMed] [Google Scholar]
- 28.Coussens LM, Fingleton B, Matrisian LM. Matrix metalloproteinase inhibitors and cancer: trials and tribulations. Science. 2002;295:2387–2392. doi: 10.1126/science.1067100. [DOI] [PubMed] [Google Scholar]
- 29.Remacle AG, et al. Novel MT1-MMP small-molecule inhibitors based on insights into hemopexin domain function in tumor growth. Cancer Res. 2012;72:2339–2349. doi: 10.1158/0008-5472.CAN-11-4149. [DOI] [PMC free article] [PubMed] [Google Scholar]
- 30.Shahbazi MN, et al. Pluripotent state transitions coordinate morphogenesis in mouse and human embryos. Nature. 2017;552:239–243. doi: 10.1038/nature24675. [DOI] [PMC free article] [PubMed] [Google Scholar]
- 31.Ben-Haim N, et al. The nodal precursor acting via activin receptors induces mesoderm by maintaining a source of its convertases and BMP4. Dev Cell. 2006;11:313–323. doi: 10.1016/j.devcel.2006.07.005. [DOI] [PubMed] [Google Scholar]
- 32.Moore KA, et al. Control of basement membrane remodeling and epithelial branching morphogenesis in embryonic lung by Rho and cytoskeletal tension. Dev Dyn. 2005;232:268–281. doi: 10.1002/dvdy.20237. [DOI] [PubMed] [Google Scholar]
Associated Data
This section collects any data citations, data availability statements, or supplementary materials included in this article.


