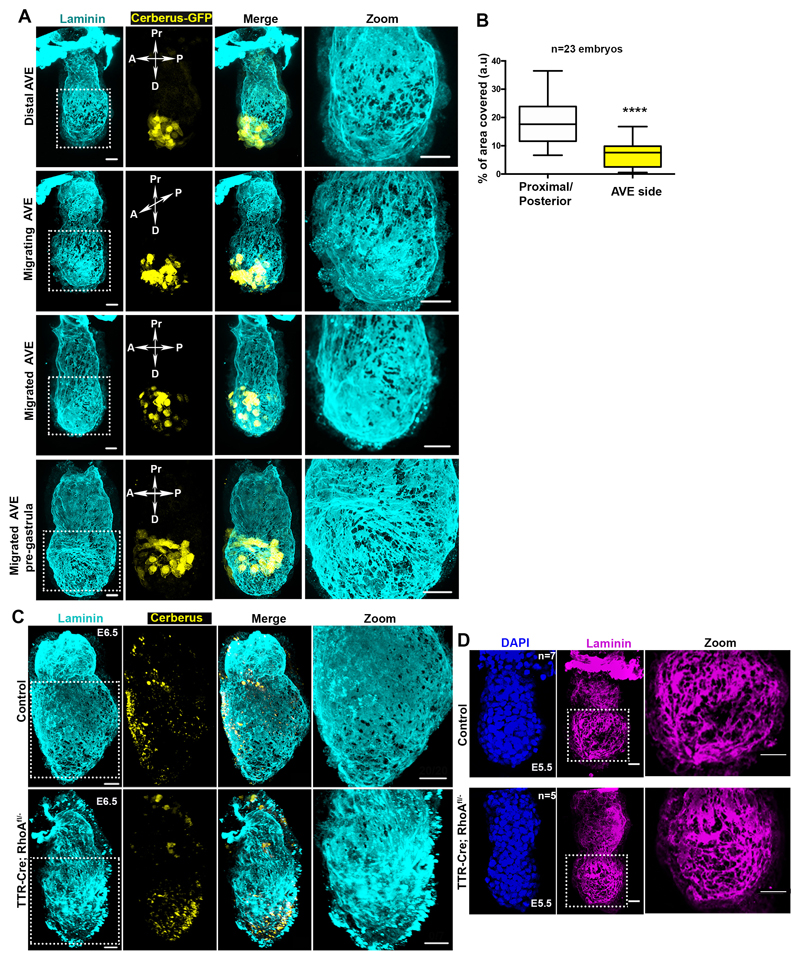
Extended Data Figure 2. AVE migration regulates the distribution of basement membrane perforations.
A) AVE position and basement membrane remodelling using transgenic Cerberus-GFP embryos for AVE identification. n=23 embryos B) Quantification of BM area covered by perforations at regions away (proximal/posterior) or close to AVE side as Figure 2B with embryos from different AVE migration stages pooled together. Two sided unpaired student’s t-test: ***p<0.0001. Centre lines show median values, box limits represent the upper and lower quartiles, and whiskers show min and max range. C) Representative examples of E6.5 pre-gastrula control (n=20 embryos) and TTR-Cre:Rhoafl/- embryos(n= 7 embryos). Blocking AVE migration results in abnormal distribution of basement membrane perforations. D) Representative examples of Control (n=5) and TTR-Cre:RhoAfl/- (n=5) E5.5 embryos. Scale bars=20um.

