

Abstract
Exposure to childhood adversity is common and associated with a host of negative developmental outcomes. The most common approach used to examine the consequences of adversity exposure is a cumulative risk model. Recently, we have proposed a novel approach, the dimensional model of adversity and psychopathology (DMAP), where different dimensions of adversity are hypothesized to impact health and well-being through different pathways. We expect deprivation to primarily disrupt cognitive processing whereas we expect threat to primarily alter emotional reactivity and automatic regulation. Recent hypothesis driven approaches provide support for these differential associations of deprivation and threat on developmental outcomes. However, it is not clear whether these patterns would emerge using data-driven approaches. Here we use a network analytic approach to identify clusters of related adversity exposures and outcomes in an initial study (Study 1: N = 277 adolescents aged 16–17 years; 55.1% female) and a replication (Study 2: 262 children aged 8–16 years; 45.4% female). We statistically compare our observed clusters with our hypothesized DMAP model and a clustering we hypothesize would be the result of a cumulative stress model. In both samples we observed a network structure consistent with the DMAP model and statistically different than the hypothesized cumulative stress model. Future work seeking to identify in the pathways through which adversity impacts development should consider multiple dimensions of adversity.
Keywords: Graph Theory, Network Analysis, Deprivation and Threat, Dimensional Model, Adversity, Executive Function, Emotion Regulation
Introduction
Exposure to childhood adversity is common, with more than half of children in the United States experiencing at least one form of adversity by the time they reach adulthood (Green et al., 2010; McLaughlin et al., 2012). It has been clearly demonstrated that these experiences are strongly associated with risk for negative outcomes in childhood, adolescence, adulthood, and late adulthood (Cicchetti & Toth, 1995; Green et al., 2010; McLaughlin et al., 2010). The prevailing approach used to examine the consequences of adversity exposure for health is a cumulative risk model (Evans, Li, & Whipple, 2013; Felitti et al., 1998). In this model the number of exposures to adversity is summed to create a risk score which is used to predict outcomes such as cognitive abilities, emotion regulation, or psychopathology (Evans et al., 2013). The cumulative risk model has been useful in highlighting the strong links between adversity exposure and health outcomes and has pushed the field toward reducing exposure to adversity and providing intervention to the most vulnerable. However, the cumulative risk model gives little guidance with regards to the mechanisms through which adversity increases risk for health problems and health behavior. This approach, where all forms of adversity are counted and summed, implicitly assumes that all forms of adversity function through the same mechanisms.
While there are clearly shared mechanisms linking adversity with downstream outcomes (e.g., disruption in physiological stress response systems; Gunnar & Quevedo, 2007), our recent work has emphasized an alternate approach for identifying developmental mechanisms that may be specific to certain forms of adversity but not others. This alternative to the cumulative risk model, the dimensional model of adversity and psychopathology (DMAP; McLaughlin & Sheridan, 2016; McLaughlin et al., 2014; Sheridan & McLaughlin, 2016; Sheridan & McLaughlin, 2014), is based on two principles. First, across the range of adverse childhood experiences (e.g., maltreatment, community violence, lack of educational resources), different types of adversity share common features along core underlying dimensions. Two initial dimensions proposed in our model are threat, which encompasses experiences of interpersonal violence involving harm or threat of harm, and deprivation, which involves an absence of expected caregiver inputs from the environment resulting in a reduction in cognitive and social stimulation. Many previous studies have linked these threat exposures with disruption in fear learning, attentional biases to negative emotional stimuli, heightened emotional reactivity, and difficulties with emotion regulation (Busso, McLaughlin, & Sheridan, 2016; McCrory et al., 2013; McLaughlin, Peverill, Gold, Alves, & Sheridan, 2015; McLaughlin et al., 2016; Pollak & Tolley-Schell, 2003; Raineki et al., 2010; Roth & Sullivan, 2005) In contrast, exposure to deprivation (e.g., institutionalization, neglect) or a lack of cognitive stimulation and enrichment is associated with difficulties with language, executive function, and complex cognitive problem solving (Bos, Fox, Zeanah, & Nelson Iii, 2009; Dubowitz, Papas, Black, & Starr, 2002; Eigsti, Weitzman, Schuh, de Marchena, & Casey, 2011; Pollak et al., 2010; Raikes et al., 2006; Sheridan, Peverill, Finn, & McLaughlin, 2017; Tibu et al., 2015). Relatedly, low parental education is associated with decreased exposure to language, linguistic complexity, educational resources (e.g., books), and less time spent in scaffolded learning interactions with caregivers resulting in reductions in executive function and performance on verbal tasks (Bradley et al., 2001; Britto & Brooks-Gunn, 2001; Linver et al., 2002; Rosen, Sheridan, Sambrook, Meltzoff, & McLaughlin, 2018; Sarsour et al., 2011; Sheridan, Sarsour, Jutte, D’Esposito, & Boyce, 2012). In sum, existing evidence from human and animal models supports the idea that deprivation and threat impact neural and cognitive function in different ways.
Reflecting this evidence, the DMAP proposes that deprivation and threat have distinct influences on developmental pathways. We expect threat to primarily influence the development of emotion reactivity and automatic regulation processes, whereas we expect deprivation to primarily influence cognitive developmental processes. In the DMAP, indicators of threat or deprivation would be predictors, and indicators of emotional or cognitive processing would be outcomes. Given that threat and deprivation-related adversities often co-occur (Green et al., 2010; McLaughlin et al., 2012), it is essential to examine their unique effects by adjusting for exposure to both forms of adversity simultaneously. Other groups have also argued for the importance of considering sub-types and underlying dimensions of maltreatment and childhood adversity (Humphreys & Zeanah, 2015; Manly, Cicchetti, & Barnett, 1994; Manly, Kim, Rogosch, & Cicchetti, 2001). Thus, this aspect of our model is conceptually similar to ideas that have long been articulated in the childhood adversity field but are often ignored in current approaches relying on cumulative risk. Further, in several recent studies, we have demonstrated the utility of the DMAP in identifying unique developmental processes associated with deprivation and threat (Lambert, King, Monahan, & McLaughlin, 2016; Miller et al., 2019; Sheridan, Peverill, Finn, & McLaughlin, 2017).
In this prior work, we used a hypothesis driven approach to examine the predictions of our conceptual model, showing that deprivation exposure predicted deficits in executive function and linguistic ability after controlling for threat (Machlin, Miller, Snyder, Mclaughlin, & Sheridan, 2019; Miller et al., 2018; Sheridan et al., 2017) and that threat predicts emotion reactivity and automatic regulation after controlling for deprivation exposure (Lambert, King, Monahan, & McLaughlin, 2016; Machlin, Miller, Snyder, McLaughlin, & Sheridan, 2019). Demonstrating specificity in the associations of threat and deprivation with developmental outcomes is an important first step in that it establishes the possibility that these pathways are specifically associated with particular forms of adversity. However, it is unknown whether this type of specificity would emerge from a data-driven analysis where the underlying associations within the data drive the clustering of adversity and particular outcomes. Approaching the question with a data-driven analysis represents a rigorous approach to testing our conceptual model that has yet to be undertaken. In the current paper, we sought to demonstrate that deprivation and threat covary with specific neurocognitive mechanisms using a data-driven application of graph-theoretical network analysis.
Networks have become a powerful tool in representing and analyzing relationships between objects. It has been applied to studying social relationships between people, chemical reactions between proteins, and physical connections between computers, just to name a few. Essential components of a network are nodes (the objects of interest) and edges (the relationships between the objects). These nodes can represent any form of data and the edges can be measured by a wide variety of correlation techniques. This flexibility of the network model, along with useful data visualization and robust clustering algorithms are why this analytic approach has gained popularity recently. We also chose network analysis because it allows one to examine covariation of a wide variety of data types in the same analytic model (Epskamp & Fried, 2016) and because a variety of robust clustering techniques have been developed for use within network analyses (Fortunato, 2010). Another potential approach to this analytic problem would have been latent class analysis which differs from network analysis here in the types of clustering used and in data visualization. Indeed, it would be informative in future work to compare these two approaches.
One of the primary arguments for the cumulative risk model is that children who encounter one adversity are likely to experience multiple adversities, the effects of which are challenging to disentangle. Consistent with this claim, population-representative data suggests that adversities are co-occurring, such that children experiencing one adversity are often exposed to several others (McLaughlin et al., 2012). Further, these adversities are often clustered by poverty (Duncan & Brooks-Gunn, 1999). The cumulative risk approach addresses this clustering by simply counting the number of adversities, assuming that they all will have similar associations with downstream outcomes. Here, we propose a different approach. We hypothesize that we will be able to observe specificity in the associations of adversities with developmental outcomes if we include both measures of adversities (e.g., indicators of dimensions of deprivation or threat) and outcomes (e.g., indicators of cognitive and emotional function) together in the same network analysis. We hypothesize that adversities within a dimension (i.e. physical abuse and community violence exposure) will cluster with similar outcomes (i.e., emotion reactivity and automatic regulation). In contrast, adversities reflecting different dimensions (i.e. parent education and community violence exposure) will cluster with different outcomes. We hypothesize that the association between adversity and outcome (the central tenet of the DMAP) will be strong and consistent enough so that instead of simply observing a network of co-occurrence (e.g., where poverty clusters with abuse because they often happen to the same child) to reveal separate clusters of deprivation and threat. In Figure 1 we show this hypothetical process where including outcomes ‘re-organizes’ the initial co-occurrence network. Thus, adversities will cluster together as a function not of their co-occurrence in the population but as a result of their impact on the child.
Figure 1.
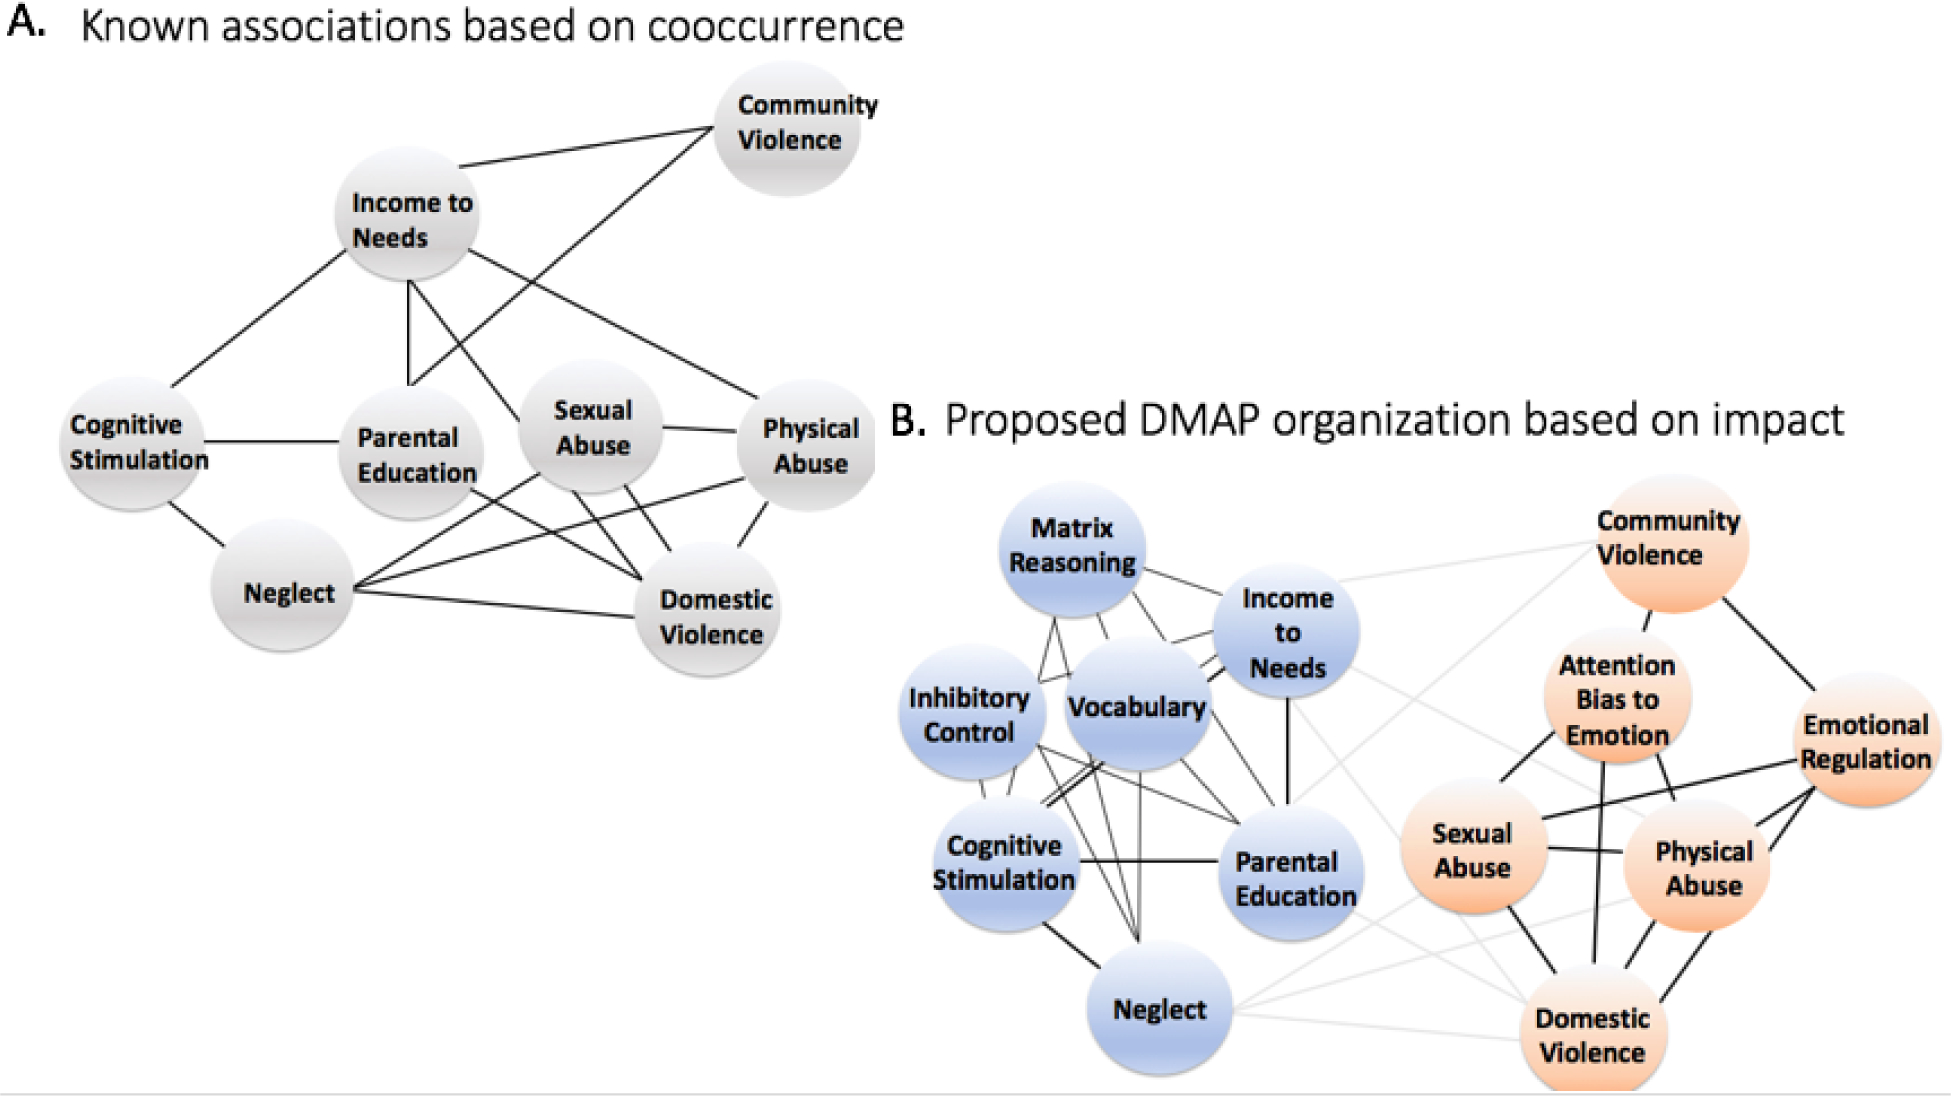
Here we present hypothetical network analyses for illustration purposes. As is traditional for network analyses, we represent variables as nodes (circles) and associations between variables as edges (lines). In A. we show the known associations among adversity exposures based on co-occurrence. In B. We show the hypothesized new connections between exposures and outcomes, according to the DMAP which we hypothesize will reorganize adversity into two separate clusters, a deprivation and a threat cluster.
A related use of network analysis has recently garnered extensive attention as a method to examining the complex relationships among symptoms of psychopathology (Borsboom & Cramer, 2013; Cramer, Waldorp, van der Maas, & Borsboom, 2010). Here, we perform a network analysis in two unrelated samples providing a test case (Study 1) and a replication (Study 2). Both datasets are drawn from community samples of children and adolescents with variability in exposure to interpersonal violence and poverty. The first sample was recruited with the goal of achieving variability in socio-economic status (SES) and the second sample was recruited with the intention of identifying youth exposed to maltreatment. Similar data were collected in both samples (e.g., community violence, parental education) but the source of the information varies (child, parent). In addition, multiple tests assessing cognitive and emotional function are used across the two studies. These differences between datasets and our two-study approach makes this a robust test of the idea that a data-driven approach will reveal an observed network which is more reflective of the DMAP than a cumulative risk model.
Importantly, we will test if (a) the two-cluster network structure predicted by the DMAP is observable in these samples and if (b) the observed network structure differs significantly from the network structure predicted by the cumulative risk approach. If the DMAP best describes the actual associations among adversity exposures and emotional and cognitive functions, we expect to observe a two-cluster solution. Within each cluster, we expect to see either variables reflecting deprivation exposure and cognitive task performance or variables reflecting threat and emotional task performance. However, if the cumulative risk model best describes the associations among adversity exposures and emotional and cognitive functioning, we expect to observe a single cluster (or many small clusters) where it is equally likely that emotional and cognitive functioning will correlate with deprivation or threat exposures. Thus, if we observe non-trivial clusters within our network we can conclude that this approach does not best describe the ‘ground truth’ with regards to the association between adversities and cognitive and emotional outcomes.
Study 1
Participants
A sample of 277 adolescents aged 16–17 years (55.1% female) was recruited in three urban centers in the United States (Boston, MA, Pittsburgh, PA, and Seattle, WA) using strategies that ensured variation in SES, and exposure to adversity. Advertising was focused at community centers, local schools, after-school programs, and public transportation in diverse neighborhoods, including low SES areas. Community health, mental health, and education organizations that provided services to adolescents exposed to trauma were also targeted. The sample was racially and ethnically diverse (41.8% White, 21.1% Black, 16.4% Asian, 6.4% Hispanic, and 14.3% biracial or other). Informed consent was obtained from parents, and adolescents provided assent. Multiple published studies have used this dataset to examine related questions (Heleniak, King, Monahan, & McLaughlin, 2017; King, McLaughlin, Silk, & Monahan, 2017; Lambert et al., 2016). In the present study we focus on the interrelationships among all deprivation, threat, and relevant outcome variables using a network analysis which was not assessed in any previously published paper. In all network analyses, age, gender, and site of data acquisition were included as covariates.
Measures
Here we briefly describe measures used for each node in the network analysis.
Threat.
Physical Abuse and Sexual Abuse were measured on the child trauma questionnaire (CTQ). The CTQ assesses the frequency of exposure to abuse and neglect during childhood and adolescence (Bernstein, Ahluvalia, Pogge, & Handelsman, 1997). This measure has high internal consistency, test–retest reliability, and convergent and discriminant validity with clinician ratings of maltreatment and trauma interviews (Bernstein et al., 1997, 2003). To capture items related to the dimension of threat, the summed physical abuse and sexual abuse subscale scores were used. These items had high reliability in this sample (α = 0.77 and α = 0.92 respectively). Approximately 25.1% of the sample met criteria for exposure to child abuse based on a previously validated CTQ cutoff with maximal sensitivity and specificity for detecting clinically significant abuse exposure reported during in-depth clinical interviews (Walker et al., 1999).
Direct Community Violence was measured using the Screen for Adolescent Violence Exposure (SAVE; Hastings & Kelley, 1997). Scores of 12 items assessing direct exposure to violence in the community (e.g., being mugged or seeing someone get shot) were summed to produce a direct exposure to community violence exposure score. Items used to produce the score were distinct from items on the CTQ. The SAVE had high reliability in this sample (α = 0.75).
Family Violence was measured using the Family Conflict Tactic Scale (CTS). The CTS measures strategies used by families to negotiate instances of disagreement (Straus, 1979). The CTS presents a set of possible conflict resolution tactics (e.g., “discussed an issue calmly” or “threw something at another family member”) and parents are asked to endorse how commonly they are used. Here we used the physical conflict subscale. These nine items had high reliability in this sample (α = 0.93).
Deprivation
Parent Education 1 and 2.
A parent or guardian completed a demographic survey asking them the highest level of education they obtained. This was scored from 1 (less than high school) to 10 (post-graduate degree). Parental education in this sample ranged from 1 to 10 with 16.1% (parent 1) and 8.7% (parent 2) reporting having a high school degree or less.
Physical Neglect was measured using the physical neglect subscale of the CTQ, the same questionnaire used to assess abuse. Reliability for this subscale was low (α = 0.40), which we have discussed extensively in previous publications (Lambert et al., 2017). This subscale includes two items that refer to material deprivation (i.e., “I didn’t have enough to eat” and “I had to wear dirty clothes”), two items that refer to the availability of caring and responsive adults (i.e., “I knew there was someone to take care of me and protect me” and “There was someone to take me to the doctor if I needed it”), and one item that refers to parental substance abuse (i.e., “My parents were too drunk or high to take care of the family”). We did not include the emotional neglect scale in our analyses, as this sub-scale was not validated in the original CTQ validation studies (Bernstein et al., 1997) and, in our view, does not represent a valid measure of neglect. The emotional neglect sub-scale consists entirely of items reflecting family cohesion (e.g., “My family was a source of strength and support”, “There was someone in my family who made me feel important and special”) that are reverse-scored. In addition to the fact that there are many reasons a child might endorse low levels of family support in the absence of neglect, this measure does not conform to accepted standards for assessing neglect that emphasize a focus on specific parental behaviors rather than appraisals (Kantor et al., 2004).
Developmental Outcomes
The Emotional Stroop Adaptation Score from the emotional stroop task (Etkin, Egner, Peraza, Kandel, & Hirsch, 2006) assesses automatic emotion regulation through measuring adaptation to emotional conflict. The emotional Stroop task assesses the ability to inhibit a behavioral response to emotional content. In this version of the emotional Stroop, participants viewed a face with either a happy or a fearful expression overlaid with the word “HAPPY” or “FEAR”. Participants were asked to categorize the facial expression, while ignoring the word. During congruent trials, the facial expression and written word matched; during incongruent trials they did not. Because word reading is highly practiced, and therefore automatic, ignoring the word requires inhibitory control. This task requires both complex cognitive abilities and emotion regulation to perform.
To measure automatic emotion regulation we isolated the impact of the emotional stimuli on task performance, by measuring adaptation to emotional conflict (Egner, Etkin, Gale, & Hirsch, 2008; Etkin, Egner, Peraza, Kandel, & Hirsch, 2006; Etkin et al., 2010; Gyurak, Gross, & Etkin, 2011). The need to resolve conflict on an incongruent trial improves performance on a subsequent incongruent trial. If an incongruent trial is followed by another incongruent trial, task performance is facilitated on the second trial. This effect has been referred to as a form of automatic emotion regulation and is termed the adaptation effect. To assess general task performance, including both inhibitory control and emotion identification we also measured total accuracy across trial type (Overall Performance on Emotional Stroop). This is a non-specific indicator of both emotion identification and general taskrelated cognitive abilities such as response inhibition.
PASAT Time to Quit was the elapsed duration before participants quit the Paced Auditory Serial Addition Task (PASAT). This has been used as a measure for distress tolerance (Leyro, Zvolensky, & Bernstein, 2010), but also taps attention, working memory, and math facility (Tombaugh, 2006). In the PASAT, numbers were presented on a computer screen, and participants were asked to sequentially add each number to the number presented previously, before the subsequent number appeared on the screen. Responses were recorded by the research assistant. The task consists of three blocks. In block 1 the latency between trials is 3 seconds, this decreases to 2 seconds in block 2, and 1 second in block 3. The blocks also differed in length from 60–92 trials. At the beginning of the third block, participants were told that they could terminate the task at any time by informing the experimenter.
Arrows Switching Task is a subtest of the Developmental Neuropsychological Assessment II (NEPSY; Brooks, Sherman, & Strauss, 2009) which measures participants ability to inhibit a prepotent response, and switch between different unpracticed motor responses. Participants viewed rows of black and white arrows pointing either up or down. In the baseline trial, participants were asked to say the direction that each arrow was pointing. In the inhibition trial, participants were asked to say the opposite direction that each arrow was pointing. In the switching trial, participants were asked to say the direction that white arrows were pointing and the opposite direction that black arrows were pointing. The largest difference in time to completion on the arrows task was between the baseline and switching trials. To isolate the impact of switching between rules on performance, the time taken to complete the baseline trial was subtracted from the time required to complete the switching trial Performance on Vocabulary and Matrix Reasoning were measured using the vocabulary and matrix reasoning subtests of the Wechsler Abbreviated Scale of Intelligence (WASI). The WASI is a normed cognitive assessment suitable for participants ages 6–80 years, here we use the scaled score. The vocabulary subtest assesses participant’s knowledge of the definitions of words. The matrix reasoning subtest assesses participant’s ability to identify patterns in visual images. At the level of the population average scaled scores for vocabulary and matrix reasoning are t-scores with a mean of 50. Scores in this sample fell within the normal range (vocabulary mean: 52.9, standard deviation: 10.33; matrix reasoning mean:52.3, standard deviation: 9.8)
Analysis
The network analysis consists of five main components. First, we imputed missing data to generate multiple complete datasets. Second, from each of the imputed datasets, we created an association matrix where the correlation between each pair of variables was computed, controlling for all other variables, and this association matrix was converted to a network. Third, we averaged over all the networks to obtain an average association network and compared it to the network we would expect based on the cumulative risk model (Figure 2A). The expected DMAP network would contain two clusters, one with indicators and hypothesized outcomes of threat and the other with indicators and hypothesized outcomes of deprivation. In contrast, because the cumulative risk model posits that all forms of adversity exposure are equifinal with regards to outcome, the hypothesized cumulative risk network would contain a single cluster. In this cluster all forms of adversity would be equally likely to be associated with all outcomes or the network could be fully connected, where all forms of adversity would be equally connected to each other and to all outcomes. We tested the statistical difference between the observed network and both of these hypothesized cumulative risk networks with bootstrap resampling. Within each constructed network we identified clusters of variables using several different community detection methods. As the community detection methods might find different clusters, we applied a systematic approach to unifying the clusters identified from different methods, creating a consensus clustering, and statistically compared this consensus clustering to our hypothesized DMAP clustering, again with the bootstrap approach (Figure 2B). Each of these steps is described in greater detail below.
Figure 2:
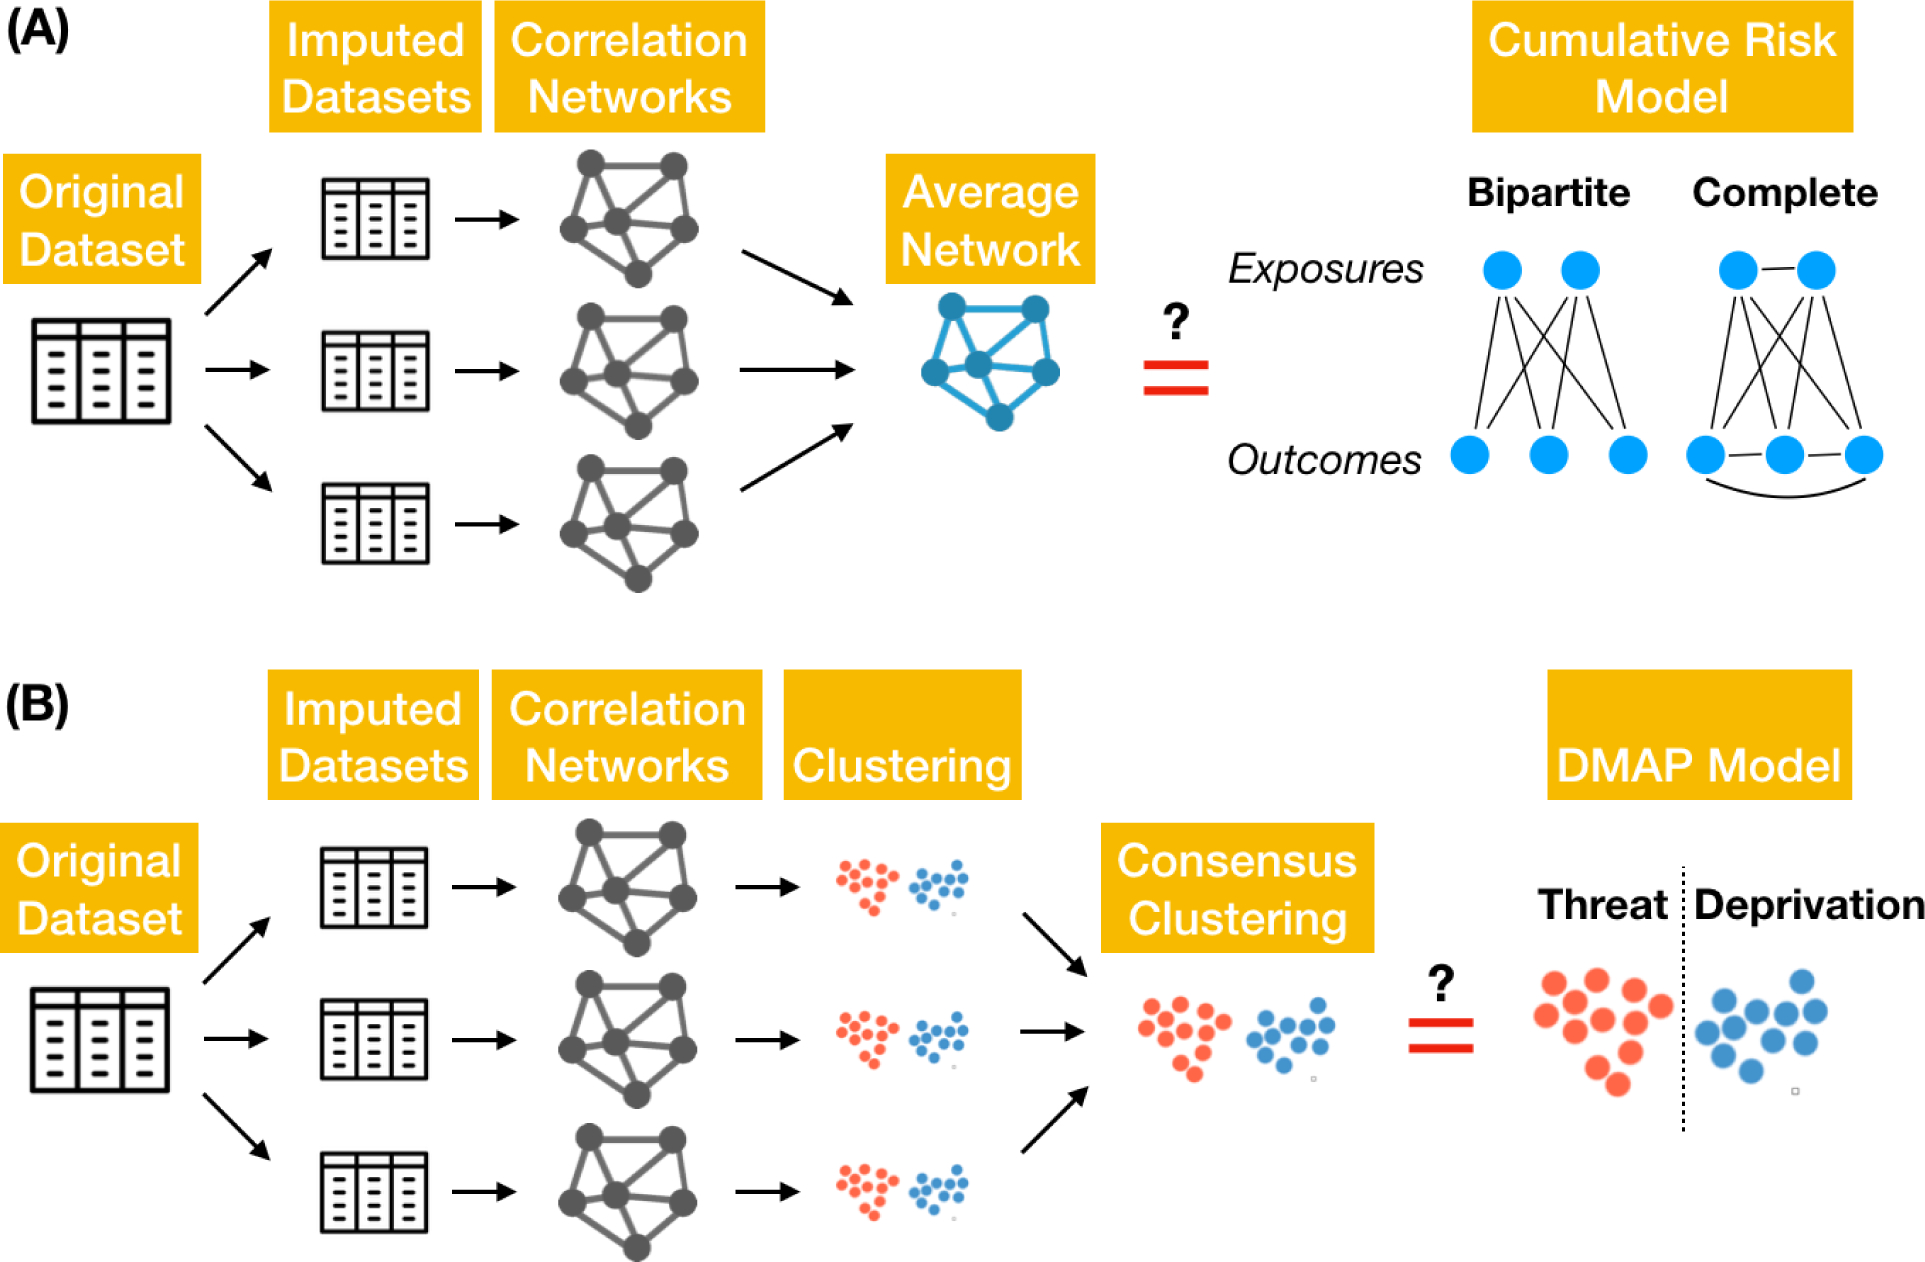
A sketch of the network analysis. (A) We constructed the average association network between the variables, and tested the statistical difference between this network and what would be expected from the cumulative risk model. (B) We further obtained a consensus clustering of the variables where we accumulated information across four separate clustering approaches, and statistically compared this consensus clustering to our hypothesized DMAP clustering.
Missingness
The range of missing data was low (0 – 3.2%) for all variables except parental education. Parent 1 data were missing 5.1% of the time (n=14), and Parent 2 data were missing 8.3% of the time (n=23). The LMCR test was significant (Chi-Square = 165.77, df = 129, p = .02), suggesting that data were not missing completely at random. Because data were missing at a very low rate, groups with and without data weren’t significantly different from each other on most variables, and considering the robust nature of bootstrap resampling approaches, we continued with the planned analysis.
Multiple Imputation
To impute missing values we use the multivariate imputation by chained equations (MICE) implemented in the R package ‘mice’ version 2.30 (Azur, Stuart, Frangakis, & Leaf, 2011; Buuren & Groothuis-Oudshoorn, 2010). Based on the distribution of observed values, MICE draws from a posterior distribution and imputes missing data. Instead of yielding one set of values for the missing data, this approach generates multiple different imputed datasets to account for the statistical uncertainty due to missing values. Unless otherwise stated, we generated 100 imputed datasets in all our analyses.
Network Construction
From every imputed dataset, we constructed a network where nodes represent the variables (including exposure, outcome and control variables) and edges between the nodes represent associations between the variables. To quantify the associations between variables we employed a Mixed Graphical Model to fit a weighted network to the data, implemented in the R package “mgm” version 1.2 (Haslbeck & Waldorp, 2015; also see Epskamp & Fried, 2016 for a detailed review on correlation networks). This approach allowed us to use both categorical and continuous variables as nodes. To increase the robustness of the estimates and limit spurious edges in the network (Epskamp & Fried, 2016), we applied a LASSO regularization to the resulting association matrix. The LASSO regularization adds a penalty term to the model which is proportional to the magnitude of the weights of the edges so that sparse networks will be preferred. The parameter that balances this penalty term and the model is selected by the Extended Bayesian Information Criterion (Haslbeck & Waldorp, 2015) with default hyperparameter γ = 0.25.
To summarize across all the association networks, we also calculated an average association matrix over all the matrices and constructed an average association network from it. We then quantified statistical variations around this average using bootstrap resampling and assessed how likely the cumulative risk model network would be observed by chance (see Hypothesis Testing). But we did not perform clustering on this average network, as clusterings might have large variations across imputations. Instead, we performed clustering on the network from each imputed dataset and constructed a consensus clustering.
Community Detection and Consensus Clustering
After constructing a network from each imputed dataset, we identified clusters within the network using four community detection methods. These four methods are: 1) modularity optimization (Blondel, Guillaume, Lambiotte, & Lefebvre, 2008) - the most commonly used approach; 2) label propagation (Raghavan, Albert, & Kumara, 2007); 3) spectral clustering (Newman, 2006); and 4) infomap (Rosvall & Bergstrom, 2008) which is based on random walks on networks and takes an information theoretical approach to define communities. The methods may find different clusters, since they focus on different aspects of the networks and the network structures themselves might be noisy. But if a network has a nontrivial clustering structure, it should be picked up by most of the methods; in other words, the methods should agree on most of the nodes in terms of how to cluster them. To determine what clustering structure emerged from these four methods, we used the consensus clustering approach (Lancichinetti & Fortunato, 2012). This approach allows us to combine the clustering results from different methods to obtain a “point estimate” of the clustering of variables. We term this point estimate ‘clustering’ in the following sections. This approach also allows to combine the clustering results across all the networks and construct a final consensus clustering. By integrating information from different methods and different imputations, core structures of the networks (e.g., presence of a two-cluster structure) are magnified while noise is attenuated (Lancichinetti & Fortunato, 2012).
Bootstrap and Hypothesis Testing
We statistically compared the observed network structures to (1) two networks predicted by the cumulative risk model, and (2) the clustering structure from DMAP (Figures 4 and 5).
Figure 4.
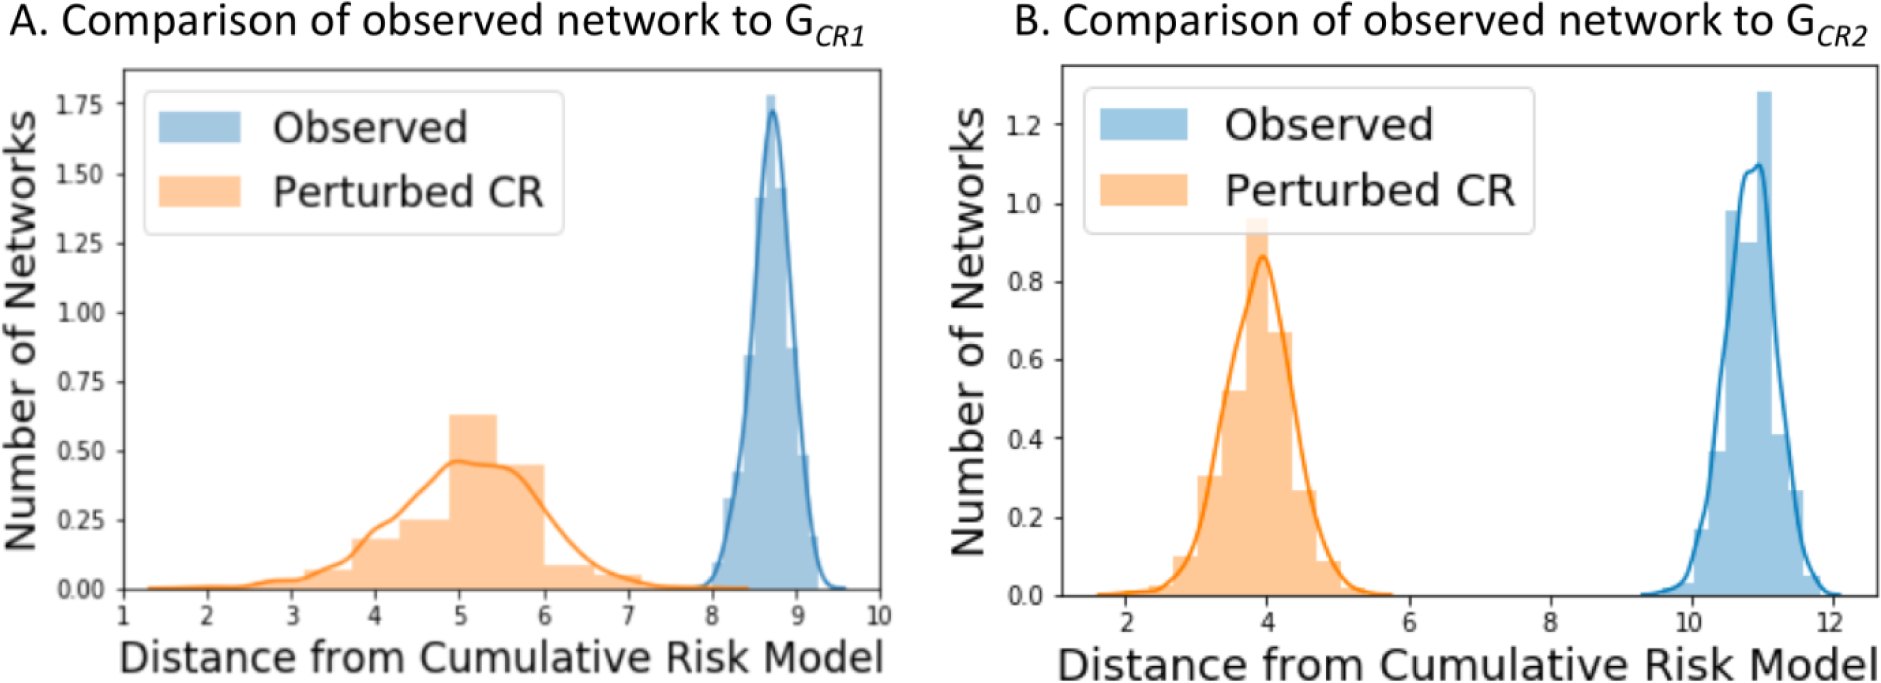
The distribution of distances between the observed networks and the cumulative risk model (blue) and the distribution of distances between the cumulative risk model and its random perturbations (orange). The X-axis shows the graph edit distances from the cumulative risk model. The Y-axis shows the number of networks (constructed from data or randomly perturbed from the CR model) for which a specific graph edit distance was observed, appropriately normalized to match the kernel densities. Panel A shows these distributions for distances from GCR1, Panel B shows these distributions for distances from GCR2.
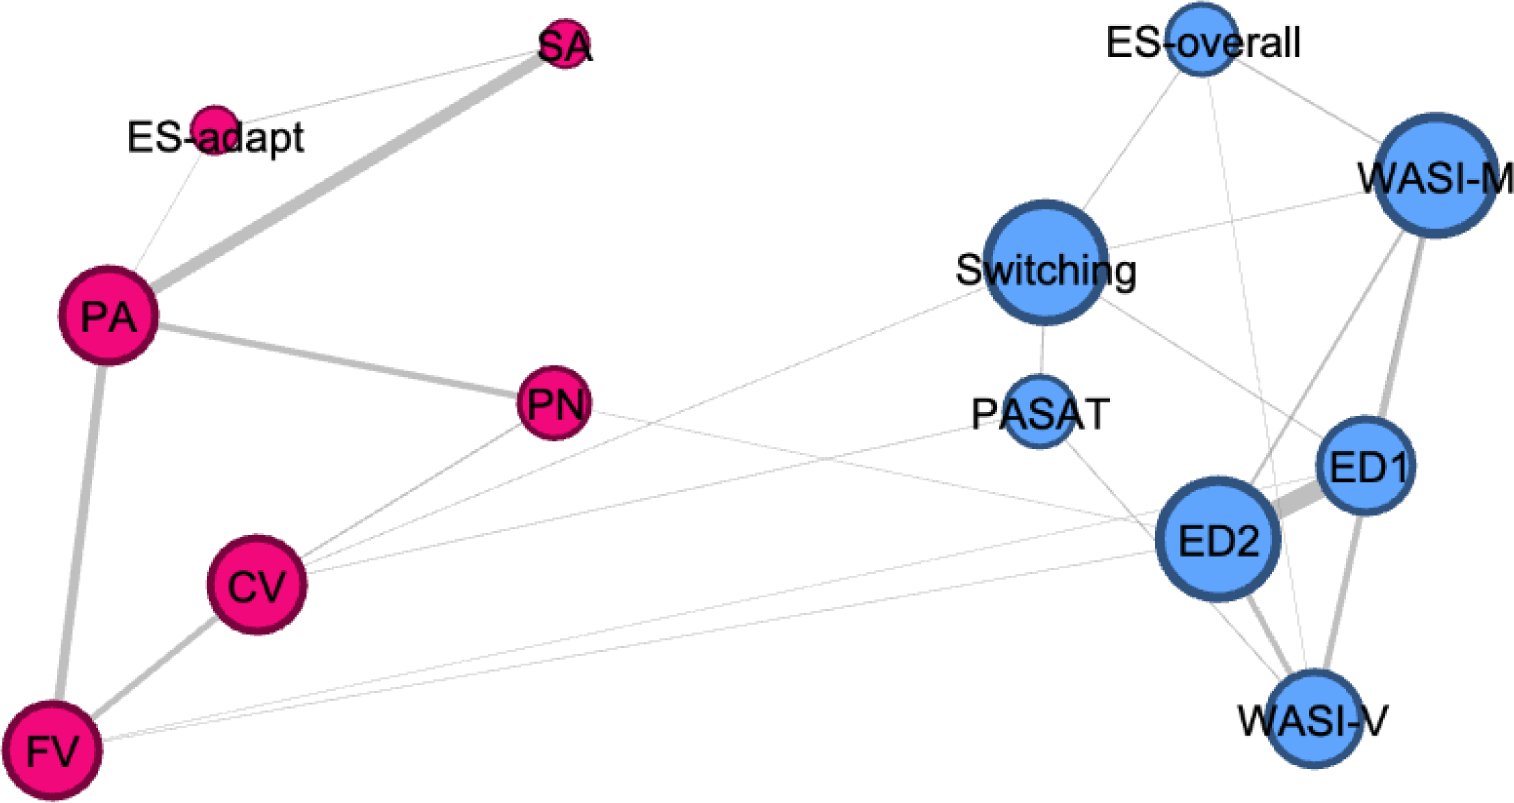
Figure 5.
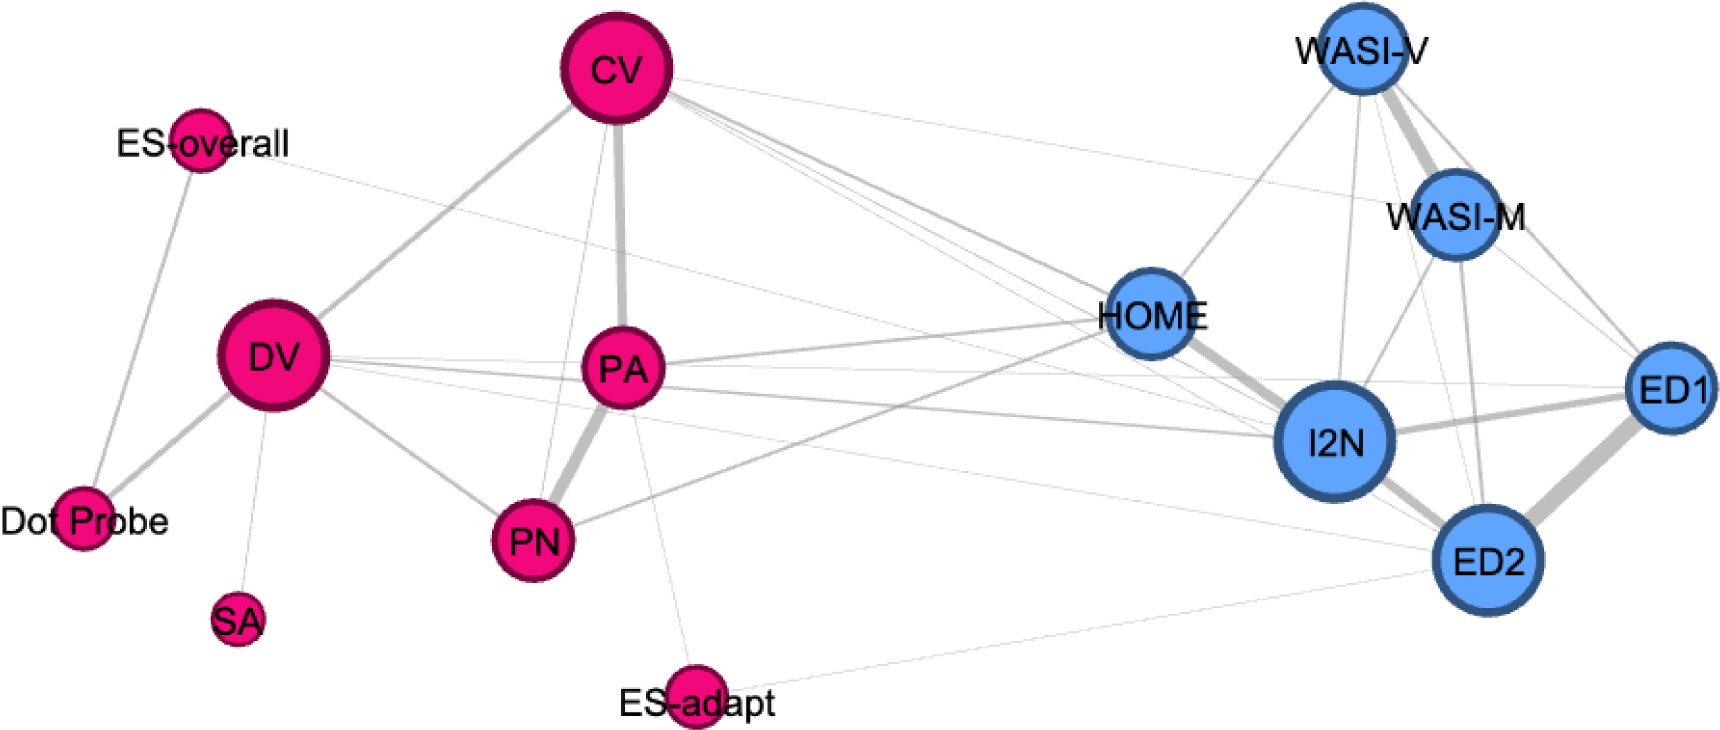
Study 2 final network results. This network is characterized by two clusters according to our consensus clustering approach. The network visualization is produced by the software Gephi (version 0.9). Sexual abuse (SA), Physical abuse (PA), Physical neglect (PN), Domestic violence (DV), Direct community violence (CV), Family violence (FV), Emotional stroop adaptation (ES-adapt), Overall performance on emotional stroop (ES-overall), Threat bias in dot probe (dot probe), Performance matrix reasoning (WASI-M), Performance vocabulary (WASI-V), Parent 1 education (ED1), Parent 2 education (ED2), Home Environment questionnaire (HOME), Income to needs (I2N).
To assess the variations of our estimates of the network structures, we took a bootstrap approach to compute the empirical distributions of the association network and the consensus clustering, since no analytical formula is available. Specifically, from each imputed dataset, we sampled the same number of data points with replacement to obtain a bootstrap sample; this procedure was then repeated 10 times to generate multiple bootstrap samples for each imputed dataset, resulting in 1,000 bootstrap samples in total. As described above, an association network and clustering were obtained from each bootstrap dataset. This approach is an extension of the simpler case of scalar estimates in bootstrap inference using multiple imputation (Schomaker & Heumann, 2016), and it allowed us to statistically test our network structures against the cumulative risk model (CR) and the DMAP.
CR Model.
The cumulative risk model assumes that every adversity exposure contributes equally to every outcome, which implies a network where every emotional or cognitive outcome variable is potentially connected to every exposure variable. This is a complete bipartite network with two types of nodes: exposures and outcomes. We denote this network by GCR1. A second possibility is to represent the cumulative risk model as a completely connected network, that is every emotional or cognitive outcome is potentially connected to every exposure and every exposure is potentially connected to every other exposure. We denote this version of the cumulative risk model as GCR2. To assess the difference between these possible cumulative risk networks GCR1 or GCR2 and the observed networks, we calculated the graph edit distance between GCR1 or GCR2 and the network constructed from every bootstrap sample. The edit distance between networks is the minimal number of operations required to transform one network to another. Pooling all the edit distances together we obtained a distribution of differences between GCR1 or GCR2 and the observed networks. This distance distribution yields a 95% confidence interval which can be used to statistically test the null hypothesis that the observed networks are the same as the one predicted by the CR model. If 0 falls outside the confidence interval, the observed networks are statistically different from the cumulative risk model at the .05 level.
To make the test more robust and conservative, we randomly rewired 10% of the edges of the cumulative risk network, resulting in a perturbed cumulative risk network. This random perturbation was performed 1000 times, and we computed the graph edit distance between every one of the 1000 perturbed networks to the original, hypothesized cumulative risk network, obtaining a “reference” distribution of distances. This reference distribution was then compared to the observed distribution of distances using a two-sample t-test. A significant test result suggests that the observed network organization is significantly different than the hypothetical CR network organization.
DMAP.
The DMAP proposes that deprivation and threat exposures will differentially cluster with certain outcomes. Specifically, we anticipate identifying a network consisting of two clusters—deprivation with cognitive outcome variables and threat with emotional reactivity and automatic regulation outcome variables. In this statistical test, we compared the observed clusterings to our proposed DMAP clustering in a similar fashion as for the test of the CR model.
Specifically, we calculated the normalized mutual information (NMI) between the consensus clustering and the clustering from each bootstrap sample. The normalized mutual information is a measure of similarity between clusterings, ranging between 0 (independent clusterings) and 1 (identical clusterings); and hence we take 1 – NMI as a distance measure between clusterings. Pooling all the distances together we obtained a distribution of differences between the consensus clustering and clusterings from bootstrap samples, which represents the statistical variation around the consensus clustering. This empirical distribution of distances allows us to assess the p-value of the distance between the consensus clustering and the DMAP clustering, which is how likely we will observe a distance at least this large with the empirical distribution of distances as a reference. In other words, the p-value is calculated as the fraction of bootstrap clusterings that are further away from the consensus clustering than the DMAP clustering is. A significant test result suggests that the observed network organization is significantly different from the hypothesized DMAP network organization.
Results
Association Network and Consensus Clustering.
The average association network from Study 1 is presented in Figure 3. This figure shows the average network organization across imputations. The network is compromised of nodes (variables) and edges (connections between variables). Edges in this figure are weighted by the average association over 100 imputations. Thicker lines indicate higher edge weights. The size of each node indicates its degree, i.e., the number of edges it has. Result of the consensus clustering is denoted by node colors. This network is consistent with predictions from the DMAP model. This analysis revealed two primary clusters. Abuse, community violence exposure, family violence, and automatic emotion regulation clustered together (pink cluster). We refer to this as the ‘threat cluster.’ In contrast, parental education, overall Stroop accuracy, switching, vocabulary and matrix reasoning, and serial addition clustered together (blue cluster). We refer to this as the ‘deprivation cluster.’ Contrary to our predictions, physical neglect clustered with threat variables.
Figure 3.
Study 1 final network results. This network is characterized by two clusters according to our consensus clustering approach. The network visualization is produced by the software Gephi (version 0.9). Sexual abuse (SA), Physical abuse (PA), Physical neglect (PN), Direct community violence (CV), Family violence (FV), Emotional stroop adaptation (ES-adapt), Overall performance on emotional stroop (ES-overall), Performance matrix reasoning (WASI-M), Performance vocabulary (WASI-V), Arrows switching task (switching), PASAT time to quit (PASAT), Parent 1 education (ED1), Parent 2 education (ED2).
We compared the observed networks to two potential cumulative risk model networks (GCR1 and GCR2). In Figure 4, we show the distribution of distances between the constructed networks from data and the cumulative risk model (blue) and the distribution of distances between the cumulative risk model and its random perturbations (orange). In both cases the two distributions were almost non-overlapping and are statistically different (GCR1: t=120, df=1998, p < 0.001 and GCR2: t=360, df=1998, p < 0.001, in two-sample t tests; GCR1: ks=0.99, p < 0.001 and GCR2: ks=0.99, p < 0.001, in two-sided Kolmogorov-Smirnov tests). The observed networks were significantly further away from both possible cumulative risk models than the random perturbations. Thus, a cumulative risk model, as instantiated in this analysis, does not describe the observed associations among predictors and outcomes.
Finally, we sought to characterize how closely the clustering structure matched our hypothesized DMAP network structure. As can be seen in Figure 3, the observed network did not align perfectly with our hypothesized DMAP network structure (e.g., physical neglect clustered with threat). To assess if the observed clustering was significantly different from the hypothesized DMAP clustering, we carried out the hypothesis test with bootstrapping. The distance between the consensus clustering and the DMAP clustering was 0.36. Given the observed distribution of clustering around the consensus clustering, this distance was likely to have been observed by chance (p = 0.77). Hence, there is not enough evidence to reject the null hypothesis that the DMAP clustering is the same as the observed clustering. This test result, together with the visual comparison in Figure 3, suggest that the DMAP model, although not completely aligned with the consensus clustering, is a good description of the observed network structure.
Discussion.
In Study 1, the observed network structure was largely consistent with the DMAP model using a robust procedure of imputation and bootstrap resampling with consensus clustering across four different clustering approaches. We observed that cognitive measures clustered with parental education. In contrast, all forms of interpersonal violence clustered together with our measure of automatic emotion regulation.
Importantly, we did not observe a network structure consistent with the cumulative risk model. In the cumulative risk model, the mechanistic assumption is that all forms of early adversity will contribute equally to cognitive and emotion regulation outcomes. We were able to reject the hypothesis that the cumulative risk model was the same as the observed network structure.
In sum, this data-driven approach provides initial support for the DMAP model. However, in other uses of this network modeling approach limited replicability of results across datasets has been observed (e.g., Forbes, Wright, Markon, & Krueger, in press). To address this concern, we sought to replicate these findings in a second similar dataset (Study 2).
Study 2
Sample.
A total of 262 children aged 8–16 years (45.4% female) and a parent or guardian were enrolled into the study. Families were recruited to participate in a longitudinal study examining child trauma exposure, emotion regulation, and psychopathology. Data for Study 2 were drawn from the first of three study visits at the baseline assessment. Exclusion criteria included IQ < 80, presence of pervasive developmental disorder, active psychotic symptoms or mania, active substance abuse, and presence of safety concerns. Children and caregivers were recruited for participation at schools, after-school and prevention programs, adoption programs, food banks, shelters, parenting programs, medical clinics, and the general community in Seattle, WA between January 2015 and June 2017. Recruitment efforts were targeted at recruiting a sample with variation in exposure to maltreatmentrelated trauma. To do so, we recruited from neighborhoods with high levels of violent crime, from clinics that served a predominantly low-SES catchment area, and agencies that work with families who have been victims of violence (e.g., domestic violence shelters, programs for parents mandated to receive intervention by Child Protective Services). All procedures were approved by the Institutional Review Board at the University of Washington. Written informed consent was obtained from legal guardians; children provided written assent.
Measures
Whenever possible, we used identical measures in both studies when those variables were available or replaced them with comparable variables in Study 2. In all network analyses, age, gender, and race were included as covariates when estimating the association networks to control for their effect on the relationship between other variables. For example, if two variables are correlated because they both are age related, then controlling for age would remove or attenuate the association between them due to age. However, as age, gender, and race are not variables for adversary exposures and developmental outcomes, they are removed once the association network is constructed; we are not interested in the clustering structure of the control variables, and hence it is not necessary to include them for clustering.
Threat
As in Study 1, we measured Physical and Sexual Abuse using the CTQ. These items had high reliability in this sample (physical: α = 0.82 and sexual: α = 0.94).
Domestic Violence was assessed using CTS, as in study 1. In Study 2, the physical conflict items had high reliability (α = 0.88). In addition, in Study 2, children were asked about witnessing domestic violence on the Violence Exposure Scale for Children-Revised (VEX-R; Raviv et al., 2001; Raviv, Raviv, Shimoni, Fox, & Leavitt, 1999). The VEX-R assesses the frequency of exposure to different forms of violence. Children are presented with a cartoon and caption depicting a child of the same sex witnessing a type of violence (e.g., “Chris sees a person slap another person really hard”) and experiencing that same type of violence (e.g., “A person slaps Chris really hard”). Children are then asked to report how frequently they have witnessed or experienced that type of violence on a Likert scale ranging from 0 (Never) to 3 (Lots of times). We additionally asked children who the perpetrator and victim were for each endorsed item. The VEX-R demonstrates good reliability and has been validated with children as young as second grade (Raviv, et al., 2001; Raviv, et al., 1999). Here, we summed all items of violence endorsed by the child as occurring to a caregiver, internally normalized these items using z-score and summed them with parent report of family violence from the CTS to create a final Domestic Violence score.
Direct Community Violence was assessed using the Juvenile Victimization Questionnaire (Finkelhor, et al., 2005). The JVQ includes 34 items assessing exposure to crime, child maltreatment, peer and sibling victimization, sexual victimization, and witnessing and indirect victimization and has excellent psychometric properties, including test-retest reliability and construct validity. Here we used the exposure to crime subscale. These nine items had high reliability in this sample (α = 0.82).
Deprivation.
Physical Neglect was measured using the physical neglect subscale of the CTQ (α = 0.76). Parent 1 and Parent 2 Education was measured on a demographic form. This was scored from 1 (high school or less) to 4 (post-graduate degree). Parental education in this sample ranged from 1 to 4 with 33.3% (parent 1) and 41.9 (parent 2) of parents reporting having a high school degree or less.
In Study 2, we additionally measured the income-to-needs ratio (Income to Needs). The income-to-needs ratio reflects the ratio of the amount of money a family earns relative to the federal poverty line and is calculated by dividing family income by the poverty level for a family of that size. Values of one or higher indicate that the family is living at or above the poverty line. Values below one indicate that the family is living below the poverty line. In this sample, income to needs ranged between .09 to 10.35, with an average of 3.22 (Income to Needs).
In Study 2, we additionally measured cognitive stimulation in the home using the HOME Environment Questionnaire (Bradley & Caldwell, 1977, 1988; Frankenburg & Coons, 1986). These included questions assessing the family’s investment in cognitive enrichment activities, (e.g., “How many times does your child get out of the house per week for activities other than school (e.g. sports, extracurricular activities, activities with the family?”) as well as the child’s access to cognitively stimulating materials in the home (e.g., “About how many books does your child have?”). Most of the questions assessed these aspects of child life in the present tense but a few specifically assessed early life exposure (e.g., “When your child was under the age of five, about how many times per WEEK did you read to them?”). These were coded as ‘present’ or ‘absent’ in accordance with established coding schemes for the HOME (HOME Environment Questionnaire). These 16 items had acceptable reliability in this sample (α = 0.57).
Developmental Outcomes
Automatic emotion regulation was measured using Emotional Stroop Adaptation Score this metric and Overall Performance on Emotional Stroop were measured in ways identical to those describe for Study 1. The WASI was again used to measure Performance on Vocabulary and Matrix Reasoning. Scores on these WASI subtests in this sample also fell within the normal range (vocabulary mean: 52.1, standard deviation: 9.1; matrix reasoning mean: 57.8, standard deviation: 11.3)
In Study 2 an additional measure of emotion reactivity was included, Threat Bias on Dot Probe, measured using a standard Dot Probe task. In this task, participants viewed two pictures of faces, one on each side of the screen. These pictures appeared for 500 ms. Afterwards a probe appeared on either the right or left side of the screen where one of the pictures had been displayed. The probe was an arrow pointing left or right, and participants indicated with a button press if the arrow was pointing to the left or right. The faces presented were either both neutral or neutral and angry. Attention bias towards threat was calculated using a standard method(Frewen, Dozois, Joanisse, & Neufeld, 2008; Pérez-Edgar et al., 2011; Pérez-Edgar, Taber-Thomas, Auday, & Morales, 2013) of subtracting the average response time for trials where the probe appeared behind the angry face from the average response time for trials where it appeared behind the neutral face. Only accurate trials were included. This threat bias score reflects the degree to which a participant’s attention was captured by an angry face.
Analysis
We derived networks using identical procedures as Study 1
Missingness
The range of missing data were low (0 – 6.5%) for all variables except parental education for Parent 2, which was missing 17.2% of the time (N=43) likely this reflects participants living in a single family household. Little MCAR’s test was significant (Chi-Square = 272.48, df = 176, p < .001), suggesting that missingness was not completely at random.
Results
Association network and consensus clustering.
The average association network from Study 2 is presented in Figure 5. This figure shows the average network organization across imputations. The network is compromised of nodes (variables) and edges (connections between variables). Edges are weighted by the average association over 100 imputations. Thicker lines indicate higher edge weights. The size of each node indicates its degree, i.e., the number of edges it has. Result of the consensus clustering is denoted by node colors. Consistent with predictions from the DMAP model and Study 1, this approach revealed two primary clusters. As observed previously, abuse (sexual, physical), community violence exposure, domestic violence, and the emotional Stroop adaptation score clustered together (Figure 5, red cluster). As predicted, threat bias on the Dot Probe also clustered with threat. As in Study 1, but contrary to our predictions, physical neglect clustered with threat variables. Overall performance on the emotional Stroop task clustered with threat in Study 2, whereas it had clustered with deprivation in Study 1.
We also observed a deprivation cluster. This cluster included maternal education, paternal education, vocabulary and matrix reasoning, consistent with Study 1 (Figure 5, blue cluster). In Study 2, we directly assessed access to cognitively stimulating materials and experiences in the home through a modified HOME interview and income to needs ratio. These both clustered with the other measures of deprivation, as predicted by the DMAP model.
We compared these observed networks to two cumulative risk models. In Figure 6a, we show the distribution of distances between the observed network and the cumulative risk network (blue) and the distribution of distances between the cumulative risk model and its random perturbations (orange) for GCR1. In Figure 6b we show the same distributions for GCR2. In both cases the distribution of distances between our observed networks and the cumulative risk model was tightly distributed around a mean of 9. In contrast, the distribution of differences between the cumulative risk model and random perturbations of that model had a mean around 5.5. As in Study 1, the two distributions were statistically different (GCR1: t = 131, df = 1998, p < 0.001 and GCR2: t = 413, df = 1998, p < 0.001, in two-sample t tests; GCR1: ks=0.99, p < 0.001 and GCR2: ks=0.99, p < 0.001, in two-sided Kolmogorov-Smirnov tests) and the observed networks were significantly further away from the cumulative risk model than the random perturbations of the cumulative risk model, suggesting that our observed network was significantly different from the cumulative risk model. Thus, a cumulative risk model, as instantiated in this network analysis, did not describe the observed associations among predictors and outcomes well.
Figure 6.
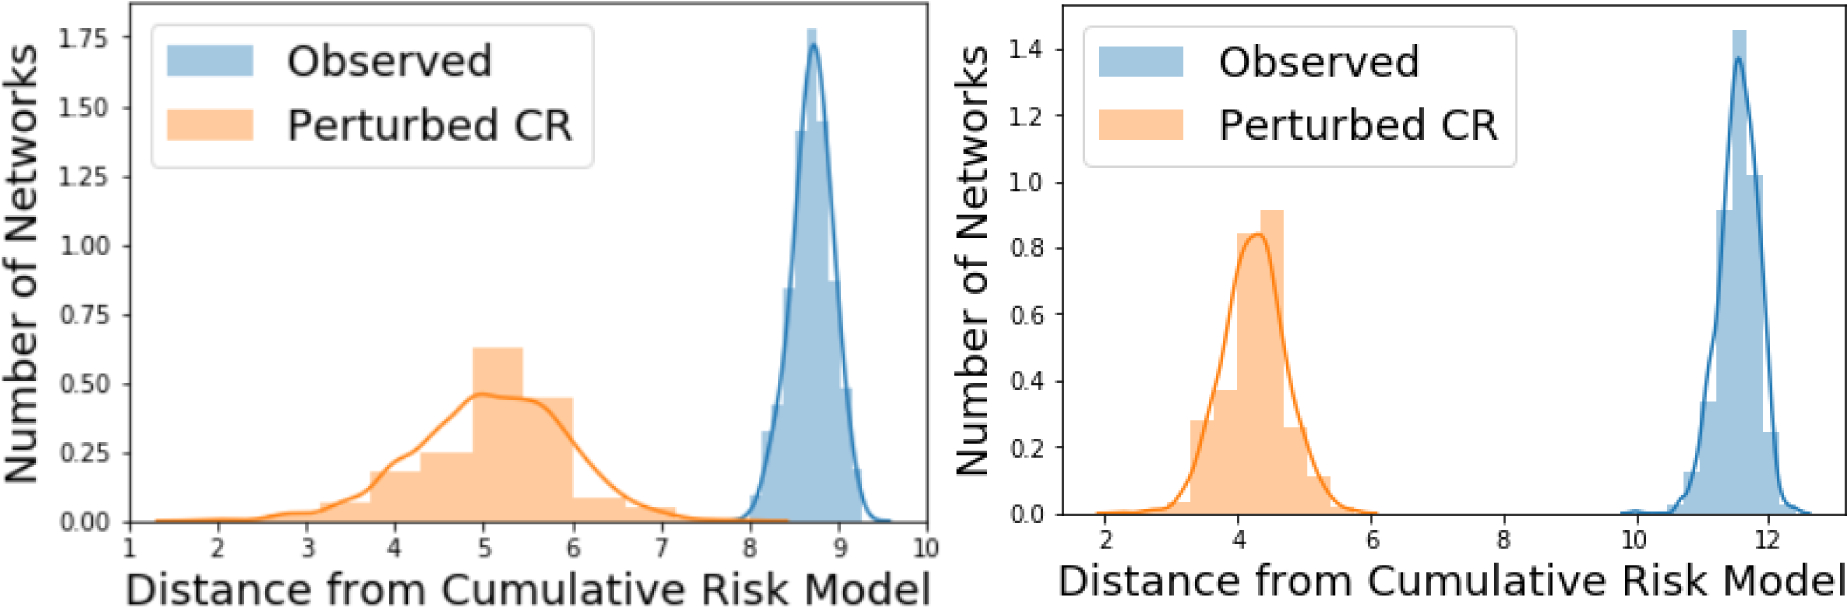
The distribution of distances between the observed networks and the cumulative risk model (blue) and the distribution of distances between the cumulative risk model and its random perturbations (orange). The X-axis shows the graph edit distance from the cumulative risk model. The Y-axis shows the number of networks (constructed from data or randomly perturbed from the CR model) for which a specific graph edit distance was observed, appropriately normalized to match the kernel densities. The left panel shows these distributions for distances from GCR1, and the right panel shows these distributions for distances from GCR2.
Finally, as in Study 1, we examined how closely the observed network and its clustering structure matched our hypothesized DMAP network structure. To identify if the observed clustering structure was significantly different from the hypothesized DMAP clustering, we carried out the hypothesis test with bootstrapping as described above. The distance between the consensus clustering and the DMAP clustering was 0.5. Given the observed distribution of clustering around the consensus clustering, this distance was likely to have been observed by chance (p = 0.78). Hence, there was not enough evidence to reject the null hypothesis that the DMAP clustering was the same as the observed clusterings. This test result, together with the visual comparison in Figure 6, suggest that the DMAP model, although not completely agreeing with the consensus clustering, was a good description of the observed network structure.
Discussion
Study 2 results largely replicated the results from Study 1 in a separate sample. Specifically, we observed network structures consistent and statistically indistinguishable from the DMAP model. In addition, the observed network structure was significantly different than a cumulative risk network, replicating findings from Study 1. Taken together, we show that this data-driven approach provided some initial support for the DMAP model and little support for the cumulative risk model.
General Discussion
In two datasets, we performed a network analysis aimed at identifying observed associations among adversities (e.g., physical abuse, low parental education) and between adversities and outcomes (e.g., response inhibition). We used bootstrap resampling and consensus clustering to identify clustering within the observed networks and to test for statistical differences between the observed and two different hypothetical networks. In both studies we observed clustering that was consistent and statistically indistinguishable from the DMAP model using this data-driven approach. In contrast, the observed networks were significantly different than either version of a hypothesized cumulative risk network in both studies.
One potential conclusion from these observations is that a cumulative risk model does not describe observed associations between adversity exposure and developmental outcomes as well as the DMAP. This possibility is consistent with a growing call within the field to move from the cumulative risk approach in order to better delineate the pathways through which adversity impacts health and well-being, not only by our group (McLaughlin & Sheridan, 2016; McLaughlin et al., 2014; Sheridan & McLaughlin, 2016; Sheridan & McLaughlin, 2014) but many others (Humphreys & Zeanah, 2015; Manly et al., 1994, 2001; Johnson, Riis, & Noble, 2016). Importantly, the cumulative risk approach may be the best approach if the goal is identifying which children are most in need of intervention. A robust literature demonstrates that a cumulative score of adversity exposures is strongly related to mental and physical health problems (Anda et al., 2006; Edwards, Holden, Felitti, & Anda, 2003; Felitti et al., 1998). However, a critical next step for the field is to precisely identify the pathways that underlie these powerful associations in order to facilitate progress in prevention and intervention efforts. It is important to highlight that we focused on outcomes the DMAP theory argues should be selectively related to deprivation and threat (McLaughlin & Sheridan, 2016; McLaughlin et al., 2014; Sheridan & McLaughlin, 2016; Sheridan & McLaughlin, 2014). It may be that a cumulative risk model would best fit the linkages between adversity exposure and outcomes not specifically linked with deprivation or threat, such as HPA axis reactivity.
In both Study 1 and 2, the observed consensus network was statistically indistinguishable from the proposed DMAP network. However, we did not observe our hypothesized DMAP model perfectly. In both studies, physical neglect clustered with threat variables and not deprivation as we predicted. There are several potential reasons for this observation. First, we have argued elsewhere that this subscale does not adequately measure the absence of social and cognitive inputs as only two of the items assess caregiver availability (Lambert et al., 2016). Also, as described in the methods, this subscale has poor reliability, likely due to measuring a small number of loosely related items (e.g., there was always someone to take me to the doctor if needed, and my parents were sometimes too drunk or high to take care of me). Nonetheless, we included it here as it is one of the gold standard measures of neglect in the field. Future work should additionally examine direct observations of the home environment with regards both to neglect and cognitive enrichment. Additionally, this subscale is from the same questionnaire used to measures exposure to sexual and physical abuse. Thus, it is possible that connectivity between this subscale and the others was artificially inflated due to shared method variance. A third possibility is that the co-occurrence between neglect and abuse is sufficiently high that they are not ‘reorganized’ by the outcome variables as we predicted (i.e., the associations of abuse and neglect are stronger than between neglect and cognitive outcomes). This possibility is supported by looking at raw bivariate associations in the data where, in Study 2, physical neglect is strongly associated with physical abuse (r=.56) but less strongly associated with cognitive outcomes such as vocabulary (r=.18), although both associations are significant. In employing the DMAP model, we hypothesized that the associations between ‘outcome’ variables and exposure variables would be sufficiently strong to form the proposed clusters. This may function as expected for exposures such as physical abuse and parental education. But in cases where the correlation between exposures is very high due to cooccurrence or shared method variance, as in abuse and neglect, it may be that associations with outcomes are not strong enough to ‘draw’ the exposures into the proposed clusters.
Two additional considerations indicate that neglect may be considered a form of deprivation. First, previous findings using a hypothesis driven approach have linked neglect with executive functions controlling for threat exposure (Rosen et al., 2018; Sheridan et al., 2017). Second, in severe cases of neglect, such as exposure to institutionalization, strong links with executive functioning and other cognitive abilities have been observed even with stringent controls and in experimental designs (Nelson et al., 2007; Sheridan et al., 2018; Tibu et al., 2016). Future work should adjudicate among the possible reasons we did not observe neglect clustering with other deprivation exposures and outcomes.
The Emotional Stroop Task was administered in both studies and yielded two dependent measures: adaptation to emotion stimuli and overall task performance. In Study 1, overall task performance clustered with deprivation, but in Study 2 it clustered with threat. This likely reflects the non-specific nature of this metric, overall task performance reflects multiple cognitive and emotional processes, including response inhibition—which we hypothesize should cluster with deprivation, and the ability to ignore salient emotional distractors—which we hypothesize should cluster with threat, particularly for fear trials. This makes it difficult to disentangle these contributions to performance.
Our observed network structure resulted from a robust resampling approach with consensus clustering. Further, we replicated findings from Study 1 in an independent dataset. This replication was robust to differences in who reported on various indicators (e.g., community violence, parental education) and to differences in the exact variables used to assess adversity exposure, emotional reactivity and automatic regulation, and cognitive abilities. Finally, our findings here are novel. This use of network analysis has been employed to assess linkages among other psychological variables (Borsboom & Cramer, 2013), but this is the first time this approach has been used to address the association between adversity and developmental outcomes.
Despite these strengths, there are several limitations to the current findings which should be considered. First, we were limited by cross-sectional data. While we ultimately seek to identify directional associations, here we cannot separate exposures (e.g., abuse) and outcomes (e.g., emotion regulation) in time. Second, we were limited by the number of exposures and outcomes measured. Replication of these findings in a dataset with rich measurement of a wider variety of exposures and separation in time between exposures and outcomes is warranted. Finally, network analysis is an emerging discipline and, consistent with the state of the field, we developed our own techniques for hypothesis testing. In particular, we created two possible hypothesized cumulative risk networks based on our understanding of the predictions of the cumulative risk model. We attempted to do this in the most defensible way possible; however, future work may reveal that our hypothesized cumulative risk network should be modified.
The observed networks among adversity and developmental outcome variables across both studies provide preliminary support for the possibility that the pathways linking adversity with emotional and cognitive outcomes in childhood vary systematically across different adversity types. In particular, our findings are consistent with the DMAP conceptual model and inconsistent with a cumulative risk approach that assumes a global set of pathways link adversity with developmental outcomes. Employing this data-driven approach allowed us to assess the linkages among exposures and between exposures and outcomes without imposing hypothesis driven structure which may have biased our findings. Ultimately, these observations serve as an important complement to existing work and highlight the utility of network analysis for disentangling the complex developmental pathways linking early experience to child outcomes.
Research Highlights:
A novel use of network theory reveals clustering of adversities and outcomes in a data-driven analysis, replicated across two samples
This data-driven analysis independently confirms dimensional model of adversity and psychopathology (DMAP)
Adversities characterized by threat cluster with emotion reactivity and automatic regulation whereas deprivation clusters with cognitive outcomes
The observed network is significantly different from a hypothesized cumulative risk model across two independent samples
Acknowledgments:
Analyses reported on in this publication was supported jointly by the US National Institute On Aging of the National Institutes of Health under Award Number U24AG047867 and the UK Economic and Social Research Council (ESRC) and the Biotechnology and Biological Sciences Research Council (BBSRC) under award number ES/M00919X/1 through a subaward to Sheridan. Data collection was supported through NIMH R01 MH103291 to McLaughlin. The content is solely the responsibility of the authors and does not necessarily represent the official views of the funding agencies.
The data that support the findings of this study are openly available in OSF, https://osf.io/43hfq/.
Footnotes
Publisher's Disclaimer: This article has been accepted for publication and undergone full peer review but has not been through the copyediting, typesetting, pagination and proofreading process, which may lead to differences between this version and the Version of Record. Please cite this article as doi: 10.1111/DESC.12934
Conflict of Interest Statement: The authors have no conflicts of interest which impact this work.
Data Availability Statement: The data that support the findings of this study are openly available in Kate McLaughlin and Margaret Sheridan; 2017; Child Maltreatment and Neural Networks Underlying Emotion Regulation; OSF; https://osf.io/43hfq/.
Dataset: Kate McLaughlin and Margaret Sheridan; 2017; Child Maltreatment and Neural Networks Underlying Emotion Regulation; OSF; https://osf.io/43hfq/
References
- Anda RF, Felitti VJ, Bremner JD, Walker JD, Whitfield C, Perry BD, … Giles WH (2006). The enduring effects of abuse and related adverse experiences in childhood. European Archives of Psychiatry and Clinical Neuroscience, 256(3), 174–186. 10.1007/s00406-005-0624-4 [DOI] [PMC free article] [PubMed] [Google Scholar]
- Azur MJ, Stuart EA, Frangakis C, & Leaf PJ (2011). Multiple imputation by chained equations: What is it and how does it work?: Multiple imputation by chained equations. International Journal of Methods in Psychiatric Research, 20(1), 40–49. 10.1002/mpr.329 [DOI] [PMC free article] [PubMed] [Google Scholar]
- Blondel VD, Guillaume J-L, Lambiotte R, & Lefebvre E (2008). Fast unfolding of communities in large networks. Journal of Statistical Mechanics: Theory and Experiment, 2008(10), P10008 10.1088/1742-5468/2008/10/P10008 [DOI] [Google Scholar]
- Borsboom D, & Cramer AOJ (2013). Network Analysis: An Integrative Approach to the Structure of Psychopathology. Annual Review of Clinical Psychology, 9(1), 91–121. 10.1146/annurev-clinpsy-050212-185608 [DOI] [PubMed] [Google Scholar]
- Bos KJ, Fox N, Zeanah CH, & Nelson Iii CA (2009). Effects of early psychosocial deprivation on the development of memory and executive function. Frontiers in Behavioral Neuroscience, 3, 16 10.3389/neuro.08.016.2009 [DOI] [PMC free article] [PubMed] [Google Scholar]
- Bradley RH, Corwyn RF, McAdoo HP, & Coll CG (2001). The home environments of children in the United States part I: Variations by age, ethnicity, and poverty status. Child Development, 72(6), 1844–1867. [DOI] [PubMed] [Google Scholar]
- Britto PR, & Brooks-Gunn J (2001). Provisions of learning experiences in the home and early childhood school readiness are clearly linked. New Directions for Child and Adolescent Development, (92), 1–6. 10.1002/cd.11 [DOI] [PubMed] [Google Scholar]
- Busso DS, McLaughlin KA, & Sheridan MA (2016). Dimensions of Adversity, Physiological Reactivity, and Externalizing Psychopathology in Adolescence: Deprivation and Threat. Psychosomatic Medicine. 10.1097/PSY.0000000000000369 [DOI] [PMC free article] [PubMed] [Google Scholar]
- CICCHETTI D, & TOTH SL (1995). A Developmental Psychopathology Perspective on Child Abuse and Neglect. Journal of the American Academy of Child & Adolescent Psychiatry, 34(5), 541–565. 10.1097/00004583-199505000-00008 [DOI] [PubMed] [Google Scholar]
- Cramer AO, Waldorp LJ, van der Maas HL, & Borsboom D (2010). Comorbidity: A Network Perspective. Behavioral and Brain Sciences, 33(2–3), 137–150. [DOI] [PubMed] [Google Scholar]
- Dubowitz H, Papas MA, Black MM, & Starr RH Jr. (2002). Child neglect: Outcomes in highrisk urban preschoolers. Pediatrics, 109(6), 1100–1107. [DOI] [PubMed] [Google Scholar]
- Duncan GJ, & Brooks-Gunn J (1999). Consequences of Growing Up Poor. Russell Sage Foundation. [Google Scholar]
- Edwards VJ, Holden GW, Felitti VJ, & Anda RF (2003). Relationship between multiple forms of childhood maltreatment and adult mental health in community respondents: Results from the adverse childhood experiences study. The American Journal of Psychiatry, 160(8), 1453–1460. [DOI] [PubMed] [Google Scholar]
- Eigsti I-M, Weitzman C, Schuh J, de Marchena A, & Casey BJ (2011). Language and cognitive outcomes in internationally adopted children. Development and Psychopathology, 23(2), 629–646. 10.1017/S0954579411000204 [DOI] [PubMed] [Google Scholar]
- Epskamp S, & Fried EI (2016). A Tutorial on Regularized Partial Correlation Networks. ArXiv:1607.01367 [Stat]. 10.1037/met0000167 [DOI] [PubMed] [Google Scholar]
- Etkin A, Egner T, Peraza DM, Kandel ER, & Hirsch J (2006). Resolving Emotional Conflict: A Role for the Rostral Anterior Cingulate Cortex in Modulating Activity in the Amygdala. Neuron, 51(6), 871–882. 10.1016/j.neuron.2006.07.029 [DOI] [PubMed] [Google Scholar]
- Evans GW, Li D, & Whipple SS (2013). Cumulative risk and child development. Psychological Bulletin, 139(6), 1342–1396. 10.1037/a0031808 [DOI] [PubMed] [Google Scholar]
- Felitti VJ, Anda RF, Nordenberg D, Williamson DF, Spitz AM, Edwards V, … Marks JS (1998). Relationship of Childhood Abuse and Household Dysfunction to Many of the Leading Causes of Death in Adults. American Journal of Preventive Medicine, 14(4), 245–258. 10.1016/S0749-3797(98)00017-8 [DOI] [PubMed] [Google Scholar]
- Forbes MR, Wright A, Markon K, & Krueger R (in press). Evidence that Psychopathology Symptom Networks do not Replicate. Journal of Abnormal Psychology. [DOI] [PMC free article] [PubMed] [Google Scholar]
- Fortunato S (2010). Community detection in graphs. Physics Reports, 486(3), 75–174. 10.1016/j.physrep.2009.11.002 [DOI] [Google Scholar]
- Frewen PA, Dozois DJ, Joanisse MF, & Neufeld RW (2008). Selective attention to threat versus reward: Meta-analysis and neural-network modeling of the dot-probe task. Clinical Psychology Review, 28(2), 307–337. [DOI] [PubMed] [Google Scholar]
- Green JG, McLaughlin KA, Berglund PA, Gruber MJ, Sampson NA, Zaslavsky AM, & Kessler RC (2010). Childhood adversities and adult psychiatric disorders in the national comorbidity survey replication I: Associations with first onset of DSM-IV disorders. Archives of General Psychiatry, 67(2), 113–123. 10.1001/archgenpsychiatry.2009.186 [DOI] [PMC free article] [PubMed] [Google Scholar]
- Haslbeck J, & Waldorp LJ (2015). mgm: Estimating time-varying mixed graphical models in high-dimensional data. ArXiv Preprint ArXiv:1510.06871. [Google Scholar]
- Hastings TL, & Kelley ML (1997). Development and Validation of the Screen for Adolescent Violence Exposure (SAVE). Journal of Abnormal Child Psychology, 25(6), 511–520. 10.1023/A:1022641916705 [DOI] [PubMed] [Google Scholar]
- Heleniak C, King KM, Monahan KC, & McLaughlin KA (2017). Disruptions in Emotion Regulation as a Mechanism Linking Community Violence Exposure to Adolescent Internalizing Problems. Journal of Research on Adolescence: The Official Journal of the Society for Research on Adolescence. 10.1111/jora.12328 [DOI] [PMC free article] [PubMed] [Google Scholar]
- Humphreys KL, & Zeanah CH (2015). Deviations from the expectable environment in early childhood and emerging psychopathology. Neuropsychopharmacology: Official Publication of the American College of Neuropsychopharmacology, 40(1), 154–170. 10.1038/npp.2014.165 [DOI] [PMC free article] [PubMed] [Google Scholar]
- Johnson SB, Riis JL, & Noble KG (2016). State of the Art Review: Poverty and the Developing Brain. Pediatrics, 137(4). 10.1542/peds.2015-3075 [DOI] [PMC free article] [PubMed] [Google Scholar]
- Kantor GK, Holt MK, Mebert CJ, Straus MA, Drach KM, Ricci LR, … Brown W (2004). Development and preliminary psychometric properties of the multidimensional neglectful behavior scale-child report. Child Maltreatment, 9(4), 409–428. 10.1177/1077559504269530 [DOI] [PubMed] [Google Scholar]
- King KM, McLaughlin KA, Silk J, & Monahan KC (2017). Peer effects on self-regulation in adolescence depend on the nature and quality of the peer interaction. Development and Psychopathology, 1–13. 10.1017/S0954579417001560 [DOI] [PMC free article] [PubMed] [Google Scholar]
- Lambert HK, King KM, Monahan KC, & McLaughlin KA (2016). Differential associations of threat and deprivation with emotion regulation and cognitive control in adolescence. Development and Psychopathology, 1–12. 10.1017/S0954579416000584 [DOI] [PMC free article] [PubMed] [Google Scholar]
- Lancichinetti A, & Fortunato S (2012). Consensus clustering in complex networks. Scientific Reports, 2 10.1038/srep00336 [DOI] [PMC free article] [PubMed] [Google Scholar]
- Linver MR, Brooks-Gunn J, & Kohen DE (2002). Family processes as pathways from income to young children’s development. Developmental Psychology, 38(5), 719–734. [PubMed] [Google Scholar]
- Machlin L, Miller AB, Snyder J, Mclaughlin KA, & Sheridan MA (under review). Differential Associations between Deprivation and Threat with Cognitive Control and Fear Conditioning in Early Childhood. Frontiers in Behavioral Neuroscience. [DOI] [PMC free article] [PubMed] [Google Scholar]
- Machlin L, Miller AB, Snyder J, McLaughlin KA, & Sheridan MA (2019). Differential Associations of Deprivation and Threat With Cognitive Control and Fear Conditioning in Early Childhood. Frontiers in Behavioral Neuroscience, 13 10.3389/fnbeh.2019.00080 [DOI] [PMC free article] [PubMed] [Google Scholar]
- Manly JT, Cicchetti D, & Barnett D (1994, January). The impact of subtype, frequency, chronicity, and severity of child maltreatment on social competence and behavior problems. Retrieved December 7, 2016, from Development and Psychopathology website: /core/journals/development-and-psychopathology/article/div-classtitlethe-impact-of-subtype-frequency-chronicity-and-severity-of-child-maltreatment-on-social-competence-and-behavior-problemsdiv/4E199AB3D60588A539CDBC07EF723484 [Google Scholar]
- Manly JT, Kim JE, Rogosch FA, & Cicchetti D (2001, December). Dimensions of child maltreatment and children's adjustment: Contributions of developmental timing and subtype. Retrieved December 7, 2016, from Development and Psychopathology website: /core/journals/development-and-psychopathology/article/div-classtitledimensions-of-child-maltreatment-and-childrenandaposs-adjustment-contributions-of-developmental-timing-and-subtype-div/2FBEA046C5975B908DE0F0E0C5EE06DB [PubMed] [Google Scholar]
- McCrory EJ, De Brito SA, Kelly PA, Bird G, Sebastian CL, Mechelli A, … Viding E (2013). Amygdala activation in maltreated children during pre-attentive emotional processing. The British Journal of Psychiatry: The Journal of Mental Science, 202(4), 269–276. 10.1192/bjp.bp.112.116624 [DOI] [PubMed] [Google Scholar]
- McLaughlin KA, Green JG, Gruber MJ, Sampson NA, Zaslavsky AM, & Kessler RC (2010). Childhood adversities and adult psychiatric disorders in the national comorbidity survey replication II: Associations with persistence of DSM-IV disorders. Archives of General Psychiatry, 67(2), 124–132. 10.1001/archgenpsychiatry.2009.187 [DOI] [PMC free article] [PubMed] [Google Scholar]
- McLaughlin KA, Greif Green J, Gruber MJ, Sampson NA, Zaslavsky AM, & Kessler RC (2012). Childhood adversities and first onset of psychiatric disorders in a national sample of US adolescents. Archives of General Psychiatry, 69(11), 1151–1160. 10.1001/archgenpsychiatry.2011.2277 [DOI] [PMC free article] [PubMed] [Google Scholar]
- McLaughlin KA, Peverill M, Gold AL, Alves S, & Sheridan MA (2015). Child Maltreatment and Neural Systems Underlying Emotion Regulation. Journal of the American Academy of Child & Adolescent Psychiatry, 54(9), 753–762. 10.1016/j.jaac.2015.06.010 [DOI] [PMC free article] [PubMed] [Google Scholar]
- McLaughlin KA, & Sheridan MA (2016). Beyond Cumulative Risk A Dimensional Approach to Childhood Adversity. Current Directions in Psychological Science, 25(4), 239–245. 10.1177/0963721416655883 [DOI] [PMC free article] [PubMed] [Google Scholar]
- McLaughlin KA, Sheridan MA, Gold AL, Duys A, Lambert HK, Peverill M, … Pine DS (2016). Maltreatment Exposure, Brain Structure, and Fear Conditioning in Children and Adolescents. Neuropsychopharmacology: Official Publication of the American College of Neuropsychopharmacology, 41(8), 1956–1964. 10.1038/npp.2015.365 [DOI] [PMC free article] [PubMed] [Google Scholar]
- McLaughlin K, Sheridan M, & Lambert H (2014). Childhood Adversity and Neural Development: Deprivation and Threat as Distinct Dimensions of Early Experience. Neuroscience Biobehavioral Reviews. [DOI] [PMC free article] [PubMed] [Google Scholar]
- Miller AB, Sheridan MA, Hanson JL, McLaughlin KA, Bates JE, Lansford JE, … Dodge KA (2018). Dimensions of deprivation and threat, psychopathology, and potential mediators: A multi-year longitudinal analysis. Journal of Abnormal Psychology, 127(2), 160–170. 10.1037/abn0000331 [DOI] [PMC free article] [PubMed] [Google Scholar]
- Nelson CA, Zeanah CH, Fox NA, Marshall PJ, Smyke AT, & Guthrie D (2007). Cognitive recovery in socially deprived young children: The Bucharest Early Intervention Project. Science (New York, N.Y.), 318(5858), 1937–1940. 10.1126/science.1143921 [DOI] [PubMed] [Google Scholar]
- Newman MEJ (2006). Finding community structure in networks using the eigenvectors of matrices. Physical Review E, 74(3). 10.1103/PhysRevE.74.036104 [DOI] [PubMed] [Google Scholar]
- Pérez-Edgar K, Reeb-Sutherland BC, McDermott JM, White LK, Henderson HA, Degnan KA, … Fox NA (2011). Attention Biases to Threat Link Behavioral Inhibition to Social Withdrawal over Time in Very Young Children. Journal of Abnormal Child Psychology, 39(6), 885–895. 10.1007/s10802-011-9495-5 [DOI] [PMC free article] [PubMed] [Google Scholar]
- Pérez-Edgar K, Taber-Thomas B, Auday E, & Morales S (2013). Temperament and Attention as Core Mechanisms in the Early Emergence of Anxiety. Retrieved from http://www.karger.com/Article/Abstract/354350 [DOI] [PMC free article] [PubMed]
- Pollak SD, Nelson CA, Schlaak MF, Roeber BJ, Wewerka SS, Wiik KL, … Gunnar MR (2010). Neurodevelopmental effects of early deprivation in postinstitutionalized children. Child Development, 81(1), 224–236. 10.1111/j.1467-8624.2009.01391.x [DOI] [PMC free article] [PubMed] [Google Scholar]
- Pollak SD, & Tolley-Schell SA (2003). Selective attention to facial emotion in physically abused children. Journal of Abnormal Psychology, 112(3), 323–338. [DOI] [PubMed] [Google Scholar]
- Raghavan UN, Albert R, & Kumara S (2007). Near linear time algorithm to detect community structures in large-scale networks. Physical Review E, 76(3). 10.1103/PhysRevE.76.036106 [DOI] [PubMed] [Google Scholar]
- Raikes H, Pan BA, Luze G, Tamis-LeMonda CS, Brooks-Gunn J, Constantine J, … Rodriguez ET (2006). Mother-child bookreading in low-income families: Correlates and outcomes during the first three years of life. Child Development, 77(4), 924–953. 10.1111/j.1467-8624.2006.00911.x [DOI] [PubMed] [Google Scholar]
- Raineki C, Moriceau S, & Sullivan RM (2010). Developing a Neurobehavioral Animal Model of Infant Attachment to an Abusive Caregiver. Biological Psychiatry, 67(12), 1137–1145. 10.1016/j.biopsych.2009.12.019 [DOI] [PMC free article] [PubMed] [Google Scholar]
- Rosen ML, Sheridan MA, Sambrook KA, Meltzoff AN, & McLaughlin KA (2018). Socioeconomic disparities in academic achievement: A multi-modal investigation of neural mechanisms in children and adolescents. NeuroImage, 173, 298–310. 10.1016/j.neuroimage.2018.02.043 [DOI] [PMC free article] [PubMed] [Google Scholar]
- Rosvall M, & Bergstrom CT (2008). Maps of random walks on complex networks reveal community structure. Proceedings of the National Academy of Sciences, 105(4), 1118–1123. 10.1073/pnas.0706851105 [DOI] [PMC free article] [PubMed] [Google Scholar]
- Roth TL, & Sullivan RM (2005). Memory of early maltreatment: Neonatal behavioral and neural correlates of maternal maltreatment within the context of classical conditioning. Biological Psychiatry, 57(8), 823–831. 10.1016/j.biopsych.2005.01.032 [DOI] [PubMed] [Google Scholar]
- Sarsour K, Sheridan M, Jutte D, Nuru-Jeter A, Hinshaw S, & Boyce WT (2011). Family socioeconomic status and child executive functions: The roles of language, home environment, and single parenthood. Journal of the International Neuropsychological Society: JINS, 17(1), 120–132. 10.1017/S1355617710001335 [DOI] [PubMed] [Google Scholar]
- Schomaker M, & Heumann C (2016). Bootstrap inference when using multiple imputation. ArXiv Preprint ArXiv:1602.07933. [DOI] [PMC free article] [PubMed] [Google Scholar]
- Sheridan MA, & McLaughlin KA (2016). Neurobiological models of the impact of adversity on education. Current Opinion in Behavioral Sciences, 10, 108–113. 10.1016/j.cobeha.2016.05.013 [DOI] [PMC free article] [PubMed] [Google Scholar]
- Sheridan MA, McLaughlin KA, Winter W, Fox N, Zeanah C, & Nelson CA (2018). Early deprivation disruption of associative learning is a developmental pathway to depression and social problems. Nature Communications, 9(1), 2216 10.1038/s41467-018-04381-8 [DOI] [PMC free article] [PubMed] [Google Scholar]
- Sheridan MA, Peverill M, Finn AS, & McLaughlin KA (2017). Dimensions of childhood adversity have distinct associations with neural systems underlying executive functioning. Development and Psychopathology, 29(5), 1777–1794. 10.1017/S0954579417001390 [DOI] [PMC free article] [PubMed] [Google Scholar]
- Sheridan MA, Sarsour K, Jutte D, D’Esposito M, & Boyce WT (2012). The impact of social disparity on prefrontal function in childhood. PloS One, 7(4), e35744 10.1371/journal.pone.0035744 [DOI] [PMC free article] [PubMed] [Google Scholar]
- Sheridan M, & McLaughlin K (2014). Dimensions of Early Experience and Neural Development: Deprivation and Threat. Trends in Cognitive Sciences, 18(11), 580–585. [DOI] [PMC free article] [PubMed] [Google Scholar]
- Straus MA (1979). Measuring intrafamily conflict and violence: The conflict tactics (CT) scales. Journal of Marriage and Family, 41(1), 75–88. 10.2307/351733 [DOI] [Google Scholar]
- Tibu F, Sheridan MA, McLaughlin KA, Nelson CA, Fox NA, & Zeanah CH (2015). Disruptions of working memory and inhibition mediate the association between exposure to institutionalization and symptoms of attention deficit hyperactivity disorder. Psychological Medicine, 1–13. 10.1017/S0033291715002020 [DOI] [PMC free article] [PubMed] [Google Scholar]
- Tibu F, Sheridan MA, McLaughlin KA, Nelson CA, Fox NA, & Zeanah CH (2016). Disruptions of working memory and inhibition mediate the association between exposure to institutionalization and symptoms of attention deficit hyperactivity disorder. Psychological Medicine, 46(3), 529–541. 10.1017/S0033291715002020 [DOI] [PMC free article] [PubMed] [Google Scholar]
- Tibshirani Robert (1996). “Regression Shrinkage and Selection via the lasso”. Journal of the Royal Statistical Society. Series B (methodological). Wiley 58 (1): 267–88. [Google Scholar]