Abstract
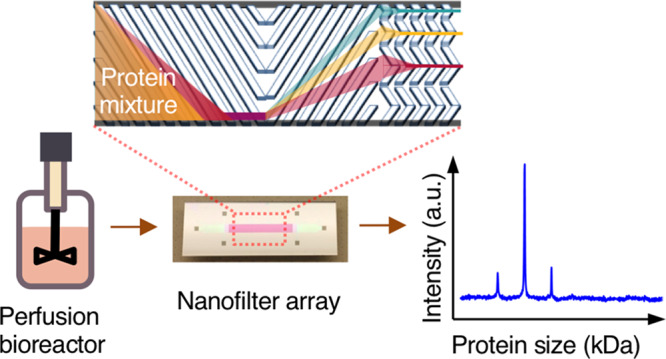
We demonstrate a new micro/nanofluidic system for continuous and automatic monitoring of protein product size and quantity directly from the culture supernatant during a high-cell-concentration CHO cell perfusion culture. A microfluidic device enables clog-free cell retention for a bench-scale (350 mL) perfusion bioreactor that continuously produces the culture supernatant containing monoclonal antibodies (IgG1). A nanofluidic device directly monitors the protein size and quantity in the culture supernatant. The continuous-flow and fully automated operation of this nanofluidic protein analytics reduces design complexity and offers more detailed information on protein products than offline and batch-mode conventional analytics. Moreover, chemical and mechanical robustness of the nanofluidic device enables continuous monitoring for several days to a week. This continuous and online protein quality monitoring could be deployed at different steps and scales of biomanufacturing to improve product quality and manufacturing efficiency.
Continuous biomanufacturing is a growing trend in the biopharmaceutical industry to reduce manufacturing cost and improve product quality.1−3 In such manufacturing processes, biologic products are produced in a constant flow operation from bioreactor cultivation (perfusion culture), to downstream purification, and final product formulation. To achieve long-term continuous biomanufacturing with enhanced productivity and quality assurance, it is necessary to implement (1) reliable and efficient cell retention for perfusion culture and (2) rapid (ideally, real-time), robust, and online product quality sensors.
In this context, we previously developed a microfluidic cell retention device for perfusion culture4 and a nanofluidic device for continuous multiparameter quality assurance.5 The membrane-less microfluidic cell retention based on inertial cell sorting enabled long-term perfusion culture with high product recovery and no clogging issue.4 The nanofluidic device consisting of a periodically patterned and slanted nanofilter array achieved continuous multivariate quality analysis of multiple therapeutic proteins with high detection sensitivity and simple operation.5
In this work, by integrating two technologies, we demonstrate a fully automated, long-term, continuous online monitoring of in-process biologic materials directly from a high-cell-concentration Chinese hamster ovary (CHO) cell perfusion bioreactor. The size distribution of the diverse proteins in the supernatant from perfusion culture was analyzed by the nanofluidic device, continuously and automatically. The novel nanofluidic monitoring system can complement or even replace inherently offline and batch-mode conventional analytics with many unique advantages, including automatic microfluidic liquid handling system, reduced design complexity, lower cost, much less manpower requirement, and high data throughput, ultimately enabling the monitoring and optimization of even many concurrently run bioreactors in process development. The nanofluidic system for continuous online protein quality monitoring during perfusion culture can be utilized as a reliable and efficient next-generation biomanufacturing analytics platform.
Experimental Section
Fabrication of the Nanofluidic Device
The details about the device fabrication were described elsewhere5 and in the Supporting Information (SI).
Samples and Chemical Reagents
Protein size markers were purchased from MilliporeSigma (SI). Tris-borate-EDTA 10× (TBE), sodium bicarbonate, and sodium dodecyl sulfate (SDS) were purchased from MilliporeSigma. The protein labeling dye 5-carboxyfluorescein succinimidyl ester (5-FAM, SE) was purchased from ChemPep Inc. The dithiothreitol (DTT) and PBS (pH 7.2) were purchased from Thermo Fischer Scientific. The purification resin (P-2 gel) for free dye removal was purchased from Bio-Rad Laboratories, Inc. Valproic acid sodium salt as a culture additive was purchased from MilliporeSigma.
Offline Protein Sample Preparation and Analysis with Nanofluidic Device
Proteins of interest were fluorescently labeled and denatured with sodium dodecyl sulfate (SDS) prior to analysis. Each protein solution was buffer-exchanged to 0.1 M sodium bicarbonate with a desalting column (Zeba Spin Desalting Columns, 7K MWCO, 89882, Thermo Fischer Scientific). Subsequently, an amine-reactive green fluorescent dye (5-carboxyfluorescein succinimidyl ester, 240604, ChemPep Inc.) with excitation/emission wavelength of 495 nm/515 nm was mixed with the proteins with a mixing ratio of 10:1 (protein:dye). The tubes containing mixed solution were incubated at room temperature for 1 h. Lastly, free dyes from protein-dye mixture were removed with the column containing free dye purification resin (Bio-Gel P-2 gel, 1504118, Bio-Rad Laboratories, Inc.). The labeled and purified proteins were denatured with sodium dodecyl sulfate (SDS, L3771-100G, MilliporeSigma) under a reducing condition using dithiothreitol (DTT, D1532, Thermo Fischer Scientific). The final SDS and DTT concentrations were 0.05 wt % and 50 mM, respectively. The solution was heated at 80 °C for 10 min. The final protein concentration was adjusted with 10× tris-borate-EDTA buffer solution (TBE, T4415-1L, Sigma-Aldrich). The labeled, purified, and denatured protein solution was then introduced manually into the inlet reservoir of the nanofluidic device. The outlet of the device was filled with the 10× TBE buffer. Platinum electrodes (711000, A-M SYSTEMS) were inserted into both inlet and outlet reservoirs, and 200 V was applied to the device to drive proteins into the nanofilter array. The fluorescence signals from the separation and postconcentration regions were detected by the fluorescence microscope and analyzed by ImageJ software.6
Perfusion Culture with the Microfluidic Cell Retention Device
Perfusion culture of the suspended mammalian Chinese Hamster Ovary (CHO) cells producing monoclonal antibodies (IgG1) was performed with a microfluidic cell retention device (SI Figures S1 and S2).4 The CHO-DG44 cell line producing human IgG1 against CD40 ligand was given by Biogen Idec (Cambridge, MA). The detailed culture procedure is described in the SI.
Continuous Online Protein Sample Preparation during Perfusion Culture
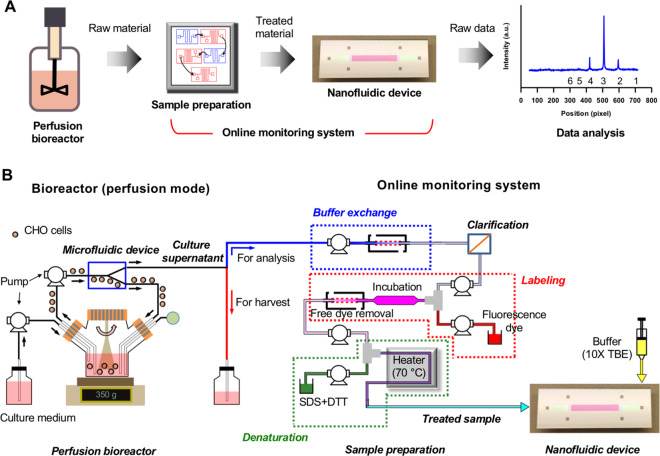
Continuous online sample preparation consists of buffer-exchange, cell clarification, protein labeling, free (unbound) dye removal, and protein denaturation (Figure 3B; SI Figures S3–S5). The detailed procedure is described in the SI.
Figure 3.
Schematic of the nanofluidic online monitoring system integrated with perfusion culture of the CHO cells producing IgG1. (A) Entire workflow of automated continuous online nanofluidic monitoring of the size distribution of the proteins in the cell culture supernatant during perfusion culture. (B) Details of the perfusion bioreactor and nanofluidic online monitoring system.
Continuous Online Monitoring by the Nanofluidic Device during Perfusion Culture
The nanofluidic device was inserted into a plastic holder (SI Figure S6). The protein sample and buffer solutions were continuously flowed into the nanofluidic device. The details are described in the SI. The fluorescence signal from each postconcentration channel was detected by a CCD camera (ORCA-ER C4742-80, Hamamatsu) with a motorized stage (P-H101P1F, Prior Scientific) at a regular interval (10 min). The signal from each postconcentration channel was analyzed by ImageJ software.6 It was normalized by a background signal and was averaged over 2 h (n = 12).
Quantification of IgG1 Concentration and Offline Gel Electrophoresis Microchip
The concentration of IgG1 was measured with HPLC equipment (1100 Series, Agilent) using a protein A column (2-1001-00, Applied Biosystems) and standard IgG1 (I5154, Millipore Sigma). To cross-check the protein size information obtained from the nanofluidic device, a commercial electrophoresis system (Bioanalyzer 2100, Agilent) was used with offline microchips and reagents (High Sensitivity Protein 250 kit, 5067–1575, Agilent).
Statistics
The error bars were defined throughout the figures. For all statistics (including error bars), we provided the sample size (n values). For the technical replicates in Figure 4A,D,F, 5A,D,F, the data points are described in the SI (Section 7, Figure data). To evaluate the precision and reproducibility of IgG1 concentration measurement by HPLC, each of the three technical replicates for 10 independent culture samples containing IgG1 were tested. The replicates had 2.0% coefficient of variation (the ratio of the standard deviation to the mean) on average.
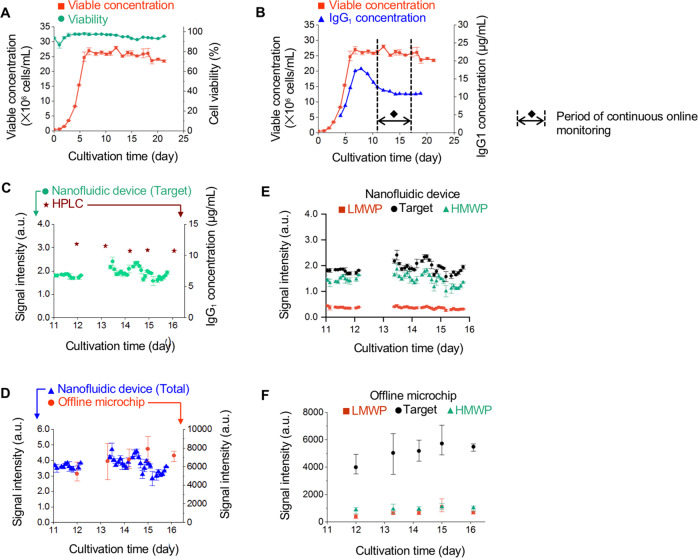
Figure 4.
Continuous online protein size monitoring during steady-state IgG1 production. (A) Viable cell concentration and viability during perfusion culture. Perfusion began around day 3. (B) Viable cell and IgG1 concentrations. The online monitoring was performed from day 11 to day 16. (C) Protein signals in the Target group (including IgG1) measured by the online monitoring system and IgG1 concentration obtained by affinity chromatography (HPLC). From day 12 to 13, analysis of culture supernatant was intentionally stopped (no data points) due to maintenance and validation of sample preparation system. (D) Trend of total amount of proteins measured by the online monitoring system and the offline gel electrophoresis microchip. (E) and (F) Characteristics of proteins in three size groups (LMWP, Target, HMWP) over cultivation time measured by the nanofluidic device (E) and the offline gel electrophoresis microchip (F). For the viable concentration, viability, and offline microchip, error bars are data range (n = 3, technical replicates); For the nanofluidic device, error bars are standard deviation (n = 12).
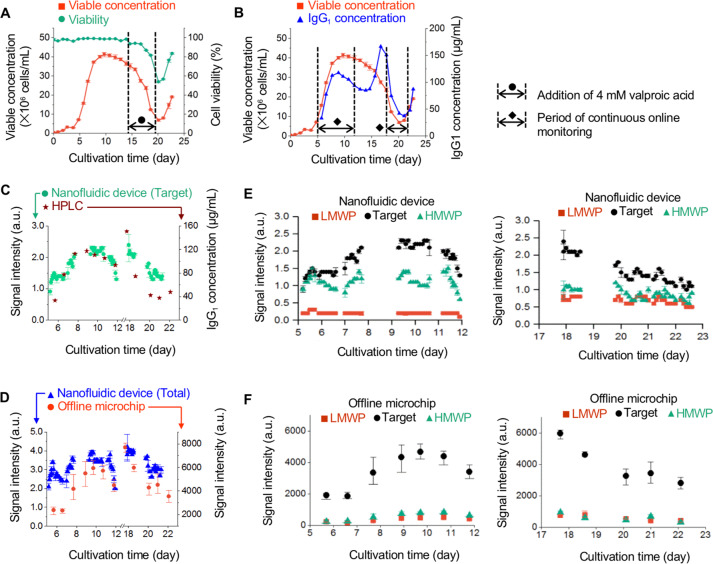
Figure 5.
Continuous online protein size monitoring during transient-state IgG1 production. (A) Viable cell concentration and viability during perfusion culture. Perfusion began around day 3. Valproic acid (4 mM) was continuously added to the bioreactor from day 14.6 to day 18.6. (B) Viable cell and IgG1 concentrations. The online monitoring was performed at two time periods (days 5–12 and days 17–23). (C) Protein signals in the Target group (including IgG1) measured by the online monitoring system and IgG1 concentration obtained by affinity chromatography (HPLC). There are missing data points in the plots (e.g., days 8–9 and days 18.5–19.5) because continuous sample preparation and image acquisition failed. (D) Trend of total amount of proteins measured by the online monitoring system and the offline gel electrophoresis microchip. (E) and (F) Characteristics of proteins in three size groups (LMWP, Target, HMWP) over cultivation time measured by the nanofluidic device (E) and the offline gel electrophoresis microchip (F). For the viable concentration, viability, and offline microchip, error bars are data range (n = 3, technical replicates); For the nanofluidic device, error bars are standard deviation (n = 12).
Results and Discussion
Results
Nanofluidic Device Design and Operation
The nanofluidic device was made of silicon-glass and consists of three distinct regions: inlet, monitoring, and outlet regions (Figure 1A). While depth of the monitoring region is tens to hundreds of nanometers, depth of both inlet and outlet regions is a few of micrometers (∼3.5 μm) to introduce sample and buffer solutions into the device easily by pressure-driven flow (Figure 1B). As a result, both solutions proceed into two side reservoirs of inlet and outlet regions due to lower hydrodynamic resistance than the monitoring region containing a nanochannel. However, if an electric field is applied to the device together with the hydrodynamic force, biomolecules (e.g., proteins) near the boundary between the inlet and monitoring regions enter the monitoring region through electrophoretic force. The monitoring region is divided into three regions with different slanted nanofilter array structures: preconcentration, separation, and postconcentration regions (Figure 1C). Proteins are concentrated (focused) on one side of the wall in the preconcentration region regardless of size, followed by protein sizing in the separation region, where a large protein is deflected more than a small protein. Finally, the separated streams are reconcentrated in individual channels with different widths in the postconcentration region, resulting in the enhancement of detection sensitivity. Further details on the device can be found elsewhere.5
Figure 1.
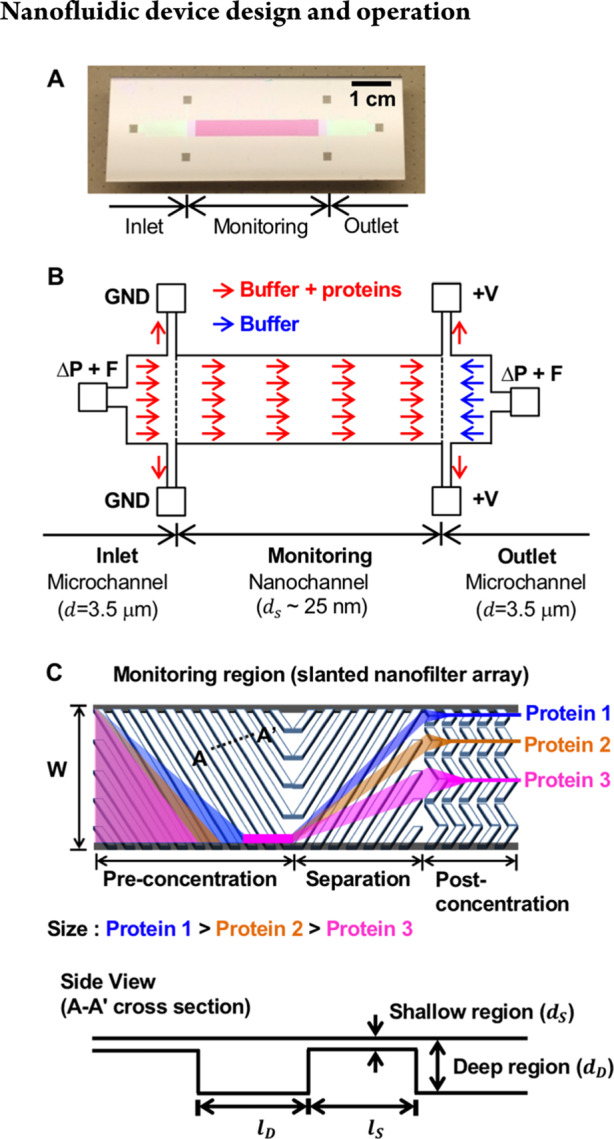
Schematic of the nanofluidic device used for the online monitoring system. (A) A photograph of the nanofluidic device (top view). (B) Details of the device structure and flow direction. (ΔP: pressure-driven flow, F: electrically floated, GND: ground, + V: high voltage). (C) Detail of the nanofilter array. The slanted nanofilter array in the monitoring region has periodically patterned and slanted deep (dD) and shallow (dS) regions. (dD = 100 nm, dS = 25 nm, θ = 45° (nanofilter angle), lS and lD = 1 μm (pitch size of the nanofilter array), W = 4 mm). The figure from ref (5) was reprinted by permission from Macmillan Publishers Ltd.: Nature Nanotechnology, copyright (2017).
Characterization of Protein Sizing in the Nanofluidic Device
To demonstrate the online monitoring system with high detection sensitivity, fluorescence intensities of protein streams in the postconcentration region were measured. The postconcentration region consists of 11 small and distinct channels with a herringbone nanofilter array. The size ranges for proteins collected in each postconcentration channel were quantified using protein molecular-weight markers.
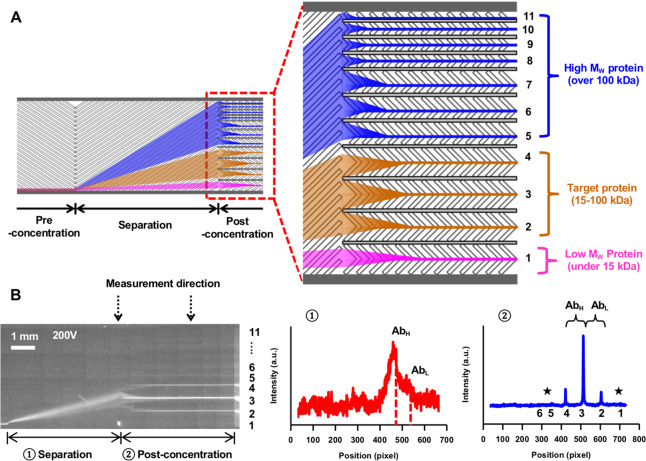
The size ranges for proteins collected in the postconcentration region were estimated based on experiments as follows: channel no. 1 for proteins of <15 kDa, channel nos. 2–4 for proteins of 15–100 kDa, and channel nos. 5–11 for proteins of >100 kDa (SI Figure S7 and Table S1). In this study, the target protein used to demonstrate the nanofluidic online monitoring system is IgG1, which is fragmented into light chain (AbL; 25 kDa) and heavy chain (AbH; 50 kDa) when IgG1 is denatured. Therefore, the postconcentration channels in the nanofluidic device were categorized into three size domains for efficient analysis as follows: channel no. 1 for low-molecular-weight proteins (LMWP), channel nos. 2–4 for target proteins including IgG1, and channel nos, 5–11 for high-molecular-weight proteins (HMWP) (Figure 2A). Figure 2B shows fluorescently labeled and denatured IgG1 (100 μg mL–1) in the nanofluidic device. The two distinct streams for AbL and AbH were observed in the separation region although they were not separated completely. Subsequently, the two streams were collected in the postconcentration region. The majority of the IgG1 was collected in the channel nos. 2–4 (93.2%, Target) in the postconcentration region. The other small or large proteins (impurities) were collected in the no. 1 (1.0%; LMWP) and nos. 5–11 (5.8%; HMWP) channels, respectively. The analysis of the IgG1 by offline gel electrophoresis equipment showed similar proportions to ones observed by the nanofluidic device (SI Figure S8). In addition, the size distribution of cell culture supernatant containing IgG1 and host cell proteins was also analyzed by the device in previous work,5 demonstrating that the nanofluidic device is a proper tool for online protein size monitoring.
Figure 2.
Protein separation and concentration in the nanofluidic device. (A) Concentration of separated proteins in 11 individual small channels in the postconcentration region. (B) Offline size separation of commercial IgG1 (100 μg mL–1) in the nanofluidic device. The fluorescence image of IgG1 in the nanofluidic device and signal profiles in the separation and postconcentration regions. AbH, AbL, and star symbols represent antibody heavy chain, light chain, and impurities, respectively.
Integration of the Nanofluidic Online Monitoring System with a Perfusion Bioreactor
For continuous online monitoring of protein size and quantity during perfusion culture, the nanofluidic device was connected to a perfusion bioreactor though an online sample preparation system. This integrated system labeled and denatured proteins in the culture supernatant from the bioreactor and fed them into the nanofluidic device in a fully automated continuous manner (Figure 3A). For the perfusion culture of the suspended CHO cells producing IgG1, a small-scale (350 mL working volume) perfusion bioreactor equipped with the microfluidic cell retention device was used.4 Previously, this system demonstrated high-cell-concentration capacity (25–40 million cells mL–1) and high product recovery (>99%).4 The online sample preparation consists of four steps: buffer exchange, cell clarification, protein labeling, and protein denaturation (online monitoring part in Figure 3B). At the last step, the fluorescently labeled and denatured proteins were flowed into the nanofluidic device, and the size of the proteins was continuously monitored. The details of the bioreactor and the online sample preparation system are described in the Experimental Section and SI Section 1.
Continuous Online Monitoring of Cell Culture Supernatant during Perfusion Culture
The nanofluidic online monitoring system integrated with the perfusion bioreactor analyzed the size distribution of the proteins in the cell culture supernatant produced from the bioreactor. Two monitoring experiments were performed when IgG1 production was in steady- or transient-state.
Monitoring during Steady-State IgG1 Production
IgG1 production was constant during this monitoring period. The result from the online monitoring system was compared with standard offline methods (HPLC and gel electrophoresis microchip). The perfusion culture with the microfluidic cell retention device was performed for 21 days. The total cell concentration was 23.2 ± 0.9 million cells mL–1 from day 6 (average ± SD, n = 16), and the viability was maintained high at 97.6% ± 1.0% during the same period (Figure 4A). Cell culture parameters, such as glucose, lactate, and ammonium, were stable over cultivation time (SI Figure S9). The IgG1 concentration measured by HPLC increased at the beginning of the culture as the cells grew and then became stable at 10.8 ± 0.1 μg mL–1 (n = 6) after day 12 (Figure 4B).
After confirming that perfusion culture had no issues, such as failure of the microfluidic cell retention (due to microchannel clogging or debonding), cell growth, and antibody production, the continuous online monitoring of the cell culture supernatant containing IgG1 was performed between day 11 and 16 (Figure 4B). From day 12 to 13, analysis of culture supernatant was intentionally stopped (no data points) due to maintenance and validation of sample preparation system. First, trends of change in IgG1 concentration measured by HPLC (only IgG1) and online monitoring system (target region including IgG1 and host cell proteins) were compared. Signals from both methods were stably maintained, noting that IgG1 concentration was stable during this period (Figure 4C). The signal variation in the online monitoring system was small (coefficient of variation: 10.9%, n = 38) possibly due to steady-state protein production during the monitoring period. The trend of total amount of proteins (target + impurities) was also analyzed through the online monitoring system and the offline gel electrophoresis microchip. Based on this analysis, both methods showed similar trends with a small variation in total protein amount over the monitoring period (coefficient of variation: 11.4% (nanofluidic device; n = 38) and 14.5% (offline microchip; n = 5)) (Figure 4D).
Each signal intensity in three size groups measured by the online monitoring system had a low variation and was overall constant over time during the monitoring period (signal intensity: 0.4 ± 0.0 (LMWP), 1.9 ± 0.2 (Target), 1.4 ± 0.2 (HMWP), n = 38; coefficient of variation: 11.4% (LMWP), 10.9% (Target), 13.9% (HMWP)) (Figure 4E; SI Table S2). For a cross-check, daily samples from the bioreactor were analyzed by the gel electrophoresis microchip, and it was confirmed that the amount of the proteins in different size groups was also stable throughout the monitoring period (coefficient of variation: 36.7% (LMWP), 13.1% (Target), 9.4% (HMWP), n = 5) (Figure 4F). In addition, the proportions of each size group calculated by both the nanofluidic device and offline microchip were constant over time. However, while proportion values of three size groups from the nanofluidic device were 9.6% ± 0.6% (LMWP), 51.4% ± 2.0% (Target), and 39.0% ± 1.8% (HMWP) (n = 38), respectively, the values from the offline equipment were 10.0% ± 2.4% (LMWP), 75.6% ± 1.8% (Target), 14.4% ± 1.3% (HMWP) (n = 5). A difference in proportions between two methods was observed (for example, higher proportion of HMWP (by 24.6%) in the nanofluidic device than the offline method). This could be due to incomplete online denaturation and approximate size ranges of the nanofluidic device (see Discussion section).
Monitoring during Transient-State IgG1 Production
The change in the amount of the proteins in three size groups (LMWP, Target, and HMWP) was observed during this monitoring period. The microfluidic cell retention device enabled 21-day perfusion culture (Figure 5; SI Figure S10). Unlike the previous culture, 4 mM valproic acid was continuously added into the cell culture from day 14.6 to 18.6 to induce a large change in IgG1 production (Figure 5A). The valproic acid improves antibody productivity of the CHO cells although its concentration (4 mM) is toxic to the cells.7,8 The viable cell concentration reached 40.0 million cells mL–1 on day 8.9 and was maintained at 40.1 ± 1.0 million cells mL–1 (n = 5) with high viability (98% ± 1%) until day 12.9 (Figure 5A). The slight decrease in viable cell concentration resulted from continuous cell bleeding by the microfluidic cell retention device at this high cell concentration.4 Subsequently, the addition of valproic acid from day 14.6 to 18.6 negatively affected the cell conditions and culture metabolic parameters, such as decrease of the viable cell concentration (to 6.8 million cells L–1) and cell viability (to 54%) on day 20.1. However, after the additive removal, the cells started to grow again while recovering their viability (Figure 5A).
The change in size distribution of the proteins in the culture supernatant was monitored during two time periods: day 5 to day 12 (without valproic acid) and day 17 to day 23 (with valproic acid) (Figure 5B). Before addition of valproic acid, the IgG1 peak concentration measured by HPLC was 117.5 μg mL–1 and gradually decreased to 84.8 μg mL–1 on day 13.9, when the trend of IgG1 concentration was similar to that of viable cell concentration. Following addition of valproic acid to the cell culture to induce rapid increase in IgG1 production, viable cell concentration decreased monotonically until day 20.1, whereas IgG1 concentration sharply increased until day 16.7 (166.6 μg mL–1). The concentration then decreased as the viable cell concentration decreased (Figure 5B). The trend of change in IgG1 measured by both HPLC and the nanofluidic device (Target region) were similar (Figure 5C). The trend of total amount of proteins in the supernatant was also similar in both nanofluidic device and the offline gel electrophoresis microchip (Figure 5D).
The amounts of proteins measured by the online monitoring system in each size group were Target > HMWP > LMWP (Figure 5E). There are missing data points in the plots (e.g., days 8–9 and days 18.5–19.5) because of issues in continuous sample preparation and image acquisition due to clogging of the fluid delivery channels in sample preparation unit, breakdown of the peristaltic pumps, and miscellaneous software issues. Without valproic acid (days 5–12), the amount of the proteins in the Target group increased from day 5 to day 8, maintained stably from day 9 to day 10, and decreased from day 10 to 12. With valproic acid (days 17–23), the amount of proteins in the Target group was the highest on day 18, but it started to decrease thereafter until day 23 (Figure 5E). A similar trend was also observed in case of the offline microchip (Figure 5F).
The proportion of three size groups was also obtained from both the online monitoring system and the offline microchip. Proportions obtained from the online system were 6.8% ± 2.7% (LMWP), 57.1% ± 5.7% (Target), 36.1% ± 6.0% (HMWP) (n = 50) during the first monitoring (day 5–12) and 22.5% ± 2.3% (LMWP), 61.1% ± 2.3% (Target), 16.3% ± 2.3% (HMWP) (n = 38) during the second monitoring (days 17–23) (SI Table S2). The fluctuation in the values over the monitoring period was small. Since proteins were deflected less during the second monitoring period than the first one due to fabrication imperfection (reduced area in the separation region), proteins which are normally collected into high-numbered channels shifted to low-numbered ones, leading to increase of LMWP and decrease of HMWP during the second monitoring period. In case of the offline microchip, the proportions were 9.5% ± 1.9% (LMWP), 78.3% ± 1.8% (Target), and 12.1% ± 2.1% (HMWP). In both online and offline methods, the proportions in three size groups were constant over monitoring time even though the amount of whole proteins varied.
Discussion
Online analytical tools to monitor critical quality attributes (CQAs) have clear advantages over conventional offline protein analytics because one can generate a large amount of real-time analytical information reflecting changing conditions within a bioreactor. This helps maintain high product quality throughout the biomanufacturing workflow by rapidly responding to deviations/failures and improving understanding of key factors that affect CQAs.9 Despite critical demand for online protein analytics, adapting conventional protein analysis techniques for online monitoring is not trivial because most of them involve manual operation. In this work, we have demonstrated a unique continuous online protein size monitoring system during perfusion culture. The nanofluidic monitoring system was integrated with a perfusion bioreactor, enabled by microfluidic cell retention, and directly analyzed cell culture supernatant containing monoclonal antibodies (IgG1) for days to a week in a fully automated continuous online manner. Such a combination of industry-standard high-cell-concentration CHO cell perfusion culture and continuous online protein size monitoring has never been demonstrated previously.
Currently, process attributes (e.g., pH, temperature, medium composition, viable cell concentration, cell viability) measured in real-time are used as surrogates to verify product quality. However, these parameters may not reflect the product quantity and quality, as clearly demonstrated by Figure 5B, where one can see that viable cell concentration is poorly correlated with the total amount of products produced in the culture.
In this context, Raman spectroscopy is becoming popular in the bioprocessing field as a next-generation process analytical technology.10,11 It generates the information about molecular structure and bonding by collecting inelastically scattered photons from analytes.10,11 With its many advantages such as low water sensitivity, in-line and reagent-less monitoring, noninvasiveness, and high precision, Raman spectroscopy successfully demonstrated reliable and rapid monitoring of nutrients, metabolites, product quantity, and quality in therapeutic protein and cell therapy manufacturing.10−12 However, complex solution composition in biofluids requires careful statistical modeling and interpretation of spectroscopic data,10 which may be also cell line and product-specific. Moreover, interference with fluorescence, low analyte detection sensitivity (typically mg mL–1 range), and high equipment cost still remain as critical challenges to overcome.10 At the very least, it would be ideal to validate the indirect and correlative protein product information from Raman spectroscopy with more direct measurement of quality using other analytical technologies.
Therefore, direct monitoring of protein products (both their quantity and quality) using the online monitoring system can be critically needed for quality assurance, especially when the conditions in bioreactors are abruptly/gradually shifting. For example, long-term CHO perfusion cultures could suffer from gradual shifts in product quality over the course of a few months, due to inherent genotype/phenotype changes of aged CHO cells in the culture. Such shifts would be highly dependent on many known and unknown factors, which are difficult to identify and predict. If one can continuously monitor the general quantity and quality of the produced biologics, management of such uncertainty would be greatly facilitated.
Furthermore, demonstration of direct analysis of culture supernatant from a bioreactor (which is the stage with most complex sample matrices) implies that the nanofluidic online monitoring system is applicable to the analysis of in-process material at any downstream stage of biomanufacturing (e.g., product purification step and release point). This capability enables more systematic process understanding and allows users to handle product quality issues quickly through early detection of quality deviations during biomanufacturing workflow.
In the experiments, we found differences in the proportions of three size groups (LMWP, Target, HMWP) from the results of the offline microchip. This could be mainly due to incomplete online denaturation and approximate size ranges of the nanofluidic device. First, the current online denaturation under reducing condition was suboptimal with respect to low DTT concentration level and other denaturation conditions (SI Figures S11 and S12). Further optimization of online denaturation conditions (DTT concentration, denaturation temperature, and processing time) is required for future analytics experiments. Second, the classification of three domains of protein size in the nanofluidic device was not precise near the cutoff value. The device had limited separation resolution for two adjacent protein streams. In addition, identical proteins could be split into the neighboring postconcentration channels due to channel position and width (Figure 2B; SI Figure S7). Hence, protein detection with improved separation resolution and detection sensitivity in the separation region instead of the postconcentration region could provide more accurate size profiling of the proteins of interest. The improvement of the system’s performance is definitely possible by adjusting the gap size of the nanofilter array since the separation resolution of proteins is determined mainly by the gap size.5,13,14
Also, durability of the nanofluidic device is critical for long-term continuous online monitoring. The silicon substrate of the nanofluidic device was insulated by silicon dioxide (500 nm thick) to prevent electrochemical reaction on the silicon surface. However, long-time exposure to chemical reagents, electric field, and repeated mount/unmount of the device on the solid device holder could degrade and damage this thin insulating layer. Alternatively, whole-glass nanofluidic devices15 could eliminate the breakdown issue of the insulating layer, which significantly improves device durability and operation time for long-term monitoring.
Recently, new analytical methods have been developed for rapid monitoring for product (mAb)-related CQAs (N-linked glycosylation,16 oxidation,17 charge,18 etc.). As for fragmentation and aggregation (SI Table S3), the development of size-exclusion ultrahigh-performance liquid chromatography (SE-UHPLC) now enables rapid monitoring (<10 min).19 Furthermore, coupling this with mass spectrometry (MS) allows accurate sizing of the proteins.20 Considering these rapid LC and LC-MS methods, optimization of the sample preparation for the nanofluidic analytics to reduce time delay and complexity is critical.
The current nonoptimized online sample preparation caused ∼5 h of monitoring time delay, and details of each sample preparation step are described in SI Table S4. The monitoring was sometimes interrupted due to its mechanical defects (e.g., leakage or clogging of the fluid handling components). To solve these issues, capillaries in the sample preparation system could be replaced easily with microfluidic devices. This replacement could reduce hold-up volume and allow for easy maintenance of the system.21,22 In addition, label-free protein detection methods could dramatically reduce complexity and sample preparation time of the system,23,24 leading to faster, more reliable, and near real-time monitoring.
The nanofluidic device is also applicable to continuous homogeneous binding assay for in vitro bioactivity assessment of therapeutic proteins.5 Therefore, the functionality of the binding assay could be added to the current online monitoring system through the integration with a proper sample preparation system. This improvement enables multivariate quality assurance of biologics (e.g., size and activity), making quality assessment by the online monitoring system more reliable. With unique features, such as consumption of small sample volume, automated continuous operation, and small-scale operation, the nanofluidic online monitoring system in this work could be applied to not only conventional biomanufacturing, but also next-generation biomanufacturing systems, such as on-demand biologics manufacturing,25 where conventional offline analytical methods have limits to measure CQAs.
Conclusions
The integration of two micro/nanofluidic technologies demonstrated fully automated continuous online monitoring of protein size and quantity during continuous perfusion culture. The microfluidic cell retention device enabled the high-cell-concentration perfusion bioreactor that produced the cell culture supernatant containing IgG1. The nanofluidic filter array continuously and automatically monitored the size and quantity of the proteins in this culture supernatant, producing a large amount of protein analytical information, which cannot be easily achieved by conventional offline and batch-mode analytical techniques. Considering limitations of current monitoring delay (∼5 h) and incomplete online denaturation, further optimization of online sample preparation is required for reliable and near real-time protein size monitoring. In the future, the online nanofluidic analytics could improve product quality and safety and thus enable reliable and efficient continuous biomanufacturing at diverse scales and steps.
Acknowledgments
This work was supported by Singapore-MIT Alliance for Research and Technology (SMART) Centre, Critical Analytics for Manufacturing Personalized-Medicine (CAMP) Interdisciplinary Research Group (IRG), as well as SMART Innovation Centre grants (ING137075-BIO and ING1510101-BIO). It was also supported by U.S. Food and Drug Administration (FDA Award 1 U01 FD006751-01). We thank Charles L. Cooney and Joel Voldman for their review and feedback on this research work.
Supporting Information Available
The Supporting Information is available free of charge at https://pubs.acs.org/doi/10.1021/acs.analchem.9b05835.
Figures S1–S12 and Tables S1–S4 (PDF)
Author Present Address
# Vaccine Research Center, National Institute of Allergy and Infectious Diseases, National Institute of Health, Bethesda, Maryland 20892, United States
Author Contributions
∇ These authors contributed equally to this work. T.K. implemented perfusion culture using the microfluidic cell retention device; S.H.K. designed and fabricated the nanofluidic filter array; T.K. and S.H.K. implemented online sample preparation system; T.K. performed the online monitoring experiments during perfusion culture; T.K., S.H.K., J.-F.P.H., and J.H. analyzed the data; T.K., S.H.K., J.-F.P.H., and J.H. wrote the main manuscript text; All authors reviewed the manuscript.
The authors declare no competing financial interest.
This paper was published ASAP on March 24, 2020. Due to a production error, a Supporting Information table was misidentified in the section “Monitoring during Transient-State IgG1 Production”. The corrected version was reposted on March 25, 2020.
Supplementary Material
References
- Konstantinov K. B.; Cooney C. L. J. Pharm. Sci. 2015, 104 (3), 813–820. 10.1002/jps.24268. [DOI] [PubMed] [Google Scholar]
- Zydney A. L. Curr. Opin. Chem. Eng. 2015, 10, 8–13. 10.1016/j.coche.2015.07.005. [DOI] [Google Scholar]
- Okhio-Seaman L. In Continuous Biomanufacturing - Innovative Technologies and Methods; Subramanian G., Ed.; Wiley-VCH Verlag GmbH & Co. KGaA, 2017; pp 549–568. [Google Scholar]
- Kwon T.; Prentice H.; Oliveira J. D.; Madziva N.; Warkiani M. E.; Hamel J.-F. P.; Han J. Sci. Rep. 2017, 7, 6703. 10.1038/s41598-017-06949-8. [DOI] [PMC free article] [PubMed] [Google Scholar]
- Ko S. H.; Chandra D.; Ouyang W.; Kwon T.; Karande P.; Han J. Nat. Nanotechnol. 2017, 12 (8), 804–812. 10.1038/nnano.2017.74. [DOI] [PubMed] [Google Scholar]
- Schneider C. A.; Rasband W. S.; Eliceiri K. W. Nat. Methods 2012, 9 (7), 671–675. 10.1038/nmeth.2089. [DOI] [PMC free article] [PubMed] [Google Scholar]
- Wulhfard S.; Baldi L.; Hacker D. L.; Wurm F. J. Biotechnol. 2010, 148 (2), 128–132. 10.1016/j.jbiotec.2010.05.003. [DOI] [PubMed] [Google Scholar]
- Yang W. C.; Lu J.; Nguyen N. B.; Zhang A.; Healy N. V.; Kshirsagar R.; Ryll T.; Huang Y.-M. Mol. Biotechnol. 2014, 56 (5), 421–428. 10.1007/s12033-013-9725-x. [DOI] [PubMed] [Google Scholar]
- Roch P.; Mandenius C.-F. Curr. Opin. Chem. Eng. 2016, 14, 112–120. 10.1016/j.coche.2016.09.007. [DOI] [Google Scholar]
- Buckley K.; Ryder A. G. Appl. Spectrosc. 2017, 71 (6), 1085–1116. 10.1177/0003702817703270. [DOI] [PubMed] [Google Scholar]
- Esmonde-White K. A.; Cuellar M.; Uerpmann C.; Lenain B.; Lewis I. R. Anal. Bioanal. Chem. 2017, 409 (3), 637–649. 10.1007/s00216-016-9824-1. [DOI] [PMC free article] [PubMed] [Google Scholar]
- Baradez M.-O.; Biziato D.; Hassan E.; Marshall D. Front. Med. 2018, 5, 47. 10.3389/fmed.2018.00047. [DOI] [PMC free article] [PubMed] [Google Scholar]
- Fu J.; Mao P.; Han J. Appl. Phys. Lett. 2005, 87 (26), 263902. 10.1063/1.2149979. [DOI] [PMC free article] [PubMed] [Google Scholar]
- Fu J.; Yoo J.; Han J. Phys. Rev. Lett. 2006, 97 (1), 018103. 10.1103/PhysRevLett.97.018103. [DOI] [PMC free article] [PubMed] [Google Scholar]
- Mao P.; Han J. Lab Chip 2005, 5 (8), 837–844. 10.1039/b502809d. [DOI] [PubMed] [Google Scholar]
- Tharmalingam T.; Wu C.-H.; Callahan S.; T. Goudar C. Biotechnol. Bioeng. 2015, 112 (6), 1146–1154. 10.1002/bit.25520. [DOI] [PubMed] [Google Scholar]
- Sokolowska I.; Mo J.; Dong J.; Lewis M. J.; Hu P. MAbs 2017, 9 (3), 498–505. 10.1080/19420862.2017.1279773. [DOI] [PMC free article] [PubMed] [Google Scholar]
- Patel B. A.; Pinto N. D. S.; Gospodarek A.; Kilgore B.; Goswami K.; Napoli W. N.; Desai J.; Heo J. H.; Panzera D.; Pollard D.; Richardson D.; Brower M.; Richardson D. D. Anal. Chem. 2017, 89 (21), 11357–11365. 10.1021/acs.analchem.7b02228. [DOI] [PubMed] [Google Scholar]
- Yang R.; Tang Y.; Zhang B.; Lu X.; Liu A.; Zhang Y. T. J. Pharm. Biomed. Anal. 2015, 109, 52–61. 10.1016/j.jpba.2015.02.032. [DOI] [PubMed] [Google Scholar]
- Haberger M.; Leiss M.; Heidenreich A.-K.; Pester O.; Hafenmair G.; Hook M.; Bonnington L.; Wegele H.; Haindl M.; Reusch D.; Bulau P. MAbs 2016, 8 (2), 331–339. 10.1080/19420862.2015.1122150. [DOI] [PMC free article] [PubMed] [Google Scholar]
- Sahore V.; Sonker M.; Nielsen A. V.; Knob R.; Kumar S.; Woolley A. T. Anal. Bioanal. Chem. 2018, 410 (3), 933–941. 10.1007/s00216-017-0548-7. [DOI] [PMC free article] [PubMed] [Google Scholar]
- Au A. K.; Bhattacharjee N.; Horowitz L. F.; Chang T. C.; Folch A. Lab Chip 2015, 15 (8), 1934–1941. 10.1039/C5LC00126A. [DOI] [PMC free article] [PubMed] [Google Scholar]
- Zhu L.; Lee C. S.; DeVoe D. L. Lab Chip 2006, 6 (1), 115–120. 10.1039/B511766F. [DOI] [PubMed] [Google Scholar]
- Santos D. R.; Soares R. R. G.; Pinto I. F.; Caneira C. R. F.; Pinto R. M. R.; Chu V.; Conde J. P. IEEE Sens. J. 2019, 19 (18), 7803–7812. 10.1109/JSEN.2019.2917305. [DOI] [Google Scholar]
- Crowell L. E.; Lu A. E.; Love K. R.; Stockdale A.; Timmick S. M.; Wu D.; Wang Y.; Doherty W.; Bonnyman A.; Vecchiarello N.; Goodwine C.; Bradbury L.; Brady J. R.; Clark J. J.; Colant N. A.; Cvetkovic A.; Dalvie N. C.; Liu D.; Liu Y.; Mascarenhas C. A.; Matthews C. B.; Mozdzierz N. J.; Shah K. A.; Wu S.-L.; Hancock W. S.; Braatz R. D.; Cramer S. M.; Love J. C. Nat. Biotechnol. 2018, 36, 988–995. 10.1038/nbt.4262. [DOI] [PMC free article] [PubMed] [Google Scholar]
Associated Data
This section collects any data citations, data availability statements, or supplementary materials included in this article.


