

Abstract
Objective
Non-small cell lung cancer is a leading cause of cancer death worldwide, and histopathological evaluation plays the primary role in its diagnosis. However, the morphological patterns associated with the molecular subtypes have not been systematically studied. To bridge this gap, we developed a quantitative histopathology analytic framework to identify the types and gene expression subtypes of non-small cell lung cancer objectively.
Materials and Methods
We processed whole-slide histopathology images of lung adenocarcinoma (n = 427) and lung squamous cell carcinoma patients (n = 457) in the Cancer Genome Atlas. We built convolutional neural networks to classify histopathology images, evaluated their performance by the areas under the receiver-operating characteristic curves (AUCs), and validated the results in an independent cohort (n = 125).
Results
To establish neural networks for quantitative image analyses, we first built convolutional neural network models to identify tumor regions from adjacent dense benign tissues (AUCs > 0.935) and recapitulated expert pathologists’ diagnosis (AUCs > 0.877), with the results validated in an independent cohort (AUCs = 0.726-0.864). We further demonstrated that quantitative histopathology morphology features identified the major transcriptomic subtypes of both adenocarcinoma and squamous cell carcinoma (P < .01).
Discussion
Our study is the first to classify the transcriptomic subtypes of non-small cell lung cancer using fully automated machine learning methods. Our approach does not rely on prior pathology knowledge and can discover novel clinically relevant histopathology patterns objectively. The developed procedure is generalizable to other tumor types or diseases.
Keywords: non-small cell lung cancer, transcriptomic subtypes, convolutional neural networks, machine learning, quantitative pathology
INTRODUCTION
Non-small cell lung cancer accounts for 85% of lung cancer,1 with more than 1.4 million newly diagnosed patients per year worldwide.2,3 Histopathology analysis by trained pathologists is the gold standard for diagnosing non-small cell lung cancer and defines the cancer types.4 It is crucial to delineate lung malignancy from its morphologic mimic as specific treatment modalities (including surgical resection, chemotherapy, radiotherapy, and targeted therapy) can limit the progression of the disease and improve the survival outcomes of the patients.1 In addition, the distinction between lung adenocarcinoma and squamous cell carcinoma, the 2 most common types of non-small cell lung cancer, is critical for selecting the optimal treatment: a few clinically actionable genetic variations5,6 are almost exclusively observed in adenocarcinoma patients,4 whereas patients with squamous cell carcinoma respond better to gemcitabine7 but could suffer from life-threatening hemoptysis when treated with bevacizumab.8,9 Therefore, accurate histopathology diagnosis is crucial for formulating optimal treatment plans for lung cancer patients.10
However, the current clinical process of histopathology assessment is not perfect.11,12 Previous studies showed that there is a slight to moderate interobserver variation in classifying malignant and benign lung tissues (κ = 0.65-0.81).13 To estimate the diagnostic agreement for adenocarcinoma and squamous cell carcinoma, a group of researchers conducted an independent pathology review of 668 lung cancer cases and showed that the interobserver agreement is moderate (κ = 0.48-0.64).11 Another study suggested that the overall agreement for classifying adenocarcinoma and squamous cell carcinoma on morphologic criteria alone (in the absence of immunohistochemistry) was associated with expertise in pulmonary pathology (κ = 0.41-0.46 among community pathologists, κ = 0.64-0.69 among expert lung pathologists from the Pulmonary Pathology Society), and the diagnostic agreement did not reach the target for minimal clinical test reproducibility (κ = 0.7) set by the investigators.12 Further investigations on the histological patterns associated with lung adenocarcinoma subtypes showed that the overall interobserver agreement (in kappa value) for stage IA tumors is 0.52, while that for stage IB tumors is 0.48.14 Erroneous classification can lead to suboptimal treatment and loss of quality of life in patients.
In addition, the relations between histopathology morphology and the transcriptomics subtypes of lung adenocarcinoma and squamous cell carcinoma have not been systematically studied. Transcriptomics subtypes of lung cancer are defined by the expression levels of a subset of genes related to the growth and differentiation of tumor cells.15,16 It is not known whether the dysregulation of these key genes might impact the morphologic appearance of the tumor tissues. Through the systematic identification of transcriptomic-histopathology association, we can pinpoint the morphological changes linked with gene expression and dysregulation, and thereby better understand tumor cell morphology at the molecular level.5
Computer vision algorithms, including convolutional neural networks, have shown exceptionally good performance for image classification.17 These algorithms have demonstrated expert-level performance in several clinical domains including screening for diabetic retinopathy,18 identifying malignant dermatological lesions,19 and detecting cancer cells in pathology images.20,21 With the recent availability of digital whole-slide histopathology images in large cohorts,22,23 we can profile millions of tumor cells from a patient simultaneously and quantify the morphological differences in tumor cells among patients.24–26 Leveraging terabytes of microscopic tissue image data, we can fine-tune the parameters of the neural networks to achieve optimal performance.27 As the diagnosis of lung cancer is established by the cytoarchitectural features of tumor cells, and the diagnostic accuracy is positively associated with the evaluator’s experience,12 we hypothesize that convolutional neural networks trained on millions of histopathology image patches can distinguish malignancy from benign tissues, differentiate tumor types, and identify the distinctive histopathology patterns of cancer cells. Moreover, the extensively documented transcriptomic distinctions between tumor subtypes15,16,28 allow us to analyze the correspondence between transcriptomic differences and the morphologically driven classifications. Here, we used state-of-the-art computer vision methods to uncover the associations between transcriptomic subtypes and tumor cell morphology. The integrative transcriptomic-histopathology analysis will shed insight into the morphological changes related to molecular dysregulations.
In this study, we built convolutional neural network models to distinguish the histopathology and molecular subtypes of lung adenocarcinoma and squamous cell carcinoma. To ensure the generalizability of our methods, we validated the classification models in an independent cohort. We further identified the previously unrecognized associations between tumor tissue morphology and transcriptomic profiles. Through this fully automated computational method, we can identify morphological differences in an unbiased fashion, which could be applied to provide decision support to clinicians encountering atypical histopathology changes,29,30 leverage quantitative morphology to study the macroscopic implications of transcriptomic patterns, and thereby contribute to precision cancer medicine.31,32
MATERIALS AND METHODS
Histopathology images of non-small cell lung cancer
Whole-slide histopathology images of lung adenocarcinoma (n = 427) and lung squamous cell carcinoma (n = 457) patients in the Cancer Genome Atlas (TCGA) cohort were obtained from the National Cancer Institute Genomic Data Commons.33,34 The TCGA dataset contains 187 slides of adjacent benign tissue from adenocarcinoma patients and 327 adjacent benign slides from squamous cell carcinoma patients. The TCGA pathology samples were reviewed by a committee of 12 pulmonary pathologists to confirm the diagnoses, and immunostaining was used to facilitate the classification of ambiguous cases.33,34 To ensure the generalizability of our methods, an independent dataset from the International Cancer Genome Consortium (ICGC) cohort (87 lung adenocarcinoma and 38 lung squamous cell carcinoma patients) was acquired from the ICGC data portal.35 The ICGC follows a similar protocol for data collection and curation, and this dataset includes 57 slides of adjacent benign tissue from adenocarcinoma patients and 20 adjacent benign slides from squamous cell carcinoma patients.35,36 All histopathology images were collected from primary, untreated tumors. The images were scanned by an Aperio scanner (Leica Biosystems, Wetzlar, Germany) at 40× magnification. Patients’ clinical profiles, such as age, sex, race, ethnicity, tumor stage, the anatomical subdivision of the neoplasm, and the accompanying pathology report were also obtained. The pulmonary pathologists’ evaluation from the TCGA and ICGC study consortiums were used as the ground truth for the diagnostic classification. Although a few samples in the TCGA dataset were collected more than 10 years ago, the major diagnostic criteria for identifying tumors from benign tissues did not experience significant changes in the past decades.37 The whole-slide images were broken into tiles with 1000 × 1000 pixels, with a 50% overlap between adjacent tiles to avoid information loss due to cropping. Since the denser tiles contain more cells for further analysis, the 200 densest tiles for each whole slide were selected with the OpenSlide application programming interface (openslide.org).38 All slides under study have more than 200 nonblank tiles, and we conducted a sensitivity study on the number of tiles using the data from TCGA. The resulting image tiles were rescaled for analysis by convolutional neural networks.
Convolutional neural networks for diagnostic classification
Convolutional neural networks were built using the Caffe platform.39 We evaluated several convolutional neural network implementations, including AlexNet,40 GoogLeNet,41 VGGNet-16,42 and the Residual Network-50 (ResNet)43 because of their superior performance in a large-scale image classification challenge.44 AlexNet has a very efficient network design and employed nonsaturating neurons to reduce training time.40 The design of the GoogLeNet architecture is largely based on the Hebbian principle and has increased the depth and width of the network with a budgeted computational cost.41 VGGNet possesses a deep and homogeneous convolution structure and demonstrates that the depth of a neural network is a crucial factor of its performance, and VGGNet-16 is the winner of the 2014 ImageNet Large Scale Visual Recognition Competition classification and localization task.42 ResNet is significantly deeper than VGGNet but lowered its model complexity by residual learning, and ResNet-50 is a 50-layer implementation of ResNet.43 Classification models for histopathology images were fine-tuned from pretrained ImageNet classification models based on these frameworks.
Three diagnostic classification tasks were performed: to classify (1) lung adenocarcinoma from adjacent dense benign tissues, (2) lung squamous cell carcinoma from adjacent dense benign tissues, and (3) lung adenocarcinoma from squamous cell carcinoma. The tiled images were the inputs to the classifier, and the probabilities that the images belong to each category were the outputs of the convolutional neural network models. In classification tasks 1 and 2, tile-level predictions were not aggregated, as the goal was to identify any image regions occupied by cancer cells. For task 3, patient-level predictions were obtained by taking the median of the tile-level predictions.
Evaluation of the non-small cell lung cancer diagnostic classifiers
To evaluate the performance of the classifiers, the TCGA set was randomly divided into a training set (80% of the patients in the TCGA set) and a held-out test set (the remaining 20% of the patients). There was no overlap between patients in the training set and those in the test set, and the 80/20 split was guided by the machine learning literature.45 The convolutional neural network models were trained and all hyperparameters, including learning rate, momentum, and regularization, were finalized through cross-validation on the training set. Through this process, the optimized baseline learning rate was identified to be 0.001 for AlexNet and GoogLeNet, 0.0005 for VGGNet, and 0.01 for ResNet. Momentum was set to 0.9, and L2 regularization was used in all 4 architectures. The finalized models were first applied to the untouched TCGA test set, and the predicted classification for each image was compared with the pathologists’ label. Receiver-operating characteristics (ROC) curves of the test set predictions and the areas under ROC curves (AUCs) were computed. To facilitate interpretation of the model performance, accuracy with 0.5 as the probability cutoff was calculated. This simple procedure is computationally inexpensive and also enhances the generalizability of our approach. The AUCs of different classification tasks were compared. In 3-class classification (adenocarcinoma, squamous cell carcinoma, and adjacent dense benign regions), the class with the highest predicted probability of each image was defined as its predicted class, and the accuracies of the models were reported. To ensure that the reported model performance on the TCGA held-out test set was not due to a fortuitous training-test set partition, the training-test set partition and the model training processes were repeated 5 times. Note that each time we retrained the model and reoptimized all parameters from scratch, to ensure the robustness of the results. The models trained and finalized by the TCGA training set were first validated by the TCGA test set and further evaluated by an independent test set of histopathology images from the ICGC. For each convolutional neural network used in each diagnostic task, 1-sided Wilcoxon signed rank tests were employed to compare the potential drop in AUC when moving from the TCGA test set to the independent dataset from ICGC. To systematically investigate the error mode of the models, 100 image tiles with the largest deviation between the ground truth and the model output were identified and manually reviewed for each classification task. The misclassified images by the machines were first examined by a physician-scientist (K.-H.Y.) in a blinded setting and independently reviewed by a pulmonary pathologist with more than 27 years of experience in diagnostic lung pathology (G.J.B.).
Visualization of the convolutional neural network models
In order to interpret the convolutional neural network models, gradient-weighted class activation maps (Grad-CAM) were used to visualize the regions of importance in the classification process.46 The Grad-CAM method identifies the gradient of the output from the predense layer with respect to the input image, thereby characterizing the importance of the input pixels to the classification results.46 For model visualization, the images with >99.9% prediction confidence were retrieved and visualized. The Grad-CAM of models that distinguish lung adenocarcinoma from adjacent dense benign tissue, lung squamous cell carcinoma from adjacent dense benign tissue, and lung adenocarcinoma from lung squamous cell carcinoma were examined.
Non-small cell lung cancer transcriptomics subtypes and classifications
Previous research has described the transcription-based subtypes of non-small cell lung cancer, including the terminal respiratory unit, proximal inflammatory, and proximal proliferative subtypes of lung adenocarcinoma and the classical, basal, secretory, and primitive subtypes of lung squamous cell carcinoma.15,16 Level 3 publicly available gene expression data of the patient cohorts were acquired from the National Cancer Institute's Genomic Data Commons and the methods described in the TCGA Consortium articles33,34 were used to determine the transcriptomics subtypes of the patients. The samples with available gene expression data were randomly divided into an 80% training set and a 20% held-out test set.45 The associations between histopathology patterns and the transcriptomic subtypes were investigated by building and fine-tuning a multiclass VGGNet convolutional neural network model using the training set. In the test phase, data from the held-out test set were inputted to the VGGNet model, and the output of the last layer of the VGGNet was obtained and transformed using principal component analysis, with the first 2 principal components visualized. In addition, pairwise subtype classification models were trained on the subtypes with a sufficient number of cases (>270 cases in the 2 subtypes combined) using the 80% training set, and the performance of the classification models was evaluated by their AUCs in the 20% held-out test set.
Patients with the same transcriptomic subtype nonetheless have variations in their transcriptomic signature. To evaluate the correlations between the variations in the transcriptomic signature that defined tumor subtypes and the histopathology-predicted subtypes in the test set, Spearman’s correlation coefficients were calculated between the transcriptomic subtype score defined by ConsensusClusterPlus15,16 and the subtype probability predicted by a VGGNet model trained by histopathology images. Spearman’s correlation test was performed to evaluate the strength of the correlations. All statistical analyses were performed in R version 3.3 (R Foundation for Statistical Computing, Vienna, Austria).
RESULTS
Patient characteristics
We obtained the whole-slide histopathology images from 427 lung adenocarcinoma33 and 457 lung squamous cell carcinoma34 patients in the TCGA database. An additional 87 patients with lung adenocarcinoma and 38 with lung squamous cell carcinoma were identified in the ICGC cohort. Pathology reports and clinical information of each patient, such as patient age, sex, race, and the anatomical subdivision of the tumor, were also acquired. Supplementary Table S1 summarizes the patient characteristics of the TCGA cohort, and Supplementary Table S2 outlines those for the ICGC cohort.
Convolutional neural networks classified lung adenocarcinoma from adjacent dense benign tissue
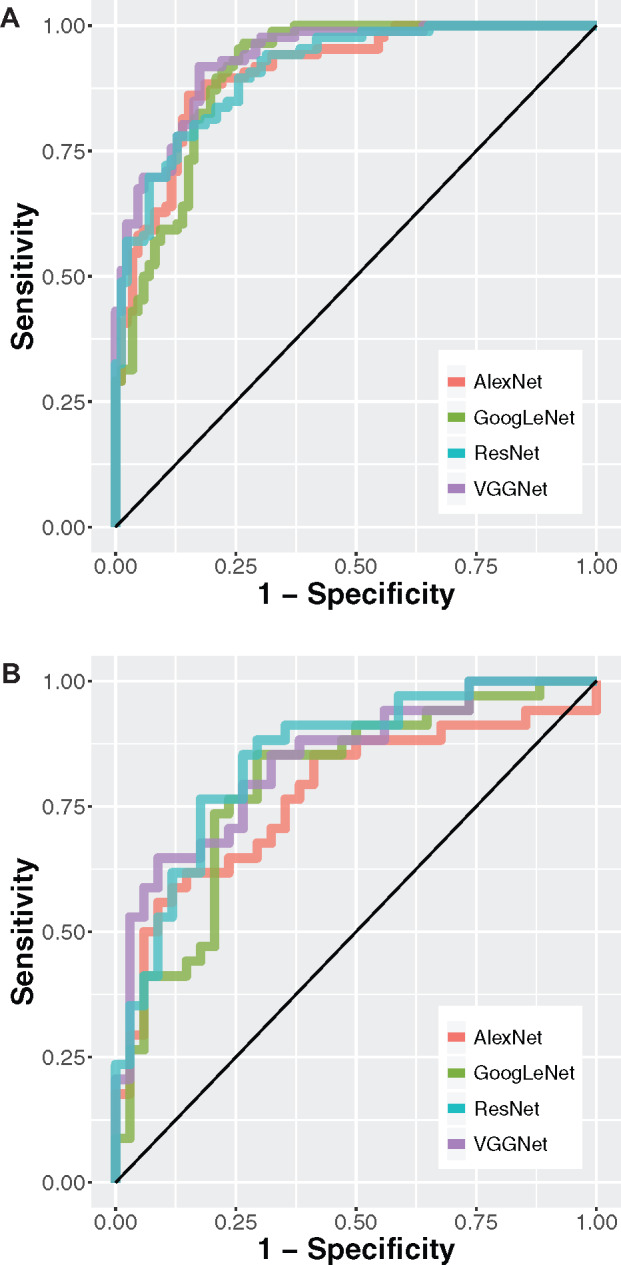
The convolutional neural network successfully distinguished lung adenocarcinoma from the adjacent dense benign tissue, with the AUCs approximately 0.951-0.971 in the TCGA test set (VGGNet: 0.971 ± 0.007; ResNet: 0.953 ± 0.009; GoogLeNet: 0.969 ± 0.007; AlexNet: 0.951 ± 0.010) (Figure 1A). VGGNet and GoogLeNet performed slightly better than ResNet and AlexNet. The results were validated in the ICGC cohort, with AUCs 0.916-0.936 (VGGNet: 0.936 ± 0.025; ResNet: 0.926 ± 0.014; GoogLeNet: 0.929 ± 0.030; AlexNet: 0.916 ± 0.033) (Figure 1B). In 3 of 4 models, the performance on the ICGC dataset was not significantly different from that of the TCGA test set (ResNet: Wilcoxon signed rank test P = .0502; AlexNet: P = .219; GoogLeNet: P = .063; VGGNet: P = .031). Comparing with a previously reported quantitative method for pathology analysis using the TCGA datasets,5 our neural networks attained 10%-12% performance improvement in the TCGA test set. (Supplementary Table S3). We further investigated the Grad-CAMs and demonstrated that the convolutional neural networks give higher weights to regions indicative of tumorous changes (Figures 1C and 1D). To understand the error mode of our models, we conducted a systematic error analysis on 100 image tiles with the largest deviation between the ground truth and the model-predicted output. Results showed that 78% of misclassified image tiles showed nonspecific pathology changes such as extensive hemorrhage or anthracosis (Supplementary Table S4). Using the data from TCGA, we conducted a sensitivity analysis on the number of tiles per slide included in the study. Results showed that when increasing the number of tiles per slide from 10 to 200, the AUC of VGGNet increased by 4%. When increasing the number of tiles beyond 200, the AUC continued to increase by <1% (Supplementary Figure S1). However, as not all slides have more than 257 nonblank image tiles, including a larger number of tiles will result in unequal representations of slides in the dataset.
Figure 1.

Convolutional neural networks distinguished lung adenocarcinoma from adjacent dense benign tissue, and the results were validated in the independent International Cancer Genome Consortium cohort. (A) Receiver-operating characteristic (ROC) curves of AlexNet, GoogLeNet, ResNet, and VGGNet in the TCGA test set. Areas under the ROC curve: VGGNet: 0.971 ± 0.007; ResNet: 0.953 ± 0.009; GoogLeNet: 0.969 ± 0.007; AlexNet: 0.951 ± 0.010. (B) The ROC curves of the convolutional neural networks in the independent International Cancer Genome Consortium cohort. The classifiers achieved similar performance in this independent test set. Areas under the ROC curve: VGGNet: 0.936 ± 0.025; ResNet: 0.926 ± 0.014; GoogLeNet: 0.929 ± 0.030; AlexNet: 0.916 ± 0.033. (C) Attention analysis showed that the deep neural networks accurately utilized regions of tumorous changes to distinguish lung adenocarcinoma from adjacent dense benign tissues. A sample image tile of lung adenocarcinoma was shown. Red arrows indicate regions occupied by tumor cells. (D) Gradient-weighted class activation map of the VGGNet model. The gradient-weighted class activation map method characterizes the regions where changes in pixel values would affect the classification score significantly, thereby quantifying where the artificial neural network put their “attention.” Regions with adenocarcinoma cells were identified and highlighted by the convolutional neural network automatically after training. Note that no human segmentation is involved in our training process.
Convolutional neural networks classified lung squamous cell carcinoma from adjacent dense benign tissue
Convolutional neural network classifiers achieved AUCs of 0.944-0.985 in distinguishing the tumor parts of lung squamous cell carcinoma from the adjacent dense benign tissue in the TCGA test set (VGGNet: 0.985 ± 0.004; ResNet: 0.944 ± 0.007; GoogLeNet: 0.984 ± 0.003; AlexNet: 0.974 ± 0.004) (Figure 2A). Similar performance was observed in the validation cohort from ICGC, with AUCs more than 0.97 (VGGNet: 0.978 ± 0.013; ResNet: 0.970 ± 0.006; GoogLeNet: 0.985 ± 0.007; AlexNet: 0.983 ± 0.009) (Figure 2B). For each of these models, the performance on the ICGC dataset was not significantly different from that of the TCGA test set in this classification task (VGGNet: Wilcoxon signed rank test P = .781; ResNet: P = .938; AlexNet: P = .938; GoogLeNet: P = .781). In general, AlexNet, GoogLeNet, and VGGNet achieved similar classification performance, whereas the effectiveness of ResNet had slightly more variation. All of the neural network methods investigated achieved an 6%-10% increase in AUC, compared with previously reported machine learning methods developed with the TCGA datasets (Supplementary Table S3).5 The high AUCs demonstrated the potential of identifying the suspicious part of the whole-slide images for further review and provide decision support to pathologists encountering ambiguous histopathology changes. Visualization of the attention map revealed that the convolutional neural networks attended to regions of squamous cancerous cell clusters, which validated the relevance of the classifiers (Figures 2C and 2D). Systematic error analysis showed that the majority of misclassified image tiles were either out of focus (43%) or from thick cuts (36%) (Supplementary Table S4). Error analysis also revealed a number of images constantly misclassified by our models contained mislabeled regions. Supplementary Figure S2 shows 1 of such images, which was tiled from a slide labeled as adjacent benign tissue by pathology evaluation conducted by TCGA, but a detailed pathology review by a pulmonary pathologist indicated that the frozen section image contains clusters of atypical cells and atypical glandular proliferation. As the tissue slides were used for quality control purposes in the TCGA studies, the associated sample would need further evaluation in order to avoid biasing the omics profiling results in the original study.
Figure 2.

Convolutional neural networks distinguished lung squamous cell carcinoma from adjacent dense benign tissue, and the results were validated in the independent International Cancer Genome Consortium cohort. (A) Receiver-operating characteristic (ROC) curves of AlexNet, GoogLeNet, ResNet, and VGGNet in the TCGA test set. Areas under the ROC curve: VGGNet: 0.985 ± 0.004; ResNet: 0.944 ± 0.007; GoogLeNet: 0.984 ± 0.003; AlexNet: 0.974 ± 0.004. (B) The ROC curves of the convolutional neural network classifiers in the independent International Cancer Genome Consortium cohort. Areas under the ROC curve: VGGNet: 0.978 ± 0.013; ResNet: 0.970 ± 0.006; GoogLeNet: 0.985 ± 0.007; AlexNet: 0.983 ± 0.009. (C) Attention analysis of the deep neural networks demonstrated the regions of tumor cell clusters were used to distinguish lung squamous cell carcinoma from adjacent dense benign tissues. A sample image of lung squamous cell carcinoma was shown. Red arrows indicate regions occupied by tumor cells. A black arrow indicates an artifact likely caused by uneven tissue thickness. (D) Gradient-weighted class activation map of the VGGNet model. Regions of squamous cancer cells are automatically highlighted by the trained model, without human segmentation.
Convolutional neural networks classified lung adenocarcinoma from lung squamous cell carcinoma
Adenocarcinoma and squamous cell carcinoma are the 2 most common types of lung malignancy. It is crucial to distinguish them on account of the treatment options, and the results demonstrated that convolutional neural networks achieved high accuracy in this task. The AUCs of the classifiers in the TCGA test set were approximately 0.877-0.927 (VGGNet: 0.927 ± 0.004; ResNet: 0.877 ± 0.013; GoogLeNet: 0.905 ± 0.006; AlexNet: 0.891 ± 0.009) (Figure 3A). All of the neural network models performed 13%-25% better than the feature-based machine learning methods on the TCGA test set (Supplementary Table S3).5 The AUCs of the finalized models applied to the validation cohort (ICGC) were 0.726-0.864 (VGGNet: 0.842 ± 0.011; ResNet: 0.864 ± 0.027; GoogLeNet: 0.819 ± 0.008; AlexNet: 0.726 ± 0.025) (Figure 3B). For the AlexNet, GoogLeNet, and VGGNet models, the performance difference between the TCGA test set and the ICGC dataset reached statistical significance (Wilcoxon signed rank test P value of VGGNet, AlexNet, and GoogLeNet = .031), but the performance of ResNet did not significantly differ on the 2 test sets (Wilcoxon signed rank test P = .313). Grad-CAM analyses revealed the distinctive visual patterns of the 2 tumor types picked up by the convolutional neural networks, such as the clustering patterns of tumor cells (Figures 3C–F). Error analysis revealed that image tiles from thick tissue cut (67%), regions with uneven slide thickness (14%), and out-of-focus image tiles (12%) accounted for the majority of model misclassification (Supplementary Table S4).
Figure 3.
Convolutional neural networks distinguished lung squamous cell carcinoma from lung adenocarcinoma, and the results were validated in the independent International Cancer Genome Consortium cohort. (A) Receiver-operating characteristic (ROC) curves of AlexNet, GoogLeNet, ResNet, and VGGNet in the TCGA test set. Areas under the ROC curve: VGGNet: 0.927 ± 0.004; ResNet: 0.877 ± 0.013; GoogLeNet: 0.905 ± 0.006; AlexNet: 0.891 ± 0.009. (B) The ROC curves of the convolutional neural network classifiers in the independent International Cancer Genome Consortium cohort. Areas under the ROC curve: VGGNet: 0.842 ± 0.011; ResNet: 0.864 ± 0.027; GoogLeNet: 0.819 ± 0.008; AlexNet: 0.726 ± 0.025. (C) Visualization of the attention map showed regions the deep neural networks attended to when distinguishing lung squamous cell carcinoma from lung adenocarcinoma. A sample image of lung adenocarcinoma was shown. Arrows indicate papillary patterns of adenocarcinoma. (D) The gradient-weighted class activation map plot of the lung adenocarcinoma image. (E) A sample image of lung squamous cell carcinoma. Arrows indicate nests of polygonal cells typical of squamous cell carcinoma. (F) The gradient-weighted class activation map plot of the lung squamous cell carcinoma image. Note that no human segmentation is required in our training process.
Figure 3.

Continued
We further built 3-class classification models to distinguish lung adenocarcinoma, lung squamous cell carcinoma, and the adjacent benign tissue in 1 step. Results showed that our models achieved 3-class classification accuracies of 0.795-0.891 in the TCGA test set and 0.724-0.800 in the independent test set from ICGC (Supplementary Table S5). The performance of ResNet did not significantly differ on the 2 test sets (Wilcoxon signed rank test P = .094), while performance differences between the 2 sets were observed in 3 other models (P = .031 for AlexNet, VGGNet, and GoogLeNet). Our trained models for the diagnostic tasks are available at https://github.com/khyu/lung-CNN.
Convolutional neural networks correlated cell morphology with gene expression subtypes
Previous studies defined the subtypes of non-small cell lung cancer by the clusters of tumor gene expression profiles. The 3 transcriptomic subtypes of lung adenocarcinoma proposed by TCGA are the terminal respiratory unit, proximal inflammatory, and proximal proliferative subtypes, which correspond to the previous pathological, anatomic, and mutational classifications of bronchioid, squamoid, and magnoid subtypes, respectively.16,33 The 4 transcriptomic subtypes of lung squamous cell carcinoma proposed by TCGA are the classical, basal, secretory, and primitive subtypes.15,34 These subtypes are related to the differentially activated inflammation, proliferation, and cell differentiation pathways.15,16 Here, we analyzed the lung adenocarcinoma and squamous cell carcinoma patients with available histopathology slide and RNA-sequencing data (Supplementary Table S6), determined their transcriptomic subtypes, and employed convolutional neural networks to associate the morphological patterns of the cells with patients’ molecular subtypes. A multiclass image classification model showed that the principal components of the output values from the last layer of VGGNet were significantly correlated with the transcriptomic subtypes of both adenocarcinoma (analysis of variance P < .004 in both principal components 1 and 2) (Figure 4A) and squamous cell carcinoma (analysis of variance P < .003 in principal component 1) (Figure 4C). Correlation analysis showed that patients with typical transcriptomic profiles for the subtype they belong to also possessed histopathology patterns typical of that subtype (Figures 4B and 4D). The Spearman’s correlation coefficients of the transcriptomics-based subtype scores and the histopathology-derived probabilities were >0.4 in all 3 subtypes (P < .01) of lung adenocarcinoma and in the 2 common subtypes (classical and prototypical) of lung squamous cell carcinoma. In addition, pairwise neural network models predicted the subtypes of lung adenocarcinoma with AUCs 0.771-0.892 in the best classifiers (Supplementary Figure S3) and predicted the major subtypes of lung squamous cell carcinoma with AUCs approximately 0.7 (Supplementary Figure S4). The slightly worse performance in squamous cell carcinoma might originate from the fact that there were fewer numbers of samples in each of the 4 subtypes. These results indicated the strong correlations between cell morphology and gene expression subtypes of non-small cell lung cancer.
Figure 4.

Convolutional neural network associated transcriptomic subtypes with histopathology patterns. (A) The principal components (PCs) of the VGGNet-based histopathology image summary vector were correlated with the 3 subtypes of lung adenocarcinoma (PC1 analysis of variance [ANOVA] P value < .0001; PC2 ANOVA P value = .0038). Each dot represents a sample in the test set. The color of the dots indicates the transcriptomic subtypes of the sample. The triangles represent the mean PC1 and PC2 of each subtype. (B) Correlation plots of the transcriptomic subtype scores and the histopathology classification scores in lung adenocarcinoma. Significant associations were found in all 3 subtypes (P < .01). (C) The first principal component of the VGGNet-based histopathology image summary vector is correlated with the 4 subtypes of lung squamous cell carcinoma (PC1 ANOVA P value = .0028). Each dot represents a sample in the test set. The color of the dots indicates the transcriptomic subtypes of the sample. The triangles represent the mean PC1 and PC2 of each subtype. (D) Correlation plots of the transcriptomic subtype scores and the histopathology classification scores in lung squamous cell carcinoma. Significant associations were found in the classical and primitive subtypes (P < .01). PI: proximal inflammatory subtype; PP: proximal proliferative subtype; TRU: terminal respiratory unit subtype.
Figure 4.

Continued
DISCUSSION
This is the first study that used convolutional neural networks to identify the transcriptomic subtypes of lung malignancy. We built upon previous studies that associated quantitative pathology features with diagnosis21,47,48 and genetic mutations.21 Our results demonstrated that the deep learning framework identified histopathology slides with tumor cells, captured the cell morphologies related to lung cancer diagnosis, and correlated histopathology with transcriptomic profiles. The diagnostic classifications were successfully validated in an independent test set, showing the robustness of our methods. Our analytical framework requires no human intervention after tissue slide preparation, contributes to building an automated decision support system, and points to the associations between tumor cell morphology and molecular biology.
Our work demonstrates a systematic approach to analyzing histopathology images in a nonbiased fashion. Compared with the previous methods,5,24–26 our approaches require no human segmentation24 and feature definition,5,24–26 making them easily fit into the clinical workflow of pathology diagnosis. The extracted features do not rely on prior pathology knowledge. This enables us to identify novel morphological patterns related to clinically relevant phenotypes and biological processes at the gene expression level. In addition, our models performed 6%-27% better than the previously proposed feature-based methods, and the error rates were comparable with the reported interobserver variations, indicating the utility of deep convolutional neural networks in classifying lung cancer types. The high accuracy of our models is due in part to the relatively high-quality cancer type annotations by a committee of pulmonary pathologists and confirmation by genomic profiling. As expected, the performance on a second validation set from a different patient population is slightly lower. Nonetheless, 3 classifiers attained slightly better performance in detecting lung squamous cell carcinoma in the ICGC set, which could result from the relative homogeneity of the cohort. Furthermore, our system successfully identified regions with atypical cells and atypical glandular proliferation in slides that were marked as adjacent dense benign tissue by TCGA (Supplementary Figure S2). This finding was confirmed by an experienced pulmonary pathologist. This suggests that our methods could learn the general patterns of pathology in the presence of occasional noise and mislabels in the research dataset, which could identify suspicious cells in the histopathology slides of research samples and provide decision support for pathology evaluation.29,49 Given the increasing incidence rate of lung cancer and the projected shortage of pathologists,50 we can augment the current pathology evaluation workflow with the reported system, which can double-check on the diagnoses made by human practitioners and point out suspicious tissue regions requiring additional review. The deployment of machine learning systems in the clinical settings has the potential of reducing the cost and loss of quality of life associated with misdiagnoses.51 In addition, the classification of transcriptomic subtypes can facilitate further studies on the morphological impact of aberrant gene expression in the tumor tissue.
The general architecture of our convolutional neural networks was trained on the images from the ImageNet,44 which bear little resemblance to histopathology images. However, we showed that these frameworks generated good classification performance when refined with hundreds of whole-slide histopathology images as the training data during model fine-tuning.52 When classifying cancerous regions from the adjacent dense benign tissues, AlexNet, which consists of only 5 convolutional layers, has similar performance compared with other models. However, for more sophisticated tasks, such as classifying squamous cell carcinoma and adenocarcinoma, AlexNet exhibited worse performance. These results indicated that simple models may be suitable for tumor detection tasks, while diagnosing tumor types and subtypes may require neural networks with more sophisticated designs. The accuracy of the cancer type classification is generally lower than that of the cancer identification task, suggesting the increased complexity in cancer type classification.
As expected, convolutional neural networks worked best when the number of training samples was large.53,54 Whole slide histopathology images of tumor tissues provide a substantial opportunity for convolutional neural network applications, as 1 slide typically contains thousands of tumor cells. In addition, several types of tumor cell variations are often represented in different parts of the same whole-slide image. The abundance of tumor cells and their variations per slide provided sufficient data for establishing a diagnostic model for non-small cell lung cancer. This study demonstrated the feasibility of developing a deep learning–based platform for histopathology diagnosis and omics-histopathology integration, and our developed models lay the foundation for future deployment of pathology decision support systems. Our approaches can accommodate new convolutional neural network models for image classification and are extensible to other imaging classification tasks central to clinical diagnosis.55 Further studies are needed to establish the cell-level image-transcriptomics association by single-cell sequencing and validate the utility of computer vision methods for diagnosing other prevalent tumor types. Recent advancements in image segmentation56 and image simulation57 also point to the possibility of using various neural network designs to analyze and simulate histopathology images in future studies.
One limitation of the study is that the TCGA and ICGC datasets only included the 2 most common histology types of lung cancer: adenocarcinoma and squamous cell carcinoma. Although these 2 subtypes comprise more than 80% of non-small cell lung cancer, the diagnostic performance of rarer types of tumors, such as giant cell carcinoma of the lung or small cell lung carcinoma, cannot be evaluated based on the available data.58,59 Large-scale collection of rarer cancer types and prospective studies on the efficacy of the developed models are required to enable comprehensive cancer diagnostic systems.51 In addition, all of the histopathology images in this study were gathered retrospectively, and the updated International Association for the Study of Lung Cancer/American Thoracic Society/European Respiratory Society classifications of lung adenocarcinoma60 were not available for the study cohorts. Another limitation is the need to evaluate cases of squamous dysplasia and nonneoplastic mimics of adenocarcinoma such as chemotherapy-induced cytologic atypia and epithelial atypia associated with acute lung injury patterns. Future studies are needed to quantify the interobserver disagreement of various lung cancer pathology and investigate the clinical utility of implementing an automated histopathology image analytical system in real-world settings.61
Overall, our study demonstrated the utility of convolutional neural networks in associating tumor cell morphology with their molecular subtypes and classifying the histopathology images of the major types of non-small cell lung cancer. The machine learning system presented here can provide decision support to pathologists, detect atypical cells in large datasets with noisy labels, and aid in reclassifying patients with inconclusive histopathology presentations. Further testing in the clinical settings is needed to confirm the utility of our system. Our developed bioinformatics workflow is generalizable to other tumor types or diseases.
FUNDING
This work was supported by National Cancer Institute, National Institutes of Health, grant number 5U24CA160036 (to MS); National Human Genome Research Institute, National Institutes of Health, grant number 5P50HG007735 (to MS); the Mobilize Center, Stanford University (to CR); the Harvard Data Science Fellowship (to K-HY), and the Harvard Medical School Center for Computational Biomedicine Award (to K-HY). The funding sources had no role in the design and conduct of the study; collection, management, analysis, and interpretation of the data; preparation, review, or approval of the manuscript; and the decision to submit the manuscript for publication.
AUTHOR CONTRIBUTIONS
K-HY conceived, designed, performed the analyses, interpreted the results, and wrote and revised the manuscript. FW implemented an early version of neural networks and edited the manuscript. GJB, CR, RBA, MS, and IK interpreted the results and edited the manuscript. IK supervised the work. K-HY had full access to all the data in the study and takes responsibility for the integrity of the data and the accuracy of the data analysis.
SUPPLEMENTARY MATERIAL
Supplementary material is available at Journal of the American Medical Informatics Association online.
Supplementary Material
ACKNOWLEDGMENTS
We thank Dr Matt van de Rijn for his valuable advice on the study design and interpretation of results, and Ce Zhang, Alex Ratner, Andrej Krevl, and Rok Sosic for their assistance on the computation framework. We thank the AWS Cloud Credits for Research, Microsoft Azure Research Award, the NVIDIA GPU Grant Program, and the Extreme Science and Engineering Discovery Environment (XSEDE) at the Pittsburgh Supercomputing Center (allocation TG-BCS180016) for their computational supports. The results published here are in part based upon data generated by the TCGA Research Network: https://www.cancer.gov/tcga. We thank the anonymous reviewers for their constructive feedback.
CONFLICT OF INTEREST STATEMENT
To maximize the impact of this study, Harvard Medical School submitted a provisional patent application to the U.S. Patent and Trademark Office.
REFERENCES
- 1. Molina JR, Yang P, Cassivi SD, Schild SE, Adjei AA.. Non-small cell lung cancer: epidemiology, risk factors, treatment, and survivorship. Mayo Clin Proc 2008; 83 (5): 584–94. [DOI] [PMC free article] [PubMed] [Google Scholar]
- 2. Torre LA, Bray F, Siegel RL, Ferlay J, Lortet-Tieulent J, Jemal A.. Global cancer statistics, 2012. CA Cancer J Clin 2015; 65 (2): 87–108. [DOI] [PubMed] [Google Scholar]
- 3. Siegel RL, Miller KD, Jemal A.. Cancer statistics, 2016. CA Cancer J Clin 2016; 66 (1): 7–30. [DOI] [PubMed] [Google Scholar]
- 4. Travis WD, Brambilla E, Riely GJ.. New pathologic classification of lung cancer: relevance for clinical practice and clinical trials. J Clin Oncol 2013; 31 (8): 992–1001. [DOI] [PubMed] [Google Scholar]
- 5. Yu KH, Snyder M.. Omics profiling in precision oncology. Mol Cell Proteomics 2016; 15 (8): 2525–36. [DOI] [PMC free article] [PubMed] [Google Scholar]
- 6. Snyder M. Genomics and Personalized Medicine: What Everyone Needs to Know. New York, NY: Oxford University Press; 2016. [Google Scholar]
- 7. Scagliotti GV, Parikh P, von Pawel J, et al. Phase III study comparing cisplatin plus gemcitabine with cisplatin plus pemetrexed in chemotherapy-naive patients with advanced-stage non-small-cell lung cancer. J Clin Oncol 2008; 26 (21): 3543–51. [DOI] [PubMed] [Google Scholar]
- 8. Cohen MH, Gootenberg J, Keegan P, Pazdur R.. FDA drug approval summary: bevacizumab (Avastin) plus Carboplatin and Paclitaxel as first-line treatment of advanced/metastatic recurrent nonsquamous non-small cell lung cancer. Oncologist 2007; 12 (6): 713–8. [DOI] [PubMed] [Google Scholar]
- 9. Johnson DH, Fehrenbacher L, Novotny WF, et al. Randomized phase II trial comparing bevacizumab plus carboplatin and paclitaxel with carboplatin and paclitaxel alone in previously untreated locally advanced or metastatic non-small-cell lung cancer. J Clin Oncol 2004; 22 (11): 2184–91. [DOI] [PubMed] [Google Scholar]
- 10. Bishop JA, Benjamin H, Cholakh H, Chajut A, Clark DP, Westra WH.. Accurate classification of non-small cell lung carcinoma using a novel microRNA-based approach. Clin Cancer Res 2010; 16 (2): 610–9. [DOI] [PubMed] [Google Scholar]
- 11. Stang A, Pohlabeln H, Müller KM, Jahn I, Giersiepen K, Jöckel K-H.. Diagnostic agreement in the histopathological evaluation of lung cancer tissue in a population-based case-control study. Lung Cancer 2006; 52 (1): 29–36. [DOI] [PubMed] [Google Scholar]
- 12. Grilley-Olson JE, Hayes DN, Moore DT.. Validation of interobserver agreement in lung cancer assessment: hematoxylin-eosin diagnostic reproducibility for non-small cell lung cancer: the 2004 World Health Organization classification and therapeutically relevant subsets. Arch Pathol Lab Med 2013; 137 (1): 32–40. [DOI] [PMC free article] [PubMed] [Google Scholar]
- 13. Thunnissen FB, Kerr KM, Brambilla E, et al. EU-USA pathology panel for uniform diagnosis in randomised controlled trials for HRCT screening in lung cancer. Eur Respir J 2006; 28 (6): 1186–9. [DOI] [PubMed] [Google Scholar]
- 14. Trejo Bittar HE, Incharoen P, Althouse AD, Dacic S.. Accuracy of the IASLC/ATS/ERS histological subtyping of stage I lung adenocarcinoma on intraoperative frozen sections. Mod Pathol 2015; 28 (8): 1058–63. [DOI] [PubMed] [Google Scholar]
- 15. Wilkerson MD, Yin X, Hoadley KA, et al. Lung squamous cell carcinoma mRNA expression subtypes are reproducible, clinically important, and correspond to normal cell types. Clin Cancer Res 2010; 16 (19): 4864–75. [DOI] [PMC free article] [PubMed] [Google Scholar]
- 16. Wilkerson MD, Yin X, Walter V, et al. Differential pathogenesis of lung adenocarcinoma subtypes involving sequence mutations, copy number, chromosomal instability, and methylation. PLoS One 2012; 7 (5): e36530. [DOI] [PMC free article] [PubMed] [Google Scholar]
- 17. Lawrence S, Giles CL, Tsoi AC, Back AD.. Face recognition: a convolutional neural-network approach. IEEE Trans Neural Netw 1997; 8 (1): 98–113. [DOI] [PubMed] [Google Scholar]
- 18. Gulshan V, Peng L, Coram M, et al. Development and validation of a deep learning algorithm for detection of diabetic retinopathy in retinal fundus photographs. JAMA 2016; 316 (22): 2402–10. [DOI] [PubMed] [Google Scholar]
- 19. Esteva A, Kuprel B, Novoa RA, et al. Dermatologist-level classification of skin cancer with deep neural networks. Nature 2017; 542 (7639): 115–8. [DOI] [PMC free article] [PubMed] [Google Scholar]
- 20. Ehteshami Bejnordi B, Veta M, Johannes van Diest P, et al. ; the CAMELYON16 Consortium. Diagnostic Assessment of deep learning algorithms for detection of lymph node metastases in women with breast cancer. JAMA 2017; 318 (22): 2199–210. [DOI] [PMC free article] [PubMed] [Google Scholar]
- 21. Coudray N, Ocampo PS, Sakellaropoulos T, et al. Classification and mutation prediction from non-small cell lung cancer histopathology images using deep learning. Nat Med 2018; 24 (10): 1559–67. [DOI] [PMC free article] [PubMed] [Google Scholar]
- 22. Hipp J, Flotte T, Monaco J, et al. Computer aided diagnostic tools aim to empower rather than replace pathologists: lessons learned from computational chess. J Pathol Inform 2011; 2: 25.. [DOI] [PMC free article] [PubMed] [Google Scholar]
- 23. Al-Janabi S, Huisman A, Van Diest PJ.. Digital pathology: current status and future perspectives. Histopathology 2012; 61 (1): 1–9. [DOI] [PubMed] [Google Scholar]
- 24. Beck AH, Sangoi AR, Leung S, et al. Systematic analysis of breast cancer morphology uncovers stromal features associated with survival. Sci Transl Med 2011; 3 (108): 108ra13. [DOI] [PubMed] [Google Scholar]
- 25. Yuan Y, Failmezger H, Rueda OM, et al. Quantitative image analysis of cellular heterogeneity in breast tumors complements genomic profiling. Sci Transl Med 2012; 4 (157): 157ra43. [DOI] [PubMed] [Google Scholar]
- 26. Yu KH, Berry GJ, Rubin DL, Re C, Altman RB, Snyder M.. Association of omics features with histopathology patterns in lung adenocarcinoma. Cell Syst 2017; 5 (6): 620–7.e3 [DOI] [PMC free article] [PubMed] [Google Scholar]
- 27. Shin HC, Roth HR, Gao M, et al. Deep convolutional neural networks for computer-aided detection: CNN architectures, dataset characteristics and transfer learning. IEEE Trans Med Imaging 2016; 35 (5): 1285–98. [DOI] [PMC free article] [PubMed] [Google Scholar]
- 28. Yu KH, Fitzpatrick MR, Pappas L, Chan W, Kung J, Snyder M.. Omics AnalySIs System for PRecision Oncology (OASISPRO): a web-based omics analysis tool for clinical phenotype prediction. Bioinformatics 2018; 34 (2): 319–20. [DOI] [PMC free article] [PubMed] [Google Scholar]
- 29. Jha S, Topol EJ.. Adapting to artificial intelligence: radiologists and pathologists as information specialists. JAMA 2016; 316 (22): 2353–4. [DOI] [PubMed] [Google Scholar]
- 30. Kothari S, Phan JH, Stokes TH, Wang MD.. Pathology imaging informatics for quantitative analysis of whole-slide images. J Am Med Inform Assoc 2013; 20 (6): 1099–108. [DOI] [PMC free article] [PubMed] [Google Scholar]
- 31. Collins FS, Varmus H.. A new initiative on precision medicine. N Engl J Med 2015; 372 (9): 793–5. [DOI] [PMC free article] [PubMed] [Google Scholar]
- 32. Ashley EA. The precision medicine initiative: a new national effort. JAMA 2015; 313 (21): 2119–20. [DOI] [PubMed] [Google Scholar]
- 33. Cancer Genome Atlas Research Network. Comprehensive molecular profiling of lung adenocarcinoma. Nature 2014; 511 (7511): 543–50. [DOI] [PMC free article] [PubMed] [Google Scholar]
- 34. Cancer Genome Atlas Research Network. Comprehensive genomic characterization of squamous cell lung cancers. Nature 2012; 489 (7417): 519–25. [DOI] [PMC free article] [PubMed] [Google Scholar]
- 35. Zhang J, Baran J, Cros A, et al. International Cancer Genome Consortium Data Portal–a one-stop shop for cancer genomics data. Database (Oxford) 2011; 2011: bar026. [DOI] [PMC free article] [PubMed] [Google Scholar]
- 36.International Cancer Genome Consortium, Hudson TJ, Anderson W, et al. International network of cancer genome projects. Nature 2010; 464 (7291): 993–8. [DOI] [PMC free article] [PubMed] [Google Scholar]
- 37. Gould MK, Donington J, Lynch WR, et al. Evaluation of individuals with pulmonary nodules: when is it lung cancer? Diagnosis and management of lung cancer, 3rd ed: American College of Chest Physicians evidence-based clinical practice guidelines. Chest 2013; 143 Suppl 5: e93S–120S. [DOI] [PMC free article] [PubMed] [Google Scholar]
- 38. Goode A, Gilbert B, Harkes J, Jukic D, Satyanarayanan M.. OpenSlide: a vendor-neutral software foundation for digital pathology. J Pathol Inform 2013; 4: 27.. [DOI] [PMC free article] [PubMed] [Google Scholar]
- 39. Jia Y, Shelhamer E, Donahue J, et al. Caffe: Convolutional architecture for fast feature embedding. In: Proceedings of the 22nd ACM International Conference on Multimedia New York, NY: ACM; 2014: 675–8.
- 40. Krizhevsky A, Sutskever I, Hinton GE. ImageNet classification with deep convolutional neural networks. In: Proceedings of the 25th International Conference on Neural Information Processing Systems New York, NY: ACM; 2012: 1097–105.
- 41. Szegedy C, Liu W, Jia Y, et al. Going deeper with convolutions. In: Proceedings of the IEEE Conference on Computer Vision and Pattern Recognition; 2015: 1–9.
- 42. Chatfield K, Simonyan K, Vedaldi A, Zisserman A. Return of the devil in the details: delving deep into convolutional nets. arXiv2014. https://arxiv.org/abs/1405.3531
- 43. Selvaraju RR, Cogswell M, Das A, Vedantam R, Parikh D, Batra D. Grad-CAM: visual explanations from deep networks via gradient-based localization. arXiv2016. https://arxiv.org/abs/1610.02391
- 44. Russakovsky O, Deng J, Su H, et al. ImageNet large scale visual recognition challenge. Int J Comput Vis 2015; 115 (3): 211–52. [Google Scholar]
- 45. Lever J, Krzywinski M, Altman N.. Model selection and overfitting. Nat Methods 2016; 13 (9): 703–4. [Google Scholar]
- 46. Selvaraju RR, Cogswell M, Das A, Vedantam R, Parikh D, Batra D. Grad-cam: visual explanations from deep networks via gradient-based localization. arXiv2016. https://arxiv.org/abs/1610.02391.
- 47. Yu KH, Zhang C, Berry GJ, et al. Predicting non-small cell lung cancer prognosis by fully automated microscopic pathology image features. Nat Commun 2016; 7 (1): 12474. [DOI] [PMC free article] [PubMed] [Google Scholar]
- 48. Khosravi P, Kazemi E, Imielinski M, Elemento O, Hajirasouliha I.. Deep convolutional neural networks enable discrimination of heterogeneous digital pathology images. EBioMedicine 2018; 27: 317–28. [DOI] [PMC free article] [PubMed] [Google Scholar]
- 49. Manion E, Cohen MB, Weydert J.. Mandatory second opinion in surgical pathology referral material: clinical consequences of major disagreements. Am J Surg Pathol 2008; 32 (5): 732–7. [DOI] [PubMed] [Google Scholar]
- 50. Robboy SJ, Weintraub S, Horvath AE, et al. Pathologist workforce in the United States: I. Development of a predictive model to examine factors influencing supply. Arch Pathol Lab Med 2013; 137 (12): 1723–32. [DOI] [PubMed] [Google Scholar]
- 51. Yu KH, Beam AL, Kohane IS.. Artificial intelligence in healthcare. Nat Biomed Eng 2018; 2 (10): 719–31. [DOI] [PubMed] [Google Scholar]
- 52. Pan SJ, Yang Q.. A survey on transfer learning. IEEE Trans Knowl Data Eng 2010; 22 (10): 1345–59. [Google Scholar]
- 53. LeCun Y, Bengio Y, Hinton G.. Deep learning. Nature 2015; 521 (7553): 436–44. [DOI] [PubMed] [Google Scholar]
- 54. Madabhushi A, Lee G.. Image analysis and machine learning in digital pathology: challenges and opportunities. Med Image Anal 2016; 33: 170–5. [DOI] [PMC free article] [PubMed] [Google Scholar]
- 55. O’Connor JP. Rethinking the role of clinical imaging. Elife 2017; 6:e30563. doi: 10.7554/eLife.30563 [DOI] [PMC free article] [PubMed] [Google Scholar]
- 56. Ronneberger O, Fischer P, Brox T.. U-net: convolutional networks for biomedical image segmentation In: International Conference on Medical Image Computing and Computer-assisted Intervention. Berlin, Germany: Springer; 2015: 234–41. [Google Scholar]
- 57. Goodfellow I, Pouget-Abadie J, Mirza M, et al. Generative adversarial networks. Adv Neural Inform Proc Syst 2014: 2672–80. [Google Scholar]
- 58. Gianfrancesco MA, Tamang S, Yazdany J, Schmajuk G.. Potential biases in machine learning algorithms using electronic health record data. JAMA Intern Med 2018; 178 (11): 1544–7. [DOI] [PMC free article] [PubMed] [Google Scholar]
- 59. Yu KH, Kohane IS.. Framing the challenges of artificial intelligence in medicine. BMJ Qual Saf 2019; 28 (3): 238–41. doi: 10.1136/bmjqs-2018-008551 [DOI] [PubMed] [Google Scholar]
- 60. Zugazagoitia J, Enguita AB, Nunez JA, Iglesias L, Ponce S.. The new IASLC/ATS/ERS lung adenocarcinoma classification from a clinical perspective: current concepts and future prospects. J Thorac Dis 2014; 6 Suppl 5: S526–36. [DOI] [PMC free article] [PubMed] [Google Scholar]
- 61. Pantanowitz L, Valenstein PN, Evans AJ, et al. Review of the current state of whole slide imaging in pathology. J Pathol Inform 2011; 2 (1): 36. [DOI] [PMC free article] [PubMed] [Google Scholar]
Associated Data
This section collects any data citations, data availability statements, or supplementary materials included in this article.