Abstract
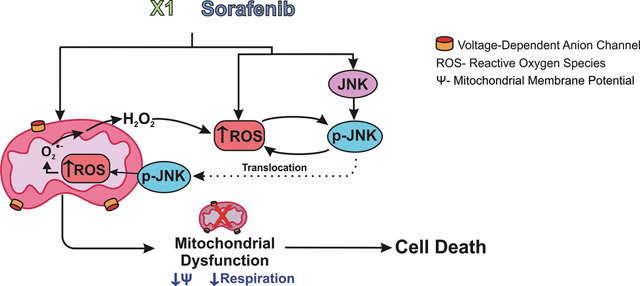
Opening of voltage dependent anion channels (VDAC) by the erastin-like compound X1 and the multikinase inhibitor sorafenib promotes oxidative stress and mitochondrial dysfunction in hepatocarcinoma cells. Here, we hypothesized that X1 and sorafenib induce mitochondrial dysfunction by increasing ROS formation and activating c-Jun N-terminal kinases (JNKs), leading to translocation of activated JNK to mitochondria. Both X1 and sorafenib increased production of reactive oxygen species (ROS) and activated JNK. X1 and sorafenib caused a drop in mitochondrial membrane potential (ΔΨ), a readout of mitochondrial metabolism, after 60 min. Mitochondrial depolarization after X1 and sorafenib occurred in parallel with JNK activation, increased superoxide (O2•−) production, decreased basal and oligomycin sensitive respiration, and decreased maximal respiratory capacity. Increased production of O2•− after X1 or sorafenib was abrogated by JNK inhibition and antioxidants. S3QEL specific inhibitor of site IIIQo, at Complex III prevented depolarization induced by X1. JNK inhibition by JNK inhibitors VIII and SP600125 also prevented mitochondrial depolarization. After X1, activated JNK translocated to mitochondria as assessed by proximity ligation assays. Tat-Sab KIM1, a peptide selectively preventing the binding of JNK the outer mitochondrial membrane protein Sab, blocked the depolarization induced by X1 and sorafenib. X1 promoted cell death mostly by necroptosis that was partially prevented by JNK inhibition. These results indicate that JNK activation and translocation to mitochondria is a common mechanism of mitochondrial dysfunction induced by both VDAC opening and sorafenib.
Keywords: Hepatocarcinoma, JNK, Mitochondria, Mitochondrial membrane potential, ROS, Sab, Sorafenib, VDAC
Graphical Abstract
1. INTRODUCTION
Hepatocellular carcinoma (HCC), the most common malignancy of the liver remains the second leading cause of cancer-related deaths (1). Chemotherapeutic options for advanced stages are limited and restricted to sorafenib (SOR) and most recently, lenvatinib (2, 3). For both drugs, the efficacy is poor (4, 5). SOR is a multikinase inhibitor that blocks signaling pathways relevant to tumor growth and angiogenesis including vascular endothelial growth factor receptors (VEGFR 1–3), platelet-derived growth factor-β (PDGF-β), the small GRP-binding protein Ras, the serine/threonine-specific protein kinases Raf, and the extracellular signal-regulated kinase ERK (6–8). Several reports have also shown effects of SOR on mitochondrial metabolism including dissipation of mitochondrial membrane potential (ΔΨ) and inhibition of ATP synthesis (9–13).
The bioenergetics of cancer cells is driven both by glycolysis and mitochondrial metabolism. The Warburg phenotype characterized by suppression of mitochondrial metabolism and enhanced aerobic glycolysis accounts for 20–90% of ATP formation in cancer cells (14, 15). Beyond differences in energy production, the current consensus is that the Warburg phenotype facilitates the generation of carbon backbones for the synthesis of biomass (lipids, peptides, and nucleic acids) to sustain cell growth (16–19). Although much research efforts has been directed to inhibit glycolysis as an anti-cancer strategy, in the last decade, mitochondrial metabolism has become a potential target for the development novel cancer treatments (20). Moreover, the metabolic flexibility of tumors, that switch between glycolytic and oxidative phenotypes depending on several factors including pharmacological interventions, opens new possibilities for developing drugs targeting mitochondria (20, 21).
The mostly anionic mitochondrial metabolites like respiratory substrates, ATP, ADP and Pi cross the mitochondrial outer membrane through a single pathway, the voltage dependent anion channel (VDAC), to then cross the inner membrane by a variety of individual carriers and transporters. Once in the mitochondrial matrix, respiratory substrates fuel the Krebs cycle generating the reducing equivalents, nicotinamide adenine dinucleotide (NADH) and flavin adenine dinucleotide (FADH2). Both NADH and FADH2 are oxidized in the electron transport chain (complexes I-IV) to the final acceptor molecular oxygen that is reduced to water (22). The flow of electrons at Complexes I, III, and IV generates protons that are pumped to the intermembrane space to produce a proton motive force (Δp = ΔΨ−59ΔpH), which is used by the ATP F1-FO synthase to generate ATP from ADP and Pi. ΔΨ, the main component of Δp, serves as a valuable readout of overall mitochondrial metabolism under different experimental conditions in intact cells.
Regulation of movement of respiratory substrates and other metabolites through VDAC globally controls mitochondrial metabolism. Thus, regulation of VDAC opening modulates mitochondrial metabolism and cellular bioenergetics (23, 24). Previously, we showed that free tubulin closes VDAC and decreases mitochondrial metabolism. We also demonstrated that erastin, a VDAC binding protein, blocks the inhibitory effect of tubulin on VDAC (25–27). More recently, in a high throughput screening of 50,000 small molecules, we identified a series of erastin-like compounds that increase mitochondrial metabolism and decrease glycolysis in HCC cells. The most potent erastin-like compound identified was the quinazolinone 5-chloro-N-[4-chloro-3-(trifluoromethyl) pheyl]-2-(ethylsulfonyl)-4-pyrimidinecarboxamide (X1) that first caused mitochondrial hyperpolarization and then mitochondrial dysfunction as assessed by the loss of ΔΨ and cell death in HCC cells. We tested the dose-response effect of X1 on mitochondrial membrane potential at 0, 3, 10 and 30 μM. The hyperpolarizing effect X1 was dose-dependent starting at 3 μM reaching a plateau at 10 μM. Exposures to X1 longer than an hour resulted in mitochondrial depolarization indicative of mitochondrial dysfunction (28). In addition, we evaluated the dose-dependent cell killing response to X1 in HepG2 and Huh7 cells at 0, 3, 10 and 100 μM. In both cell lines, cell killing was not evident at 3 μM and was almost maximal at 10 μM (29). In our study, we chose mitochondrial membrane potential as a main readout of mitochondrial dysfunction. As previously determined, mitochondrial dysfunction after X1 was dose and time dependent. Based on that evidence, we only used the small molecule X1 at 10 μM to maximize mitochondrial dysfunction in the cell lines studied here. A similar mitochondrial dysfunction has been reported for SOR (30). The mechanisms underlying mitochondrial dysfunction by both SOR and X1 remain unknown.
The c-Jun N-terminal kinases (JNKs) are last tier members of the mitogen activated protein kinases (MAPK) cascade. A variety of cellular and environmental stresses lead to phosphorylation of JNK (31). After activation by upstream MAPK kinases (MAPKKs), a sub-population of JNK translocates to mitochondria where it phosphorylates the mitochondrial membrane scaffold SH3 domain-binding protein 5 (Sab) (32). While interacting with the kinase interacting motif 1 (KIM1) of Sab, translocated p-JNK initiates a cascade of events including phosphorylation of Bcl-xL, release of cytochrome c from mitochondria, and suppression of respiration (33, 34).
Reactive oxygen species (ROS) activate JNK, an effect mainly mediated through the apoptosis signaling kinase 1 (ASK1), which is responsive to mitochondrial ROS (35). Also, JNK activation leads to increased mitochondrial ROS formation, making the JNK-activation/ROS formation a two-way self-amplifying mechanism to eventually cause mitochondrial dysfunction. The role of JNK activation in HCC cells treated with SOR is controversial, although it is proposed that SOR causes mitochondrial dysfunction through a ROS dependent mechanism upstream of JNK activation with the induction of ferroptosis (9). The precise role that JNK activation plays in mitochondrial dysfunction induced by SOR remains incompletely understood.
Here, we hypothesized that mitochondrial dysfunction induced by X1 and SOR is mediated by a common mechanism involving ROS formation and JNK activation. We showed that both X1 and SOR activated JNK and increased mitochondrial superoxide (O2•−) production before the onset of mitochondrial depolarization. The loss of ΔΨ was accompanied by a decrease in respiration. Mitochondrial dysfunction was prevented by JNK inhibition and by blocking subsequent JNK translocation to mitochondria. JNK inhibition also prevented ROS formation induced by X1 and SOR. We also found that mitochondrial dysfunction induced by X1 was followed by cell death. Therefore, the mechanism of action of both X1 and SOR involves a complex interplay of sustained JNK activation and mitochondrial superoxide O2•− production upstream of mitochondrial dysfunction and cell death.
2. MATERIAL & METHODS
2.1. Materials
Amplex Ultra Red, Annexin V, Alexa Fluor 488 conjugate, Hoechst 33342, and MitoSOX Red were purchased from Thermo Fisher Scientific (Waltham, MA); SP600125, JNK inhibitor VIII, N-acetyl-cysteine (NAC), propidium iodide (PI), tetramethylrhodamine methylester (TMRM), S3QEL 2 and Necrostatin-1 from Millipore Sigma (Burlington, MA); X1 (5-chloro-N[4-chloro-3-(trifluoromethyl)pheyl]-2-(ethylsulfonyl)-4-pyrimidinecarboxamide) from Chembridge Corporation (San Diego, CA); Tat-Sab peptide from NeoBiolab (Cambridge, MA) and SOR from Cayman Chemical (Ann Arbor, MI). Antibodies against p-JNK (Cat. # 9251) and SAPK/JNK antibodies were purchased from Cell Signaling Technology (Beverly, MA); β-actin (Cat. # sc-47778) and Tom20 (F-10) (Cat. # sc-17764) from Santa Cruz Biotechnology; horseradish peroxidase–conjugated secondary antibodies (Cat. # ab6721) from Abcam and Pierce Goat Anti-Mouse Poly-HRP (Cat. # QF218146) from Thermo Fisher Scientific). All other chemicals were analytical grade.
2.2. Cell Culture
HepG2 human hepatocarcinoma cells (Cat # HB-8065) were purchased from the American Tissue Culture Collection (ATCC) (Manassas, VA). Huh7 human hepatocarcinoma cells were the generous gift from Dr. Jack Wands, Brown University, Providence, RI. HepG2 cells were grown in Eagle’s minimum essential medium (EMEM) supplemented with 10% fetal bovine serum (FBS) premium (Atlanta Biologicals), 100 units/mL penicillin and 100 μg/mL streptomycin, and Huh7 cells were grown in EMEM with the addition of 1% 100X MEM Non-essential amino acids (Gibco, Cat # 11140–50). Both cell lines were maintained in 5% CO2/air at 37° C. Experiments were performed with cells at 70–80% confluency either in modified Hankś balanced salt solution (HBSS) containing (in mM): NaCl 137, Na2HPO4 0.35, KCl 5.4, KH2PO4 1, MgSO4 0.81, Ca2Cl 0.95, glucose 5.5, NaHCO3 25 and HEPES 20, pH 7.4, or complete growth media.
2.3. Western blotting
HepG2 and Huh7 cells were lysed in RIPA buffer containing 50 mM Tris, 150 mM NaCl, 1% sodium deoxycholate, 1 mM ethylene glycol, bis (2-aminoethyl ethyl) tetraacetic acid (EGTA), 0.1% sodium dodecyl sulfate 1% Triton X-100) pH 7.4, in the presence of protease and phosphatase inhibitors. Protein concentration was quantified with a bicinchoninic acid (BCA) protein assay kit (Thermo Fisher Scientific, Rockford, IL). Proteins were separated using 4–12% sodium dodecyl sulfate polyacrylamide gel electrophoresis (SDS-PAGE), transferred onto polyvinylidene difluoride membranes (Millipore Sigma, Burlington, MA) and blocked with 0.5% BSA for 1h. Blots were probed with antibodies against p-JNK (1:500, vol:vol) or total JNK (1:500, vol:vol) at 4°C overnight. Membranes were subsequently washed in Tris-buffered saline pH 7.4 with 0.1% Tween 20, and incubated with the corresponding horseradish peroxidase-conjugated secondary antibodies (1:5000 vol:vol) at room temperature for 1 h. Protein bands were detected using the Pierce ECL Western Blotting Substrate. Intensity of the bands normalized to β-tubulin was quantified using a LI-COR Odyssey Blot Imager (LI-COR Biosciences, Lincoln, Nebraska).
2.4. Confocal microscopy of tetramethylrhodamine methylester, annexin V and propidium iodide
HepG2 and Huh7 cells plated in Grenier Bio TC 4-chamber plates (Greiner-Bio-One, Monroe, NC) or 35 mm MatTek dishes (MatTek Corporation, Ashland, MA) were loaded with 200 nM TMRM for 30 min in modified HBSS. After washing, subsequent incubations were performed using 50 nM TMRM to maintain equilibrium distribution of the fluorophore (36). Cells incubated in modified HBSS in a humidified 5% CO2/air at 37° C were imaged with a Zeiss LSM 880 NLO inverted laser scanning confocal microscope (Thornwood, NY) with a 63X 1.4 N.A. plan apochromat oil immersion lens. TMRM was excited at 561 nm and emission signal was detected with a Quasar multichannel spectral detector at 590–610 nm through a one Airy unit diameter pinhole. TMRM intensities were quantified to make relative comparisons using Photoshop CS4 software (Adobe Systems, San Jose, CA) as previously described (22, 27). A minimum of 4 randomly selected fields with 8–20 cells per field were imaged during the time course of 3 independent experiments for all microscopy experiments.
For cell death imaging, cells were loaded with Hoescht (0.5 μg/ml), annexin V (1:150, vol:vol) and propidium iodide (PI) (30 μM) in HBSS for the duration of the experiment. Hoescht was excited at 405 nm and detected at 426–440 nm; annexin V was excited at 488 nm and detected at 493–584 nm, whereas PI was excited at 561 nm and detected at 595–718 nm.
Fluorescent polystyrene microspheres (4 μm) (MultiSpeck Multispectral Fluorescence Microscopy Standards Kit M-7901, Molecular Probes, Invitrogen, Carlsbad, CA) were used as fiducial markers. Microspheres diluted in HBSS were added to TMRM loaded cells at a final concentration of 30,000 microspheres/ml (27). Images were taken after sedimentation of the microspheres.
2.5. Measurement of superoxide production
To assess mitochondrial superoxide production, we loaded cells with MitoSOX Red (2.5 μM) for 5 min in modified HBSS before washing out. MitoSOX Red was excited in cells maintained in HBSS using a 488-nm laser. Emission was measured at 560–600 nm. At least 4 fields with 8–10 cells per field were imaged during the time course of 3 independent experiments. Quantification of MitoSOX relative fluorescence was assessed as described for TMRM using Photoshop CS4.
2.6. Proximity ligation assay (PLA)
Cells were grown on 10-well chamber slides (Ibidi, Fitchburg, WI) for 48 h. PLA was performed with Duolink® In Situ Detection Reagents Far Red (Sigma Aldrich) following the manufacturer’s instructions. Cells were treated with primary antibodies anti-pJNK (Cell Signaling Technology, 1:100, rabbit) and anti-TOM20 (Santa Cruz,1:100, mouse). For negative control experiments only one antibody at a time was incubated with the PLA probes. Slides were mounted using Duolink in situ Mounting Medium containing DAPI. Images were taken using a Zeiss LSM 880 confocal microscope. Proximity ligation assay z-stacks were captured with sections spanning entire cells. Zeiss software Blue edition was used to obtain maximum intensity projections and cross-sections of the confocal images. The threshold was set automatically using ImageJ 3D Objects Counter for each image and kept constant within each set of experiment. Quantification of signals (number of dots per cell) was obtained after thresholding using ImageJ. The number of puncta was normalized to vehicle. 4 z-stack images per experimental conditions were analyzed.
2.7. Respirometric assay
Oxygen consumption rates (OCR) and extracellular acidification rates (ECAR) were measured using a Seahorse XF96 analyzer (Agilent Technologies, Santa Clara, CA, USA) and calculated from the continuous average slope of the O2 partitioning among plastic, atmosphere, and cellular uptake (37, 38). Huh7 cells (18,000 in XF 96 well microplates were maintained in growth media and treated 48 h after plating. Experiments were performed in 200 μL/well of a buffer containing (in mM): L-glutamine 4, D-Glucose 10, sodium pyruvate 1, CaCl2 0.036, MgCl2 0.06, KH2PO4 0.05, KCl 0.54, Na2HPO4 heptahydrate 0.05, HEPES 2 and NaCl 13 (pH: 7.4). Microplates and sensor cartridges were kept in an air incubator for 1 h before starting the experiments. Basal, oligomycin sensitive, and maximal respiratory capacity were determined after sequential addition of OLIGO (1μM), FCCP (1 μM), and rotenone (2 μM) + antimycin A (2 μM), respectively.
2.8. Cell Viability
The PI cell killing assay was done as described before (29, 39). Briefly, cells plated in a 4-well plate format were incubated in HBSS with PI (30 μM) for 30 min. PI was excited at 530 nm (25 nm band pass) with emission collected at 590 nm (40 nm band pass) using a Novostar plate reader (BMG LABTECH GmbH, Offenburg, Germany). After baseline (A), PI fluorescence was measured every hour (X). To avoid temperature fluctuations, plates were placed in 5 % CO2/air at 37° C between measurements. At the end of the experiments, digitonin (100 μM) was added to label all the nuclei with PI and a final fluorescence reading was collected after 20 min (B). Percentage of dead cells (D) was calculated as D=100(X-A)/(B-A).
2.9. Statistics
Statistic differences between groups were analyzed by the Student’s t-test using p < 0.05 as the criterion of significance. Data points are the means ± S.E. of 3–5 independent experiments. Images in figures are representative of three or more independent experiments unless otherwise stated.
3. RESULTS
3.1. X1 and sorafenib depolarize mitochondria in hepatocarcinoma cells
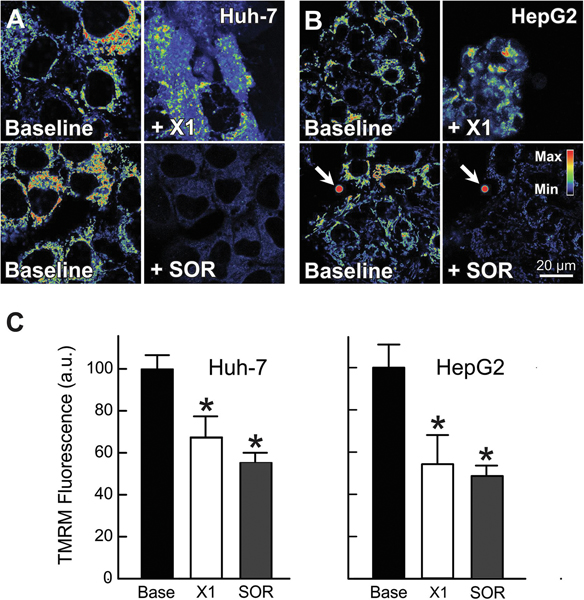
Previously, we showed that erastin and the erastin-like-Warburg compound X1 promoted mitochondrial hyperpolarization followed by depolarization (29). Recently, a drop in mitochondrial ΔΨ in HepG2 cells has also been reported after treatment with SOR (40). Here, we assessed by confocal microscopy the effect of X1 and SOR on mitochondrial ΔΨ in HepG2 and Huh7 cells using the cationic ΔΨ fluorophore, TMRM. Mitochondria of untreated cells or after vehicle were filamentous, heterogeneously polarized, and distributed throughout the cytoplasm as described previously (26, 29). X1 (10 μM) decreased mitochondrial ΔΨ by ~30% and ~43% in Huh7 and HepG2 respectively. Similarly, SOR (3 μM) depolarized mitochondria ΔΨ by ~42% in Huh7 and by ~47% in HepG2 cells (Fig. 1 A-C). These results confirm that both X1 and SOR cause mitochondrial dysfunction in human hepatocarcinoma cells.
Figure 1: X1 and sorafenib depolarize mitochondria.
Huh7 (A) and HepG2 cells (B) incubated in HBSS were loaded with TMRM, as described in MATERIAL &METHODS. Cells (Same field) were imaged before (Baseline) (A and B, right panels) and after treatment with X1 (10 μM, A and B, upper right) or sorafenib (3.5 μM) (A and B, lower right) for 1 h. Fluorescent polystyrene microspheres were used as fiduciary markers (arrows). Image intensity was pseudocolored according to the reference bar. In (C), TMRM fluorescence was quantified after X1 and sorafenib treatments compared to vehicle. *p<0.05 from 3 independent experiments.
3.2. X1 and sorafenib decrease respiration
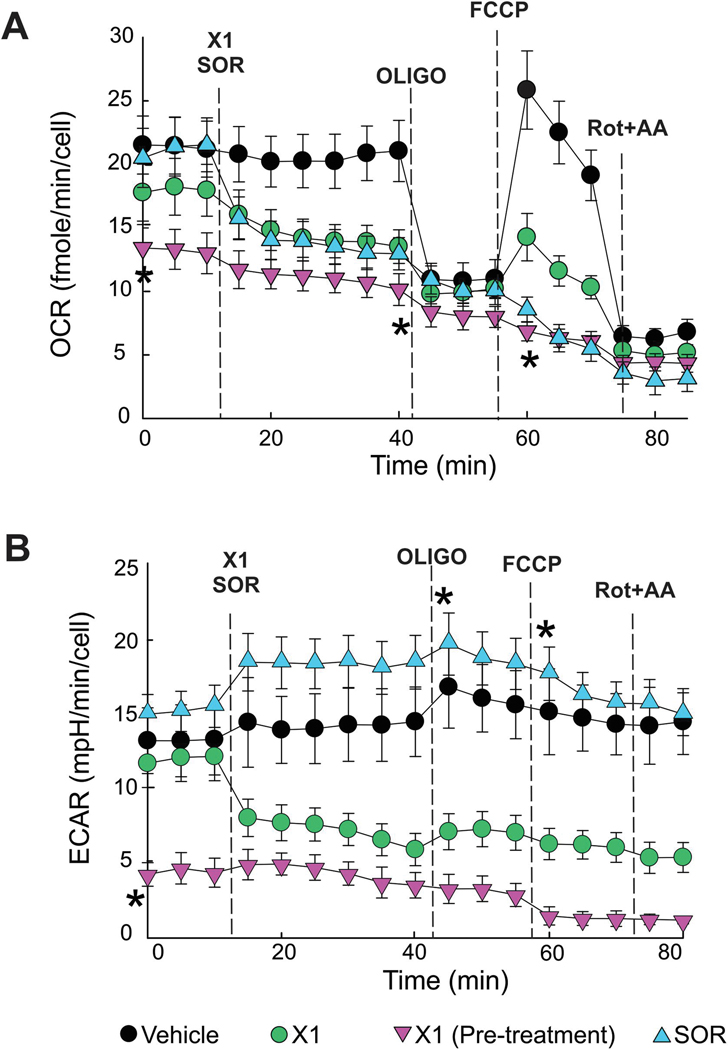
The effects of X1 and SOR on respiration (assessed as oxygen consumption rate) in Huh7 cells was determined using a Seahorse XF96 extracellular flux analyzer. Cells were treated with vehicle (VEH), X1 (10 μM) for 30 and 60 min, or SOR (5 μM) for 30 min. SOR and X1 at 30 min decreased basal respiration by ~39% and 41%, respectively (Fig. 2 A). Longer exposure to X1 (60 min) decreased basal respiration by ~64%. Subsequent addition of OLIGO (1 μM), an ATP synthase inhibitor, decreased oxygen consumption (Δ= OCR before-OCR after OLIGO) by ~50% after VEH, by ~29%, and 23% after X1 and SOR for 30 min and by ~8% in cells treated with X1 for 60 min. Both X1 and SOR at 30 min decreased the maximal respiration induced by the uncoupler FCCP, whereas 60 min treatment with X1 completely blocked uncoupled respiration. Taken together these findings indicate an inhibitory effect of X1 and SOR on oxidative phosphorylation that is maximal after longer exposures to X1 (Fig. 2A.). X1 also decreased ECAR by ~60%, suggesting an inhibitory effect on glycolysis (Fig. 2 B). By contrast, SOR slightly increased ECAR (~ 12%) suggesting a compensatory increase in glycolysis (Fig 2 B).
Figure 2: X1 and sorafenib decrease cellular respiration.
Oxygen consumption rates after X1 (10 μM) and SOR (5 μM) were determined using a Seahorse XF96 analyzer. In (A), basal respiration, oligomycin-sensitive respiration and maximal respiration in Huh7 cells treated with X1 for 30 min or pretreated with X1 for 60 min, and SOR for 30 min or VEH. In (B), extracellular acidification rates under the same experimental conditions described in A. *, p < 0.05 vs. baseline from 3 independent experiments.
3.3. X1 and sorafenib activate JNK
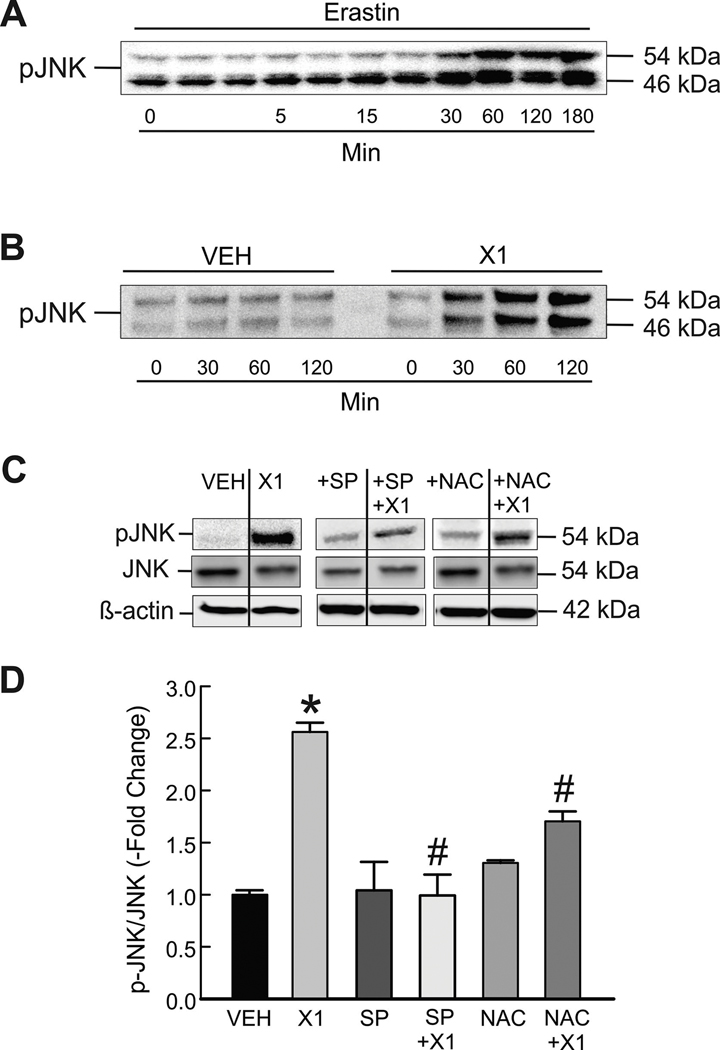
In previous work, we showed that X1 and the VDAC-binding small molecule erastin induce ROS production in HepG2 and Huh7 cells (29). Others report that p-JNK promotes ROS production and that increased ROS activates JNK (35, 41). Activation of JNK by SOR has also been described recently (42, 43). Accordingly, to determine if erastin and X1 activate JNK we treated HepG2 cells with erastin (10 μM) and Huh7 cells X1 (10 μM) and determined p-JNK by Western blot. p-JNK progressively increased both after erastin and X1, reaching maximal levels (~2.6-fold increase) within 30–60 min in both cell lines. Maximal activation of JNK occurred within 60 min remained unchanged after erastin and X1 up to 3 h (Fig. 3 A and B, and not shown). JNK inhibition by SP600125 almost completely blocked the increases of p-JNK without affecting total JNK (Fig. 3 C and D). To ROS production was promoting JNK activation after X1, we pretreated cells with N-acetyl cysteine (NAC), a glutathione precursor and ROS scavenger. Similar to JNK inhibition, NAC partially prevented JNK activation compared to X1 alone (Fig. 3 C-D). Our results indicate that, in addition to increasing ROS formation, X1 induces phosphorylation of JNK in a time dependent manner.
Figure 3: X1 induces JNK activation.
Cells in whole media were treated with erastin (10 μM) for 3 h (A, HepG2 cells) or X1 for 2 h (10 μM) (B, Huh7 cells). Proteins were extracted at progressive time points, and Western blotting for p-JNK were performed, as described in MATERIAL &METHODS. In (C), Huh7 cells were treated with X1 (10 μM) for 30 min with and without pretreatment with SP600125 (30 μM) for 1 h or NAC (100 μM) for 30 min before immunoblotting for pJNK, total JNK and β-actin as a loading control. In (D), pJNK/JNK was determined by densitometry and plotted. *p<0.05 vs vehicle, #p<0.05 vs X1 from 3 independent experiments. SP: SP600125; NAC: N-acetyl cysteine.
3.4. JNK inhibition prevents mitochondrial depolarization induced by X1 and sorafenib
To determine if mitochondrial depolarization induced by X1 and SOR was dependent on JNK activation, we pretreated HepG2 and Huh7 cells with two structurally unrelated JNK inhibitors, JNK inhibitor VIII (5 μM) and SP600125 (30 μM). Both JNK inhibitors completely abrogated mitochondrial depolarization induced by X1 in Huh7 and HepG2 cells. In Huh7 cells pretreated with SP600125 or JNK inhibitor VIII, mitochondrial ΔΨ remained unchanged or slightly increased after X1 whereas X1 alone decreased mitochondrial ΔΨ by ~47% (Fig. 4 A and B). Similarly, JNK inhibition blocked X1-dependent mitochondrial depolarization in HepG2 cells (not shown).
Figure 4: JNK inhibition prevents mitochondrial dysfunction induced by X1.
Huh7 cells incubated in HBSS were loaded with TMRM, as described in MATERIAL &METHODS. In (A), images were collected before (left panels) and after addition of X1 (10 μM) for 1 h (upper right) with and without 1 h pretreatment with SP600125 (30 μM) or JNK inhibitor VIII (5 μM), as indicated. Image intensity was pseudocolored according to the reference bar. In (B), TMRM fluorescence was quantified after the various treatments. *p<0.05 vs vehicle, #p<0.05 vs X1 from at least 3 independent experiments. SP: SP600125; VIII: JNK inhibitor VIII.
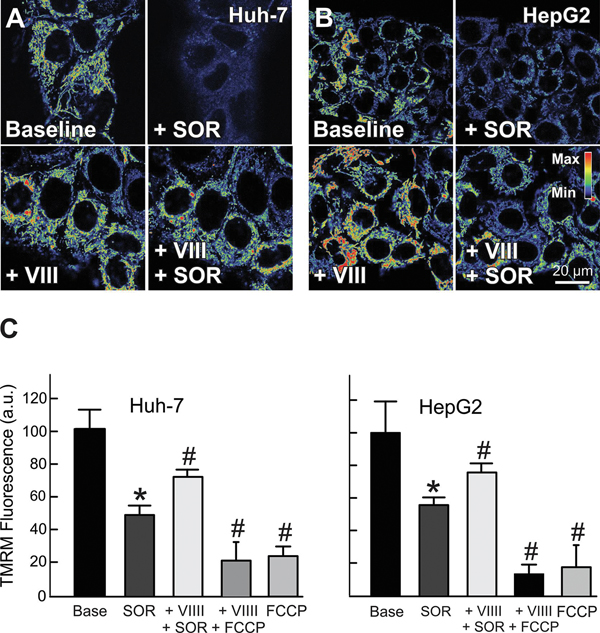
Since both X1 and SOR depolarize mitochondria and increase ROS generation, we also assessed the effect of JNK inhibition on mitochondrial ΔΨ after SOR. Similar to X1, pretreatment with JNK inhibitor VIII prevented mitochondrial depolarization induced by SOR both in Huh7 and HepG2 cells (Fig. 5 A-C). Our findings show that mitochondrial dysfunction after both X1 and SOR are mediated by JNK activation.
Figure 5: JNK inhibition attenuates mitochondrial dysfunction induced by sorafenib.
Huh7 and HepG2 cells incubated in HBSS were loaded with TMRM, as described in MATERIAL &METHODS. Images were collected before (A and B, upper left panels) and after sorafenib (3.5 μM) for 30 min (A and B, upper right panels). In separate experiments, cells were imaged after pretreatment with JNK inhibitor VIII (5 μM) for 1 h (A and B, left lower panels) and re-imaged after treatment with sorafenib (3.5 μM) (A and B, lower right panels), or FCCP (1 μM) as a negative control. Image intensity was pseudocolored according to the reference bar. In (C), TMRM fluorescence was quantified compared to vehicle for Huh7 and HepG2 cells.*p<0.05 vs. vehicle, #p<0.05 vs SOR from 3 independent experiments.
3.5. JNK mediates superoxide production induced by X1 and sorafenib
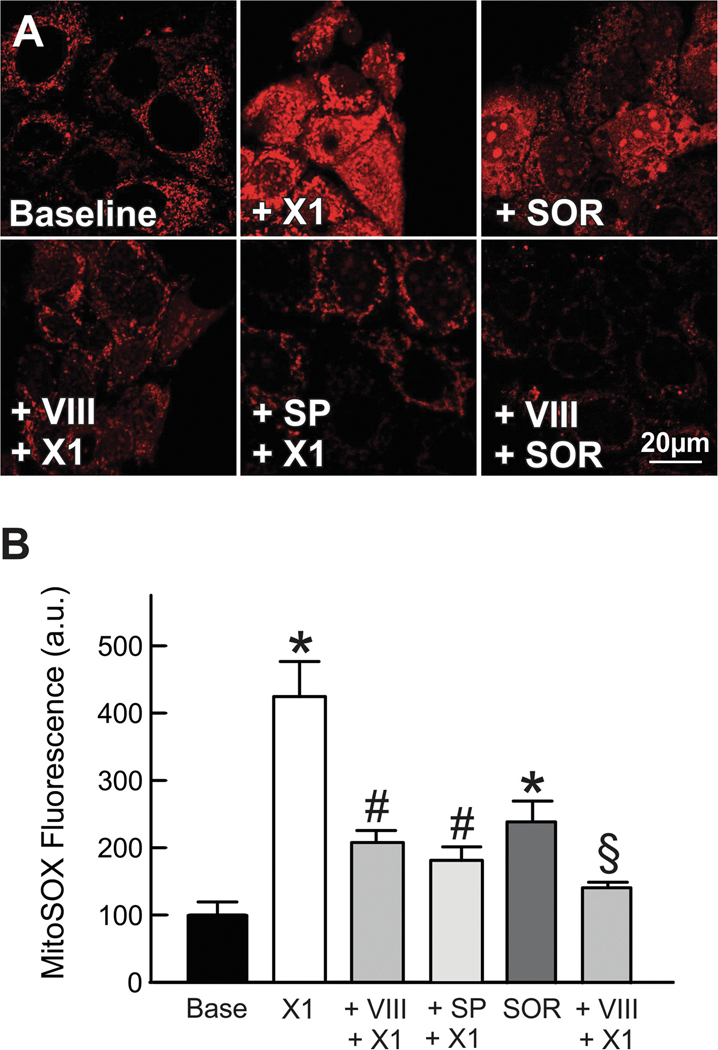
Mitochondria are the major site of generation of O2•− mainly at complexes I and III (site IIIQo) (44). It has been proposed that O2•− formed at site IIIQo is released equally to each side of the mitochondrial inner membrane. O2•− released to the cytosol activates members of the MAPK family of serine/threonine kinases, especially JNKs. To assess whether O2•− formation depends on JNK activation we pretreated cells with JNK inhibitor VIII (5 μM) or SP600125 (30 μM) before adding X1 or JNK inhibitor VIII (5 μM) before SOR in cells loaded with the mitochondrial O2•− indicator MitoSOX Red. X1 or SOR alone increased MitoSOX Red fluorescence by ~340% and by ~130% respectively. JNKVIII and SP600125 blocked X1-dependent increase in MitoSOX Red fluorescence after X1 whereas JNK VIII prevented the increase in fluorescence after SOR (Fig. 6 A and B). These experiments show that activated JNK mediates enhanced mitochondrial O2•− production induced by X1 and SOR.
Figure 6: JNK inhibition blocks superoxide production induced by X1 and sorafenib.
Huh7 cells incubated in HBSS were loaded with MitoSOX Red, as described in MATERIAL &METHODS. Images were collected after addition of vehicle (Untreated), X1 (10 μM) and sorafenib (3.5 μM), for 1 h and 30 min, respectively, in absence (upper panels) and presence (lower panels) of SP600125 (30 μM) or JNK inhibitor VIII (5 μM) added 1 h before X1 or sorafenib. In B, MitoSOX Red relative fluorescence was quantified after treatments as compared to vehicle. *p<0.05 vs vehicle, #p<0.05 vs X1, §p<0.05 vs sorafenib from 3 independent experiments.
3.6. X1 induces superoxide production at complex III
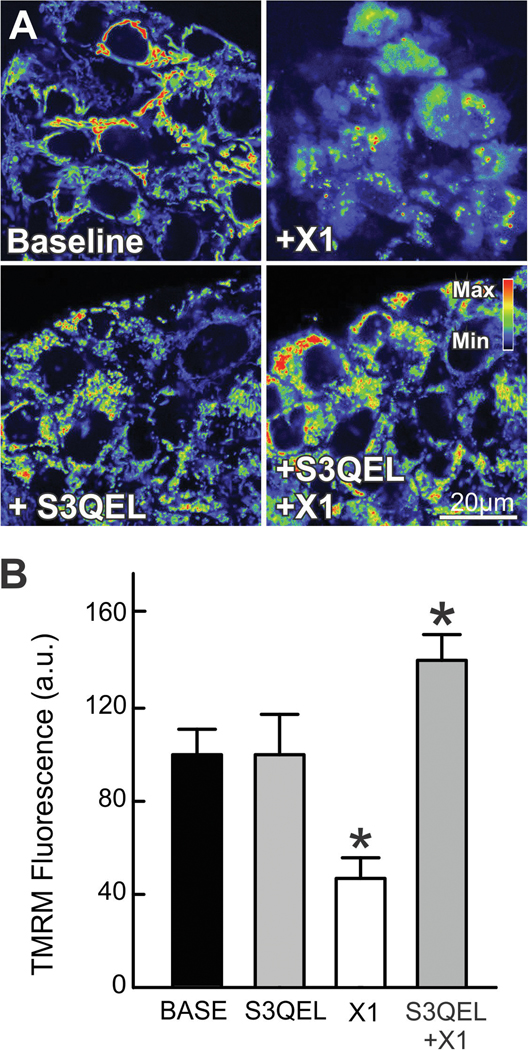
To determine major source(s) of ROS formation promoted by X1, we used a combination of quantitative analysis of O2•−/H2O2 production at complex III and confocal imaging of TMRM fluorescence in the presence of the specific suppressor of site IIIQo electron leak, S3QEL 2. S3QELs are small molecules that specifically suppress production of O2•− from site IIIQo without inhibiting oxidative phosphorylation (45). X1 increased the rate of formation of O2•−/H2O2 at complex III by ~22% compared to vehicle in permeabilized Huh7 cells respiring on 5 mM succinate in an Amplex Ultra Red assay using specific inhibitors of site IIIQo (antimycin A and Rotenone). The relatively modest increase in the rate of O2•−/H2O2 formation (7.7 fmole/min/1,000 cells) is very likely enough to sustain the comparatively higher increase in O2•− accumulated after X1 as determined by MitoSOX fluorescence 60 min after treatment (Fig. 7-A and B). The specific role of site III in the loss of ΔΨ induced by X1 was confirmed by pretreatment with S3QEL 2 (30 μM) that prevented mitochondrial depolarization but not hyperpolarization after X1 (Fig 7 A and B). These results indicate that ROS generated at site IIIQo are important determinants of mitochondrial dysfunction induced by X1 but do not mediate the initial hyperpolarization after X1.
Figure 7: S3QEL 2 attenuates mitochondrial dysfunction by X1.
HepG2 cells incubated in HBSS were loaded with TMRM, as described in MATERIAL &METHODS. In (A), images were collected before (left panels) addition of X1 for 1 h (10 μM, right panels) with and without 30 min pretreatment with S3QEL 2 (30 μM, lower panels). In (B), TMRM relative fluorescence was quantified after the various treatments. *p<0.05 vs vehicle from at least 3 independent experiments.
3.7. JNK translocate to mitochondria in the presence of X1 and sorafenib
Mitochondrial JNK signaling depends on the translocation of JNK to the mitochondrial outer membrane where it docks on the SH3 homology associated BTK binding protein (Sab). Mitochondrial translocation of JNK has been described in several models of liver injury, oxidative stress, anisomycin-induced stress and cerebral ischemia among others (35). To assess whether X1 promoted the translocation of p-JNK to mitochondria we used a proximity ligation assay targeting p-JNK and the resident translocase of mitochondrial outer membrane TOM20. X1 progressively increased the translocation of p-JNK to mitochondria as shown by the increase in the number of dots reflecting the increased number of p-JNK/TOM20 associations (Figure 8 A and B). To confirm the specificity of the effect of X1 on JNK relocation, we utilized the cell-permeable peptide Tat-sab KIM1 that targets the outer mitochondrial membrane protein, Sab (46). Tat-sab KIM1 selectively prevents JNK binding to Sab without affecting c-jun phosphorylation. Pre-treatment with Tat-sab KIM1 (30 μM) before X1 markedly decreased the number of dots indicative of the inhibitory effect on JNK translocation.
Figure 8: Translocation of JNK-dependent mitochondrial dysfunction is prevented by Tat-sab KIM1 peptide.
In (A), Proximity ligation assay. Cells were treated with X1 (10 μM) for 30 min and 60 min. Red dots indicate proximity of p-JNK and TOM20 (distance between the two proteins < 40 nm). Nuclei stained with DAPI (blue). In (B) The number of dots/cell were quantitated counting a minimum of 200 cells/experimental condition. Error bars represent ±SEM from three independent experiments, *p<0.05 vs vehicle. Scale bar, 20 μm. In (C and D), Huh7 cells incubated in HBSS were loaded with TMRM, as described in MATERIAL &METHODS. (C), cells were pretreated with Tat-sab KIM1 peptide (30 μM) for 1 h before treatment with X1 (10 μM) (upper panels) or sorafenib (5 μM) (lower panels). Image intensity was pseudocolored according to the reference bar. In (D), TMRM fluorescence was quantified after the various treatments compared to vehicle. *p<0.05 vs vehicle, #p<0.05 vs X1, §p<0.05 vs sorafenib from 3 independent experiments.
To demonstrate that the loss of mitochondrial ΔΨ induced by X1 or SOR not only requires JNK activation but also JNK translocation to mitochondria and binding to Sab we pretreated cells with the Tat-sab KIM1 peptide (30 μM). Tat-sab KIM1 prevented X1 and SOR-induced loss of ΔΨ but not mitochondrial hyperpolarization after X1 similar to the effect of JNK inhibition (Fig. 8 C and D). These results indicate that mitochondrial dysfunction after X1 and SOR depended both on JNK activation and translocation to mitochondria and binding to SH3BP5.
3.8. X1 promotes cell death by necroptosis
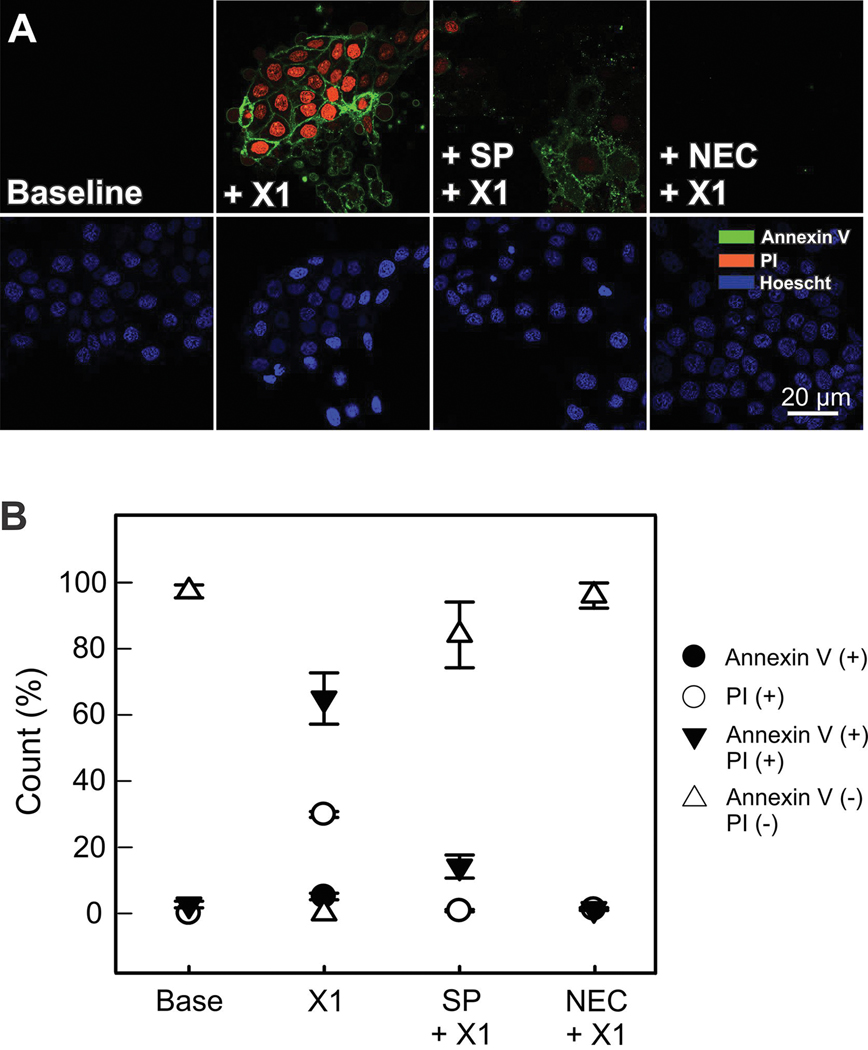
It has been reported that SOR promotes cell killing by apoptosis (47). To determine the mechanism of cell death after X1 we loaded cells with annexin V as a marker of apoptosis and propidium iodide (PI) as an indicator for the loss of integrity of the plasma membrane that occurs in necrotic cell death. Annexin V (+) and PI (+) labeling progressively increased 2 h after X1 (10 μM) reaching 100% of the cells 6 h after treatment. Between 3 and 6 h after X1 cells were either Annexin V (+), PI (+) or Annexin V+PI (+) suggesting that cells were undergoing necrosis and apoptosis. To determine if apoptosis was followed by necrosis or the main cause of cell death was necroptosis, in separate experiments, we inhibited the RIP1 kinase with necrostatin-1. Inhibition of RIP-1 kinase blocked X1 induced cell death indicating that necroptosis may be the major mechanism of cell killing (Fig. 9 A and B).
Figure 9: X1 induces JNK-dependent necroptosis.
In (A), Huh7 cells were treated with X1 (10 μM) with and without pretreatment with SP600125 (30 μM) for 1 h or necrostatin (NEC-1, 30 μM) for 24 h. Annexin V and propidium iodide fluorescence was assessed as described in MATERIAL &METHODS (In B, percentages of annexin V (+), PI (+) and annexin V+PI (+) were determined (Panel B).
3.9. X1-dependent cell death is partially mediated by JNK
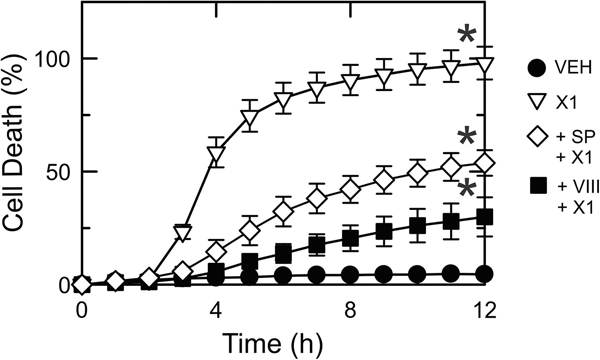
Both SOR and X1 have been shown to be cytotoxic for HepG2 and other hepatocarcinoma cells in culture (13, 28, 29, 48). To determine if cell death after X1 was dependent on JNK activation we assessed cell viability by PI fluorometry after X1 in the presence or absence of JNK inhibitors. X1 caused ~95% cell death after 6 h whereas in cells pretreated with JNK inhibitor VIII (5 μM) and SP600125 (30 μM) X1-induced cell death was ~25% and ~50% respectively (Fig. 10).
Figure 10: JNK inhibition decreases cell death after X1.
Huh7 cells were treated with vehicle (VEH), X1 alone (10 μM) or after X1 plus pretreatment with SP600125 (30 μM) or VIII (5 μM) for 1 h. Cell death was assessed by PI fluorometry, as described in MATERIAL &METHODS. SP: SP600125; VIII: JNK inhibitor VIII.
4. DISCUSSION
Characterization of mechanisms of action of novel and existing chemotherapeutic drugs helps to identify new targets and improve the efficacy of cancer treatments. We previously showed that the antagonism of the inhibitory effect of tubulin on VDAC by erastin and erastin-like compounds increases ROS formation and promotes mitochondrial dysfunction. VDAC-tubulin antagonists are a potential new class of chemotherapeutic agents inducing cancer cell death by switching the Warburg metabolic phenotype to more oxidative metabolism that, in turn, promotes oxidative stress (28, 29). Here, we show a common mechanism of action for the erastin-like small molecule X1 and SOR that involves JNK and mitochondria.
Mitochondrial ΔΨ is a readout of overall mitochondrial metabolism. X1 and SOR both depolarize mitochondria, but the mechanisms underlying the drop in ΔΨ are incompletely understood (10, 12, 49, 50). At low micromolar range, SOR directly inhibits complexes I, II, III and V and promotes glycolysis (50, 51). The impairment of mitochondrial metabolism after X1 and SOR was further confirmed by assessing changes in respiration. At time points matching mitochondrial depolarization, both X1 and SOR decreased basal respiration and oligomycin sensitive respiration indicating an inhibitory effect on oxidative phosphorylation. Moreover, the abrogated response to uncoupling after X1 and SOR suggests a severe limitation to mitochondrial function induced by these two compounds (Fig 2 A). The blockage of oxygen consumption despite uncoupling from OXPHOS suggests decreased activity of the proton pumping complexes of the ETC as electrons are likely leaking more slowly to oxygen, increasing ROS formation. In addition, X1 also decreased ECAR suggesting an inhibitory effect of glycolysis (Fig 2 B).
Among different mechanisms upstream of mitochondria, JNK-phosphorylation is shown to disrupt mitochondrial function (35). Here, we showed that X1 progressively increased p-JNK reaching a plateau within ~60 min in Huh7 cells. Similar pattern was observed in HepG2 cells (Fig. 2). Moreover, inhibition of JNK by JNK inhibitors VIII or SP600125 prevented mitochondrial depolarization. Taken together, these results showed that activation of JNK was a necessary step in the mitochondrial dysfunction after X1 or SOR. Interestingly, JNK inhibition did not prevent mitochondrial hyperpolarization after X1 suggesting that mitochondria remain functional during the initial hyperpolarization after X1. A hyperpolarizing phase preceding mitochondrial depolarization has not been observed after SOR.
Different cellular models have shown that activated JNK translocates to mitochondria and phosphorylates Sab blocking electron transport at Complex I or II, promoting ROS formation and decreasing OXPHOS (33). Here, we demonstrated that X1 induced p-JNK translocation to mitochondria and the Tat-sab KIM1 blocks the translocation (Fig. 8). Moreover, Tat-sab KIM1 by preventing the onset of mitochondrial depolarization induced by X1 confirms that JNK translocation to mitochondria is a necessary step in the pathogenesis of the mitochondrial dysfunction.
ROS and JNK are reciprocally dependent, since increased ROS formation leads to activation of JNK and activation of JNK leads to increased ROS formation (52). Previously, we showed that mitochondrial hyperpolarization induced by X1 was followed by increased mitochondrial ROS generation (29). Similarly, oxidative stress induced by SOR is extensively documented (48, 53). Here, we showed that both SOR and X1 induced robust increases (> 4 –fold) of O2•− production in HepG2 and Huh7 cells (Fig 6). It is likely that both activation of JNK and increased ROS formation occur simultaneously after X1 and are not part of a sequence of upstream/downstream events. This observation is supported by the fact that, in the presence of X1, antioxidants block JNK activation (Fig. 3) and JNK inhibition prevents superoxide formation (Fig. 6).
O2•−, converted to H2O2 by the superoxide dismutases, is mainly produced in mitochondria. The outer quinone-binding site in Complex III (site IIIQo) generates O2•− distributed about equally to each side of the mitochondrial inner membrane whereas other sites like the quinone-binding site in complex I (site IQ) generates O2•−/H2O2 to the mitochondrial matrix (54, 55). Thus, a large portion of O2•− generated at site IIIQo is released to the cytosol where it activates JNK among other effects (44, 45). While O2•− production induced by SOR is well established, the site of production of O2•− after X1 has not been determined. Previously, we showed that X1 increases mitochondrial ROS formation without identifying mitochondrial sites of O2•− generation. To determine major mitochondrial sites of ROS formation after X1 and SOR we used a two-pronged approach. We assessed quantitatively the rate of O2•−/H2O2 at site III and we used S3QEL2, a compound that specifically inhibits O2•− production at site IIIQo. S3QEL2 does not alter oxidative phosphorylation and maintains respiration without promoting a redistribution of electrons to other ROS generating sites in the electron transport chain. Thus, S3QEL2 allows a specific assessment of the contribution of IIIQo to O2•− formation. The increased rate of O2•−/H2O2 formation at site III and the blockage of mitochondrial depolarization after X1 in cells pretreated with S3QEL2 indicate that site IIIQo is a major contributor of O2•− to drive cytosolic JNK activation and subsequent mitochondrial depolarization induced by X1 (Fig. 7).
Persistent JNK activation is associated with cell death signaling. SOR induces apoptotic cell death but the mechanism of cell death after VDAC opening had not been determined (56, 57). After X1, simultaneous uptake of annexin V and PI occurred ~6 h after X1 in 100% of cells indicating necrosis (Fig 9 and 10). Necrostatin-1 completely blocked X1-induced annexin V staining and PI uptake signifying that X1 may be inducing a mode of programmed necrosis called necroptosis (58). Increased ROS formation has been reported also to cause necroptosis in different cancer cell lines including HCT116 and HT29 (59, 60). Here, JNK inhibition partially prevented cell death after X1, suggesting mitochondrial dysfunction promoted by JNK is an important driver of necroptosis (Fig. 9).
Although the mechanism of promoting cell death by the erastin-like X1 and erastin may be similar, the relevance of the specific VDAC isoforms in X1 induced cell death remains unexplored. Studies on different cellular systems have shown that VDAC1 may be a pro-survival protein whereas VDAC2 would favor apoptosis (61). The small molecule erastin promotes cell death by an oxidative, non-apoptotic mechanism in cancer cells harboring HRAS, KRAS or BRAF mutations. The lethality of erastin depends on the presence of VDAC 2 or VDAC 3 (62). More recently, a synthetic lethality study also showed that a small molecule targeting KRAS-expressing cancer cells promotes ROS-dependent apoptosis (63). The role of VDAC isoforms in erastin and erastin-like induced cell death and the potential link to RAS mutations is incompletely understood and will be eventually part of future investigations about the effects of X1.
In summary, our data showed that X1 and SOR induced persistent activation of JNK and subsequent JNK translocation to mitochondria, leading to increased O2•− formation and mitochondrial dysfunction in HepG2 and Huh7 cells. JNK inhibition prevented O2•− generation induced by both X1 and SOR and also attenuated subsequent necroptosis. Therefore, the mechanism of action of X1 and SOR likely involves a positive feedback loop of: sustained JNK activation, translocation to mitochondria, and O2•−/H2O2 production upstream of mitochondrial dysfunction and cell death.
ACKNOWLEDGMENTS
This work was supported, in part, by the U.S. National Institutes of Health (NIH) National Cancer Institute (NCI) Grant RO1 CA184456 and NIH National Institute of General Medical Sciences Grant P20 GM103542 [Centers of Biomedical Research Excellence (COBRE) Investigator] to E.N.M., and an NCI Administrative Supplement (R01CA184456-02) to M.E.M. We thank the Cell and Molecular Imaging Shared Resource and the Medical University of South Carolina (MUSC) Bioenergetic Profiling Core Facility for their technical support. These cores are supported in part by the South Carolina COBRE in Oxidants, Redox Balance, and Stress Signaling (NIH National Institute of General Medical Sciences Grant P20 GM103542).
NONSTANDARD ABBREVIATIONS
- ΔΨ
mitochondrial membrane potential
- ERK
extracellular signal-regulated kinase
- Tat-sabKIM1
Tat-sab peptide
- PDGF-β
platelet-derived growth factor-β
- PI
propidium iodide
- Sab
SH3 domain-binding protein 5
- SOR
sorafenib
- VDAC
Voltage-dependent anion channel
- VEGFR
vascular endothelial growth factor receptors
Footnotes
The authors declare no conflict of interest.
Publisher's Disclaimer: This is a PDF file of an unedited manuscript that has been accepted for publication. As a service to our customers we are providing this early version of the manuscript. The manuscript will undergo copyediting, typesetting, and review of the resulting proof before it is published in its final form. Please note that during the production process errors may be discovered which could affect the content, and all legal disclaimers that apply to the journal pertain.
REFERENCES
- 1.Wrighton PJ, Oderberg IM, Goessling W. There’s Something Fishy About Liver Cancer: Zebrafish Models of Hepatocellular Carcinoma. Cell Mol Gastroenterol Hepatol. 2019. doi: 10.1016/j.jcmgh.2019.05.002. [DOI] [PMC free article] [PubMed] [Google Scholar]
- 2.Lee JG, Kang CM, Park JS, Kim KS, Yoon DS, Choi JS, Lee WJ, Kim BR. The actual five-year survival rate of hepatocellular carcinoma patients after curative resection. Yonsei Med J. 2006;47(1):105–12. doi: 10.3349/ymj.2006.47.1.105. [DOI] [PMC free article] [PubMed] [Google Scholar]
- 3.Golabi P, Fazel S, Otgonsuren M, Sayiner M, Locklear CT, Younossi ZM. Mortality assessment of patients with hepatocellular carcinoma according to underlying disease and treatment modalities. Medicine (Baltimore). 2017;96(9):e5904. doi: 10.1097/MD.0000000000005904. [DOI] [PMC free article] [PubMed] [Google Scholar]
- 4.Al-Salama ZT, Syed YY, Scott LJ. Lenvatinib: A Review in Hepatocellular Carcinoma. Drugs. 2019;79(6):665–74. doi: 10.1007/s40265-019-01116-x. [DOI] [PubMed] [Google Scholar]
- 5.Llovet JM, Ricci S, Mazzaferro V, Hilgard P, Gane E, Blanc JF, de Oliveira AC, Santoro A, Raoul JL, Forner A, Schwartz M, Porta C, Zeuzem S, Bolondi L, Greten TF, Galle PR, Seitz JF, Borbath I, Haussinger D, Giannaris T, Shan M, Moscovici M, Voliotis D, Bruix J, Group SIS. Sorafenib in advanced hepatocellular carcinoma. N Engl J Med. 2008;359(4):378–90. doi: 10.1056/NEJMoa0708857. [DOI] [PubMed] [Google Scholar]
- 6.Llovet JM, Bruix J. Molecular targeted therapies in hepatocellular carcinoma. Hepatology. 2008;48(4):1312–27. doi: 10.1002/hep.22506. [DOI] [PMC free article] [PubMed] [Google Scholar]
- 7.Jindal A, Thadi A, Shailubhai K. Hepatocellular Carcinoma: Etiology and Current and Future Drugs. J Clin Exp Hepatol. 2019;9(2):221–32. doi: 10.1016/j.jceh.2019.01.004. [DOI] [PMC free article] [PubMed] [Google Scholar]
- 8.Liu L, Cao Y, Chen C, Zhang X, McNabola A, Wilkie D, Wilhelm S, Lynch M, Carter C.Sorafenib blocks the RAF/MEK/ERK pathway, inhibits tumor angiogenesis, and induces tumor cell apoptosis in hepatocellular carcinoma model PLC/PRF/5. Cancer Res. 2006;66(24):11851–8. doi: 10.1158/0008-5472.CAN-06-1377. [DOI] [PubMed] [Google Scholar]
- 9.Xie Y, Hou W, Song X, Yu Y, Huang J, Sun X, Kang R, Tang D. Ferroptosis: process and function. Cell Death Differ. 2016;23(3):369–79. doi: 10.1038/cdd.2015.158. [DOI] [PMC free article] [PubMed] [Google Scholar]
- 10.Zhang C, Liu Z, Bunker E, Ramirez A, Lee S, Peng Y, Tan AC, Eckhardt SG, Chapnick DA, Liu X. Sorafenib targets the mitochondrial electron transport chain complexes and ATP synthase to activate the PINK1-Parkin pathway and modulate cellular drug response. J Biol Chem. 2017;292(36):15105–20. Epub 2017/07/05. doi: 10.1074/jbc.M117.783175. [DOI] [PMC free article] [PubMed] [Google Scholar]
- 11.Fernando J, Sancho P, Fernandez-Rodriguez CM, Lledo JL, Caja L, Campbell JS, Fausto N, Fabregat I. Sorafenib sensitizes hepatocellular carcinoma cells to physiological apoptotic stimuli. J Cell Physiol. 2012;227(4):1319–25. doi: 10.1002/jcp.22843. [DOI] [PMC free article] [PubMed] [Google Scholar]
- 12.Bull VH, Rajalingam K, Thiede B. Sorafenib-induced mitochondrial complex I inactivation and cell death in human neuroblastoma cells. J Proteome Res. 2012;11(3):1609–20. Epub 2012/01/25. doi: 10.1021/pr200790e. [DOI] [PubMed] [Google Scholar]
- 13.Fiume L, Manerba M, Vettraino M, Di Stefano G. Effect of sorafenib on the energy metabolism of hepatocellular carcinoma cells. Eur J Pharmacol. 2011;670(1):39–43. doi: 10.1016/j.ejphar.2011.08.038. [DOI] [PubMed] [Google Scholar]
- 14.Griguer CE, Oliva CR, Gillespie GY. Glucose metabolism heterogeneity in human and mouse malignant glioma cell lines. J Neurooncol. 2005;74(2):123–33. doi: 10.1007/s11060-004-6404-6\doi]. [DOI] [PubMed] [Google Scholar]
- 15.Nakashima RA, Paggi MG, Pedersen PL. Contributions of glycolysis and oxidative phosphorylation to adenosine 5’-triphosphate production in AS-30D hepatoma cells. Cancer Res. 1984;44(12 Pt 1):5702–6. [PubMed] [Google Scholar]
- 16.Cairns RA. Drivers of the Warburg phenotype. Cancer J. 2015;21(2):56–61. doi: 10.1097/PPO.0000000000000106\doi];00130404-201503000-00003\pii]. [DOI] [PubMed] [Google Scholar]
- 17.Grisham MB, Granger DN. Metabolic sources of reactive oxygen metabolites during oxidatn stressand ischemia with reperfusion. Clin Chest Med. 1989;10(1):71–81. [PubMed] [Google Scholar]
- 18.Keibler MA, Wasylenko TM, Kelleher JK, Iliopoulos O, Vander Heiden MG, Stephanopoulos G. Metabolic requirements for cancer cell proliferation. Cancer Metab. 2016;4:16. doi: 10.1186/s40170-016-0156-6\doi];156\pii]. [DOI] [PMC free article] [PubMed] [Google Scholar]
- 19.Liberti MV, Locasale JW. The Warburg Effect: How Does it Benefit Cancer Cells? Trends Biochem Sci. 2016;41(3):211–8. doi: 10.1016/S0968-0004(15)00241-8\pii];10.1016/j.tibs.2015.12.001\doi]. [DOI] [PMC free article] [PubMed] [Google Scholar]
- 20.Bhat TA, Kumar S, Chaudhary AK, Yadav N, Chandra D. Restoration of mitochondria function as a target for cancer therapy. Drug Discov Today. 2015;20(5):635–43. Epub 2015/03/15. doi: 10.1016/j.drudis.2015.03.001. [DOI] [PMC free article] [PubMed] [Google Scholar]
- 21.Fang D, Maldonado EN. VDAC Regulation: A Mitochondrial Target to Stop Cell Proliferation. Adv Cancer Res. 2018;138:41–69. Epub 2018/03/20. doi: 10.1016/bs.acr.2018.02.002. [DOI] [PMC free article] [PubMed] [Google Scholar]
- 22.Christie CF, Fang D, Hunt Hunt Morris ME, Rovini A, Heslop KA, Beeson GC, Beeson CC, Maldonado EN. Statin-dependent modulation of mitochondrial metabolism in cancer cells is independent of cholesterol content. FASEB J. 2019:fj201802723R. Epub 2019/04/06. doi: 10.1096/fj.201802723R. [DOI] [PMC free article] [PubMed] [Google Scholar]
- 23.Lemasters JJ, Holmuhamedov E. Voltage-dependent anion channel (VDAC) as mitochondrial governator--thinking outside the box. Biochim Biophys Acta. 2006;1762(2):181–90. doi: 10.1016/S0925-4439(05)00152-3\pii];10.1016/j.bbadis.2005.10.006\doi]. [DOI] [PubMed] [Google Scholar]
- 24.Maldonado EN. VDAC-Tubulin, an Anti-Warburg Pro-Oxidant Switch. Front Oncol. 2017;7:4. doi: 10.3389/fonc.2017.00004\doi]. [DOI] [PMC free article] [PubMed] [Google Scholar]
- 25.Lemasters JJ, Holmuhamedov EL, Czerny C, Zhong Z, Maldonado EN. Regulation of mitochondrial function by voltage dependent anion channels in ethanol metabolism and the Warburg effect. Biochim Biophys Acta. 2012;1818(6):1536–44. doi: 10.1016/S0005-2736(11)00424-X\pii];10.1016/j.bbamem.2011.11.034\doi]. [DOI] [PMC free article] [PubMed] [Google Scholar]
- 26.Maldonado EN, Patnaik J, Mullins MR, Lemasters JJ. Free tubulin modulates mitochondrial membrane potential in cancer cells. Cancer Res. 2010;70(24):10192–201. doi: 10.1016/70/24/10192\pii];10.1158/0008-5472.CAN-10-2429\doi]. [DOI] [PMC free article] [PubMed] [Google Scholar]
- 27.Maldonado EN, Sheldon KL, DeHart DN, Patnaik J, Manevich Y, Townsend DM, Bezrukov SM, Rostovtseva TK, Lemasters JJ. Voltage-dependent anion channels modulate mitochondrial metabolism in cancer cells: regulation by free tubulin and erastin. J Biol Chem. 2013;288(17):11920–9. doi: 10.1016/M112.433847\pii];10.1074/jbc.M112.433847\doi]. [DOI] [PMC free article] [PubMed] [Google Scholar]
- 28.DeHart DN, Lemasters JJ, Maldonado EN. Erastin-Like Anti-Warburg Agents Prevent Mitochondrial Depolarization Induced by Free Tubulin and Decrease Lactate Formation in Cancer Cells. SLAS Discov. 2018;23(1):23–33. Epub 2017/10/13. doi: 10.1177/2472555217731556. [DOI] [PMC free article] [PubMed] [Google Scholar]
- 29.DeHart DN, Fang D, Heslop K, Li L, Lemasters JJ, Maldonado EN. Opening of voltage dependent anion channels promotes reactive oxygen species generation, mitochondrial dysfunction and cell death in cancer cells. Biochem Pharmacol. 2018;148:155–62. Epub 2018/01/01. doi: 10.1016/j.bcp.2017.12.022. [DOI] [PMC free article] [PubMed] [Google Scholar]
- 30.Gillissen B, Richter A, Richter A, Preissner R, Schulze-Osthoff K, Essmann F, Daniel PT. Bax/Bak-independent mitochondrial depolarization and reactive oxygen species induction by sorafenib overcome resistance to apoptosis in renal cell carcinoma. J Biol Chem. 2017;292(16):6478–92. Epub 2017/02/06. doi: 10.1074/jbc.M116.754184. [DOI] [PMC free article] [PubMed] [Google Scholar]
- 31.Johnson GL, Nakamura K. The c-jun kinase/stress-activated pathway: regulation, function and role in human disease. Biochim Biophys Acta. 2007;1773(8):1341–8. Epub 2007/02/20. doi: 10.1016/j.bbamcr.2006.12.009. [DOI] [PMC free article] [PubMed] [Google Scholar]
- 32.Lucero M, Suarez AE, Chambers JW. Phosphoregulation on mitochondria: Integration of cell and organelle responses. CNS Neurosci Ther. 2019;25(7):837–58. Epub 2019/04/27. doi: 10.1111/cns.13141. [DOI] [PMC free article] [PubMed] [Google Scholar]
- 33.Win S, Than TA, Min RW, Aghajan M, Kaplowitz N. c-Jun N-terminal kinase mediates mouse liver injury through a novel Sab (SH3BP5)-dependent pathway leading to inactivation of intramitochondrial Src. Hepatology. 2016;63(6):1987–2003. Epub 2016/02/05. doi: 10.1002/hep.28486. [DOI] [PMC free article] [PubMed] [Google Scholar]
- 34.Win S, Than TA, Fernandez-Checa JC, Kaplowitz N. JNK interaction with Sab mediates ER stress induced inhibition of mitochondrial respiration and cell death. Cell Death Dis. 2014;5:e989 Epub 2014/01/11. doi: 10.1038/cddis.2013.522. [DOI] [PMC free article] [PubMed] [Google Scholar]
- 35.Chambers JW, LoGrasso PV. Mitochondrial c-Jun N-terminal kinase (JNK) signaling initiates physiological changes resulting in amplification of reactive oxygen species generation. J Biol Chem. 2011;286(18):16052–62. Epub 2011/04/02. doi: 10.1074/jbc.M111.223602. [DOI] [PMC free article] [PubMed] [Google Scholar]
- 36.Lemasters JJ, Ramshesh VK. Imaging of mitochondrial polarization and depolarization with cationic fluorophores. Methods Cell Biol. 2007;80:283–95.:283–95. [DOI] [PubMed] [Google Scholar]
- 37.Beeson CC, Beeson GC, Schnellmann RG. A high-throughput respirometric assay for mitochondrial biogenesis and toxicity. Anal Biochem. 2010;404(1):75–81. doi: 10.1016/j.ab.2010.04.040. [DOI] [PMC free article] [PubMed] [Google Scholar]
- 38.Gerencser AA, Neilson A, Choi SW, Edman U, Yadava N, Oh RJ, Ferrick DA, Nicholls DG, Brand MD. Quantitative microplate-based respirometry with correction for oxygen diffusion. Anal Chem. 2009;81(16):6868–78. doi: 10.1021/ac900881z. [DOI] [PMC free article] [PubMed] [Google Scholar]
- 39.Nieminen AL, Gores GJ, Bond JM, Imberti R, Herman B, Lemasters JJ. A novel cytotoxicity screening assay using a multiwell fluorescence scanner. Toxicol Appl Pharmacol. 1992;115(2):147–55. [DOI] [PubMed] [Google Scholar]
- 40.Paech F, Mingard C, Grunig D, Abegg VF, Bouitbir J, Krahenbuhl S. Mechanisms of mitochondrial toxicity of the kinase inhibitors ponatinib, regorafenib and sorafenib in human hepatic HepG2 cells. Toxicology. 2018;395:34–44. Epub 2018/01/18. doi: 10.1016/j.tox.2018.01.005. [DOI] [PubMed] [Google Scholar]
- 41.Win S, Than TA, Zhang J, Oo C, Min RWM, Kaplowitz N. New insights into the role and mechanism of c-Jun-N-terminal kinase signaling in the pathobiology of liver diseases. Hepatology. 2018;67(5):2013–24. Epub 2017/12/02. doi: 10.1002/hep.29689. [DOI] [PMC free article] [PubMed] [Google Scholar]
- 42.Rodriguez-Hernandez MA, Gonzalez R, de la Rosa AJ, Gallego P, Ordonez R, Navarro-Villaran E, Contreras L, Rodriguez-Arribas M, Gonzalez-Gallego J, Alamo-Martinez JM, Marin-Gomez LM, Del Campo JA, Quiles JL, Fuentes JM, de la Cruz J, Mauriz JL, Padillo FJ, Muntane J. Molecular characterization of autophagic and apoptotic signaling induced by sorafenib in liver cancer cells. J Cell Physiol. 2018;234(1):692–708. Epub 2018/08/23. doi: 10.1002/jcp.26855. [DOI] [PubMed] [Google Scholar]
- 43.Haga Y, Kanda T, Nakamura M, Nakamoto S, Sasaki R, Takahashi K, Wu S, Yokosuka O. Overexpression of c-Jun contributes to sorafenib resistance in human hepatoma cell lines. PLoS One. 2017;12(3):e0174153 Epub 2017/03/23. doi: 10.1371/journal.pone.0174153. [DOI] [PMC free article] [PubMed] [Google Scholar]
- 44.Wong HS, Benoit B, Brand MD. Mitochondrial and cytosolic sources of hydrogen peroxide in resting C2C12 myoblasts. Free Radic Biol Med. 2019;130:140–50. Epub 2018/11/06. doi: 10.1016/j.freeradbiomed.2018.10.448. [DOI] [PubMed] [Google Scholar]
- 45.Orr AL, Vargas L, Turk CN, Baaten JE, Matzen JT, Dardov VJ, Attle SJ, Li J, Quackenbush DC, Goncalves RL, Perevoshchikova IV, Petrassi HM, Meeusen SL, Ainscow EK, Brand MD. Suppressors of superoxide production from mitochondrial complex III. Nat Chem Biol. 2015;11(11):834–6. Epub 2015/09/15. doi: 10.1038/nchembio.1910. [DOI] [PMC free article] [PubMed] [Google Scholar]
- 46.Chambers JW, Cherry L, Laughlin JD, Figuera-Losada M, Lograsso PV. Selective inhibition of mitochondrial JNK signalling achieved using peptide mimicry of the Sab kinase interacting motif-1 (KIM1). ACS Chem Biol. 2011;6(8):808–18. Epub 2011/05/14. doi: 10.1021/cb200062a. [DOI] [PMC free article] [PubMed] [Google Scholar]
- 47.Llobet D, Eritja N, Yeramian A, Pallares J, Sorolla A, Domingo M, Santacana M, Gonzalez-Tallada FJ, Matias-Guiu X, Dolcet X. The multikinase inhibitor Sorafenib induces apoptosis and sensitises endometrial cancer cells to TRAIL by different mechanisms. Eur J Cancer. 2010;46(4):836–50. Epub 2010/01/15. doi: 10.1016/j.ejca.2009.12.025. [DOI] [PubMed] [Google Scholar]
- 48.Coriat R, Nicco C, Chereau C, Mir O, Alexandre J, Ropert S, Weill B, Chaussade S, Goldwasser F, Batteux F. Sorafenib-induced hepatocellular carcinoma cell death depends on reactive oxygen species production in vitro and in vivo. Mol Cancer Ther. 2012;11(10):2284–93. Epub 2012/08/21. doi: 10.1158/1535-7163.MCT-12-0093. [DOI] [PubMed] [Google Scholar]
- 49.Wang H, Sheehan RP, Palmer AC, Everley RA, Boswell SA, Ron-Harel N, Ringel AE, Holton KM, Jacobson CA, Erickson AR, Maliszewski L, Haigis MC, Sorger PK. Adaptation of Human iPSC-Derived Cardiomyocytes to Tyrosine Kinase Inhibitors Reduces Acute Cardiotoxicity via Metabolic Reprogramming. Cell Syst. 2019;8(5):412–26 e7. Epub 2019/05/13. doi: 10.1016/j.cels.2019.03.009. [DOI] [PMC free article] [PubMed] [Google Scholar]
- 50.Zhang J, Salminen A, Yang X, Luo Y, Wu Q, White M, Greenhaw J, Ren L, Bryant M, Salminen W, Papoian T, Mattes W, Shi Q. Effects of 31 FDA approved small-molecule kinase inhibitors on isolated rat liver mitochondria. Arch Toxicol. 2017;91(8):2921–38. Epub 2016/12/30. doi: 10.1007/s00204-016-1918-1. [DOI] [PMC free article] [PubMed] [Google Scholar]
- 51.Will Y, Dykens JA, Nadanaciva S, Hirakawa B, Jamieson J, Marroquin LD, Hynes J, Patyna S, Jessen BA. Effect of the multitargeted tyrosine kinase inhibitors imatinib, dasatinib, sunitinib, and sorafenib on mitochondrial function in isolated rat heart mitochondria and H9c2 cells. Toxicol Sci. 2008;106(1):153–61. Epub 2008/07/31. doi: 10.1093/toxsci/kfn157. [DOI] [PubMed] [Google Scholar]
- 52.Perez E, Lindblad JL, Bergmann A. Tumor-promoting function of apoptotic caspases by an amplification loop involving ROS, macrophages and JNK in Drosophila. Elife. 2017;6 Epub 2017/08/31. doi: 10.7554/eLife.26747. [DOI] [PMC free article] [PubMed] [Google Scholar]
- 53.Lange M, Abhari BA, Hinrichs TM, Fulda S, Liese J. Identification of a novel oxidative stress induced cell death by Sorafenib and oleanolic acid in human hepatocellular carcinoma cells. Biochem Pharmacol. 2016;118:9–17. Epub 2016/08/22. doi: 10.1016/j.bcp.2016.08.011. [DOI] [PubMed] [Google Scholar]
- 54.Muller FL, Liu Y, Van RH. Complex III releases superoxide to both sides of the inner mitochondrial membrane. J Biol Chem. 2004;279(47):49064–73. doi: 10.1074/jbc.M407715200\doi];M407715200\pii]. [DOI] [PubMed] [Google Scholar]
- 55.St-Pierre J, Buckingham JA, Roebuck SJ, Brand MD. Topology of superoxide production from different sites in the mitochondrial electron transport chain. J Biol Chem. 2002;277(47):44784–90. Epub 2002/09/19. doi: 10.1074/jbcM207217200. [DOI] [PubMed] [Google Scholar]
- 56.Dhanasekaran DN, Reddy EP. JNK signaling in apoptosis. Oncogene. 2008;27(48):6245–51. Epub 2008/10/22. doi: 10.1038/onc.2008.301. [DOI] [PMC free article] [PubMed] [Google Scholar]
- 57.Sanchez-Perez I, Benitah SA, Martinez-Gomariz M, Lacal JC, Perona R. Cell stress and MEKK1-mediated c-Jun activation modulate NFkappaB activity and cell viability. Mol Biol Cell. 2002;13(8):2933–45. Epub 2002/08/16. doi: 10.1091/mbc.e02-01-0022. [DOI] [PMC free article] [PubMed] [Google Scholar]
- 58.Linkermann A, Green DR. Necroptosis. N Engl J Med. 2014;370(5):455–65. Epub 2014/01/31. doi: 10.1056/NEJMra1310050. [DOI] [PMC free article] [PubMed] [Google Scholar]
- 59.Dhanasekaran DN, Reddy EP. JNK-signaling: A multiplexing hub in programmed cell death. Genes Cancer. 2017;8(9–10):682–94. Epub 2017/12/14. doi: 10.18632/genesandcancer.155. [DOI] [PMC free article] [PubMed] [Google Scholar]
- 60.Sun W, Wu X, Gao H, Yu J, Zhao W, Lu JJ, Wang J, Du G, Chen X. Cytosolic calcium mediates RIP1/RIP3 complex-dependent necroptosis through JNK activation and mitochondrial ROS production in human colon cancer cells. Free Radic Biol Med. 2017;108:433–44. Epub 2017/04/18. doi: 10.1016/j.freeradbiomed.2017.04.010. [DOI] [PubMed] [Google Scholar]
- 61.Chin HS, Li MX, Tan IKL, Ninnis RL, Reljic B, Scicluna K, Dagley LF, Sandow JJ, Kelly GL, Samson AL, Chappaz S, Khaw SL, Chang C, Morokoff A, Brinkmann K, Webb A, Hockings C, Hall CM, Kueh AJ, Ryan MT, Kluck RM, Bouillet P, Herold MJ, Gray DHD, Huang DCS, van Delft MF, Dewson G. VDAC2 enables BAX to mediate apoptosis and limit tumor development. Nat Commun. 2018;9(1):4976 Epub 2018/11/28. doi: 10.1038/s41467-018-07309-4. [DOI] [PMC free article] [PubMed] [Google Scholar]
- 62.Yagoda N, von RM, Zaganjor E, Bauer AJ, Yang WS, Fridman DJ, Wolpaw AJ, Smukste I, Peltier JM, Boniface JJ, Smith R, Lessnick SL, Sahasrabudhe S, Stockwell BR. RAS-RAF-MEK-dependent oxidative cell death involving voltage-dependent anion channels. Nature. 2007;447(7146):864–8. doi: 10.1016/nature05859\pii];10.1038/nature05859\doi]. [DOI] [PMC free article] [PubMed] [Google Scholar]
- 63.Iskandar K, Rezlan M, Yadav SK, Foo CH, Sethi G, Qiang Y, Bellot GL, Pervaiz S. Synthetic Lethality of a Novel Small Molecule Against Mutant KRAS-Expressing Cancer Cells Involves AKT-Dependent ROS Production. Antioxid Redox Signal. 2016;24(14):781–94. Epub 2015/12/31. doi: 10.1089/ars.2015.6362. [DOI] [PubMed] [Google Scholar]


