

Abstract
Vitamin D is an essential nutrient for bone health and may influence the risks of respiratory illness, adverse pregnancy outcomes, and chronic diseases of adulthood. Because many countries have a relatively low supply of foods rich in vitamin D and inadequate exposure to natural ultraviolet B (UVB) radiation from sunlight, an important proportion of the global population is at risk of vitamin D deficiency. There is general agreement that the minimum serum/plasma 25-hydroxyvitamin D concentration (25(OH)D) that protects against vitamin D deficiency–related bone disease is approximately 30 nmol/L; therefore, this threshold is suitable to define vitamin D deficiency in population surveys. However, efforts to assess the vitamin D status of populations in low- and middle-income countries have been hampered by limited availability of population-representative 25(OH)D data, particularly among population subgroups most vulnerable to the skeletal and potential extraskeletal consequences of low vitamin D status, namely exclusively breastfed infants, children, adolescents, pregnant and lactating women, and the elderly. In the absence of 25(OH)D data, identification of communities that would benefit from public health interventions to improve vitamin D status may require proxy indicators of the population risk of vitamin D deficiency, such as the prevalence of rickets or metrics of usual UVB exposure. If a high prevalence of vitamin D deficiency is identified (>20% prevalence of 25(OH)D < 30 nmol/L) or the risk for vitamin D deficiency is determined to be high based on proxy indicators (e.g., prevalence of rickets >1%), food fortification and/or targeted vitamin D supplementation policies can be implemented to reduce the burden of vitamin D deficiency–related conditions in vulnerable populations.
Keywords: vitamin D, 25-hydroxyvitamin D, cholecalciferol, rickets, developing countries, micronutrients, nutrition, dietary supplementation, fortification
Introduction
In January and March 2017, the Sackler Institute for Nutrition Science at the New York Academy of Sciences and the Bill & Melinda Gates Foundation, in coordination with a scientific organizing committee, convened a working group to assess the global prevalence and disease burden of vitamin D deficiency, and population-based strategies to improve vitamin D status, particularly in low- and middle-income countries (LMICs) (i.e., defined by the World Bank as either low income, lower-middle income, or upper-middle income).1 Specifically, the working group aimed to examine definitions of vitamin D deficiency on the basis of biomarkers and correlations with disease or health outcomes; potential approaches to developing estimates of national, regional, or global prevalence of vitamin D deficiency and related diseases; the strength of the existing evidence related to functional consequences, morbidity, and mortality associated with vitamin D deficiency; criteria by which vitamin D deficiency may be characterized as either a national public health problem in LMICs, and/or a condition primarily affecting high-risk subgroups; a roadmap for reducing disease burden associated with vitamin D deficiency in LMICs; and a research agenda to address gaps in knowledge (see Executive summary, Box 1).
Box 1. Executive summary.
Assessment
Serum or plasma 25-hydroxyvitamin D (25(OH)D) concentration is the most useful biomarker of vitamin D status.
Vitamin D deficiency is conventionally defined as 25(OH)D below 30 nmol/L.
- Natural sources of vitamin D:
- Dietary: Few foods, other than fatty fish, naturally contain moderately high amounts of vitamin D, and these foods are often not readily accessible in low- and middle-income countries (LMICs).
- Sunlight: Endogenous synthesis of vitamin D stimulated by ultraviolet B (UVB) radiation exposure is heavily influenced by geographic location and/or seasonality as well as social factors, making UVB exposure an unreliable source of vitamin D.
Consequences
Vitamin D deficiency causes bone diseases, including rickets in children and osteomalacia in adults, and is associated with increased risk of respiratory illness and small-for-gestational age (SGA) births.
Prevalence
-
There are limited population data on vitamin D status from LMICs, but the available data suggest that vitamin D deficiency may be widespread globally, especially in regions where vitamin D fortification programs are not in place.
Roadmap for action: To reduce the prevalence of vitamin D deficiency, at-risk countries should consider mandatory fortification of staple foods and/or supplementation of at-risk subgroups.
Needs assessment
Population vitamin D status should be primarily assessed through measurement of serum/plasma25(OH)D in a representative sample of the population. If more than 20% of the population (overall, or within identifiable subgroups) has 25(OH)D below 30 nmol/L, public health intervention should be considered.
In the absence of representative 25(OH)D data, countries may also use rickets surveillance to assess the risk of vitamin D deficiency in early childhood. Public health interventions (e.g., routine vitamin D supplementation of breastfed infants) should be considered in settings with rickets prevalence > 1%.
Indicators of UVB exposure may be considered in the absence of other data but should include consideration of latitude, season, and/or climate and cultural practices whereby some groups have limited skin exposure to sunlight.
Intervention
Food fortification: Vitamin D can be added to numerous vehicles, including dairy products, edible oils, and flour. Vitamin D can also be cofortified with vitamin A.
Supplementation: Vitamin D supplementation may be considered as one approach to increasing vitamin D status in specific target groups, such as pregnant and lactating women or breastfeeding infants. It may also be used as an interim strategy while developing a national food fortification program.
Methods
The scientific organizing committee convened a working group by inviting members of the scientific community with expertise in micronutrient malnutrition, pediatrics, endocrinology, laboratory assessment of vitamin D status, epidemiology, and micronutrient supplementation and fortification programs. The group reviewed recent research and policy documents and engaged in two in-person workshops aimed at examining issues of importance to policy makers and program administrators responsible for public health actions to assess and address vitamin D deficiency in LMICs. The group did not undertake new systematic reviews of the vitamin D literature but primarily drew upon published evidence syntheses to guide its discussions and to consider the application of evidence to LMICs. The group also relied on individual members to bring forward specific research studies or examples of relevant programmatic experiences. General agreement of the group developed at the two workshops and through subsequent email correspondence. This paper presents an overview of the evidence reviewed, deliberations, and conclusions of the working group.
Vitamin D physiology
Vitamin D has essential roles in the metabolism of calcium and phosphorus and is thus critical for bone growth and bone mineral metabolism. Vitamin D deficiency is known to cause two metabolic bone diseases, rickets (in children) and osteomalacia (in adults). In addition to facilitating the absorption of calcium, vitamin D in its active form downregulates the release of parathyroid hormone (PTH), which at excessive levels causes bone loss and brittleness and thereby contributes to the long-term risk of osteoporosis.2 Vitamin D also functions in the regulation of the immune system and in the proliferation and differentiation of numerous cell types. Over the past two decades, laboratory and epidemiological studies have also suggested that low vitamin D status may be associated with a variety of health risks, including respiratory illnesses (infections and asthma),3 adverse pregnancy outcomes,4,5 and chronic diseases of adulthood, such as osteoporosis6 and cardiovascular disease.7,8 To date, clinical trials have contributed a limited amount of empirical evidence to support the beneficial effects of vitamin D, primarily on the risk of respiratory infections3 and some adverse pregnancy outcomes;9 however, there is limited evidence thus far from randomized clinical trials to support effects on health outcomes other than bone health.4,7,10–12
The dominant source of vitamin D in humans is the endogenous production of vitamin D3 (cholecalciferol) in skin following exposure to ultraviolet B (UVB) (290–320 nm) radiation from sunlight. Under conditions of unconstrained UVB exposure, humans can generate adequate circulating levels of vitamin D without risk of vitamin D toxicity.13 However, cutaneous vitamin D3 synthesis is diminished or absent at relatively high latitudes (>35°N/S, particularly during the winter) by ecological factors that reduce UVB penetrance (e.g., UVB-absorbing aerosols in the atmosphere and UVB path length through the stratosphere that changes with time of day and month of the year) and by individual factors that limit cutaneous exposure to UVB, such as dark skin pigmentation, sun avoidant lifestyles, conservative clothing habits, and liberal use of sunscreen.14 Because of the wide within- and between-individual variations in the contribution of UVB-induced endogenous production to systemic vitamin D status, dietary requirements for vitamin D have been most commonly estimated assuming limited or no exposure to UVB. Moreover, most public health authorities in high-income countries recommend limiting sun exposure and liberal use of sunscreen to minimize the risk of skin cancer.15
Vitamin D is present naturally in modest amounts in fatty fish and egg yolks, and in lower amounts in some other foods (Table 1).16,17 Vitamin D3 is the main form of vitamin D found naturally in animal-source foods and oils as well as many commercial supplements, whereas vitamin D2 (ergocalciferol) occurs naturally in some plants and fungi, and is less commonly used in supplements or as a fortificant (NB: unless otherwise distinguished, the general term vitamin D is used to refer to both forms together throughout the report). Since very few foods naturally contain substantial amounts of vitamin D, commercially fortified foods (e.g., milk and ready-to-eat breakfast cereals) may make a sizable contribution to the mean daily intake of vitamin D in countries where these products are routinely fortified and widely consumed. However, very few countries currently have mandatory vitamin D fortification policies and practices.18 Vitamin D in food or supplements may be quantified in either international units (IU) or micrograms (μg), whereby 1 IU = 0.025 μg for both vitamin D2 and D3. It is common for dietary guidelines to specify intakes in terms of μg/day, whereas supplemental doses are often specified in terms of IU/dose; therefore, both units are used throughout this report.
Table 1.
Selected examples of natural (unfortified) food sources of vitamin D16
| Food | IU/serving | μg/serving | Percent DV |
|---|---|---|---|
| Salmon (sockeye) cooked, 3 ounces | 570 | 14.2 | 71 |
| Swordfish, cooked, 3 ounces | 566 | 14.1 | 71 |
| Cod liver oil, 1 teaspoon | 450 | 11.2 | 56 |
| Sardines, canned in oil, drained, 1 cup | 288 | 7.2 | 36 |
| Tuna (white), canned in water, drained, 3 ounces | 68 | 1.7 | 9 |
| Egg, 1 large hard cooked (50 g) | 44 | 1.1 | 5 |
| Beef liver, cooked (pan fried), 1 slice (81 g) | 40 | 1.0 | 5 |
| Cheese, Swiss, 1 cup (diced) | 25 | 0.7 | 3 |
IU, international units; DV, daily value, based on 800 IU/day for adults and children over 4 years.17
1 IU = 0.025 μg.
Vitamin D metabolism involves sequential hydroxylation to generate the metabolically active metabolite. Following vitamin D3 production in the skin, it enters the dermal capillary bed and is nearly 100% bound to vitamin D–binding protein (DBP).14 When vitamin D2 or D3 is absorbed from the gut, it is incorporated into chylomicrons and is subsequently transferred to DBP or albumin. Vitamin D is hydroxylated in the liver to form 25-hydroxyvitamin D (25(OH)D), the major circulating vitamin D metabolite. Subsequent hydroxylation of 25(OH)D, primarily occurring in the kidneys, forms 1,25-dihydroxyvitamin D (1,25(OH)2D), which is the most metabolically active form of the vitamin. Other tissues and cells may also produce 1,25(OH)2D for local autocrine/paracrine effects.19 For example, during pregnancy, the placenta expresses both the vitamin D receptor and the vitamin D–activating enzyme, thereby enabling local production and action of 1,25(OH)2D.20,21
The active vitamin D metabolite, 1,25(OH)2D, promotes intestinal absorption of calcium and phosphorus in the gut. Low intake or absorption of calcium and/or low vitamin D status leads to a compensatory increase in the production of PTH, which has a twofold effect: triggering increased renal hydroxylation of 25(OH)D to 1,25(OH)2D, thus making more of the active metabolite available; and, increasing bone resorption, thereby mobilizing calcium from the bones to maintain serum calcium concentration in the physiological range. Individuals with nutritional rickets or osteomalacia typically present with low serum 25(OH)D, higher than normal levels of alkaline phosphatase (ALP) and PTH, and variable concentrations of 1,25(OH)2D.22,23
Vitamin D assessment and intake
Vitamin D status assessment
Serum or plasma concentration of 25(OH)D is the best indicator of vitamin D status, owing to its long half-life in the body (15 days), relative stability, plentiful concentration in the blood, and responsiveness to recent endogenous vitamin D production and exogenous (dietary or supplemental) vitamin D intake [NB: the shorthand 25(OH)D is used throughout the article to refer to either serum or plasma concentration of 25(OH)D)].24 Conversely, renal production of 1,25(OH)2D is tightly regulated by serum concentrations of calcium, phosphorus, and PTH; 1,25(OH)2D has a half-life of just a few hours and is present in circulation at concentrations three orders of magnitude lower than 25(OH)D. Thus, 1,25(OH)2D is not a useful indicator of vitamin D intake or status.25 Although the serum/plasma 25(OH)D concentration is an indicator of recent vitamin D inputs (i.e., endogenous production plus intake), it is not a direct measure of functional outcomes or health effects, nor is it a biomarker of effects of vitamin D on bone health or other target organs. This distinction is important when considering associations between 25(OH)D and diseases presumptively linked to vitamin D deficiency. Furthermore, it is widely recognized that many acute and chronic illnesses may lower 25(OH)D owing to decreased mobility and sun exposure, decreased intake of vitamin D–fortified foods, or as a result of chronic inflammation; therefore, observed associations between diseases and 25(OH)D may be due to reverse causation. Despite these limitations, 25(OH)D remains the most reliable biomarker of recent vitamin D exposure that is currently available and measurable in many laboratories throughout the world.
Serum 25(OH)D can be measured by various methods (e.g., liquid chromatography–mass spectrometry or enzyme-linked immunosorbent assay), although the results of each of these assays can vary across laboratories and individual technicians, resulting in substantial between-laboratory differences in analytical accuracy and precision. To promote more accurate and reliable measurement of 25(OH)D, laboratories should use an accuracy-based quality assurance or proficiency testing scheme (of which there are a number available, as described herein); ideally, laboratories conducting 25(OH)D analysis for national nutrition and health surveys should comply with international standardization efforts, such as the Vitamin D Standardization Program (VDSP). The VDSP, operated out of the Office of Dietary Supplements in the United States, has supported a recent program in Europe whereby nationally or regionally representative 25(OH)D data were standardized to enable more accurate assessments of the prevalence of vitamin D deficiency in European countries.26 The Vitamin D External Quality Assessment Scheme (DEQAS) is a proficiency testing scheme based in the United Kingdom that provides participating laboratories with 20 samples per year (5 per quarter) that have reference values for 25(OH)D3 and 25(OH)D2 concentrations assigned by the U.S. National Institutes of Standards and Technologies (NIST) Reference Measurement Procedures.27 Todate, DEQAS has engaged approximately 1200 laboratories in 54 countries. A proficiency certificate is issued annually to those laboratories meeting the performance targets set by the DEQAS Advisory Panel. In the United States, the Centers for Disease Control and Prevention (CDC) hosts the Vitamin D Standardization-Certification Program (VDSCP), which also evaluates the accuracy and reliability of vitamin D tests using well-established procedures, and certifies those that have acceptable accuracy and precision.28 In this scheme, participating laboratories are provided with one-time sets of 40 different reference materials for bias assessment and calibration, as well as 40 blinded samples per year (10 per quarter) with reference values for 25(OH)D3 and 25(OH)D2 assigned using the Reference Measurement Procedures at the CDC in order to certify analytical performance. Several of the major assay manufacturers and key laboratories participate in this certification program; in 2017, there were 21 certified laboratories. The CDC also supports the College of American Pathologists’ accuracy-based proficiency testing program for vitamin D. Laboratories may also directly purchase vitamin D standard reference materials “Vitamin D in Human Serum” from the NIST, which enables laboratories to validate the accuracy of their test methods and is a first step toward standardization of vitamin D testing.29
While 25(OH)D is considered the best available biomarker of vitamin D status, other biomarkers present in serum have been considered as potential functional indicators of vitamin D status related to bone health outcomes: PTH concentration; ALP; the ratio of 24,25(OH)2D (a degradation product of vitamin D metabolism) to 25(OH)D; “free 25(OH)D,” which is the small fraction of the metabolite that is not bound to DBP or albumin; and, bioavailable 25(OH)D, which includes the fraction bound to albumin and free 25(OH)D.24 However, little information exists regarding the use of these functional biomarkers to screen for the prevalence or effects of vitamin D deficiency in population-based surveys.
Despite the inverse association between plasma PTH and 25(OH)D, there is considerable variability in PTH values; for example, not all children with radiologically diagnosed rickets have PTH concentrations above the upper limits of the conventional reference range.30 In a retrospective analysis of the relationship between PTH and 25(OH)D, one study of children and adolescents31 suggested an inflection point at a 25(OH)D concentration of 18 ng/mL (45 nmol/L). However, other studies have not identified a consistent inflection point that would confidently enable PTH to be used as a marker of vitamin D sufficiency.32 The working group agreed that there is too much variability in PTH to use it exclusively for the diagnosis of rickets or vitamin D deficiency. Additionally, prolonged storage of frozen serum or plasma can result in decline of measured PTH concentrations over time, and the relative expense of PTH assays makes this biomarker less feasible for use in large-scale surveys.33
ALP may be a more sensitive biomarker than PTH for population studies assessing the functional impact of vitamin D deficiency on bone health, as serum ALP is nearly always elevated in active rickets. However, it is important to note that ALP can be elevated by either calcium or vitamin D deficiency,34,35 as well as other disease processes (e.g., liver dysfunction). The recent guidelines released by the Global Consensus Recommendations on Prevention and Management of Nutritional Rickets support the use of ALP in the diagnosis and management of nutritional rickets caused by vitamin D and/or calcium deficiency. However, the guidelines recommend against using ALP for population screening.35 The present group considered the potential utility of ALP in a public health context, but found limited published evidence to support the use of ALP for rickets screening or surveillance in the general population.36 Further research is needed to guide the application of ALP as a population screening biomarker.
Research to develop new measurement techniques, establish reference ranges, and uncover correlations between alternative vitamin D status/functional biomarkers for health or disease endpoints is ongoing. Although 25(OH)D is considered the best biomarker of status for use in population surveys, it should be interpreted cautiously and with consideration of assay performance characteristics, markers of systemic inflammation (as discussed below), and other ancillary data from the same population (e.g., prevalence of bone disease and other population risk factors for vitamin D deficiency).
Definition of vitamin D deficiency based on 25(OH)D cut-points
While several different 25(OH)D cutoffs have been used to define risk for deficiency (Fig. 1), published cutoffs are usually 30 nmol/L and most commonly in the 25–30 nmol/L range. Differences arise because of the consultative approaches of the organizations tasked with developing these recommendations, and the strength and interpretation of evidence linking vitamin D status to particular health outcomes in target populations. As 25(OH)D alone does not accurately predict health outcomes (e.g., rickets and fracture risk), experts suggest that a single threshold for deficiency is unlikely to be valid in all situations and that 25(OH)D values should be interpreted in the context of other considerations, such as ethnicity, genetics, inflammation, age, calcium intake, obesity, and other factors that influence vitamin D status. However, there are currently insufficient data to justify the use of individualized or customized 25(OH)D cutoffs on the basis of these factors.
Figure 1.

Serum25-hydroxyvitaminD(25(OH)D)concentrationthresholdsforvitaminDdeficiency, insufficiency, andsufficiency developed by the Institute of Medicine (IOM),38 the Scientific Advisory Committee on Nutrition (SACN),13 the European Food Safety Authority (EFSA),53 and the Endocrine Society.54 Dashed lines are shown for 25(OH)D ranges in which the consensus group did not make a direct statement regarding vitamin D deficiency, adequacy, or risk of harm.
Genetic factors influence vitamin D metabolism as well as calcium and phosphate metabolism. Notably, African Americans have overall lower 25(OH)D and a higher risk of rickets than Caucasians, yet have higher bone mineral density, lower incidence of osteoporosis, and relative skeletal resistance to the effects of PTH.37,38 Common single nucleotide polymorphisms in genes related to vitamin D metabolism are known to affect 25(OH)D and response to supplementation.39–42
Numerous clinical and dietary factors may also influence vitamin D status. Inflammation has been shown to slightly reduce 25(OH)D. In an analysis of the U.S. population involving almost 9000 adults, 27% had significantly elevated C-reactive protein (≥5 mg/L) indicative of inflammation, and, after controlling for important covariates, 25(OH)D was 3.9 nmol/L lower in the presence of inflammation.43 The effect of inflammation on 25(OH)D concentration may be most relevant in hospital-based settings, where patients may be more likely to have inflammation, but should be considered in future studies of populations in LMICs who may be at risk of chronic low-grade inflammation. Some studies have shown increased 25(OH)D clearance in association with clinical conditions such as hyperparathyroidism44 and low calcium intakes,45,46 yet among healthy individuals under habitual conditions, there are no important effects of either calcium intake47,48 or pregnancy on 25(OH)D.49,50 Compensatory mechanisms to counter potential drivers of increased vitamin D metabolism may exist (e.g., changes in DBP concentration) and require further investigation. In theory, thresholds for vitamin D adequacy may vary by body composition, life stage, or even across different tissues.51 For example, a 25(OH)D threshold that is deemed sufficient for a healthy adult may be inadequate for an infant or adolescent, who is experiencing periods of rapid bone growth. However, as previously noted, existing evidence does not provide a strong basis for setting different 25(OH)D cutoffs to define deficiency in different life stages or on the basis of other individual factors.
The working group acknowledged that biochemical cutoffs for risk of deficiency are driven by data related to the risks of adverse skeletal outcomes but do not indicate clinical thresholds that define specific diseases or risks of extraskeletal health outcomes. Although vitamin D deficiency has been presumptively implicated in numerous diseases, including cancer and cardiovascular disease, the group agreed with the North American Institute of Medicine (IOM) and UK Scientific Advisory Committee on Nutrition (SACN) conclusions in 2011 and 2016, respectively, that “musculoskeletal health remains the only outcome for which adequate evidence exists to set guidelines for establishing vitamin D status biomarker cutoffs.”13,38
The group further noted that various authors and expert panels have applied inconsistent terminology in the designation of 25(OH)D cutoffs, such as severe deficiency, moderate deficiency, subclinical deficiency, and insufficiency, to describe the degree of vitamin D deficiency in relation to 25(OH)D. As a result, thresholds for adequacy are sometimes inappropriately conflated with cutoffs for deficiency.52 Some publications draw a distinction between risk of deficiency and insufficiency (Fig. 1), a term used to refer to 25(OH)D concentrations that are below the threshold for sufficiency but that may not be low enough to constitute actual clinical deficiency. However, the general agreement of the working group was to apply a single definition of deficiency (versus sufficiency) for application to the proposed roadmap.
The group recognized the evidence that supports public health measures (e.g., food fortification) to elevate 25(OH)D to ≥30 nmol/L in nearly all individuals (i.e., to reduce the percentage of the population with 25(OH)D < 30 nmol/L). The group’s agreement on a 30 nmol/L threshold for deficiency was primarily influenced by the evidence syntheses and conclusions of the IOM (United States/Canada)38 and the SACN (UK)13 (Fig. 1). Given typical 25(OH)D assay imprecision and bias, there is little meaningful difference between thresholds at 25 nmol/L (SACN) and 30 nmol/L (IOM); however, the working group chose to adopt the slightly more conservative threshold of 30 nmol/L. The group acknowledged that the European Food Safety Authority (EFSA)53 and the Endocrine Society54 have advocated a threshold of 50 nmol/L as the lower limit of sufficiency, which is also the 25(OH)D level that corresponds to the recommended dietary allowance (RDA) per IOM guidance38 (Fig. 1). However, the general agreement of the group was that there is insufficient evidence to target higher 25(OH)D beyond 30 nmol/L when undertaking population-based interventions.53,55,56 In selecting the 30 nmol/L 25(OH)D cut-point to define deficiency, the group noted the important distinction between a target 25(OH)D for optimal bone health in an individual and the population mean 25(OH)D that may need to be targeted to ensure vitamin D adequacy in the majority of the population. For example, a population mean 25(OH)D of ~70 nmol/L might be required to ensure that 97.5% of the population has 25(OH)D > 30 nmol/L, assuming a standard deviation of 20 nmol/L and a normal distribution. Conversely, to target a 50 nmol/L threshold, a population intervention may need to achieve a mean 25(OH)D of ~90 nmol/L to yield 25(OH)D > 50 nmol/L in nearly all individuals. While these are intended only as theoretical examples, they highlight the fact that population standard deviations in addition to mean values are required to model the effect of fortification or supplementation programs and to ensure safe 25(OH)D distributions. The working group considered that owing to the uncertainty and potential variation in the shape and dispersion (i.e., standard deviation) of a population 25(OH)D distribution, it is most practical to focus on the percent of the population below 30 nmol/L as the standard indicator of inadequacy of population vitamin D status, as many studies have done,57–59 instead of focusing on the mean concentration. Furthermore, in the absence of data on optimal 25(OH)D thresholds for each factor that affects vitamin D status, there is insufficient evidence to make context- or group-specific recommendations. Thus, 30 nmol/L is proposed as a cutoff for deficiency to be used across all populations and population subgroups.
Dietary guidelines on vitamin D intake
A number of organizations have recommended different vitamin D intake levels for their respective target populations. A detailed list of older recommendations from a broader range of countries was recently published.51 Recommended vitamin D intakes are generally between 5 and 20 μg/day, depending on age and physiological status (summarized in Table 2). Figure 2 demonstrates the relationship between vitamin D intake (with very minimal cutaneous synthesis) and 25(OH)D on the basis of an individual-participant meta-regression of selected dose–response studies.60
Table 2.
Vitamin D intake guidelines by age group
| Organization or country | [25(OH)D] used as basis for setting DRI | Assumed sunshine exposure | Infants (<1 year) | Children | Adolescents | Adults | Pregnancy and lactation | Elderly | Refs. |
|---|---|---|---|---|---|---|---|---|---|
| WHO/FAO, 2004;a WHO, 2016 | 27 nmol/Lb | Minimal | 5 μg/dayRNI | 5 μg/dayRNI | 5 μg/dayRNI | 5 μg/dayRNI | 5 μg/dayRNI | 10 μg/dayRNI (51–65 years) 15 μg/dayRNI (65+ years) | 111,225 |
| Australia and New Zealand, 2006 | 27.5 nmol/Lb | Minimal | 5 μg/dayAI | 5 μg/dayAI | 5 μg/dayAI | 5 μg/dayAI (to 50 years) 10 μg/dayAI (to 70 years) | 5 μg/dayAI | 15 μg/dayAI (>70 years) | 226 |
| North America (IOM), 2011 | 50 nmolLc | Minimal | 10 μg/dayAI | 15 μg/dayRDA | 15 μg/dayRDA | 15 μg/dayRDA | 15 μg/dayRDA | 20 μg/dayRDA | 38 |
| Nordic region (NNR), 2012d | 50 nmol/Ld | Some level | 10 μg/dayRI | 10 μg/dayRI | 10 μg/dayRI | 10 μg/dayRI (to 74 years) | 10 μg/dayRI | 20 μg/dayRI (>75 years) | 227 |
| D-A-CH Region (German Nutrition Society), 2012 | 50 nmol/Lb | Minimal | 10 μg/dayAI | 20 μg/dayAI | 20 μg/dayAI | 20 μg/dayAI | 20 μg/dayAI | 20 μg/dayAI | 228 |
| Japan, 2013 | 50 nmol/Lb | Adequate | 2.5 μg/dayAI (0–5 months)e 5 μg/dayAI (6–11 months) | 2.5–5.5 μg/dayAI | 5.5 μg/dayAI | 5.5 μg/dayAI | + 1.5 μg/dayAI (pregnancy) +2.5 μg/dayAI (lactation) | 5.5 μg/dayAI | 65 |
| UK (SACN), 2016 | 25 nmol/Lf | Minimal | 8.5–10 μg/daySI | 10 μg/dayRNI | 10 μg/dayRNI | 10 μg/dayRNI | 10 μg/dayRNI | 10 μg/dayRNI | 13 |
| European Union (EFSA), 2016 | 50 nmol/Lg | Minimal | 10 μg/dayAI | 15 μg/dayAI | 15 μg/dayAI | 15 μg/dayAI | 15 μg/dayAI | 15 μg/dayAI | 53 |
Recommendation for individuals not producing sufficient endogenous vitamin D.
Cutoff for deficiency.
Level that meets or exceeds the requirement of 97.5% of the population.
Assumes some level of cutaneous synthesis. RNI may be higher (20 μg/day) if cutaneous synthesis is restricted.
Assumes some level of cutaneous synthesis. In the absence of adequate sun exposure, AI is 5 μg/day in 0- to 5-month old infants.
Population protective level: the concentration that 97.5% of individuals in the UK should achieve, or be above, in relation to protecting musculoskeletal health.
Level below which there is an increased risk of adverse musculoskeletal health outcomes and pregnancy-related health outcomes. WHO, World Health Organization; FAO, Food and Agricultural Organization; IOM, Institute of Medicine; NNR, Nordic Nutrition Recommendations; D-A-CH, Germany, Austria and Switzerland; SACN, Scientific Advisory Committee on Nutrition; EFSA, European Food Safety Authority; AI, adequate intake; DRI, dietary reference intake; RDA, recommended dietary allowance; RNI, recommended nutrient intake.
Figure 2.
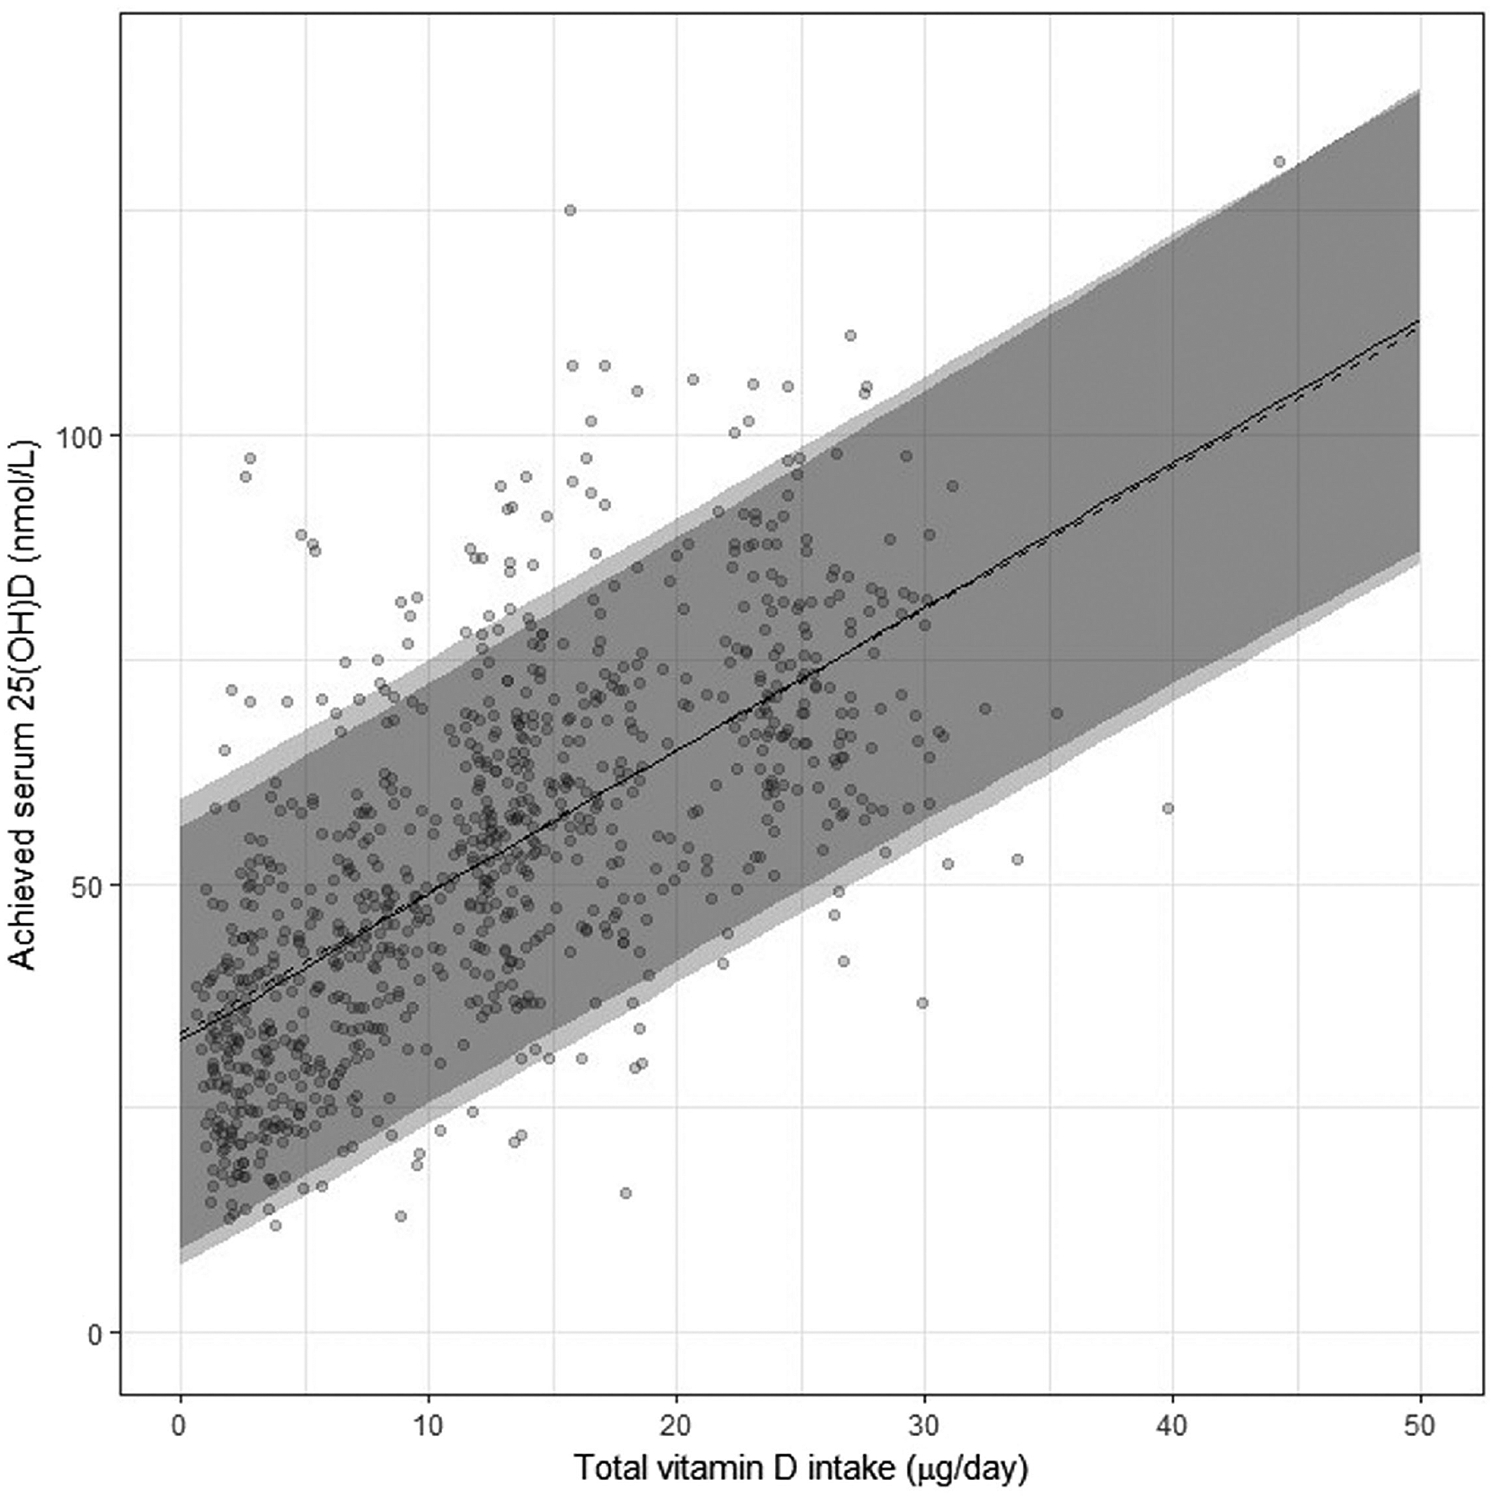
Association between serum 25-hydroxyvitamin D (25(OH)D) concentrations (in late winter) and total vitamin D intake (i.e., from diet plus supplemental vitamin D) in healthy persons aged 4–86 years living at northerly latitudes (between 51° N and 60° N) based on individual patient data (IPD) meta-regression analysis (n 882 individuals). The solid and dashed lines through the IPD data points (black circles) correspond to the lines on the basis of the=two-step (adjusted for age and baseline 25(OH)D) and one-step IPD analyses, respectively, and the corresponding 95% prediction bands are shown in gray (the lightest being the band for the one-step IPD analysis). Reproduced with permission from Nutrients.60
In 2011, the IOM released an update on vitamin D intake requirements and reference ranges for vitamin D adequacy as determined by 25(OH)D thresholds, specifically focused on the United States and Canada.38 The RDAs set by the IOM committee were based on the average, long-term daily vitamin D intakes required to maintain 25(OH)D above 50 nmol/L for the majority of the adult population; by definition, RDAs exceed the actual requirements of 97.5% of the population.61 In 2016, the EFSA set adequateintakestomaintain25(OH)Dat50nmol/L or above in 97.5% of the population, whereas the SACN set a recommended nutrient intake (RNI) at the average amount required to ensure 97.5% of the population maintain 25(OH)D above 25 nmol/L. Several other government agencies have set intake recommendations on the basis of the 50 nmol/L target (Table 2). Some countries rely on or adapt recommendations from the WHO/Food and Agricultural Organization (FAO) (e.g., Singapore)62 or the IOM (e.g., Turkey),63 or take a blanket approach that assumes sufficient vitamin D from sunlight and offers recommendations if exposure to sunlight is minimal (e.g., India recommends 10 μg/day under these circumstances64).
The majority of guidelines, including those from the WHO, do not recommend higher vitamin D dietary intake during pregnancy or lactation—Japan and Belgium are exceptions to this norm.65,66
While some guidelines recommend higher intakes for the elderly, EFSA and SACN do not do so on the basis that recommended intakes assume minimal sun exposure and therefore the requirements of higher risk groups are met by the recommendations. Some academic, clinical, and special interest groups (e.g., the International Osteoporosis Foundation and the Endocrine Society) have released statements and recommendations on vitamin D intakes that advocate higher 25(OH)D cutoffs and dietary or supplemental vitamin D intakes.54
Guidelines usually assume minimal sun exposure, and thus for individuals with regular exposure to UVB-containing sunlight, the dietary requirement for vitamin D may be lower. Exceptions to this are the Nordic recommendations, which suggest a higher intake (20 μg/day) if cutaneous synthesis is restricted, and the Japanese recommendations, which assume adequate sun exposure. Populations in periequatorial regions can be at risk of vitamin D deficiency because of clothing or behavior (sun avoidance or indoor working), as discussed further below.
The reports and recommendations reflect a wide range of thresholds for deficiency and sufficiency, and recommended intakes or supplementation doses. These differences relate to variable terminologies that are not always directly comparable—differences in the interpretation of evidence linking health outcomes to vitamin D intakes and/or 25(OH)D, the strength of that evidence, and differences in the modeled dose–response relationship. In particular, different modeling techniques based on aggregation of group mean 25(OH)D values (e.g., IOM and EFSA) versus individual participant response data (SACN) from randomized controlled trials (RCTs) contribute importantly to the variability in estimates of dietary requirements.60
On the basis of disparate interpretations of what constitutes adequate vitamin D status, it is unsurprising that recommended intakes are the subject of considerable debate. Indeed, many researchers and physicians have argued that current recommended dietary intakes are too low to reliably raise 25(OH)D of insufficient persons into the range of sufficiency. The dose–response data used to calculate intake recommendations are generally derived from studies of Caucasian adults and elderly individuals, and include limited data from dark-skinned populations, children, and pregnant or lactating women. Recent studies in children67 and adolescents68 have aided in our understanding of potential variability in the dose–response in specific age groups, and the working group acknowledged that intake recommendations may require revision to align with new data in the future.
Safety and upper intake level
The establishment of vitamin D requirements and target 25(OH)D concentrations must also consider the risk of toxicity at very high intakes or extremely elevated 25(OH)D. Vitamin D toxicity results in hypercalcemia and/or hypercalciuria, which may be accompanied by impaired renal function and increased intestinal absorption of calcium and bone resorption.55,69
Vitamin D toxicity does not arise from endogenously synthesized vitamin D in the skin but may be an effect of prolonged intake of excessive supplemental doses, and in rare cases has been caused by excessive food fortification. Case studies have shown that 50,000–300,000 IU/day of vitamin D supple mentation can cause hypercalcemia within a few weeks.70–72 Recently, there have been reports of toxicity in some countries attributed to increasing use of vitamin D supplements; for example, 25(OH)D > 250 nmol/L was found in 4% of hospital patients in one study in India.73 Some trials have also suggested that very high bolus oral doses of vitamin D (e.g., 500,000 IU annually) may increase the risk of fractures, and high dosages were associated with an increased risk of falls in the elderly.74
The IOM and EFSA recommend an upper intake level (UL) for vitamin D of 4000 IU/day in adults and children 9 (IOM) and 11 (SACN, EFSA) years of age and older.13,38,53 The IOM is the only major consensus group to have formally designated a threshold 25(OH)D above which there were concerns of adverse effects (125 nmol/L). The present group considered the IOM threshold of concern at 125 nmol/L to be overly conservative (too low). A published review of vitamin D safety concluded that 25(OH)D < 220 nmol/L poses no known risk of harm;69 furthermore, available data indicate that some individuals attain 25(OH)D > 125 nmol/L naturally from UVB exposure.75 There was general agreement in the group that 25(OH)D > 200 nmol/L should be avoided to reduce the risk of hypercalcemia and other complications of vitamin D toxicity, although such complications are only likely to arise at 25(OH)D well above this threshold.76
Consequences of vitamin D deficiency
Bone and musculoskeletal effects are the most commonly studied outcomes of vitamin D deficiency, yet an increasing number of studies have suggested that vitamin D may influence other important health outcomes in infants, children, and pregnant and lactating women. In particular, emerging data have linked vitamin D deficiency to some adverse pregnancy outcomes, acute respiratory infections (ARIs), and asthma.
Rickets and bone health in children
Nutritional rickets has re-emerged as a disease of public health importance in both high- and low-income countries. To address this increasingly recognized condition, the Global Consensus Recommendations on Prevention and Management of Nutritional Rickets were published in 2016.35 This multidisciplinary group of experts conducted a systematic review of the literature and provided 46 evidence-based guideline recommendations. The guidelines were primarily targeted toward clinicians who care for children with rickets and to health policy makers who implement public health recommendations. Much of the evidence discussed below was included in the formulation of the 2016 rickets guidelines, which directly informed the discussion and conclusions of the present group.
At a cellular and metabolic level, nutritional rickets is a disorder of defective chondrocyte differentiation and mineralization of the growth plate caused by low vitamin D status or inadequate calcium intake in children. A clinical diagnosis of nutritional rickets is suspected on the basis of history and physical examination, supported by biochemical testing and confirmed radiographically. The clinical morbidity associated with nutritional rickets includes impaired linear growth, chest wall deformity pre-disposing to pneumonia, fractures, bone pain, leg deformities with resultant disability, developmental delay of gross motor skills, and potentially lethal outcomes like hypocalcemic seizures, cardiomyopathy, and cardiac arrest.77–81 Biochemical features of nutritional rickets include an elevated ALP, low serum phosphorus and calcium, and elevated PTH. Of these biomarkers, elevated ALP is the most sensitive biochemical feature, and in its absence, active rickets is unlikely.36,82
Radiographs of the wrists or knees are obtained to confirm the diagnosis of active rickets. Radiography is often more widely available than reliable biochemical testing in some low-resource settings, and radio-graphs are sufficient to make a diagnosis of rickets (Fig. 3). A 10-point radiographic severity score is useful for assessing the severity of rickets,83 and it can be used to objectively measure improvement or response to treatment and to compare the severity of rickets between subjects. The radiographic severity score has been widely utilized and validated in multiple populations for the diagnosis of rickets.84–86
Figure 3.
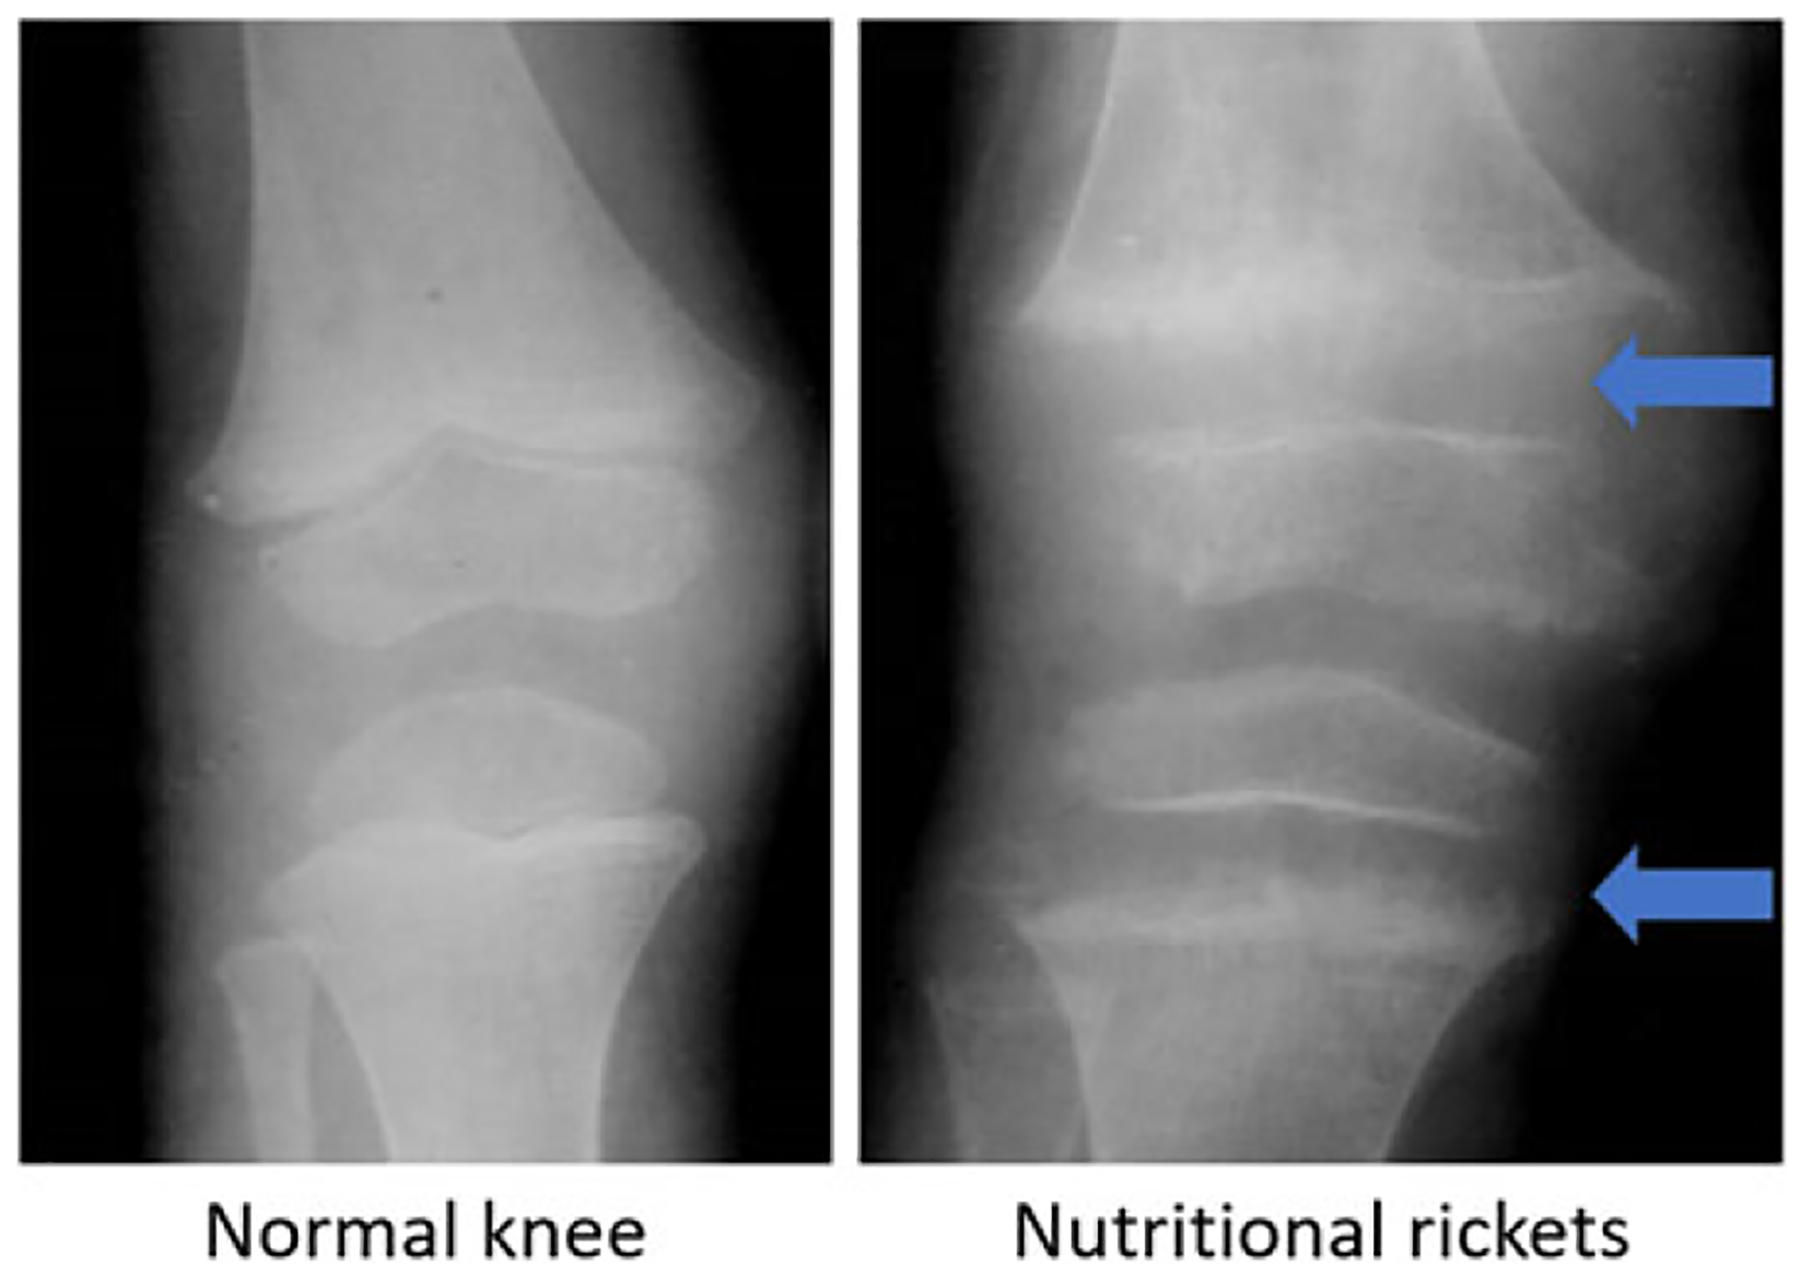
Radiographs of a normal knee (left) and a knee with nutritional rickets (right). The arrows indicate the regions with the widening of the growth plate and the frayed margins.
Nutritional rickets can result from inadequate vitamin D (reflected by low 25(OH)D), very low dietary calcium intake, or a combination of both vitamin D and calcium deficits. The interaction of vitamin D and calcium to maintain bone mineralization is such that an adequate intake of either one will compensate to some extent for suboptimal intake of the other. However, rickets can develop when both calcium intake and vitamin D status are low, even in the absence of overt biochemical vitamin D deficiency.87 In rickets primarily due to vitamin D deficiency, 25(OH)D is generally below 30 nmol/L and often undetectable. In general, 25(OH)D > 30 nmol/L is sufficient for preventing nutritional rickets in the presence of an adequate calcium intake.82
Risk factors for nutritional rickets are primarily the same factors that are associated with vitamin D deficiency. For example, since people with dark skin pigmentation require longer duration of UVB exposure to produce the same amount of vitamin D as those with lighter skin, the vast majority of rickets cases occur in children with dark skin.88,89 Factors that limit children’s UVB exposure (e.g., staying indoors, clothing,90 cloud cover, and air pollution) also raise the risk of rickets. Maternal vitamin D status is a dominant determinant of neonatal vitamin D status,10 and therefore severe maternal deficiency can result in congenital or neonatal rickets.91,92 Breast milk usually has low concentrations of vitamin D (40 IU/L or 1 μg/L) unless the mother is receiving high-dose vitamin D supplementation, so extended breastfeeding can lead to rickets in otherwise low-risk infants or infants with minimal sunshine exposure, unless the infant receives vitamin D supplementation or complementary foods with vitamin D and calcium.88,93
Nutritional rickets has been widely reported in tropical countries of Africa and the Indian sub-continent, where sunlight is abundant but calcium intakes may be very low.94–96 In contrast to vitamin D–deficiency rickets, which can present in the first year of life, calcium-deficiency rickets more commonly presents after the first year, particularly in settings where dairy intake is limited. During infancy, the infant’s calcium requirements can usually be met by breast milk or infant formula.38 From 1 to 4 years of age, the estimated average calcium requirement is approximately 500 mg/day,97 and this intake level should be sufficient to prevent calcium-deficiency rickets in most children.
Nutritional rickets is effectively treated with the combination of oral vitamin D and calcium for at least 12 weeks until healing is confirmed radiographically.98 Common dosing is 2000 IU/day of vitamin D and 500 mg/day of elemental calcium, although this may vary on the basis of etiology and response, and some children require a longer duration of treatment.35 Daily doses of vitamin D2 or D3 are equally effective, but vitamin D3 may be preferred for single large doses owing to its longer half-life.99 Vitamin D is preferentially given orally but may also be administered by intramuscular injection if necessary.35
The IOM and the Global Consensus Recommendations on Prevention and Management of Nutritional Rickets recommend vitamin D intakes of 400 IU/day in infancy to prevent nutritional rickets and vitamin D deficiency in otherwise healthy infants with adequate calcium intakes.35,38 After 12 months of age, the IOM recommends an intake of 600 IU/day (RDA) for children, adolescents, and adults through supplementation or fortified foods, assuming minimal endogenous production from sunlight exposure. These intakes are likely sufficient to maintain 25(OH)D concentrations above 50 nmol/L in most healthy children,67,100 thereby essentially preventing rickets. IOM recommendations for women of childbearing age, including during pregnancy, are the same as the general recommendations for adults (600 IU/day). Maternal prenatal intakes of at least 400 IU/day are expected to be sufficient to prevent congenital rickets; however, other benefits to the woman or newborn are unclear (discussed in further detail below).
In summary, nutritional rickets is a preventable disease with serious health consequences. Public health strategies to ensure adequate vitamin D and calcium intakes in infancy and early childhood can help to eradicate nutritional rickets. Targeting at-risk groups can mitigate the burden of disease, and case identification can be useful for monitoring the effectiveness of rickets prevention efforts.
Although numerous studies have addressed the relationship between vitamin D status and indicators of bone health (e.g., bone mineral content, fractures, and intestinal calcium absorption) in children and adolescents without rickets (e.g., Refs. 101,102), working group members did not identify new evidence related to these outcomes that warranted a modification to the general agreement on 25(OH)D cut-points or dietary intake recommendations for young children.
Osteomalacia and bone health in older adults
Osteomalacia is a bone disease in adults that results from defective mineralization due to inadequate calcium or phosphorus availability or excessive calcium resorption from bone, most commonly due to severe vitamin D deficiency. Osteomalacia is the adult disease most similar to rickets in children; however, the majority of research into the effects of vitamin D deficiency on musculoskeletal health in adults has considered falls, osteoporosis, and their consequent risks of fractures as the primary functional outcomes of interest,103 largely because of the large overall contributions of these conditions to morbidity and healthcare costs in high-income countries.104
Several large studies of vitamin D in older adults—the InCHIANTI study with participants in Chianti, Italy;105 the Progetto Veneto Anziani (Pro.V.A.) study with participants from Northeastern Italy;106 the National Health and Nutrition Examination Survey (NHANES) III;107 and the Lon gitudinal Aging Study Amsterdam (LASA)108—have shown a relationship of low 25(OH)D to physical performance measures. A possible mechanism by which vitamin D may influence the risk of falls is through its effects on muscle strength, muscle function, and balance, but this could be due to reverse causality. RCTs of vitamin D supplementation on physical performance are inconsistent; a recent meta-analysis found that the most significant effect of vitamin D supplementation on muscle strength was in those over 65 years with baseline 25(OH)D levels lower than 30 nmol/L, although the overall effect size was small.109
The role of vitamin D in adult bone health has been a major focus of research in high-income countries; however, the working group considered that the inconsistent evidence of benefits of vitamin D in the prevention of falls or fractures in older adults suggested that these conditions would be unsuitable as proxy indicators of population vitamin D deficiency or as indicators of the response to public health interventions such as vitamin D fortification or supplementation.6
Pregnancy and lactation
Vitamin D–deficient mothers give birth to babies who are themselves deficient in vitamin D and are thus at risk of hypocalcemia and congenital rickets.91,92,110 While many pregnant women in high-income countries take prenatal vitamins containing at least 400 IU/day of vitamin D, the WHO does not currently recommend routine supplementation of pregnant women other than to treat vitamin D deficiency.111 Anecdotally, physicians and researchers working in countries where rickets is prevalent often support routine maternal supplementation with vitamin D during pregnancy to ensure a minimum total intake of 400–600 IU/day, including supplements.
Over the past 20 years, there have been numerous studies probing the potential effect of maternal vitamin D status on pregnancy complications, such as pre-eclampsia and preterm birth, and birth and early infant outcomes including low birth weight and stunting in the first year of life. In 2016, a Cochrane Review found evidence that vitamin D supplementation during pregnancy may reduce the risk of pre-eclampsia, preterm birth, and low birth weight.10 Yet, the evidence has been insufficient to prompt the WHO to recommend supplementation during pregnancy to protect against these adverse outcomes. An updated systematic review and meta-analysis, including trials published up to September 2017, did not support earlier findings of an effect of prenatal vitamin D supplementation on preterm birth but did suggest the following potential benefits: increase in mean birth weight, reduced risk of small-for-gestational age (SGA), increase in length at 1 year of age, and a reduced risk of offspring asthma or recurrent/persistent wheeze up to 3 years of age.9
The working group agreed that there is a need for additional RCTs that are carefully designed and adequately powered to yield precise estimates of the dose-dependent effects of prenatal and/or postpartum vitamin D supplementation on key maternal and infant outcomes of public health relevance, including pre-eclampsia, gestational diabetes, preterm birth, SGA, low birth weight, and postnatal infant growth. Some trial findings suggest that vitamin D may have effects on fetal and infant growth,9 which suggests that improvements in prenatal vitamin D status could contribute to reductions in the prevalence of low birth weight and stunting, two of the WHO nutrition targets for 2025.112 However, a large placebo-controlled dose-ranging trial of prenatal (beginning in the second trimester) and postpartum maternal vitamin D supplementation in Bangladesh showed no effects of vitamin D on fetal or infant growth parameters.113 Nonetheless, new trials with earlier initiation of supplementation (first trimester or periconceptional) may be considered in other settings where fetal growth restriction and linear growth faltering are prevalent (i.e., South Asia and Africa). Trials are expected to have the greatest impact in populations in which vitamin D deficiency in pregnancy is highly prevalent; alternatively, women with vitamin D deficiency could be specifically targeted for trial participation.
The working group highlighted the importance of interactions of vitamin D with other nutrients (e.g., vitamin A, calcium, magnesium, folate, and iron) during pregnancy and lactation. It is expected that the effect of prenatal vitamin D on skeletal outcomes (including linear growth and the risk of rickets in infants) may depend on calcium nutriture. Furthermore, prenatal calcium supplementation (1–2 g/day) has been shown to reduce the risk of pre-eclampsia114 and is currently recommended by the WHO in settings of low dietary calcium intake.111 Factorial-design trials to directly examine combined vitamin D–calcium effects on maternal and infant outcomes would be ideal but would entail substantial complexity and cost.
Vitamin D is secreted into breast milk, but the concentration depends on the lactating woman’s regular vitamin D intake. High-dose maternal supplementation (4000 IU/day or higher) may be required to boost vitamin D content in breast milk enough to ensure that the equivalent of 200–400 IU/day is transferred to the exclusively breastfeeding infant.115,116 In both high- and lower-income countries, maternal supplementation may be preferred to infant supplementation; for example, mothers in a U.S. study preferred supplementing themselves rather than offering a supplement to their baby.117 Maternal supplementation may also be viewed by public health officials in many contexts as being consistent with efforts to promote exclusive breastfeeding.
The present working group supported further clinical research, including dose–response RCTs, to establish a safe and effective maternal postpartum vitamin D supplementation regimen that could be offered as an alternative to direct infant vitamin D supplementation. In settings where early childhood rickets is a public health concern (i.e., prevalence >1%) but infant vitamin D supplementation is not yet guided by national policies (i.e., South Asia), the introduction of maternal postpartum supplementation may offer considerable advantages with reference to public and professional acceptance and adherence in the context of ongoing broad-based efforts to promote exclusive breastfeeding.
Acute respiratory infections, asthma, and tuberculosis
Strong evidence recently emerged linking vitamin D deficiency to adverse respiratory outcomes, particularly asthma exacerbations118,119 and tuberculosis (TB) reactivation, likely mediated by the immune modulatory effects of vitamin D.120 Recent meta-analyses show that vitamin D supplementation can decrease the frequency of upper respiratory infections (URIs)3 and asthma exacerbations.119,121 ARIs are the most common form of infectious disease in children under 5 regardless of economic status.122 Upper respiratory infections constitute most cases, and, while they are not a significant cause of mortality, economic and productivity losses due to illness are significant. Acute lower respiratory infections (LRIs) cause an estimated 2.8 million deaths per year, and TB causes 1.7 million deaths per year.123 An estimated 300 million people worldwide live with asthma, and 250,000 people die annually from complications of the disease, primarily from acute asthma attacks (termed exacerbations).124 Thus, reducing the disease burden from respiratory infections and asthma could have a significant global impact in lowering overall mortality.
Vitamin D may have a role in the prevention of ARI and asthma exacerbations or as an adjunctive therapy in patients receiving conventional antimicrobial treatment for TB. To date, the majority of RCTs investigating the efficacy of vitamin D to prevent ARI have focused on acute URIs rather than LRIs, despite the fact that LRIs impose a much larger mortality burden.124 A recent meta-analysis of IPD from more than 11,000 participants in double-blind, randomized, placebo-controlled trials showed that vitamin D supplementation is effective in reducing the frequency of URIs and that the strongest protective effects were evidenced by those participants who began the study with baseline circulating 25(OH)D concentrations <25 nmol/L.3 The conclusion that those with vitamin D deficiency reap the largest benefit from supplementation is consistent with the lack of effect of higher dose vitamin D on URI incidence in a recent randomized trial of 2000 versus 400 IU/day during the winter in Canadian children in whom the mean baseline 25(OH)D was high (~90 nmol/L).125 However, few of the trials to date have been conducted in communities with elevated rates of LRI-related mortality. Some RCTs of vitamin D for the treatment or prevention of LRIs in children have used intermittent bolus dosing rather than daily dosing, which may explain their null results.126–128 The working group discussed that phase 3 RCTs of daily or weekly vitamin D supplementation to prevent LRIs in young children in LMICs are a research priority.
Meta-analysis of vitamin D supplementation trials for the management of asthma revealed a significant reduction in the frequency of asthma exacerbations that required corticosteroid treatment, as well as a significant reduction in severe episodes requiring emergency medical attention.119,121 Protective effects of vitamin D supplementation against asthma exacerbation are likely to be mediated at least in part by induction of innate immune responses to respiratory viruses that commonly trigger such events. Of note, the majority of RCTs contributing to these meta-analyses were conducted in patients with mild-to-moderate asthma; thus, new primary trials are needed to determine whether vitamin D can also reduce exacerbations in patients with severe asthma. Meta-analysis of two recent trials of maternal prenatal vitamin D supplementation demonstrated a significant reduction in the incidence of offspring recurrent or persistent wheeze by 3 years of age;130 follow-up of these prenatal RCTs for effects on asthma incidence in the children at 5–6 years is ongoing.
Vitamin D may also have a role in the prevention of Mycobacterium tuberculosis infection, prevention of active TB, or as an adjunctive therapy to enhance response to antimicrobial treatment of active TB disease. Two phase 3 RCTs of vitamin D for the prevention of M. tuberculosis infection are currently ongoing, one in Mongolia131 and the other in South Africa;132 results are expected from 2020 onward. A single phase 3 RCT of vitamin D to prevent active TB in HIV-infected adults is ongoing in Tanzania,133 but RCTs of vitamin D to prevent active TB in HIV-uninfected people are needed. RCTs of adjunctive vitamin D to enhance response to antimicrobial therapy have tended to yield null results for sputum culture conversion outcomes in drug-sensitive disease.128 However, subgroup analyses indicate possible benefits of adjunctive vitamin D in patients with multidrug-resistant TB.134,135
Global prevalence of vitamin D deficiency
Although several recent review papers have highlighted the global extent of vitamin D deficiency, there are significant data gaps, especially for LMICs.57,136–138 Representative population-level 25(OH)D data are not available for most countries, and the surveys that do exist often present an incomplete picture of vitamin D status and its determinants (i.e., lacking complementary data related to dietary intake, UVB exposure). Additionally, as described above, 25(OH)D may be measured using several different assays that vary in their accuracy and precision, and so results vary widely between assays and between laboratories. The lack of standardization in laboratory methods complicates efforts to synthesize population-level data or make comparisons between studies overtime. Direct comparisons between studies are further complicated by the way data are reported and cutoffs are used (e.g., percent of the population below 30 nmol/L versus below 50 nmol/L).
Available data from a recent review of vitamin D status worldwide suggest widespread vitamin D deficiency, regardless of a country’s human development index and latitude; in some cases, vitamin D deficiency persists despite fortification policies that aim to ensure adequate intake57 (see below for discussion of the challenges with fortification). Unfortunately, data regarding vitamin D status and prevalence of deficiency were mainly from outdated (>10 years old) and/or relatively small studies of selected samples, rather than large representative population-based surveys. Nonetheless, there was consistent evidence suggesting that the prevalence of vitamin D deficiency is highest in Asia, the Middle East, and Africa, as well as among immigrants from these regions living in countries at higher latitudes.139 It should be noted that calcium intake tends to be low in these regions, increasing the risk of rickets and other bone diseases related to vitamin D deficiency.84,94,95 Numerous small studies in Asia have found that the majority of young infants have 25(OH)D below 30 nmol/L: for example, 51% of infants in Turkey, 86% of infants in Iran, 61% in India, and 61% in Pakistan.57 In studies that were not population based, pregnant and/or lactating women in Asia and the Middle East have also been found to have high risks of deficiency: for example, 50% in Turkey, 45% in Pakistan, and 60% in India. Table 3 shows the vitamin D status data for a few selected LMICs where substantial 25(OH)D data are available, using the United States as a comparison.57
Table 3.
Data on serum 25(OH)D levels in infants, adults, and pregnant or lactating women in selected countries on the basis of a systematic review of published studies57
| Country | Survey year(s) | N | <30 nmol/L | <50 nmol/L |
|---|---|---|---|---|
| United States | ||||
| Infants229 | 1997–2001 | 400 | — | 46% (black), 10% (white) (<37.5 nmol/L) |
| Adults230 | 2001–2006 | 23,424a | 6% | 34–37% |
| Pregnant/lactating women231 | 2001–2006 | 928 | — | 33% |
| India | ||||
| Infants232 | 2006–2007 | 342 | 61% | 99% |
| Adults233 | 2010 | 441 | — | 66% |
| Pregnant/lactating women232 | 2006–2007 | 541 | 60% | 96% |
| Iran | ||||
| Infants59 | 2002 | 258 | 86% | 93% (< 35 nmol/L) |
| Adults234 | 2010 | 1111 | — | 51% |
| Pregnant/lactating women59 | 2002 | 552 | — | 67% (< 35 nmol/L) |
| Turkey | ||||
| Infants58 | 2008 | 258 | 51% | 90% |
| Adults | — | — | — | — |
| Pregnant/lactating women58 | 2008 | 258 | 50% | 90% |
Indicates data are nationally or regionally representative.
Studies in LMICs that have examined differences between men and women (Jordan, Sri Lanka, Vietnam, Mexico, and Nigeria) or boys and girls (Mexico and Malaysia) have consistently shown that women and girls had lower average 25(OH)D than their male counterparts. This is largely thought to be based on differences in occupation, clothing, and cultural practices that predispose women in these countries to lower vitamin D status rather than biological differences in vitamin D metabolism between males and females.57
A population’s burden of vitamin D deficiency can also be evaluated on the basis of prevalence of rickets in childhood and early adolescence (<15 years old). The prevalence of nutritional rickets appears to be greatest in Asia, the Middle East, and Africa, ranging from 1% to 24% in children.82,140–143 However, nutritional rickets has recently re-emerged in high-income countries (Table 4), with prevalence figures ranging from 3 to 120 per 100,000 children.88,139,144,145 In high-income countries, the overall increasing prevalence of rickets may correspond with an increase in ethnic minority, immigrant, and refugee populations, with reported prevalence rates of 60–2300 per 100,000.146 Less is known about the prevalence of the acutely life-threatening complications of nutritional rickets, such as hypocalcemic seizures78,147 and cardiomyopathy.148,149 Rickets surveillance programs, particularly in LMICs, would significantly improve these estimates and enable the identification of communities with the greatest need for a vitamin D intervention.
Table 4.
Prevalence of rickets in selected high-income countries, overall and among high-risk groups of children with dark skin pigmentation (including immigrant and refugee groups)146
| Incidence of rickets (per 100,000) | ||
|---|---|---|
| Country | Overall | High-risk groupsa |
| Unites States | 24 | 220 |
| United Kingdom | 8 | 95 |
| Australia | 5 | 2300 |
| Denmark | 3 | 60 |
High risk refers to dark-skinned children (including immigrants and refugees) living in high-income countries, according to the authors of the source publication.146
Groups at highest risk of vitamin D deficiency
Vitamin D deficiency affects individuals in all age groups worldwide; however, diet, supplement use, age, geographic latitude, cultural and lifestyle factors, skin pigmentation, and individual differences in vitamin D metabolism increase or decrease individual risk of deficiency.26,57,146,150 Exclusively breastfed infants, dark-skinned individuals, older adults, and people with habitually limited sun exposure are at particularly high risk for vitamin D deficiency.82,151,152
The vitamin D status of infants depends on maternal prenatal vitamin D status, intake of breast milk and its vitamin D content (~40 IU/L unless women have large intakes of vitamin D during lactation), sunlight exposure, and vitamin D supplements.151 As safety concerns and cultural norms typically limit infant exposure to sunlight, infants are particularly vulnerable to deficiency during the first year of life if maternal vitamin D status is not adequate and if neither infants nor their breastfeeding mothers receive supplements.54
Skin pigmentation and lifestyle are important determinants of vitamin D status. Darker skinned individuals require longer periods of exposure to UVB to generate a given amount of vitamin D compared with lighter skinned individuals.153 Regardless of natural skin pigmentation, use of sunscreen or wearing clothing that covers most of the skin can contribute to low 25(OH)D.154 Older adults with limited mobility are also at risk, as are individuals who spend most of the day indoors.106,108
It is estimated that one minimal erythemal dose of UV radiation, resulting in a slight pinkness to most of the body, yields 10,000–25,000 IU of vitamin D.155 However, numerous ecological factors including high latitude and poor air quality may attenuate UVB exposure. Cities at latitudes >35° receive little or no UVB radiation during winter months (the duration of this “vitamin D winter” period increases with increasing latitude), making vitamin D synthesis from sunlight nearly impossible, even when skies are clear.156 In regions with ample year-round UVB exposure, dense cloud cover or atmospheric pollution can interfere with vitamin D synthesis.157,158 The working group therefore concluded that there is a significant risk of vitamin D deficiency in populations living in tropical or relatively low-latitude countries, which includes most LMICs.
Interventions to reduce the prevalence of vitamin D deficiency and related diseases
The high prevalence of vitamin D deficiency in many countries has led to the development and implementation of a variety of food fortification and supplementation policies and programs aimed at reducing the burden of vitamin D deficiency, and in particular the prevalence of childhood rickets.
Fortification of staple foods with vitamin D
Fortification is a recommended strategy to improve population micronutrient status.159 The working group agreed that fortification of food with vitamin D would be an effective population-based approach to closing the gap between current recommendations and population intakes. As with all fortification initiatives, the identification of a widely consumed, fortifiable, and culturally appropriate vehicle is essential to ensure the success of a vitamin D fortification program.
Mandatory versus voluntary fortification.
Fortification can be included in national legislation as mandatory (i.e., 100% of the identified food product must be fortified by law) or voluntary (i.e., industry is at liberty to make the decision to fortify the specified food but must comply with the required level of fortification if they choose to fortify).159 Government-mandated fortification of a food staple is the most effective method of increasing the dietary intake of a particular nutrient in the general population.159,160 Currently, there is mandatory vitamin D fortification of milk and infant formula in Canada, and the United States mandates vitamin D fortification in nonfat dry milk, evaporated milk, and infant formula. These policies have been under government regulation for over 40 years in Canada and almost 90 years in the United States.161 This approach has proved effective in the prevention of most cases of rickets.162,163 Effective fortification programs depend on industry compliance, which is most readily achieved when compliance is incentivized and enforced. Government oversight can also ensure a safe level of fortification with appropriate formulations of vitamin D.164
Voluntary fortification is less likely to produce an impact on micronutrient status, as it does not create a level playing field for food producers, thereby increasing the risk that industry may focus on higher cost or niche products rather than ones aimed at higher risk consumers who have limited vitamin D intake from other sources.165 Voluntary or discretionary food fortification has been shown to be less effective in reaching entire populations in LMICs, such as in India, in part because many staple foods are procured from numerous small-scale suppliers rather than from a small number of centralized producers.166 Voluntary fortification in high-income countries has also been shown to be less reliable and can result in misguiding consumers to over- or underconsume vitamin D, as variations in vitamin D content can occur among similar food products from different manufacturers.167,168
Approach to the selection of food staples for mandatory fortification with vitamin D.
Careful selection of food vehicles for mandatory fortification is critical to ensure that a substantial proportion of the population regularly acquires and consumes the foods to be fortified. Establishing the predominant pattern of food or ingredient use in a country is crucial before selecting a food vehicle for fortification (Fig. 4).169 Optimal food vehicles selected to deliver adequate dietary vitamin D to the majority of the population are those that are frequently consumed population wide, affordable, and accessible in both urban and rural areas. Ideally, there should be low variability in the amounts consumed to limit the risk that some individuals may consume more than the tolerable UL of the nutrients included in the fortification program. Foods need to be industrially processed and widely distributed by a reasonably small number of manufacturers to facilitate proper training and continued monitoring of industry compliance. In many LMICs, a major challenge is that food staples and/or food ingredients are often produced by multiple small-scale producers or in the households themselves, which are less likely to be able to participate in either voluntary or mandatory fortification schemes. Other important considerations include the vitamin D stability during processing, cooking, and storage of the fortified food staple. Similarly, it is important to anticipate the storage conditions of the food at point of purchase. In LMICs, many markets sell small quantities of food from bulk sacks or drums, potentially incurring prolonged storage under conditions that are suboptimal for the stability of fortificants. An additional beneficial property of a vehicle is its suitability for cofortification with vitamin A, calcium, and/or other limited micronutrients of interest for public health programs. Detailed country- or region-specific data about the types and frequency and amounts of consumption of candidate foods (dietary intake patterns), and the extent to which the products will reach the entire population and targeted subgroups, are needed to select an acceptable food for fortification in each context.170,171 Country or region-specific information about current vitamin D intake levels are also needed to set appropriate levels of fortification. The vitamin D used in the fortification premix must be bioavailable and effectively delivered, meaning that typical consumption patterns result in appropriately increased mean serum 25(OH)D concentrations. Other important issues include the vitamin D stability during processing, transport, storage (in the market and the home), and cooking of the fortified food item (see below).
Figure 4.

Edible oil that is used, fortifiable, and fortified with vitamin A. Examples of household utilization of edible oil (dark gray bars), as reported in the Fortification Assessment Coverage Toolkit (FACT) surveys, by potential for fortification (fortifiable, light gray bars), and actual content of fortificant (fortified, white bars).169 Oil fortification was voluntary in India but mandatory in all other settings shown. Adapted from Aaron et al.169
Primary considerations for food fortification vehicles learned from surveys in LMICs include the following. (1) Knowledge of food consumption is necessary to inform fortification programs. Thus, food vehicles for fortification must be selected on the basis of estimates of the proportion of the population likely to be reached and origin of the food used by households. (2) Consumption patterns vary widely among countries, regions, and socioeconomic groups within countries; therefore fortification programs should be designed on the basis of local food consumption patterns, and not extrapolated from data from other contexts. (3) Fortification programs, with few exceptions, require ongoing regulatory monitoring and enforcement to ensure high levels of industry compliance with fortification (Fig. 4).168–171
Fortifiable vehicles.
Vitamin D (as D2 or D3) has been successfully added to a number of lipid-rich or nonlipid-containing food vehicles. At the concentrations required for fortification of many common vehicles, the fortificant ideally should have no adverse organoleptic properties. Vitamin D is a relatively stable micronutrient suitable for fortification, although it is light sensitive, and some losses occur during cooking. Both vitamins D2 and D3 have been shown to withstand baking and cooking at high temperatures, but the magnitude of loss depends on the cooking method and the type of food vehicle.172
Dairy.
Milk is the most commonly fortified food for vitamin D in many high-income countries, largely because it is widely consumed by children and a good source of calcium.173,174 However, dairy intake is low in many countries where vitamin D deficiency is common, notably in the Middle East and parts of Africa.146,175 Even where dairy consumption is culturally acceptable, the low availability and affordability of dairy products suggest that dairy may be limited in its utility as a vehicle for improving vitamin D intake in many low-income or isolated populations.176 Technological barriers to safe and accurate addition of vitamin D to fresh milk may also exist in some countries, whereas smaller local dairy producers may not be able to afford and correctly manage the sophisticated equipment required to add and evenly distribute vitamin D accurately. Of note, the only recorded case of vitamin D toxicity arising from fortification in the United States occurred in a small dairy facility when vitamin D was added manually in excessive unmeasured amounts and not properly mixed for even distribution.177 However, shelf-stable milk may overcome some of the challenges by allowing central facilities to produce large quantities of milk that can be widely distributed with fewer risks for safety and stability. For example, one study showed that fortification levels of 100 and 250 IU of vitamin D per serving of 2% fat ultra-high-temperature pasturized milk were stable over the 60-day shelf life of the product.178
Edible oils.
Vitamin D fortification of foods other than dairy products has been used as an alternative approach in countries where dairy consumption is low because of cost, intolerance, or other factors.179 Water-soluble forms of vitamin D have been developed and are used in North America to fortify fruit juices that are also cofortified with calcium.180 Edible oils are important candidate vehicles for fortification in many LMICs, as they are centrally processed, broadly distributed, and widely consumed by all age groups. However, little is known about the long-term stability of vitamin D added to various edible oils. In one study of soybean oil, vitamin D3 content declined substantially during storage; losses after 2 months were as high as 68% in natural light but only 44% in semidarkness. Vitamin E appeared to promote vitamin D retention, particularly for samples stored in semidarkness.181 Therefore, storage in semidark conditions and with higher antioxidant content, such as vitamin E, is likely to promote vitamin D stability when added to edible oils.
In a recent analysis of coverage of vitamin A–fortified or fortifiable oil in some LMICs, edible oil was reportedly used by the majority of households across Africa and in India.169 Across all surveys, except Abidjan, considerable effort is still required to enforce the fortification program (assessed in this survey for vitamin A content only). As fortification of oil with vitamin A is voluntary in Rajasthan, it was not surprising that only a small proportion of edible oil was actually fortified. These examples illustrate the challenges in selecting fortifiable vehicles that are widely consumed as well as the importance of enforcing mandatory fortification policies.
Cofortification of oil.
The ability to cofortify foods with vitamin D that are already being fortified with vitamin A may be a cost-effective means to increase vitamin D status in settings where vitamin A fortification is already being implemented. Presently, 36 countries mandate or allow voluntary fortification of edible oils with vitamin A alone, and 10 countries mandate or allow voluntary cofortification with both vitamins A and D, as shown in the map in Figure 5. No country mandates or allows fortificiation of oil with vitamin D without also mandating or allowing oil fortification with vitamin A. While cofortification of vitamin A–fortified foods with vitamin D is widely regarded as a cost-effective strategy for improving vitamin D intake, the efficacy of this strategy in raising population 25(OH)D is unknown. Specifically, there are insufficient data from human studies to determine if combining vitamins A and D in oil impedes, enhances, or has no impact on bioavailability or absorption of either nutrient. As edible oils are widely believed to be good vehicles for vitamin A fortification, and facilities and processes to support oil fortification in LMICs are increasingly well established, research into the efficacy of adding vitamin D to vitamin A–fortified oils could be conducted to guide recommendations for countries interested in addressing vitamin D deficiency. As with all fortification programs, the cost-effectiveness of vitamin D fortification programs versus supplementation strategies to correct vitamin D deficiency in specific population groups, particularly those living in LMICs, can be assessed to inform decision making.182
Figure 5.
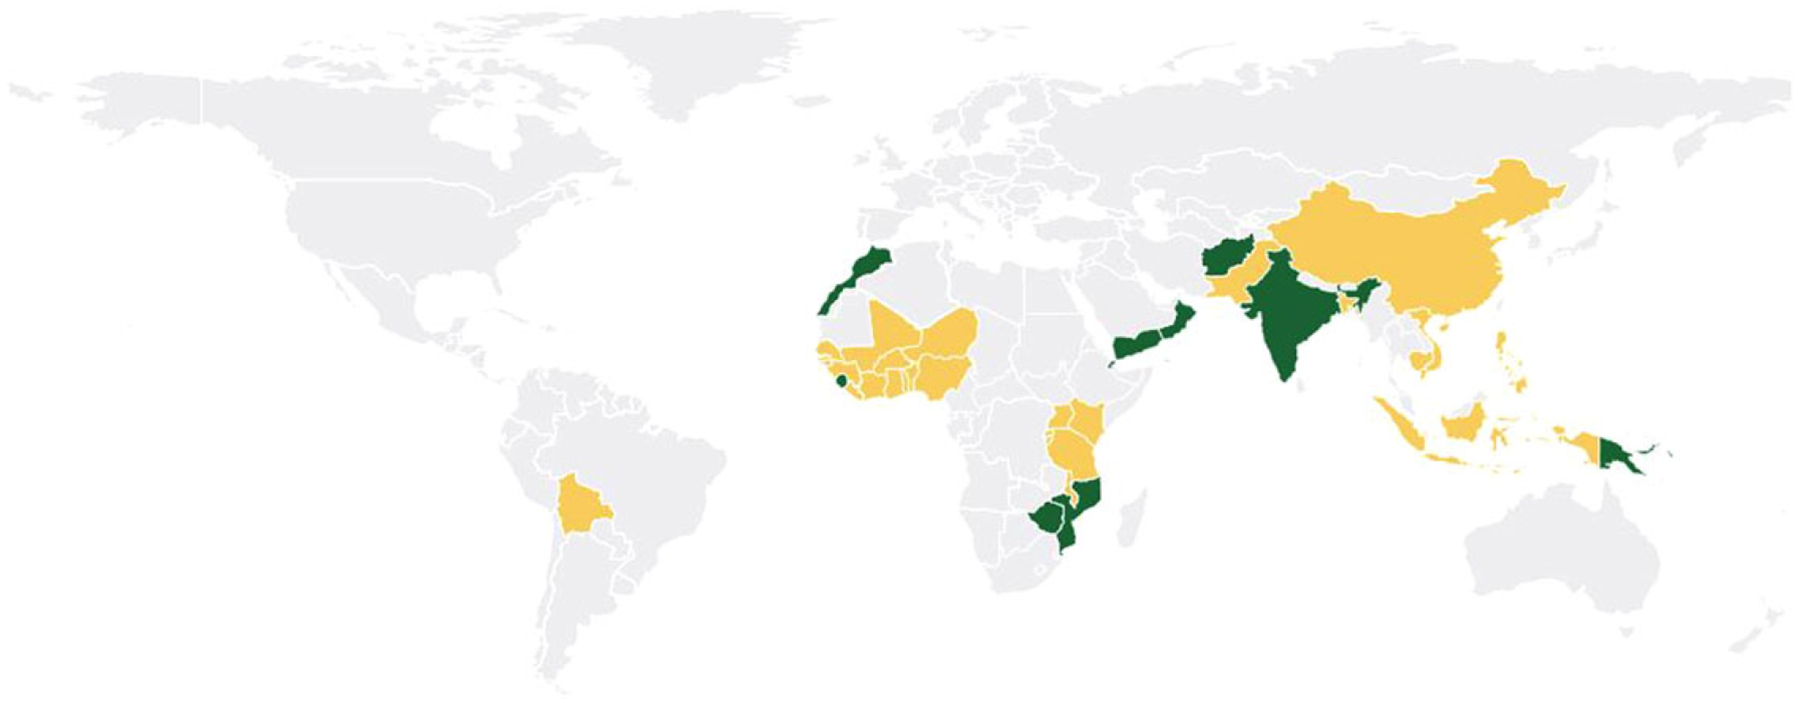
Countries where edible oils are fortified with vitamin A (yellow) or vitamins A and D (green).18 While 36 countries allow fortification of edible oils with vitamin A, 10 countries (Afghanistan, Djibouti, India, Morocco, Mozambique, Oman, Papua New Guinea, Sierra Leone, Yemen, and Zimbabwe) allow mandatory or voluntary fortification with vitamin A, and mandate edible oils to include vitamin D as an optional or mandatory cofortificant in their standards.
Flours—wheat, rice, and maize.
Cereal grain-based food staples including wheat, rice, or maize flour, commercially baked goods, and noodles are fortified in many high-income countries on a voluntary basis and have been proposed as suitable vehicles for mandatory vitamin D fortification in the United States and some European countries.183 For flour fortification, vitamin D in liquid form is spray-dried and added as a powder to flour or baking premixes.184 Clinical trials in Finland, Romania, and Iran provide solid evidence of bioavailability and efficacy of vitamin D from fortified bread.185–188 Many studies using vitamin D–fortified wheat or maize flour in LMICs support the use of these foods as a vehicle for increasing vitamin D intake. For example, biscuits made from multinutrient fortified wheat flour, which included vitamin D, fed to Bangladeshi school children significantly reduced the risk of vitamin D deficiency and other nutrient deficiencies relative to a control group.189 One of the few examples of a national wheat flour fortification initiative that includes vitamin D is the Jordanian wheat flour fortification program, introduced in 2009, which mandates vitamin D fortification at the level of 550 IU/kg (13.75 μg/kg) or approximately 58 IU vitamin D/serving (1.45 μg vitamin D/serving).190 However, the impact of the Jordanian wheat flour vitamin D fortification program is unclear. Fortification of maize flour with vitamin D is an alternative approach but has not been well studied or widely implemented.191
Alternative vehicles and indirect fortification approaches.
Water-soluble forms of vitamin D have been developed and are used in North America to fortify fruit juices that are also cofortified with calcium.180 Other fortification vehicles are under development using techniques such as bio-addition to enhance the vitamin D concentration in foods. For example, sunlight-exposed edible mushrooms show good bioavailability of vitamin D2 in rodents consuming mushroom powder and in humans consuming intact or powdered light-exposed mushrooms.192–194 Scientists in Bangladesh and Africa have proposed using mushroom powder in cereal grain-based bread to improve protein and specific B-vitamin intake.195,196 Edible mushrooms produced from agricultural waste in parts of Africa and Asia are often sun-dried and ground into mushroom flour, a light-exposure process that would also increase the vitamin D2 content of the flour.197 Addition of mushroom flour to bread is an example of a new method of vitamin D fortification called bio-addition that utilizes the addition of a food ingredient or animal feed rich in vitamin D to increase the vitamin D content of the final food product, such as eggs or meat or, in the case of mushroom powder, bread.159 However, the feasibility and potential for population impact of this approach has not as yet been tested in LMICs.
Vitamin D supplementation
Supplementation programs can be implemented to enhance the status of a population, while fortification programs are under development to target specific population subgroups that are inadequately reached by fortification programs. The high vitamin D content of cod liver oil was first recognized in the 1930s, and it remains in use today. However, many other forms of vitamin D supplements are now available in the form of tablets, capsules, and drops (available as single vitamin preparations or combined with other micronutrients). Vitamin D is also included in a number of point-of-use multinutrient fortification products, such as micronutrient powders (MNPs) and lipid-based nutrient supplements (LNSs).
Supplementation as a targeted intervention.
In the United States, vitamin D supplement use in the 2009–2010 NHANES was 35%, with one-third of these supplement users taking a product providing an amount greater than or equal to the current RDA (≥600 IU/day).198 In a study in Canada, lower income segments of the population tended to use supplements less often, even if use would have been justified because of low vitamin D status.199 However, the global extent of vitamin D supplement use is unknown, and few surveys in LMICs have assessed vitamin D supplement intake. In 2014, UNICEF’s Nutridash surveillance system reported that 50 LMICs had public health preventive programs distributing MNPs to children 6 months–5 years of age.200 MNPs often contain vitamin D in the formulation, including the standard formulation used by UNICEF and the World Food Programme, two of the leading global supporters of MNP programs in LMICs. Recent WHO recommendations for MNP use in children 6 months–12 years of age suggest that vitamin D can be added to the formulation up to 100% of the RNI.201 Unlike traditional supplements, MNP and LNS point-of use products are usually mixed into food immediately before serving and thus may be easier to administer to children.
Supplementation of breast-feeding infants with 400 IU/day is widely recommended and practiced in many high-income countries including Canada and the United States.35,38 Nonetheless, WHO does not currently recommend routine vitamin D supplementation in children.202 WHO also does not recommend routine vitamin D supplementation for pregnant women because of a lack of strong evidence of benefits for maternal and fetal health;111 however, vitamin D is included in the supplement formulations used in emergency situations.203
Dosing regimens for vitamin D supplementation.
Vitamin D supplements may be provided daily, weekly, monthly, or less frequently as larger bolus doses. Studies comparing different dosing regimens have attempted to determine whether vitamin D supplements given at different intervals are equivalent in maintaining levels of 25(OH)D. Ish-Shalom et al. found that daily (1500 IU), weekly (10,500 IU), or monthly (45,000 IU) doses all produced similar rises in 25(OH)D.204 By contrast, Chel et al., using lower doses of vitamin D (600 IU daily; 4200 IU weekly; 18,000 IU monthly) among older adults in a long-term care facility, concluded that while all increased 25(OH)D relative to placebo and that differences across groups were minor, there was a distinct order of efficacy (daily > weekly > monthly > placebo), likely related to differences in adherence to the regimens.205
It has been argued that less frequent bolus doses of vitamin D (anything other than daily) might adversely affect tissue distribution of vitamin D in ways that are not captured by measuring only serum levels of 25(OH)D.206 This viewpoint was articulated in response to a well-publicized study that showed that older women who received annual bolus dosing of 500,000 IU vitamin D for 3–5 years experienced more falls and fractures than the placebo group.74 On the other hand, a systematic review and meta-analysis of vitamin D intervention trials concluded that high-dose, intermittent vitamin D therapy did not affect all-cause mortality among these older adults ≥ 65 years of age, nor was there any impact (benefit or adverse effect) observed regarding fractures or fall prevention, when compared to either no treatment or placebo.207 Of note, one study involving a single intramuscular injection of 600,000 IU revealed significant beneficial effects on functional neuromuscular performance, reaction time, and balance after 6 months, although muscle strength or incidence of falls did not improve.208 It is possible that the route of administration (parenteral versus oral) may affect the safety and efficacy of large bolus doses of vitamin D, but at present, it appears that dosing intervals of monthly or more frequently are more reliable and safer for attaining target 25(OH)D concentrations.
Adherence to supplementation regimens.
Oral vitamin D supplementation is effective at raising 25(OH)D to target levels within a few months, but poor adherence with long-term vitamin and mineral supplementation regimens and cost to consumers may limit their practicality. Adherence is influenced by a range of individual, social, and environmental factors, including the personal beliefs and motivation of individuals, their families, and social networks; influence of healthcare workers and others involved in program delivery; and structure of the local healthcare system. Supplementation interventions generally require concomitant behavior change activities to encourage families to appropriately use and benefit from the interventions.209,210 Public education on the risks associated with severe vitamin D deficiency, including rickets, may improve uptake in the general population. Additional potential strategies to simplify regimens and increase adherence with supplementation may include the use of higher dose weekly or monthly vitamin D regimens rather than daily supplementation; incorporation of high-dose, intermittent vitamin D supplements into childhood primary healthcare programs or routine immunization visits (see below);211–214 and supplementation of lactating mothers with high-dose vitamin D instead of direct infant supplementation.215
Incorporating vitamin D supplementation into childhood vaccination programs.
Administering vitamin D supplementation through childhood vaccination programs is a supplementation method that avoids some of the adherence challenges of more frequent dosing. High-dose vitamin A supplements have been successfully combined with immunization campaigns administered to infants/children older than 6 months of age to provide a sustainable channel for delivering critical nutrients to children in developing countries. The safety and efficacy of vitamin A have been well studied in combination with vaccines, but adequate studies to guide potential adoption of this model for delivery of vitamin D have not been conducted as extensively.216
Several studies have investigated the potential impact of vitamin D status on vaccine response, including influenza217,218 and BCG vaccines,219 with mixed findings. Additional research is required to clarify these relationships and to determine whether high-dose vitamin D codelivered with vaccines hinders, enhances, or has no effect on the safety and long-term effectiveness of childhood immunizations. In particular, the effects of vitamin D supplementation on host response to immunization are poorly understood, and controlled studies in populations with a range of baseline 25(OH)D concentrations are needed to evaluate effects of vitamin D supplementation in response to vaccines designed to elicit both humoral and cell-mediated protection.
In summary, the working group supports fortification as the preferred method to increase a population’s vitamin D status. Fortification of widely consumed fortifiable vehicles is most effective when the program is mandatory and enforced. The working group agreed that supplementation may be important for identifiable target populations (e.g., breastfed infants) and in settings where fortification is impractical.
Roadmap for action: a stepwise approach
Raising both public and professional awareness of the risk factors and consequences of deficiency is essential to ameliorating the disease burden caused by vitamin D deficiency in LMICs. Numerous expert panels, including the present working group and the recent Global Consensus Recommendations on Prevention and Management of Nutritional Rickets, seek to draw attention to these issues and how they can be solved through fortification and supplementation. Collaboration among international and national organizations will enable the estimation of the prevalence of vitamin D deficiency, planning and implementation of appropriate context-specific interventions, and monitoring and evaluation of the effectiveness of the programs (Table 5).
Table 5.
International and national levels of awareness and action
| International Organizations (WHO, UNICEF, CDC, NI, FFI, and GAIN) |
National Organizations (Ministry of Health and relevant agencies) |
|
|---|---|---|
| Assessment | Identify the need for surveys and provide technical assistance | Define priorities and initiate assessments |
| Intervention | Provide technical assistance in designing and implementing programs | Provide a regulatory framework or policies for fortification or supplementation programs |
| Monitoring and evaluation | Compile global data Establish standardization procedures and best practices | Update national data Compliance, monitoring, and quality control of fortification or supplementation programs |
WHO, World Health Organization; UNICEF, United Nations Children’s Fund; CDC, Centers for Disease Control and Prevention; NI, Nutrition International; FFI, Food Fortification Initiative; GAIN, Global Alliance for Improved Nutrition.
The working group advocated a stepwise approach for assessing vitamin D status and preventing vitamin D deficiency. The first step aims to establish the prevalence of vitamin D deficiency using 25(OH)D data from a representative sample of the population. In the absence of such data, other types of information can be used to judge whether the population as a whole or particular subgroups may have elevated risks of vitamin D deficiency (Fig. 6).
Figure 6.
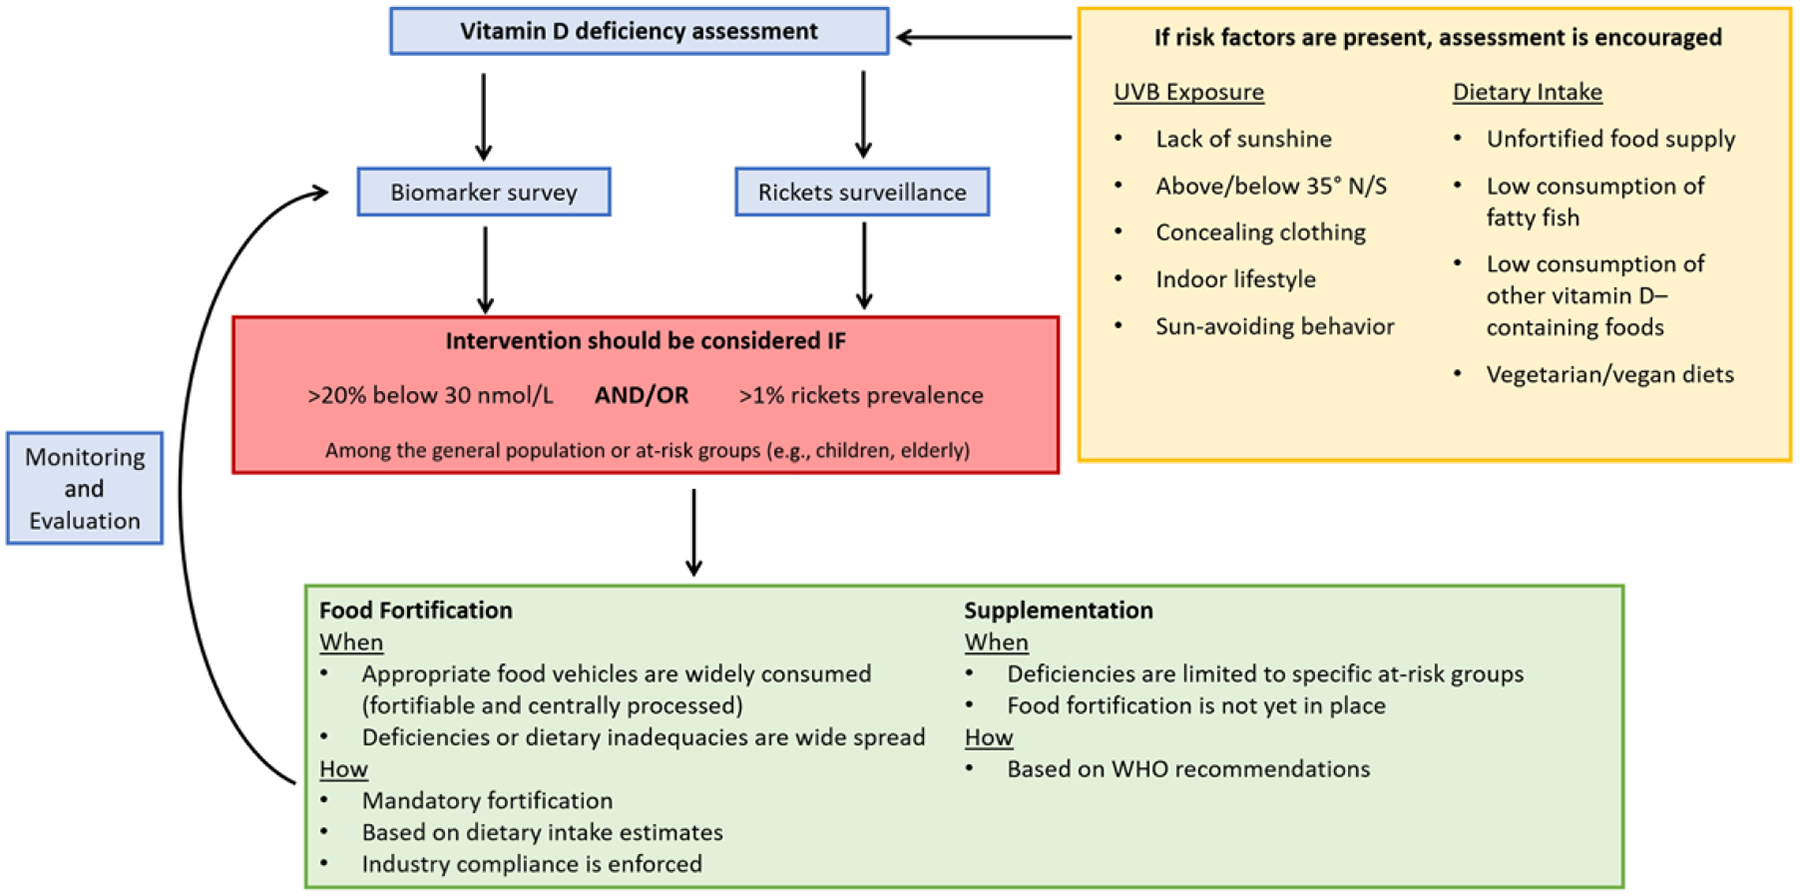
Schematic representation of the Roadmap for Action.
Quantifying the prevalence of vitamin D deficiency
Biomarker assessment.
Assessment of the vitamin D status of a population should be primarily based on recent (i.e., within 10 years) nationally or subnationally representative serum or plasma 25(OH)D concentration data. The 25(OH)D data should be standardized as per the Vitamin D Standardization Program protocol to allow for comparability with prevalence data internationally, as this protocol seeks to minimize assay-related differences in the measurement of 25(OH)D.220 The primary use of such data is to estimate the prevalence of vitamin D deficiency (i.e., percent of the population with 25(OH)D < 30 nmol/L) and (if possible) in subsets of the population considered especially at risk (e.g., infants and pregnant women)). The working group suggested as a general principle that an overall prevalence >20% of 25(OH)D < 30 nmol/L should prompt consideration for an intervention. The rationale for selecting the 30 nmol/L threshold was described above, and the consideration of a prevalence of >20% is based on the conventional practice by the WHO to consider the burden of a micronutrient deficiency to be moderate/severe if >20%. Even when the prevalence is less than 20%, specific high-risk population subgroups are likely to benefit from interventions.
As noted earlier, representative 25(OH)D data do not yet exist for most LMICs. Several resources are available to assist countries in conducting vitamin D status assessment surveys (Table 6). For example, the DEQAS can assist with ensuring high-quality laboratory analyses, and the VDSCP provides laboratory standards. Other organizations have also published more general tools and databases, such as the CDC and Nutrition International’s Micronutrient Survey Toolkit, WHO’s Vitamin and Mineral Nutrition Information System (VMNIS) data repository.221 The WHO also provides resources for monitoring and evaluating interventions with vitamin and mineral nutrition outcomes.222
Table 6.
Resources for vitamin D status assessment and interventions
| Quality assessment: DEQAS (Vitamin D External Quality Assessment Scheme) is an organization whose objective is to ensure the analytical reliability of 25-hydroxyvitamin D (25(OH)D) and 1,25-dihydroxyvitamin D (1,25(OH)2D) assays. They also provide certification to laboratories that meet their performance targets: http://www.deqas.org/ |
| Quality assessment: The Vitamin D Standardization-Certification Program (VDSCP) provides standards to laboratories: https://www.cdc.gov/labstandards/hs_standardization.html |
| Laboratory resources: The Global Laboratory Directory for the Assessment of Micronutrient Status (accepting information and will be publicly available soon) is a directory of laboratories that perform micronutrient status assessment, including for vitamin D. The directory is not an exhaustive source nor is any laboratory endorsed by WHO: https://extranet.who.int/laboratory_directory/ |
| MicronutrientStatusAssessmentDataRepository: The World Health Organization (WHO) Vitamin and Mineral Nutrition Information System (VMNIS) Data Repository is a publicly available and searchable database that includes summary results of population-based status assessment surveys carried out at the national and/or first administrative level in any country: http://www.who.int/vmnis/en/ |
| Micronutrient SurveyToolkit: The Centers for Disease Control and Prevention and Nutrition International (NI) have compiled tools for micronutrient status surveys that can take the user from survey planning and design through implementation and data reporting: http://surveytoolkit.micronutrient.org/ |
| Sunlight availability: Meteorological sources can provide preliminary estimates of the available sunlight in the country: https://weather-and-climate.com/ |
| Fortification: The Food Fortification Initiative (FFI), the Global Alliance for Improved Nutrition (GAIN), the Iodine Global Network (IGN), and the Micronutrient Forum have collaboratively developed the Global Fortification Data Exchange, a publicly available database of food fortification policies and standards: http://fortificationdata.org |
| Food-based interventions: The ODIN (Food-based solutions for optimal vitamin D Nutrition and health through the life cycle) project aims to provide high-quality scientific evidence to prevent vitamin D deficiency in European citizens and improve nutrition and public health through food: http://www.odin-vitd.eu/ |
Rickets prevalence.
In the absence of vitamin D deficiency prevalence estimates based on surveys that involve 25(OH)D assessment, the incidence of rickets can be used as a reasonable surrogate indicator of vitamin D deficiency within the population. The general agreement of the working group was that a >1% prevalence of X-ray confirmed rickets in infants/children may warrant a public health response; however, the group acknowledged that the specific threshold for action is arbitrary. Moreover, if the prevalence is suspected to be greater than 1% (e.g., pediatricians report frequent cases of rickets), community surveys to identify children with clinical features of rickets may be an effective method to quantify the burden of nutritional rickets in a population. Then, if the prevalence is confirmed to be >1%, urgent public health intervention may be warranted.
Making rickets a reportable disease permits the estimation of both prevalence and incidence in low-prevalence regions. Case reports from sentinel centers can be used to estimate the incidence of new cases in a population and help determine the need for more careful examination of population-level vitamin D status. Previous prevalence surveys of rickets have used various clinical signs and have not always confirmed the diagnosis with radiographs. However, on the basis of a validated study of clinical features alone, it can be determined if a child is likely to have active rickets on radiographs.77
UVB exposure.
Satellite data may be used to model the availability of UVB radiation of sufficient strength to support dermal vitamin D synthesis for all or some part of the year for a particular geographic location, even if UVB availability is not measured by the meteorological services within individual LMICs. Using raw satellite data as model inputs is resource intensive; therefore, as a crude but more rapid approach, online web resources can yield percent sunshine estimates throughout the year for any regions of interest (Table 6).
Importantly, ecological data on UVB irradiance should be considered in conjunction with appropriate insights into regional and gender-specific social, religious, and culture factors (e.g., dress codes and sun avoidance) that may attenuate the effect of UVB availability on actual UVB skin exposures at the individual level. There is no clear definition for “healthy” sun exposure, which would be highly variable on the basis of skin color and genetics. Thus, many expert groups cautiously recommend that vitamin D requirements should be met primarily by a combination of dietary and/or supplemental vitamin D.
Dietary intake.
Nationally or regionally representative data on vitamin D intake in the population or in population subgroups may provide an additional source of information by which to determine the adequacy of vitamin D intake in the population, but such data are unlikely to be available for many LMICs. Some insight into vitamin D supply for populations in LMICs may be gleaned from the FAO national food balance sheet analysis.223 These data may highlight low supply of vitamin D owing to the limited availability of naturally rich food sources and the lack of vitamin D–fortified foods. It is now also feasible to link such data with the Global Fortification Data Exchange online database to ascertain whether a country has vitamin D added to vegetable oils and/or margarine on either a mandatory or voluntary basis (Fig. 5).
Interventions to reduce the prevalence of vitamin D deficiency
Where vitamin D deficiency is identified as a concern broadly or within a specific population subgroup, authorities should consider primary preventive interventions to optimize vitamin D status in the population. As described in detail above, the working group considered several possible options in relation to vitamin D interventions in LMICs, with primary consideration of countries in which interventions to address vitamin D deficiency have not yet been introduced. The most appropriate and viable interventions depend on priorities, resources, and infrastructure within individual countries or regions. The working group recognized the logistical advantages of integrating a vitamin D intervention with other dedicated micronutrient or public health intervention programs (e.g., vitamin A fortification, routine vitamin A supplementation, and childhood immunization); however, there was wide agreement that this would require addressing several knowledge gaps, as discussed above.
The working group discussed the strategies put forth in the WHO/FAO Guidelines on Food Fortification with Micronutrients in relation to the full range of potential strategies for the control of micronutrient malnutrition, namely (1) increasing the diversity of foods consumed, (2) food fortification, (3) supplementation, and (4) public health measures.176 Public health measures of a more general nature (e.g., immunization, malaria and parasite control; improvement of water and sanitation) are often helpful to prevent some micronutrient deficiencies associated with poor overall nutritional status and with a high prevalence of infection, but specific information on this possibility is not available for vitamin D.176 Of the three options that are aimed at increasing the intake of micronutrients, programs that deliver micronutrient supplements often provide the fastest improvement in the micronutrient status of individuals or targeted population groups, while food fortification tends to have a less immediate, but ultimately a wider and more sustained impact and is generally more cost-effective than other interventions.176
Research agenda
The working group discussed numerous knowledge gaps and uncertainty related to the role of vitamin D in specific health outcomes, the efficacy and safety of vitamin D interventions for particular health outcomes apart from bone health, and the effectiveness of large-scale public health implementation of programs to control vitamin D in low-income settings. A high-level research agenda (Table 7) was prepared by the working group to describe these evidence gaps. It should be noted that the group’s emphasis on the need for RCTs of vitamin D interventions in this field, where possible, was not a reflexive adherence to the evidence hierarchy, but a recognition of the difficulty interpreting observational studies of associations between either vitamin D intake or 25(OH)D and specific health outcomes. Such associations are highly prone to confounding by general health and physical activity (i.e., vitamin D status tends to be higher in healthier individuals who, for example, have less adiposity, spend more time outdoors, and have more diverse diets), and the pitfalls of relying on observational studies to draw conclusions about the benefits of micronutrient supplements have been widely recognized.224
Table 7.
Vitamin D research opportunities
| Health outcomes |
|---|
| Pregnancy outcomes |
| Numerous studies have suggested that vitamin D affects pregnancy and birth outcomes,10 but evidence is conflicting and there is no consensus on the optimal dose of vitamin D supplementation to maximize the prenatal and/or postpartum maternal and infant benefits. |
| Research need: Establish the dose-dependent effects of vitamin D supplementation on maternal and infant outcomes, such as pre-eclampsia, gestational diabetes, preterm birth, SGA, postnatal infant growth, and infant rickets. |
| It is expected that the effect of vitamin D on skeletal outcomes (including linear growth and the risk of rickets in infants) depends on calcium nutriture, and may interact with other micronutrients. |
| Research need: Investigate the relationship between vitamin D and other nutrients, including calcium, vitamin A, folate, and iron as they relate to pregnancy outcomes and risk ofrickets. |
| There is concern that recommending infant supplementation may conflict with breastfeeding support and promotion efforts, and some mothers are concerned about supplementing infants. Maternal supplementation is one alternative, but the optimal dose to supplement mothers for the health of their infants is not known. |
| Research need: Determine the optimal dose, regimen, safety, and efficacy for maternal supplementation to optimize 25(OH)D and prevent rickets in breastfed infants. |
| Respiratory outcomes |
| It has been hypothesized that free (nonprotein bound) 25(OH)D plays a role in the immune response in respiratory infections, but this hypothesis has not been sufficiently studied. |
| Research need: Investigate whether concentrations of free and/or bioavailable 25(OH)D correlate more tightly with respiratory outcomes than total 25(OH)D. |
| Vitamin D supplementation has shown some efficacy in prevention of URIs, but the effects of supplementation on prevention of LRIs and active TB are not yet known. |
| Research need: Determine ifdaily or weekly vitamin D supplementation can prevent LRIs or active TB. |
| The immune-modulating effects ofvitamin D suggest that it could be used as an adjunctive therapy for treating some respiratory diseases, but this has not been thoroughly tested. |
| Research need: Establish the efficacy of vitamin D as an adjunctive therapy for treating LRIs or for patients with multidrug-resistant TB. |
| Much of the testing on vitamin D in asthma to date has involved patients with mild-to-moderate asthma, in which vitamin D can reduce asthma exacerbations.119,121 Whether this also applies to those with more severe asthma is not known. |
| Research need: Determine whether vitamin D can reduce asthma exacerbations in patients with severe asthma. |
| In studies of vitamin D supplementation in asthma, the greatest benefit has been associated with those patients who had the lowest 25(OH)D status at baseline (<25 nmol/L).119 However, more studies are needed to determine if vitamin D supplementation can benefit those with lesser degrees of deficiency at baseline. |
| Research need: Investigate the benefits ofvitamin D in asthma treatment to assess whether it is restricted to those with lower vitamin D status. |
| Prevalence and surveillance of vitamin D deficiency |
| Prevalence |
| There is a general lack of 25(OH)D data in LMICs,57 but the limited existing data suggest that vitamin D deficiency may be a significant problem in many countries. More data are needed to establish the extent of vitamin D deficiency. |
| Research need: Increase assessment of25(OH)D as a biomarker of vitamin D deficiency in nationally representative surveys in LMICs. |
| There are limited data regarding vitamin D intake and exposure in LMICs, and improving these estimates will aid in identifying countries where a 25(OH)D assessment survey is necessary. |
| Research need: Improve estimates ofvitamin D and calcium intake and exposure in LMICs to identify settings where further assessment ofvitamin D status is warranted. |
| Surveillance |
| As nutritional rickets is an indicator of a larger vitamin D deficiency prevalence, expanding rickets surveillance, especially in LMICs, would improve vitamin D deficiency data and highlight areas in greatest need of a status survey or an intervention. |
| Research need: Identify regions with the greatest prevalence of vitamin D deficiency by expanding rickets surveillance to include case reports and validated clinical signs, especially in LMICs. Consider the potential use of serum ALP as a screening biomarker for rickets. |
| The increasing recognition of the role of vitamin D in immune and cardiovascular health suggests that there maybe an underappreciated effect of vitamin D deficiency on child mortality. |
| Research need: Better understand the effects oflow vitamin D status and vitamin D supplementation on child mortality, especially in low-income settings, given that vitamin D is a known immune modulator and that low vitamin D increases the risk ofrespiratory infections, and that there may be unknown consequences of vitamin D deficiency. |
| Vitamin D interventions |
| Fortification |
| Cofortification of foods with both vitamin A and vitamin D presents a cost-effective method for fortification in countries with an existing vitamin A fortification program.176 However, it is unclear whether there are interactions between the two micronutrients that may affect their efficacy, bioavailability, and/or stability. |
| Research need: Establish the efficacy of cofortification with vitamins D and A. |
| Calcium and vitamin D are highly dependent on each other for optimal bone health. However, in many LMICs, it is often not practical to fortify dairy products, which naturally contain calcium (either because of low consumption or small-scale production). As calcium can dramatically affect the organoleptic properties of the vehicle, acceptable alternatives to ensure adequate calcium and vitamin D intake are needed. |
| Research need: Assess alternative methods ofcalcium and vitamin D codelivery, especially in countries where dairy consumption is low. |
| Bio-addition is a potentially low-cost alternative for increasing the vitamin D content in foods.173 However, these techniques need further development and have not been assessed for their suitability in LMICs. |
| Research need: Develop methods to increase the vitamin D content offoods through bio-addition. |
| Dosage and safety of supplementation |
| Vitamin D supplementation during routine vaccination provides a good opportunity to ensure that children receive adequate vitamin D, but the efficacy of delivering relatively large doses with vaccines has not been tested. |
| Research need: Determine the safety and effectiveness of delivering vitamin D with childhood vaccinations. |
| Awareness and education |
| Educating the public about the current recommendations remains an important and ongoing task to ensure the success and public acceptance of interventions, including supplementation and fortification. |
| Research need: Design and test approaches to enhancing awareness among the general public of vitamin D recommendations and the impact of vitamin D on health outcomes. |
| Ensuring that parents and caregivers of infants and children are well informed about the health consequences of vitamin D deficiency and current supplementation recommendations (maternal, infant, and child) as important strategies to improve adherence and ultimately prevent rickets. |
| Research need: Develop and evaluate social and behavior change strategies to improve adherence to infant and childhood vitamin D supplementation. |
Conclusions
Vitamin D status is influenced by multiple factors, including dietary intake, UVB exposure, age, and race/ethnicity. Factors that increase the risk of vitamin D deficiency are prevalent worldwide, and it is likely that many countries have subpopulations at risk of adverse outcomes owing to low vitamin D status, including suboptimal bone health and other negative health outcomes. While nationally representative data on vitamin D deficiency are limited, the majority of studies in both high- and low-income countries indicate that vitamin D intakes and status are inadequate on the basis of the recommended guidelines. Given the growing understanding of the established links between vitamin D status and the incidence of respiratory infections and asthma, as well as emerging research on the potential effects of vitamin D status on selected pregnancy and newborn outcomes, it is important to encourage further research to address the most critical gaps in knowledge regarding this micronutrient and to generate accurate information about the global prevalence of vitamin D deficiency. It is necessary to explore a diverse range of food fortification vehicles appropriate in different sociocultural and geographic contexts and to investigate options for safe and effective supplementation programs to address vitamin D deficiency in vulnerable populations worldwide.
Acknowledgments
The group gratefully acknowledges support from the Bill & Melinda Gates Foundation. We would also like to thank Lisa Rogers of the World Health Organization and Homero Martinez of Nutrition International for participating in the technical consultations.
Footnotes
Competing interests
Tom D. Thacher is a consultant for Biomedical Systems, Inc. Steven A. Abrams is a member of the scientific advisory board of the Milk Processor Education Program (MilkPep). All other authors declare no competing interests.
Publisher's Disclaimer: Disclaimer
Publisher's Disclaimer: The findings and conclusions in this manuscript are those of the authors and do not necessarily represent the official position of the Centers for Disease Control and Prevention, the Agency for Toxic Substances and Disease Registry, or the U.S. Food and Drug Administration.
References
- 1. [July 10, 2018]; The World Bank. 2018 Accessed. https://datahelpdesk.worldbank.org/knowledgebase/articles/906519-world-bank-country-and-lending-groups.
- 2.Prentice A 2008. Vitamin D deficiency: a global perspective. Nutr. Rev 66: 153–164. [DOI] [PubMed] [Google Scholar]
- 3.Martineau AR, Jolliffe DA, Hooper RL, et al. 2017. vitamin D supplementation to prevent acute respiratory tract infections: systematic review and meta-analysis of individual participant data. BMJ 356: i6583. [DOI] [PMC free article] [PubMed] [Google Scholar]
- 4.Thorne-Lyman A & Fawzi WW. 2012. Vitamin D during pregnancy and maternal, neonatal and infant health outcomes: a systematic review and meta-analysis. Paediatr. Perinat. Epidemiol 26: 75–90. [DOI] [PMC free article] [PubMed] [Google Scholar]
- 5.Aghajafari F, Nagulesapillai T, Ronksley PE, et al. 2013. Association between maternal serum 25-hydroxyvitamin D level and pregnancy and neonatal outcomes: systematic review and meta-analysis of observational studies. BMJ 346: f1169. [DOI] [PubMed] [Google Scholar]
- 6.Hill TR & Aspray TJ. 2017. The role of vitamin D in maintaining bone health in older people. Ther. Adv. Musculoskelet. Dis 9: 89–95. [DOI] [PMC free article] [PubMed] [Google Scholar]
- 7.Kheiri B, Abdalla A, Osman M, et al. 2018. Vitamin D deficiency and risk of cardiovascular diseases: a narrative review. Clin. Hypertens 24: 9. [DOI] [PMC free article] [PubMed] [Google Scholar]
- 8.Autier P, Boniol M, Pizot C, et al. 2014. Vitamin D status and ill health: a systematic review. Lancet Diabetes Endocrinol 2: 76–89. [DOI] [PubMed] [Google Scholar]
- 9.Roth DE, Leung M, Mesfin E, et al. 2017. Vitamin D supplementation during pregnancy: current and future state of the evidence from a systematic review of randomized controlled trials. BMJ 359: j5237. [DOI] [PMC free article] [PubMed] [Google Scholar]
- 10.De-Regil LM, Palacios C & Lombardo LK. 2016. vitamin D supplementation for women during pregnancy. Cochrane Database Syst. Rev 2: CD008873. [DOI] [PubMed] [Google Scholar]
- 11.Autier P, Mullie P, Macacu A, et al. 2017. Effect of vitamin D supplementation on non-skeletal disorders: a systematic review of meta-analyses and randomised trials. Lancet Diabetes Endocrinol 5: 986–1004. [DOI] [PubMed] [Google Scholar]
- 12.Kahwati LC, Weber RP, Pan H, et al. 2018. vitamin D, calcium, or combined supplementation for the primary prevention of fractures in community-dwelling adults: evidence report and systematic review for the US Preventive Services Task Force. JAMA 319: 1600–1612. [DOI] [PubMed] [Google Scholar]
- 13.Scientific Advisory Committee on Nutrition (SACN) and Health. 2016. Vitamin D.
- 14.Wacker M & Holick MF. 2013. Sunlight and vitamin D: a global perspective for health. Dermatoendocrinol 5: 51–108. [DOI] [PMC free article] [PubMed] [Google Scholar]
- 15. [December 3, 2017]; Centers for Disease Control and Prevention. 2017 Accessed. https://www.cdc.gov/cancer/skin/basic_info/sun-safety.htm.
- 16. [January 10, 2018]; U.S. Department of Agriculture. 2018 Accessed. http://ndb.nal.usda.gov.
- 17. [July 30, 2018]; U.S. Food and Drug Administration. 2018 Accessed. https://www.fda.gov/Food/GuidanceRegulation/GuidanceDocumentsRegulatoryInformation/LabelingNutrition/ucm385663.htm#highlights.
- 18. [December 3, 2017]; Global Fortification Data Exchange. 2017 Accessed. http://fortificationdata.org/.
- 19.Bikle DD 2014. Vitamin D metabolism, mechanism of action, and clinical applications. Chem. Biol 21: 319–329. [DOI] [PMC free article] [PubMed] [Google Scholar]
- 20.Shin JS, Choi MY, Longtine MS, et al. 2010. Vitamin D effects on pregnancy and the placenta. Placenta 31: 1027–1034. [DOI] [PMC free article] [PubMed] [Google Scholar]
- 21.Liu NQ & Hewison M. 2012. Vitamin D, the placenta and pregnancy. Arch. Biochem. Biophys 523: 37–47. [DOI] [PubMed] [Google Scholar]
- 22.Holick MF 2007. Vitamin D deficiency. N. Engl. J. Med 357: 266–281. [DOI] [PubMed] [Google Scholar]
- 23.Glorieux FH & Pettifor JM. 2014. Vitamin D/dietary calcium deficiency rickets and pseudo-vitamin D deficiency rickets. Bonekey Rep 3 10.1038/bonekey.2014.19. [DOI] [PMC free article] [PubMed] [Google Scholar]
- 24.Seamans KM & Cashman KD. 2009. Existing and potentially novel functional markers of vitamin D status: a sysematic review. Am. J. Clin. Nutr 89: 1997S–2008S. [DOI] [PubMed] [Google Scholar]
- 25.Zerwekh JE 2008. Blood biomarkers of vitamin D status. Am. J. Clin. Nutr 87: 1087S–1091S. [DOI] [PubMed] [Google Scholar]
- 26.Cashman KD, Dowling KG, Skrabakova Z, et al. 2016. Vitamin D deficiency in Europe: pandemic? Am. J. Clin. Nutr 103: 1033–1044. [DOI] [PMC free article] [PubMed] [Google Scholar]
- 27.Carter GD, Berry J, Durazo-Arvizu R, et al. 2018. Hydroxyvitamin D assays: an historical perspective from DEQAS. J. Steroid Biochem. Mol. Biol 177: 30–35. [DOI] [PubMed] [Google Scholar]
- 28. [December 3, 2017]; Vitamin D Standardization Program (VDSP) 2017 Accessed. https://ods.od.nih.gov/Research/vdsp.aspx.
- 29. [July 30, 2018]; National Institute of Standards and Technology. Accessed. https://www-s.nist.gov/srmors/view_detail.cfm?srm=972.
- 30.Thacher TD, Fischer PR, Pettifor JM, et al. 2000. Case–control study of factors associated with nutritional rickets in Nigerian children. J. Pediatr 137: 367–373. [DOI] [PubMed] [Google Scholar]
- 31.Kang JI, Lee YS, Han YJ, et al. 2017. The serum level of 25-hydroxyvitamin D for maximal suppression of parathyroid hormone in children: the relationship between 25- hydroxyvitamin D and parathyroid hormone. Korean J. Pediatr 60: 45–49. [DOI] [PMC free article] [PubMed] [Google Scholar]
- 32.Hill KM, McCabe GP, McCabe LD, et al. 2010. An inflection point of serum 25-hydroxyvitamin D for maximal suppression of parathyroid hormone is not evident from multi-site pooled data in children and adolescents. J. Nutr 140: 1983–1988. [DOI] [PMC free article] [PubMed] [Google Scholar]
- 33.Cavalier E, Delanaye P, Hubert P, et al. 2009. Estimation of the stability of parathyroid hormone when stored at −80°C for a long period. Clin. J. Am. Soc. Nephrol 4: 1988–1992. [DOI] [PMC free article] [PubMed] [Google Scholar]
- 34.Graff M, Thacher TD, Fischer PR, et al. 2004. Calcium absorption in Nigerian children with rickets. Am. J. Clin. Nutr 80: 1415–1421. [DOI] [PubMed] [Google Scholar]
- 35.Munns CF, Shaw N, Kiely M, et al. 2016. Global consensus recommendations on prevention and management of nutritional rickets. J. Clin. Endocrinol. Metab 85: 83–106. [DOI] [PMC free article] [PubMed] [Google Scholar]
- 36.Taylor JA, Richter M, Done S, et al. 2010. The utility of alkaline phosphatase measurement as a screening test for rickets in breast-fed infants and toddlers: a study from the puget sound pediatric research network. Clin. Pediatr. (Phila) 49: 1103–1110. [DOI] [PubMed] [Google Scholar]
- 37.Redmond J, Jarjou LMA, Zhou B, et al. 2014. Ethnic differences in calcium, phosphate and bone metabolism. Proc. Nutr. Soc 73: 340. [DOI] [PMC free article] [PubMed] [Google Scholar]
- 38.IOM (Institute of Medicine). 2011. Dietary Reference Intakes for Calcium and Vitamin D Washington, DC: The National Academies Press. [PubMed] [Google Scholar]
- 39.Wang TJ, Zhang F, Richards JB, et al. 2010. Common genetic determinants of vitamin D insufficiency: a genome-wide association study. Lancet 376: 180–188. [DOI] [PMC free article] [PubMed] [Google Scholar]
- 40.Didriksen A, Grimnes G, Hutchinson MS, et al. 2013. The serum 25-hydroxyvitamin D response to vitamin D supplementation is related to genetic factors, BMI, and baseline levels. Eur. J. Endocrinol 169: 559–567. [DOI] [PubMed] [Google Scholar]
- 41.Moon RJ, Harvey NC, Cooper C, et al. 2017. Response to antenatal cholecalciferol supplementation is associated with common vitamin D related genetic variants. J. Clin. Endocrinol. Metab 102: 2941–2949. [DOI] [PMC free article] [PubMed] [Google Scholar]
- 42.Manousaki D, Dudding T, Haworth S, et al. 2017. Low-frequency synonymous coding variation in CYP2R1 has large effects on vitamin D levels and risk of multiple sclerosis. Am. J. Hum. Genet 101: 227–238. [DOI] [PMC free article] [PubMed] [Google Scholar]
- 43.Haynes BMH, Pfeiffer CM, Sternberg MR, et al. 2013. Selected physiologic variables are weakly to moderately associated with 29 biomarkers of diet and nutrition, NHANES 2003–2006. J. Nutr 143: 101S–1010S. [DOI] [PMC free article] [PubMed] [Google Scholar]
- 44.Clements MR, Johnson L & Fraser DR. 1987. A new mechanism for induced vitamin D deficiency in calcium deprivation. Nature 325: 62–65. [DOI] [PubMed] [Google Scholar]
- 45.Clements MR, Davies M, Hayes ME, et al. 1992. The role of 1, 25-dihydroxyvitamin D in the mechanism of acquired vitamin D deficiency. Clin. Endocrinol. (Oxf) 37: 17–27. [DOI] [PubMed] [Google Scholar]
- 46.Steingrimsdottir L, Gunnarsson O, Indridason OS, et al. 2005. Relationship between serum parathyroid hormone levels, vitamin D sufficiency, and calcium intake. JAMA 294: 2336–2341. [DOI] [PubMed] [Google Scholar]
- 47.Jones KS, Assar S, Harnpanich D, et al. 2014. 25(OH)D2 half-life is shorter than 25(OH)D3 half-life and is influenced by DBP concentration and genotype. J. Clin. Endocrinol. Metab 99: 3373–3381. [DOI] [PMC free article] [PubMed] [Google Scholar]
- 48.Cashman KD, Hayes A, O’Donovan SM, et al. 2014. Dietary calcium does not interact with vitamin D(3) in terms of determining the response and catabolism of serum 25-hydroxyvitamin D during winter in older adults. Am. J. Clin. Nutr 99: 1414–1423. [DOI] [PubMed] [Google Scholar]
- 49.Jones KS, Assar S, Prentice A, et al. 2016. Vitamin D expenditure is not altered in pregnancy and lactation despite changes in vitamin D metabolite concentrations. Sci. Rep 6: 26795. [DOI] [PMC free article] [PubMed] [Google Scholar]
- 50.Park H, Brannon PM, West AA, et al. 2016. Vitamin D metabolism varies among women in different reproductive states consuming the same intakes of vitamin D and related nutrients. J. Nutr 146: 1537–1545. [DOI] [PMC free article] [PubMed] [Google Scholar]
- 51.Bouillon R 2017. Comparative analysis of nutritional guidelines for vitamin D. Nat. Rev. Endocrinol 13: 466–479. [DOI] [PubMed] [Google Scholar]
- 52.Manson JE, Brannon PM, Rosen CJ, et al. 2016. Vitamin D deficiency—is there really a pandemic? N. Engl. J. Med 375: 1817–1820. [DOI] [PubMed] [Google Scholar]
- 53.Bresson J, Burlingame B, Dean T, et al. 2016. Scientific opinion on dietary reference values for vitamin D EFSA Panel on Dietetic Products, Nutrition, and Allergies(NDA). EFSA J 179: 1–179. [Google Scholar]
- 54.Holick MF, Binkley NC, Bischoff-Ferrari HA, et al. 2011. Evaluation, treatment, and prevention of vitamin D deficiency: an endocrine society clinical practice guideline. J. Clin. Endocrinol. Metab 96: 1911–1930. [DOI] [PubMed] [Google Scholar]
- 55.Cranney A, Horsley T, O’Donnell S, et al. 2007. Effectiveness and safety of vitamin D in relation to bone health. Evid. Rep. Technol. Assess. (Full. Rep) 158: 1–235. [PMC free article] [PubMed] [Google Scholar]
- 56.Cauley JA, Danielson ME, Boudreau R, et al. 2011. Serum 25-hydroxyvitamin D and clinical fracture risk in a multiethnic cohort of women: the Women’s Health Initiative (WHI). J. Bone Miner. Res 26: 2378–2388. [DOI] [PMC free article] [PubMed] [Google Scholar]
- 57.Palacios C & Gonzalez L. 2014. Is vitamin D deficiency a major global public health problem? J. Steroid Biochem. Mol. Biol 144: 138–145. [DOI] [PMC free article] [PubMed] [Google Scholar]
- 58.Halicioglu O, Aksit S, Koc F, et al. 2012. Vitamin D deficiency in pregnant women and their neonates in spring time in western Turkey. Paediatr. Perinat. Epidemiol 26: 53–60. [DOI] [PubMed] [Google Scholar]
- 59.Maghbooli Z, Hossein-Nezhad A, Shafaei AR, et al. 2007. Vitamin D status in mothers and their newborns in Iran. BMC Pregnancy Childbirth 7: 1. [DOI] [PMC free article] [PubMed] [Google Scholar]
- 60.Cashman KD, Ritz C, Kiely M, et al. 2017. Improved dietary guidelines for vitamin D: application of individual participant data (IPD)-level meta-regression analyses. Nutrients 9: 469. [DOI] [PMC free article] [PubMed] [Google Scholar]
- 61.Manson JE & Kaunitz AM. 2016. Menopause management—getting clinical care back on track. N. Engl.J. Med 374: 803–806. [DOI] [PubMed] [Google Scholar]
- 62.Singapore Recommended Dietary Allowance. 2015. Accessed September 11, 2018 https://www.healthhub.sg/live-healthy/192/recommended_dietary_allowances.
- 63.The Ministry of Health of Turkey 2016. Dietary guidelines for Turkey; Ankara. [Google Scholar]
- 64.Indian Council of Medical Research Expert Group, Indian Council of Medical Research & National Institute of Nutrition (India). 2010. Nutrient requirements and recommended dietary allowances for Indians: a report of the Expert Group of the Indian Council of Medical Research
- 65.Tanaka K, Terao J, Shidoji Y, et al. 2012. Dietary reference intakes for Japanese 2010: fat-soluble vitamins. J. Nutr. Sci. Vitaminol 59: S57–S66. [Google Scholar]
- 66.Conseil Supérieur de la Santé. Recommandations Nutrionnelles pour la Belgique. 2016.
- 67.Mortensen C, Damsgaard CT, Hauger H, et al. 2016. Estimation of the dietary requirement for vitamin D in white children aged 4–8 y: a randomized, controlled, dose–response trial. Am. J. Clin. Nutr 104: 1310–1317. [DOI] [PubMed] [Google Scholar]
- 68.Smith TJ, Tripkovic L, Damsgaard CT, et al. 2016. Estimation of the dietary requirement for vitamin D in adolescents aged 14–18 y: a dose–response, double-blind, randomized placebo-controlled trial. Am. J. Clin. Nutr 104: 1301–1309. [DOI] [PubMed] [Google Scholar]
- 69.Hathcock JN, Shao A, Vieth R, et al. 2007. Risk assessment for vitamin D. Am. J. Clin. Nutr 85: 6–18. [DOI] [PubMed] [Google Scholar]
- 70.Schwartzman MS & Franck WA. 1987. Vitamin D toxicity complicating the treatment of senile, postmenopausal, and glucocorticoid-induced osteoporosis: four case reports and a critical commentary on the use of vitamin D in these disorders. Am. J. Med 82: 224–230. [DOI] [PubMed] [Google Scholar]
- 71.Rizzoli R, Stoermann C, Ammann P, et al. 1994. Hyper-calcemia and hyperosteolysis in vitamin D intoxication: effects of clodronate therapy. Bone 15: 193–198. [DOI] [PubMed] [Google Scholar]
- 72.Dudenkov DV, Yawn BP, Oberhelman SS, et al. 2015. Changing incidence of serum 25-hydroxyvitamin D values above 50 ng/mL: a 10-year population-based study. Mayo Clin. Proc 90: 577–586. [DOI] [PMC free article] [PubMed] [Google Scholar]
- 73.Sharma LK, Dutta D, Sharma N, et al. 2017. The increasing problem of subclinical and overt hypervitaminosis D in India: an institutional experience and review. Nutrition 34: 76–81. [DOI] [PubMed] [Google Scholar]
- 74.Sanders KM, Stuart AL, Williamson EJ, et al. 2010. Annual high-dose oral vitamin D and falls and fractures in older women: a randomized controlled trial. JAMA 303: 1815–1822. [DOI] [PubMed] [Google Scholar]
- 75.Luxwolda MF, Kuipers RS, Kema I, et al. 2012. Traditionally living populations in East Africa have a mean serum 25-hydroxyvitamin D concentration of 115 nmol/L. Br. J. Nutr 108: 1557–1561. [DOI] [PubMed] [Google Scholar]
- 76.Jones G 2008. Pharmacokinetics of vitamin D toxicity. Am. J. Clin. Nutr 88: 582S–586S. [DOI] [PubMed] [Google Scholar]
- 77.Thacher TD, Fischer PR & Pettifor JM. 2002. The usefulness of clinical features to identify active rickets. Ann. Trop. Paediatr 22: 229–237. [DOI] [PubMed] [Google Scholar]
- 78.Basatemur E & Sutcliffe A. 2015. Incidence of hypocalcemic seizures due to vitamin D deficiency in children in the United Kingdom and Ireland. J. Clin. Endocrinol. Metab 100: E91–E95. [DOI] [PubMed] [Google Scholar]
- 79.Maiya S, Sullivan I, Allgrove J, et al. 2008. Hypocalcaemia and vitamin D deficiency: an important, but preventable, cause of life-threatening infant heart failure. Heart 94: 581–584. [DOI] [PubMed] [Google Scholar]
- 80.Chehade H, Girardin E, Rosato L, et al. 2011. Acute life-threatening presentation of vitamin D deficiency rickets. J. Clin. Endocrinol. Metab 96: 2681–2683. [DOI] [PubMed] [Google Scholar]
- 81.Uysal S, Kalayci AG & Baysal K. 1999. Cardiac functions in children with vitamin D deficiency rickets. Pediatr. Cardiol 20: 283–286. [DOI] [PubMed] [Google Scholar]
- 82.Creo AL, Thacher TD, Pettifor JM, et al. 2017. Nutritional rickets around the world: an update. Paediatr. Int. Child Health 37: 84–98. [DOI] [PubMed] [Google Scholar]
- 83.Thacher TD, Fischer PR, Pettifor JM, et al. 2000. Radiographic scoring method for the assessment of the severity of nutritional rickets. J. Trop. Pediatr 46: 132–139. [DOI] [PubMed] [Google Scholar]
- 84.Aggarwal V, Seth A, Marwaha RK, et al. 2013. Management of nutritional rickets in Indian children: a randomized controlled trial. J. Trop. Pediatr 59: 127–133. [DOI] [PubMed] [Google Scholar]
- 85.Chatterjee D, Gupta V, Sharma V, et al. 2014. A reliable and cost effective approach for radiographic monitoring in nutritional rickets. Br. J. Radiol 87: 1–6. [DOI] [PMC free article] [PubMed] [Google Scholar]
- 86.Jones HL, Jammeh L, Owens S, et al. 2015. Prevalence of rickets-like bone deformities in rural Gambian children. Bone 77: 1–5. [DOI] [PMC free article] [PubMed] [Google Scholar]
- 87.Pettifor JM 2014. Calcium and vitamin D metabolism in children in developing countries. Ann. Nutr. Metab 64(Suppl. 2): 15–22. [DOI] [PubMed] [Google Scholar]
- 88.Thacher TD, Fischer PR, Tebben PJ, et al. 2013. Increasing incidence of nutritional rickets: a population-based study in Olmsted County, Minnesota. Mayo Clin. Proc 88: 176–183. [DOI] [PMC free article] [PubMed] [Google Scholar]
- 89.Callaghan AL, Moy RJD, Booth IW, et al. 2006. Incidence of symptomatic vitamin D deficiency. Arch. Dis. Child 91: 606–607. [DOI] [PMC free article] [PubMed] [Google Scholar]
- 90.Mishal AA 2001. Effects of different dress styles on vitamin D levels in healthy young Jordanian women. Osteoporos. Int 12: 931–935. [DOI] [PubMed] [Google Scholar]
- 91.Molla AM, Al Badawi M, Hammoud MS, et al. 2005. Vitamin D status of mothers and their neonates in Kuwait. Pediatr. Int 47: 649–652. [DOI] [PubMed] [Google Scholar]
- 92.Paterson CR & Ayoub D. 2015. Congenital rickets due to vitamin D deficiency in the mothers. Clin. Nutr 34: 793–798. [DOI] [PubMed] [Google Scholar]
- 93.Dawodu A, Agarwal M, Sankarankutty M, et al. 2005. Higher prevalence of vitamin D deficiency in mothers of rachitic than nonrachitic children. J. Pediatr 147: 109–111. [DOI] [PubMed] [Google Scholar]
- 94.Thacher TD, Fischer PR, Pettifor JM, et al. 1999. A comparison of calcium, vitamin D, or both for nutritional rickets in Nigerian children. N. Engl. J. Med 341: 563–568. [DOI] [PubMed] [Google Scholar]
- 95.Fischer PR, Rahman A, Cimma JP, et al. 1999. Nutritional rickets without vitamin D deficiency in Bangladesh. J. Trop. Pediatr 45: 291–293. [DOI] [PubMed] [Google Scholar]
- 96.Aggarwal V, Seth A, Aneja S, et al. 2005. Role of calcium deficiency in development of nutritional rickets in Indian children: a case control study. J. Clin. Endocrinol. Metab 97: 3461–3466. [DOI] [PubMed] [Google Scholar]
- 97.Lynch MF, Griffin IJ, Hawthorne KM, et al. 2007. Calcium balance in 1–4-y-old children. Am. J. Clin. Nutr 85: 750–754. [DOI] [PubMed] [Google Scholar]
- 98.Misra M, Pacaud D, Petryk A, et al. 2008. Vitamin D deficiency in children and its management: review of current knowledge and recommendations. Pediatrics 122: 398–417. [DOI] [PubMed] [Google Scholar]
- 99.Tripkovic L, Lambert H, Hart K, et al. 2012. Comparison of vitamin D2 and vitamin D3 supplementation in raising serum 25-hydroxyvitamin D status: a systematic review and meta-analysis. Am. J. Clin. Nutr 95: 1357–1364. [DOI] [PMC free article] [PubMed] [Google Scholar]
- 100.Brett NR, Lavery P, Agellon S, et al. 2016. Dietary vitamin D dose–response in healthy children 2 to 8 y of age: a 12-wk randomized controlled trial using fortified foods. Am. J. Clin. Nutr 103: 144–152. [DOI] [PubMed] [Google Scholar]
- 101.Zhu K, Oddy WH, Holt P, et al. 2017. Tracking of vitamin D status from childhood to early adulthood and its association with peak bone mass. Am. J. Clin. Nutr 106: 273–283. [DOI] [PubMed] [Google Scholar]
- 102.Cheng S, Tylavsky F, Kröger H, et al. 2003. Association of low 25-hydroxyvitamin D concentrations with elevated parathyroid hormone concentrations and low cortical bone density in early pubertal and prepubertal Finnish girls. Am.J. Clin. Nutr 78: 485–492. [DOI] [PubMed] [Google Scholar]
- 103.Bolland MJ, Grey A, Gamble GD, et al. 2014. Vitamin D supplementation and falls: a trial sequential meta-analysis. Lancet Diabetes Endocrinol 2: 573–580. [DOI] [PubMed] [Google Scholar]
- 104.Burns ER, Stevens JA & Lee R. 2016. The direct costs of fatal and non-fatal falls among older adults—United States. J. Safety Res 58: 99–103. [DOI] [PMC free article] [PubMed] [Google Scholar]
- 105.Houston DK, Cesari M, Ferrucci L, et al. 2007. Association between vitamin D status and physical performance: the InCHIANTI study. J. Gerontol. A Biol. Sci. Med. Sci 62: 440–446. [DOI] [PMC free article] [PubMed] [Google Scholar]
- 106.Toffanello ED, Perissinotto E, Sergi G, et al. 2012. vitamin D and physical performance in elderly subjects: the Pro. VA study. PLoS One 7: e34950. [DOI] [PMC free article] [PubMed] [Google Scholar]
- 107.Bischoff-Ferrari HA, Dietrich T, Orav EJ, et al. 2004. Higher 25-hydroxyvitamin D concentrations are associated with better lower-extremity function in both active and inactive persons aged 60 y. Am. J. Clin. Nutr 80: 752–758. [DOI] [PubMed] [Google Scholar]
- 108.Snijder MB, van Schoor NM, Pluijm SMF, et al. 2006. Vitamin D status in relation to one-year risk of recurrent falling in older men and women. J. Clin. Endocrinol. Metab 91: 2980–2985. [DOI] [PubMed] [Google Scholar]
- 109.Beaudart C, Buckinx F, Rabenda V, et al. 2014. The effects of vitamin D on skeletal muscle strength, muscle mass, and muscle power: a systematic review and meta-analysis of randomized controlled trials. J. Clin. Endocrinol. Metab 99: 4336–4345. [DOI] [PubMed] [Google Scholar]
- 110.Elidrissy ATH 2016. The return of congenital rickets, are we missing occult cases? Calcif. Tissue Int 99: 227–236. [DOI] [PubMed] [Google Scholar]
- 111.World Health Organisation. 2016. WHO recommendations on antenatal care for a positive pregnancy experience [PubMed]
- 112. [January 31, 2018]; World Health Organization. Accessed. http://www.who.int/nutrition/global-target-2025/en/.
- 113.Roth D, Morris S, Zlotkin S, et al. 2018. Vitamin D supplementation during pregnancy and lactation and infant growth. N. Engl. J. Med 379: 535–546. [DOI] [PMC free article] [PubMed] [Google Scholar]
- 114.Hofmeyr GJ, Lawrie TA, Atallah AN, et al. 2010. Calcium supplementation during pregnancy for preventing hypertensive disorders and related problems. Cochrane Database Syst. Rev 8: CD001059. [DOI] [PubMed] [Google Scholar]
- 115.Oberhelman SS, Meekins ME, Fischer PR, et al. 2013. Maternal vitamin D supplementation to improve the vitamin D status of breast-fed infants: a randomized controlled trial. Mayo Clin. Proc 88: 1378–1387. [DOI] [PMC free article] [PubMed] [Google Scholar]
- 116.Hollis BW, Wagner CL, Howard CR, et al. 2015. Maternal versus infant vitamin D supplementation during lactation: arandomized controlled trial. Pediatrics 136:625–634. [DOI] [PMC free article] [PubMed] [Google Scholar]
- 117.Umaretiya PJ, Oberhelman SS, Cozine EW, et al. 2017. Maternal preferences for vitamin D supplementation in breastfed infants. Ann. Fam. Med 15: 68–70. [DOI] [PMC free article] [PubMed] [Google Scholar]
- 118.Brehm JM, Acosta-Pérez E, Klei L, et al. 2012. Vitamin D insufficiency and severe asthma exacerbations in Puerto Rican children. Am. J. Respir. Crit. Care Med 186: 140–146. [DOI] [PMC free article] [PubMed] [Google Scholar]
- 119.Jolliffe DA, Greenberg L, Hooper RL, et al. 2017. vitamin D supplementation to prevent asthma exacerbations: a systematic review and meta-analysis of individual participant data. Lancet Respir. Med 5: 881–890. [DOI] [PMC free article] [PubMed] [Google Scholar]
- 120.Martineau AR 2012. Old wine in new bottles: vitamin D in the treatment and prevention of tuberculosis. Proc. Nutr. Soc 71: 84. [DOI] [PubMed] [Google Scholar]
- 121.Martineau AR, Takeda A, Nurmatov U, et al. 2016. Vitamin D for the management of asthma. Cochrane Database Syst. Rev 9: CD011511. [DOI] [PMC free article] [PubMed] [Google Scholar]
- 122.Simoes EAF, Cherian T, Chow J, et al. 2006. Acute respiratory infections in children In Disease Control Priorities in Developing Countries 2nd ed Jamison DT, Breman JG, Measham AR, et al. Eds. Washington, DC: The International Bank for Reconstruction and Development/The World Bank. [PubMed] [Google Scholar]
- 123. [December 3, 2017]; World Health Organization. 2017 Accessed. http://www.who.int/mediacentre/factsheets/fs104/en/.
- 124.Global Burden of Disease 2016 Causes of Death Collaborators. 2017. Global, regional, and national age-sex specific mortality for 264 causes of death, 1980–2016: a systematic analysis for the Global Burden of Disease Study 2016. Lancet 390: 1151–1210. [DOI] [PMC free article] [PubMed] [Google Scholar]
- 125.Aglipay M, Birken CS, Parkin PC, et al. 2017. Effect of high-dose vs standard-dose wintertime vitamin D supplementation on viral upper respiratory tract infections in young healthy children. JAMA 318: 245–254. [DOI] [PMC free article] [PubMed] [Google Scholar]
- 126.Manaseki-Holland S, Qader G, Isaq Masher M, et al. 2010. Effects of vitamin D supplementation to children diagnosed with pneumonia in Kabul: a randomised controlled trial. Trop. Med. Int. Health 15: 1148–1155. [DOI] [PubMed] [Google Scholar]
- 127.Manaseki-Holland S, Maroof Z, Bruce J, et al. 2012. Effect on the incidence of pneumonia of vitamin D supplementation by quarterly bolus dose to infants in Kabul: a randomised controlled superiority trial. Lancet 379: 1419–1427. [DOI] [PMC free article] [PubMed] [Google Scholar]
- 128.Martineau AR, Timms PM, Bothamley GH, et al. 2011. High-dose vitamin D3 during intensive-phase antimicrobial treatment of pulmonary tuberculosis: a double-blind randomised controlled trial. Lancet 377: 242–250. [DOI] [PMC free article] [PubMed] [Google Scholar]
- 129.Gupta P, Dewan P, Shah D, et al. 2016. Vitamin D supplementation for treatment and prevention of pneumonia in under-five children: a randomized double-blind placebo controlled trial. Indian Pediatr 53: 967–976. [DOI] [PubMed] [Google Scholar]
- 130.Vahdaninia M, Mackenzie H, Helps S, et al. 2017. Prenatal intake of vitamins and allergic outcomes in the off-spring: a systematic review and meta-analysis. J. Allergy Clin. Immunol. Pract 5: 771–778.e5. [DOI] [PubMed] [Google Scholar]
- 131.Ganmaa D & Martineau AR. 2015. Accessed May 17,2017 https://clinicaltrials.gov/ct2/show/NCT02276755.
- 132.Martineau AR & Middelkoop K. 2016. Accessed May 17,2017 https://clinicaltrials.gov/ct2/show/NCT02880982.
- 133.Fawzi W. [May 18, 2017]; 2013 Accessed. https://clinicaltrials.gov/ct2/show/NCT01798680.
- 134.Tukvadze N, Sanikidze E, Kipiani M, et al. 2015. High-dose vitamin D3 in adults with pulmonary tuberculosis: a double-blind randomized controlled trial. Am. J. Clin. Nutr 102: 1059–1069. [DOI] [PMC free article] [PubMed] [Google Scholar]
- 135.Ganmaa D, Munkhzul B, Fawzi W, et al. 2017. High-dose vitamin D3 during tuberculosis treatment in Mongolia. A randomized controlled trial. Am. J. Respir. Crit. Care Med 196: 628–637. [DOI] [PMC free article] [PubMed] [Google Scholar]
- 136.Hilger J, Friedel A, Herr R, et al. 2014. A systematic review of vitamin D status in populations worldwide. Br. J. Nutr 111: 23–45. [DOI] [PubMed] [Google Scholar]
- 137.Saraf R, Morton SMB, Camargo CA, et al. 2015. Global summary of maternal and newborn vitamin D status—a systematic review. Matern. Child Nutr 25: 1–22. [DOI] [PMC free article] [PubMed] [Google Scholar]
- 138.Cashman KD, Sheehy T & Neill CMO. 2018. Is vitamin D deficiency a public health concern for low middle income countries?: a systematic literature review. Eur. J. Nutr In press. [DOI] [PubMed] [Google Scholar]
- 139.Munns CF, Simm PJ, Rodda CP, et al. 2012. Incidence of vitamin D deficiency rickets among Australian children: an Australian Paediatric Surveillance Unit study. Med. J. Aust 196: 466–468. [DOI] [PubMed] [Google Scholar]
- 140.Strand MA, Perry J, Jin M, et al. 2007. Diagnosis of rickets and reassessment of prevalence among rural children in northern China. Pediatr. Int 49: 202–209. [DOI] [PubMed] [Google Scholar]
- 141.Bener A & Hoffmann GF. 2010. Nutritional rickets among children in a sun rich country. Int. J. Pediatr. Endocrinol 2010: 410502. [DOI] [PMC free article] [PubMed] [Google Scholar]
- 142.Karim F, Chowdhury AM & Gani MS. 2003. Rapid assessment of the prevalence of lower limb clinical rickets in Bangladesh. Public Health 117: 135–144. [DOI] [PubMed] [Google Scholar]
- 143.Thacher TD, Fischer PR, Isichei CO, et al. 2012. Prevention of nutritional rickets in Nigerian children with dietary calcium supplementation. Bone 50: 1074–1080. [DOI] [PubMed] [Google Scholar]
- 144.Ward LM, Gaboury I, Ladhani M, et al. 2007. Vitamin D-deficiency rickets among children in Canada. Can. Med. Assoc. J 177: 161–166. [DOI] [PMC free article] [PubMed] [Google Scholar]
- 145.Wheeler BJ, Dickson NP, Houghton LA, et al. 2015. Incidence and characteristics of vitamin D deficiency rickets in New Zealand children: a New Zealand Paediatric Surveillance Unit study. Aust. N. Z. J. Public Health 39: 380–383. [DOI] [PubMed] [Google Scholar]
- 146.Thacher TD, Pludowski P, Shaw NJ, et al. 2016. Nutritional rickets in immigrant and refugee children. Public Health Rev 37: 1–10. [DOI] [PMC free article] [PubMed] [Google Scholar]
- 147.Bicakci Z 2007. The relationship of hypocalcemic convulsions related to nutritional rickets with age, gender, season, and serum phosphorus levels. Neurosciences (Riyadh) 12: 302–305. [PubMed] [Google Scholar]
- 148.Brown J, Nunez S, Russell M, et al. 2009. Hypocalcemic rickets and dilated cardiomyopathy: case reports and review of literature. Pediatr. Cardiol 30: 818–823. [DOI] [PubMed] [Google Scholar]
- 149.Bansal B, Bansal M, Bajpai P, et al. 2014. Hypocalcemic cardiomyopathy—different mechanisms in adult and pediatric cases. J. Clin. Endocrinol. Metab 99: 2627–2632. [DOI] [PubMed] [Google Scholar]
- 150.Goswami R, Gupta N, Goswami D, et al. 2000. Prevalence and significance of low 25-hydroxyvitamin D concentrations in healthy subjects in Delhi. Am. J. Clin. Nutr 72: 472–475. [DOI] [PubMed] [Google Scholar]
- 151.Wagner CL & Greer FR. 2008. Prevention of rickets and vitamin D deficiency in infants, children, and adolescents. Pediatrics 122: 1142–1152. [DOI] [PubMed] [Google Scholar]
- 152.Lips P 2010. Worldwide status of vitamin D nutrition. J. Steroid Biochem. Mol. Biol 121: 297–300. [DOI] [PubMed] [Google Scholar]
- 153.Armas LAG, Dowell S, Akhter M, et al. 2007. Ultraviolet-B radiation increases serum 25-hydroxyvitamin D levels: the effect of UVB dose and skin color. J. Am. Acad. Dermatol 57: 588–593. [DOI] [PubMed] [Google Scholar]
- 154.Matsuoka LY, Ide L, Wortsman J, et al. 1987. Sun-screens suppress cutaneous vitamin D3 synthesis. J. Clin. Endocrinol. Metab 64: 1165–1168. [DOI] [PubMed] [Google Scholar]
- 155.Holick MF & Chen TC. 2008. Vitamin D deficiency: a worldwide health problem. Am. J. Clin. Nutr 87: 1080–1086. [DOI] [PubMed] [Google Scholar]
- 156.Kimlin MG, Olds WJ & Moore MR. 2007. Location and vitamin D synthesis: is the hypothesis validated by geophysical data? J. Photochem. Photobiol. B Biol 86: 234–239. [DOI] [PubMed] [Google Scholar]
- 157.Parisi AV, Turnbull DJ & Downs NJ. 2012. Influence of high levels of cloud cover on vitamin D effective and erythemal solar UV irradiances. Photochem. Photobiol. Sci 11: 1855–1859. [DOI] [PubMed] [Google Scholar]
- 158.Kimlin MG 2008. Geographic location and vitamin D synthesis. Mol. Aspects Med 29: 453–461. [DOI] [PubMed] [Google Scholar]
- 159.Whiting SJ & Calvo MS. 2017. Vitamin D fortification and supplementation policies to correct vitamin D insufficiency/deficiency globally In Vitamin D 4th ed Feldman D, Ed.: 91–108. London: Academic Press. [Google Scholar]
- 160.Dwyer JT, Wiemer KL, Dary O, et al. 2015. Fortification and health: challenges and opportunities. Adv. Nutr 6: 124–131. [DOI] [PMC free article] [PubMed] [Google Scholar]
- 161.Cheney MC 2000. Canadian experience with food fortification. Public Health Rev 28: 171–177. [PubMed] [Google Scholar]
- 162.Calvo MS, Whiting SJ & Barton CN. 2004. Vitamin D fortification in the United States and Canada: current status and data needs. Am. J. Clin. Nutr 80: 1710S–1716S. [DOI] [PubMed] [Google Scholar]
- 163.Whiting SJ, Calvo MS & Stephensen C. 2013. Chapter 43 In Current Understanding of Vitamin D Metabolism, Nutritional Status, and Role in Disease Prevention 811–838. [Google Scholar]
- 164.Tulchinsky TH 2015. The key role of government in addressing the pandemic of micronutrient deficiency conditions in Southeast Asia. Nutrients 7: 2518–2523. [DOI] [PMC free article] [PubMed] [Google Scholar]
- 165.Luthringer CL, Rowe LA, Vossenaar M, et al. 2015. Regulatory monitoring of fortified foods: identifying barriers and good practices. Glob. Health Sci. Pract 3: 446–461. [DOI] [PMC free article] [PubMed] [Google Scholar]
- 166.Aaron GJ, Sodani PR, Sankar R, et al. 2016. Household coverage of fortified staple food commodities in Rajasthan, India. PLoS One 11: e0163176. [DOI] [PMC free article] [PubMed] [Google Scholar]
- 167.Calvo MS & Whiting SJ. 2013. Survey of current vitamin D food fortification practices in the United States and Canada. J. Steroid Biochem. Mol. Biol 136: 211–213. [DOI] [PubMed] [Google Scholar]
- 168.Sacco JE, Dodd KW, Kirkpatrick SI, et al. 2013. Voluntary food fortification in the United States: potential for excessive intakes. Eur. J. Clin. Nutr 67: 592–597. [DOI] [PubMed] [Google Scholar]
- 169.Aaron GJ, Friesen VM, Jungjohann S, et al. 2017. Coverage of large-scale food fortification of edible oil, wheat flour, and maize flour varies greatly by vehicle and country but is consistently lower among the most vulnerable: results from coverage surveys in 8 countries. J. Nutr 147: 984S–994S. [DOI] [PMC free article] [PubMed] [Google Scholar]
- 170.Neufeld LM, Aaron GJ, Garrett GS, et al. 2016. Food fortification for impact: a data-driven approach. Bull. World Health Organ 94: 631–632. [DOI] [PMC free article] [PubMed] [Google Scholar]
- 171.Neufeld LM, Baker S, Garrett GS, et al. 2017. Coverage and utilization in food fortification programs: critical and neglected areas of evaluation. J. Nutr 147: 1015S–1019S. [DOI] [PMC free article] [PubMed] [Google Scholar]
- 172.Jakobesen J & Knuthsen P. 2013. Stability of vitamin D in food stuffs during cooking. Food Chem 148: 170–175. [DOI] [PubMed] [Google Scholar]
- 173.Hayes A & Cashman KD. 2017. Food-based solutions for vitamin D deficiency: putting policy into practice and the key role for research. Proc. Nutr. Soc 76: 54–63. [DOI] [PubMed] [Google Scholar]
- 174.Ritu G & Gupta A. 2014. Fortification of foods with vitamin D in India. Nutrients 6: 3601–3623. [DOI] [PMC free article] [PubMed] [Google Scholar]
- 175.Yang Z, Laillou A, Smith G, et al. 2013. A review of vitamin D fortification: implications for nutrition programming in Southeast Asia. Food Nutr. Bull 34: 81–89. [DOI] [PubMed] [Google Scholar]
- 176.Allen LH, de Benoist B, Dary O, et al. 2006. Guidelines on food fortification with micronutrients WHO; Pp. 341. [Google Scholar]
- 177.Blank S, Scanlon KS, Sinks TH, et al. 1995. An outbreak of hypervitaminosis D associated with the overfortification of milk from a home-delivery dairy. Am. J. Public Health 85: 656–659. [DOI] [PMC free article] [PubMed] [Google Scholar]
- 178.Hanson AL & Metzger LE. 2010. Evaluation of increased vitamin D fortification in high-temperature, short-time-processed 2% milk, UHT-processed 2% fat chocolate milk, and low-fat strawberry yogurt. J. Dairy Sci 93: 801–807. [DOI] [PubMed] [Google Scholar]
- 179.Cashman KD & Kiely M. 2016. Tackling inadequate vitamin D intakes within the population: fortification of dairy products with vitamin D may not be enough. Endocrine 51: 38–46. [DOI] [PubMed] [Google Scholar]
- 180.Tangpicha V, Koutkia P, Rieke SM, et al. 2003. Fortification of orange juice with vitamin D: a novel approach for enhancing vitamin D nutritional health. Am. J. Clin. Nutr 77: 1478–1483. [DOI] [PubMed] [Google Scholar]
- 181.Hemery YM, Fontan L, Moench-Pfanner R, et al. 2015. Influence of light exposure and oxidative status on the stability of vitamins A and D3 during the storage of fortified soybean oil. Food Chem 184: 90–98. [DOI] [PubMed] [Google Scholar]
- 182.Aguiar M, Andronis L, Pallan M, et al. 2017. Preventing vitamin D deficiency (VDD): a systematic review of economic evaluations. Eur. J. Public Health 27: 292–301. [DOI] [PubMed] [Google Scholar]
- 183.Newmark HL, Heaney RP & Lachance PA. 2004. Should calcium and vitamin D be added to the current enrichment program for cereal-grain products? Am. J. Clin. Nutr 80: 264–270. [DOI] [PubMed] [Google Scholar]
- 184. [July 30, 2018]; WHO/FFI joint harmonization workshop for wheat and flour fortification. 2012 Accessed. http://www.emro.who.int/nutrition/nutrition-events/fortification-workshop-jordan.html.
- 185.Natri A-M, Salo P, Vikstedt T, et al. 2006. Bread fortified with cholecalciferol increases the serum 25-hydroxyvitamin D concentration in women as effectively as a cholecalciferol supplement. J. Nutr 136: 123–127. [DOI] [PubMed] [Google Scholar]
- 186.Itkonen ST, Skaffari E, Saaristo P, et al. 2016. Effects of vitamin D2-fortified bread v. supplementation with vitamin D2 or D3 on serum 25-hydroxyvitamin D metabolites: an 8-week randomised-controlled trial in young adult Finnish women. Br. J. Nutr 115: 1232–1239. [DOI] [PubMed] [Google Scholar]
- 187.Mocanu V, Stitt PA, Costan AR, et al. 2009. Long-term effects of giving nursing home residents bread fortified with 125 μg (5000 IU) vitamin D(3) per daily serving. Am. J. Clin. Nutr 89: 1132–1137. [DOI] [PubMed] [Google Scholar]
- 188.Nikooyeh B, Neyestani TR, Zahedirad M, et al. 2016. Vitamin D-fortified bread is as effective as supplement in improving vitamin D status: a randomized clinical trial. J. Clin. Endocrinol. Metab 101: 2511–2519. [DOI] [PubMed] [Google Scholar]
- 189.Adams AM, Ahmed R, Latif AHMM, et al. 2017. Impact of fortified biscuits on micronutrient deficiencies among primary school children in Bangladesh. PLoS One 12: e0174673. [DOI] [PMC free article] [PubMed] [Google Scholar]
- 190.Wirth JP, Nichols E, Mas’d H, et al. 2013. External mill monitoring of wheat flour fortification programs: an approach for program managers using experiences from Jordan. Nutrients 5: 4741–4759. [DOI] [PMC free article] [PubMed] [Google Scholar]
- 191.Dunn ML, Jain V & Klein BP. 2014. Stability of key micronutrients added to fortified maize flours and corn meal. Ann. N.Y. Acad. Sci 1312: 15–25. [DOI] [PubMed] [Google Scholar]
- 192.Calvo MS, Babu US, Garthoff LH, et al. 2013. Vitamin D2 from light-exposed edible mushrooms is safe, bioavailable and effectively supports bone growth in rats. Osteoporos. Int 24: 197–207. [DOI] [PubMed] [Google Scholar]
- 193.Mehrotra A, Calvo MS, Beelman RB, et al. 2014. Bioavailability of vitamin D2 from enriched mushrooms in prediabetic adults: a randomized controlled trial. Eur. J. Clin. Nutr 68: 1154–1160. [DOI] [PubMed] [Google Scholar]
- 194.Cashman KD, Kiely M, Seamans KM, et al. 2016. Effect of ultraviolet light-exposed mushrooms on vitamin D status: liquid chromatography-tandem mass spectrometry reanalysis of biobanked sera from a randomized controlled trial and a systematic review plus meta-analysis. J. Nutr 146: 565–575. [DOI] [PubMed] [Google Scholar]
- 195.Mahmud M, Shirshir RI & Hasan R. 2012. Fortification of wheat bread using mushroom powder. Bangladesh Res. Pub. J 7: 60–68. [Google Scholar]
- 196.Okafor JNC,Okafor GI,Ozumba AU,et al. 2012. Quality characteristics of bread made from wheat and Nigerian Oyster Mushrooms (Pleurotus pulmonarius) powder. Pakistan J. Nutr 11: 5–10. [Google Scholar]
- 197.Corey ME, Beelman RB, Seetharman K, et al. 2009. Potential for nutritional enrichment of whole-wheat bread with portabella mushroom powder (Agaricus bisporus (J. lge) Imbach, Agaricomycetideae). Int. J. Med. Mushrooms 11: 157–166. [Google Scholar]
- 198.Schleicher RL, Sternberg MR, Lacher DA, et al. 2016. The vitamin D status of the US population from 1988 to 2010 using standardized serum concentrations of 25-hydroxyvitamin D shows recent modest increases. Am. J. Clin. Nutr 104: 454–461. [DOI] [PMC free article] [PubMed] [Google Scholar]
- 199.Greene-Finestone LS, Langlois KA & Whiting SJ. 2013. Characteristics of users of supplements containing vitamin D in Canada and associations between dose and 25-hydroxvitamin D. Appl. Physiol. Nutr. Metab 38: 707–715. [DOI] [PubMed] [Google Scholar]
- 200.UNICEF. 2015. UNICEF Nutridash global report 2014
- 201.WHO. 2016. WHO guideline: use of multiple micronutrient powders for point-of-use fortification of foods consumed by infants and young children aged 6–23 months and children aged 2–12 years [PubMed]
- 202. [September 15, 2017]; WHO ELENA. Accessed. http://www.who.int/elena/titles/vitamind_infants/en/.
- 203.Gernand AD, Schulze KJ, Stewart CP, et al. 2016. Micronutrient deficiencies in pregnancy worldwide: health effects and prevention. Nat. Rev. Endocrinol 12: 274–289. [DOI] [PMC free article] [PubMed] [Google Scholar]
- 204.Ish-Shalom S, Segal E, Salganik T, et al. 2008. Comparison of daily, weekly, and monthly vitamin D3 in ethanol dosing protocols for two months in elderly hip fracture patients. J. Clin. Endocrinol. Metab 93: 3430–3435. [DOI] [PubMed] [Google Scholar]
- 205.Chel V, Wijnhoven HAH, Smit JH, et al. 2007. Efficacy of different doses and time intervals of oral vitamin D supplementation with or without calcium in elderly nursing home residents. Osteoporos. Int 19: 663–671. [DOI] [PMC free article] [PubMed] [Google Scholar]
- 206.Hollis BW & Wagner CL. 2013. Clinical review: the role of the parent compound vitamin D with respect to metabolism and function: why clinical dose intervals can affect clinical outcomes. J. Clin. Endocrinol. Metab 98: 4619–4628. [DOI] [PMC free article] [PubMed] [Google Scholar]
- 207.Zheng YT, Cui QQ, Hong YM, et al. 2015. A meta-analysis of high dose, intermittent vitamin D supplementation among older adults. PLoS One 10: e0115850. [DOI] [PMC free article] [PubMed] [Google Scholar]
- 208.Dhesi JK, Jackson SHD, Bearne LM, et al. 2004. vitamin D supplementation improves neuromuscular function in older people who fall. Age Ageing 33: 589–595. [DOI] [PubMed] [Google Scholar]
- 209.De Geest S & Sabaté E. 2003. Adherence to long-term therapies: evidence for action. Eur. J. Cardiovasc. Nurs 2: 323. [DOI] [PubMed] [Google Scholar]
- 210.Haynes RB, Ackloo E, Sahota N, et al. 2008. Interventions for enhancing medication adherence. Cochrane Database Syst. Rev CD000011. [DOI] [PubMed] [Google Scholar]
- 211.Moy RJ, McGee E, Debelle GD, et al. 2012. Successful public health action to reduce the incidence of symptomatic vitamin D deficiency. Arch. Dis. Child 97: 952–954. [DOI] [PubMed] [Google Scholar]
- 212.Ozkan Ş,H,B & Bereket A. 2011. Vitamin D deficiency and prevention: Turkish experience. Acta Paediatr 100: 1195–1199. [DOI] [PubMed] [Google Scholar]
- 213.Huynh J, Lu T, Liew D, et al. 2017. Vitamin D in newborns. A randomised controlled trial comparing daily and single oral bolus vitamin D in infants. J. Paediatr. Child Health 53: 163–169. [DOI] [PubMed] [Google Scholar]
- 214.Shakiba M, Sadr S, Nefei Z, et al. 2010. Combination of bolus dose vitamin D with routine vaccination in infants: a randomised trial. Singapore Med. J 51: 440–445. [PubMed] [Google Scholar]
- 215.Hollis BW & Wagner CL. 2004. Assessment of dietary vitamin D requirements during pregnancy and lactation. Am. J. Clin. Nutr 79: 717–726. [DOI] [PubMed] [Google Scholar]
- 216. [August 7, 2018]; World Health Organisation. 2015 Accessed. http://www.who.int/immunization/programmes_systems/interventions/vitamin_A/en/index1.html.
- 217.Science M, Maguire JL, Russell ML, et al. 2014. Serum 25-hydroxyvitamin D level and influenza vaccine immunogenicity in children and adolescents. PLoS One 9: e83553. [DOI] [PMC free article] [PubMed] [Google Scholar]
- 218.Lin CJ, Martin JM, Cole KS, et al. 2017. Are children’s vitamin D levels and BMI associated with antibody titers produced in response to 2014–2015 influenza vaccine? Hum. Vaccin. Immunother 13: 1661–1665. [DOI] [PMC free article] [PubMed] [Google Scholar]
- 219.Lalor MK, Floyd S, Gorak-Stolinska P, et al. 2012. BCG vaccination: a role for vitamin D? PLoS One 6: e16709. [DOI] [PMC free article] [PubMed] [Google Scholar]
- 220.Cashman KD, Kiely M, Kinsella M, et al. 2013. Evaluation of Vitamin D Standardization Program protocols for standardizing serum 25-hydroxyvitamin D data: a case study of the program’s potential for national nutrition and health surveys. Am. J. Clin. Nutr 97: 1235–1242. [DOI] [PMC free article] [PubMed] [Google Scholar]
- 221. [May 18, 2017]; Micronutrient Survey Toolkit. 2016 Accessed. http://surveytoolkit.micronutrient.org/.
- 222. [May 17, 2017]; WHO. Accessed. http://www.who.int/vmnis/toolkit/en/
- 223.Sheehy T & Sharma S. 2011. The nutrition transition in the Republic of Ireland: trends in energy and nutrient supply from 1961 to 2007 using Food and Agriculture Organization food balance sheets. Br. J. Nutr 106: 1078–1089. [DOI] [PubMed] [Google Scholar]
- 224.Guallar E, Miller ER, Ordovas JM, et al. 2010. Vitamin D supplementation in the age of lost innocence. Ann. Intern. Med 152: 327–329. [DOI] [PubMed] [Google Scholar]
- 225.FAO & World Health Organization. 2005. Vitamin and mineral requirements in human nutrition 2nd ed World Health Organization; 1–20. [Google Scholar]
- 226.Australian National Health and Medical Research Council (NHMRC) & New Zealand Ministry of Health (MoH). 2006. Nutrient reference values for Australia and New Zealand
- 227.EFSA. 2016. Nordic Council of Ministers Nordic Nutrition Recommendations 5th ed European Food Safety Authority (EFSA) Panel on Dietetic Products Nutrition and Allergies. [Google Scholar]
- 228.German Nutrition Society. 2012. New reference values for vitamin D. Ann. Nutr. Metab 60: 241–246. [DOI] [PubMed] [Google Scholar]
- 229.Bodnar LM, Simhan HN, Powers RW, et al. 2007. High prevalence of vitamin D insufficiency in black and white pregnant women residing in the northern United States and their neonates. J. Nutr 137: 447–452. [DOI] [PMC free article] [PubMed] [Google Scholar]
- 230.Ganji V, Zhang X & Tangpricha V. 2012. Serum 25-hydroxyvitamin D concentrations and prevalence estimates ofhypovitaminosisDintheU.S.populationbasedonassay-adjusted data. J. Nutr 142: 498–507. [DOI] [PubMed] [Google Scholar]
- 231.Ginde AA, Sullivan AF, Mansbach JM, et al. 2010. vitamin D insufficiency in pregnant and nonpregnant women of childbearing age in the United States. Am. J. Obstet. Gynecol 202: 436.e1–8. [DOI] [PMC free article] [PubMed] [Google Scholar]
- 232.Marwaha RK, Tandon N, Chopra S, et al. 2011. vitamin D status in pregnant Indian women across trimesters and different seasons and its correlation with neonatal serum 25-hydroxyvitamin D levels. Br. J. Nutr 106: 1383–1389. [DOI] [PubMed] [Google Scholar]
- 233.Majumdar V, Nagaraja D & Christopher R. 2011. Vitamin D status and metabolic syndrome in Asian Indians. Int. J. Obes 35: 1131–1134. [DOI] [PubMed] [Google Scholar]
- 234.Hovsepian S, Amini M, Aminorroaya A, et al. 2011. Prevalence of vitamin D deficiency among adult population of Isfahan City, Iran. J. Health Popul. Nutr 29: 149–155. [DOI] [PMC free article] [PubMed] [Google Scholar]
- 235.Sonneville KR, Gordon CM, Kocher MS, et al. 2012. Vitamin D, calcium, and dairy intakes and stress fractures among female adolescents. Arch. Pediatr. Adolesc. Med 166: 595–600. [DOI] [PMC free article] [PubMed] [Google Scholar]