Abstract
Background
Machine-learning methods such as the Bayesian belief network, random forest, gradient boosting machine, and decision trees have been used to develop decision-support tools in other clinical settings. Opioid abuse is a problem among civilians and military service members, and it is difficult to anticipate which patients are at risk for prolonged opioid use.
Questions/purposes
(1) To build a cross-validated model that predicts risk of prolonged opioid use after a specific orthopaedic procedure (ACL reconstruction), (2) To describe the relationships between prognostic and outcome variables, and (3) To determine the clinical utility of a predictive model using a decision curve analysis (as measured by our predictive system’s ability to effectively identify high-risk patients and allow for preventative measures to be taken to ensure a successful procedure process).
Methods
We used the Military Analysis and Reporting Tool (M2) to search the Military Health System Data Repository for all patients undergoing arthroscopically assisted ACL reconstruction (Current Procedure Terminology code 29888) from January 2012 through December 2015 with a minimum of 90 days postoperative follow-up. In total, 10,919 patients met the inclusion criteria, most of whom were young men on active duty. We obtained complete opioid prescription filling histories from the Military Health System Data Repository’s pharmacy records. We extracted data including patient demographics, military characteristics, and pharmacy data. A total of 3.3% of the data was missing. To curate and impute all missing variables, we used a random forest algorithm. We shuffled and split the data into 80% training and 20% hold-out sets, balanced by outcome variable (Outcome90Days). Next, the training set was further split into training and validation sets. Each model was built on the training data set, tuned with the validation set as applicable, and finally tested on the separate hold-out dataset. We chose four predictive models to develop, at the end choosing the best-fit model for implementation. Logistic regression, random forest, Bayesian belief network, and gradient boosting machine models were the four chosen models based on type of analysis (classification). Each were trained to estimate the likelihood of prolonged opioid use, defined as any opioid prescription filled more than 90 days after anterior cruciate reconstruction. After this, we tested the models on our holdout set and performed an area under the curve analysis concordance statistic, calculated the Brier score, and performed a decision curve analysis for validation. Then, we chose the method that produced the most suitable analysis results and, consequently, predictive power across the three calculations. Based on the calculations, the gradient boosting machine model was selected for future implementation. We systematically selected features and tuned the gradient boosting machine to produce a working predictive model. We performed area under the curve, Brier, and decision curve analysis calculations for the final model to test its viability and gain an understanding of whether it is possible to predict prolonged opioid use.
Results
Four predictive models were successfully developed using gradient boosting machine, logistic regression, Bayesian belief network, and random forest methods. After applying the Boruta algorithm for feature selection based on a 100-tree random forest algorithm, features were narrowed to a final seven features. The most influential features with a positive association with prolonged opioid use are preoperative morphine equivalents (yes), particular pharmacy ordering sites locations, shorter deployment time, and younger age. Those observed to have a negative association with prolonged opioid use are particular pharmacy ordering sites locations, preoperative morphine equivalents (no), longer deployment, race (American Indian or Alaskan native) and rank (junior enlisted).
On internal validation, the models showed accuracy for predicting prolonged opioid use with AUC greater than our benchmark cutoff 0.70; random forest were 0.76 (95% confidence interval 0.73 to 0.79), 0.76 (95% CI 0.73 to 0.78), 0.73 (95% CI 0.71 to 0.76), and 0.72 (95% CI 0.69 to 0.75), respectively. Although the results from logistic regression and gradient boosting machines were very similar, only one model can be used in implementation. Based on our calculation of the Brier score, area under the curve, and decision curve analysis, we chose the gradient boosting machine as the final model. After selecting features and tuning the chosen gradient boosting machine, we saw an incremental improvement in our implementation model; the final model is accurate, with a Brier score of 0.10 (95% CI 0.09 to 0.11) and area under the curve of 0.77 (95% CI 0.75 to 0.80). It also shows the best clinical utility in a decision curve analysis.
Conclusions
These scores support our claim that it is possible to predict which patients are at risk of prolonged opioid use, as seen by the appropriate range of hold-out analysis calculations. Current opioid guidelines recommend preoperative identification of at-risk patients, but available tools for this purpose are crude, largely focusing on identifying the presence (but not relative contributions) of various risk factors and screening for depression. The power of this model is that it will permit the development of a true clinical decision-support tool, which risk-stratifies individual patients with a single numerical score that is easily understandable to both patient and surgeon. Probabilistic models provide insight into how clinical factors are conditionally related. Not only will this gradient boosting machine be used to help understand factors contributing to opiate misuse after ACL reconstruction, but also it will allow orthopaedic surgeons to identify at-risk patients before surgery and offer increased support and monitoring to prevent opioid abuse and dependency.
Level of Evidence
Level III, therapeutic study.
Introduction
Opioid abuse is a problem among civilians and military personnel. The United States Department of Defense Military Health System and Veterans Health Administration recognize that prescription opioid analgesics are the most misused drug class in the United States and second only to marijuana among illicit drugs of abuse [7]. In 2010, the military recognized the need to mitigate opioid misuse as a military health priority by recommending a more cautious approach to prescribing opioids. It also focused attention on researching the surveillance, detection, and management of opioid misuse [3, 7, 11, 18, 31].
Currently, orthopaedic surgeons are the third-highest prescribers of opioids among physicians, accounting for 7.7% of all opioid prescriptions in the United States [7, 8, 27, 29, 40]. Understanding the risk factors that lead to prolonged opioid use may help guide orthopaedic surgeons as they consider how much, if any, opioids should be prescribed perioperatively and postoperatively. In a retrospective study from 2006 to 2014 in adults on TRICARE who underwent lumbar interbody arthrodesis, discectomy, decompression, or posterolateral arthrodesis, the duration of preoperative opioid use appeared to be the most important factor associated with continued opioid use for longer than 90 days after surgery [32].
Statistical predictive modeling including Bayesian classification has been used at our institution to develop decision-support tools [15] and in studies on the spine to predict opioid use [22]. We believe statistical predictive modeling is well-suited to analyze variables inherent to the predictors of prolonged opioid use because it codifies highly complex relationships into clear graphic representations that are easily understood. To our knowledge, this approach has not been applied to patients for opioid use after ACL reconstruction.
The purposes of this study were (1) To build a cross-validated model that predicts the risk of prolonged opioid use after a specific orthopaedic procedure (ACL reconstruction), (2) To describe the relationships between prognostic and outcome variables, and (3) To determine the clinical utility of a predictive model using a decision curve analysis (as measured by our predictive system’s ability to effectively identify high-risk patients and allow for preventative measures to be taken to ensure a successful procedure process).
Patients and Methods
Guidelines
This retrospective analysis of longitudinally maintained data in a prognostic classification study followed the Transparent Reporting of a Multivariable Prediction Model for Individual Prognosis or Diagnosis guidelines [12] and the Guidelines for Developing and Reporting Statistical predictive modeling Models in Biomedical Research [26].
Data
The Military Health System Data Repository contains patient-level detail on all healthcare encounters for Military Health System beneficiaries. After institutional review board approval was obtained, we used the Military Analysis and Reporting Tool (M2) to search the Military Health System Data Repository for all patients undergoing ACL reconstruction from January 2012 through December 2015. Patients were included if they had an encounter that was assigned a Current Procedural Terminology code for arthroscopically assisted ACL reconstruction (29888), were active-duty military personnel at the time of surgery, and a minimum of 90 days follow-up postoperatively (Fig. 1).
Fig. 1.
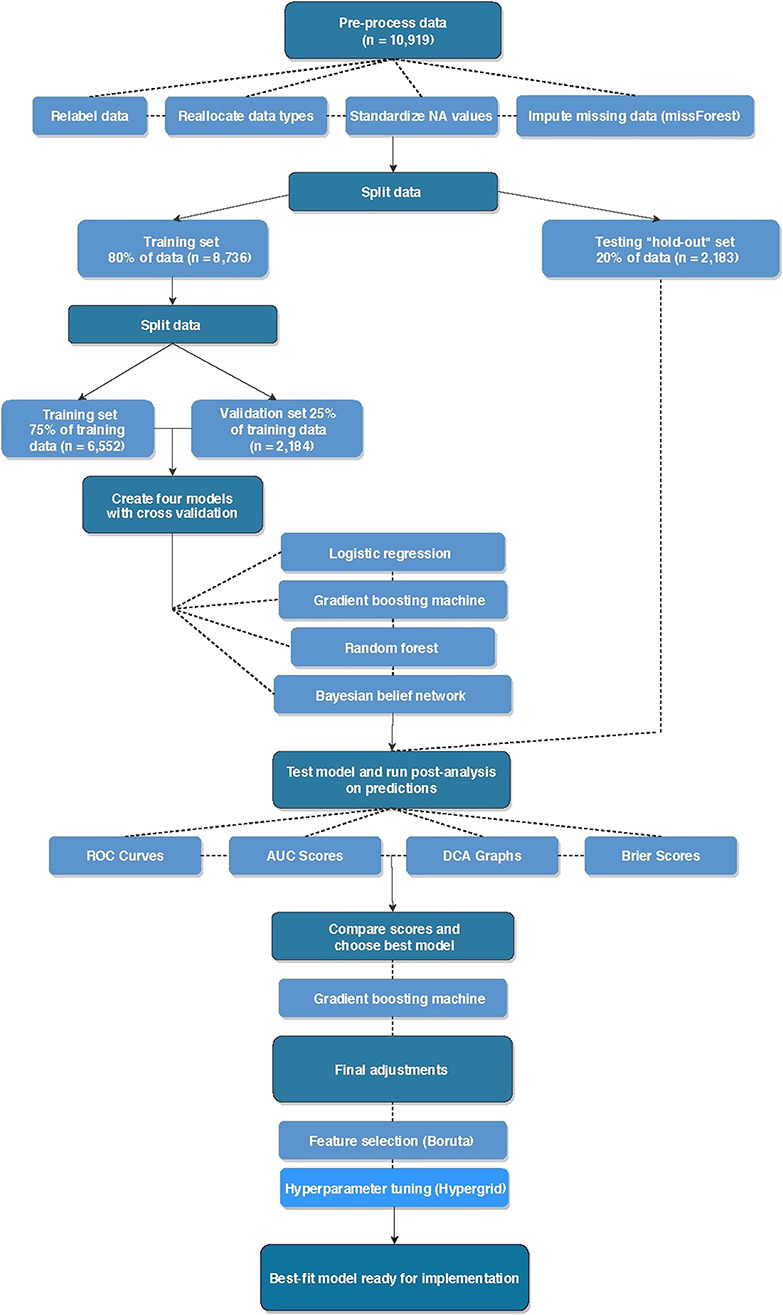
This figure illustrates the study workflow for development of a predictive model. The first step is data pre-processing, which includes relabeling data, reallocating data types, standardizing not applicable values, and imputing missing data (missForest). The second step is splitting the data set into a training set for model development and then a testing hold-out set that is used later for model final testing. The third step is splitting the training set into training and validation sets. These sets undergo cross validation before being used to develop the four model types selected for this study (logistic regression, gradient boosting machine, random forest, and Bayesian belief network). The fourth step is model testing on the hold-out set and performance measures. The fifth step is selection of the best model based on performance measures and final adjustments with feature selection and hyperparameter tuning, as applicable. The final step is model implementation; AUC = area under the curve; DCA = decision curve analysis; ROC = receiver operating characteristic; NA = not applicable.
We obtained complete opioid prescription filling history for the patients using pharmacy records through the same system. We tracked preoperative opioid prescriptions (before 30 days preoperatively) and prolonged opioid prescriptions (between 90 and 365 days postoperatively) for all patients. Opioid prescriptions between 30 days preoperatively and 90 days postoperatively were considered perioperative prescriptions for a surgical intervention. Previous evidence has defined a chronic opioid user as a patient who fills a prescription preoperatively at 30 to 120 days from surgery or new persistent opioid use, which was defined as an opioid prescription fulfillment between 90 and 180 days after a surgical procedure [2, 6, 37].
We standardized cumulative dosing by converting all opioid prescriptions to morphine equivalents using official CDC opioid prescribing guidelines [13, 14].
Preoperative diagnoses of substance abuse disorders were documented using ICD-9 codes for opioid associated substance abuse (30400, 30401, 30402, 30403, 30460, 30461, 30462, 30463, 30470, 30471, 30472, 30473, 30490, 30491, 30492, 30550, 30551, 30552, 30553, 30590 30591 30592, and 30593). Patients were excluded if they had incomplete opioid prescribing history.
Data extracted for analysis included patient demographics (age, gender, and self-reported patient race), military employment characteristics (rank, service, total time deployed, and rank), and pharmacy data (quantity of opioids prescribed at each time period in morphine equivalents, number of refills, and the clinic from which patients received prescriptions).
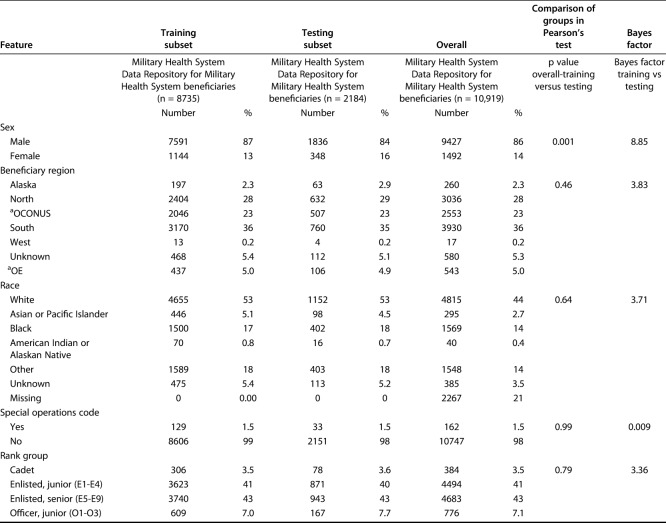
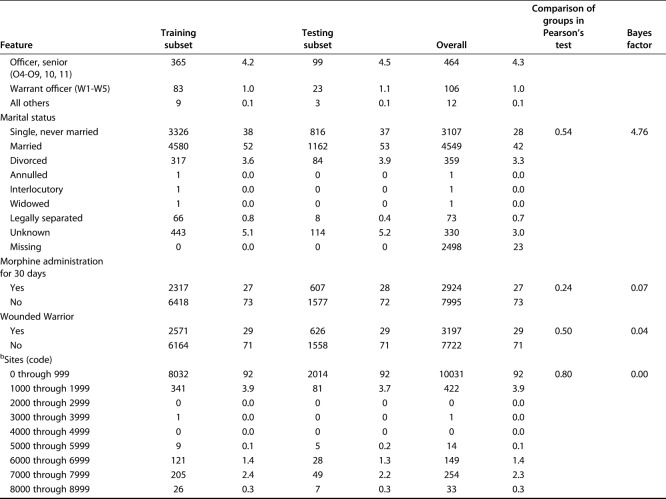
A total of 10,919 patients met the inclusion criteria. The study population paralleled the Department of Defense population of young, white men. The mean patient age was 29 years; 14% (1492 of 10,919) were women and 86% (9427 of 10,919) were men. The population self-reported race was diverse, with 44% (4815 of 10,919) of the group being white patients, 14% (1569 of 10,919) black patients, 3% (295 of 10,919), Asian patients, 0.4% (40 of 10,919) American Indian or Alaskan Native patients, and 4% (385 of 10,919) patients whose race was categorized as other or unknown. Seventy-four patients (0.7%) had a preoperative diagnosis of substance abuse. As expected, when performing internal validation, the patient demographic features in the validation set did not differ from those of patients in the training set (Table 1). This was the same for the categorical clinical features of patients (Table 2).
Table 1.
Continuous variables in the training and validation sets
Table 2.
Categorical variables in the training and validation sets
Missing Data
Data were missing in 3.3% of the records, in the variables of race, marital status, and ordering site (Fig. 1). The missing data were imputed using the entire data set before splitting into a balanced train and test set to ensure non-bias of missing data. The missing data were imputed using the random forest algorithm with 100 trees via the missForest package in R© Version 3.5.1 (R Foundation for Statistical Computing, Vienna, Austria) [33]. After missing data were imputed, race and marital status remained categorical, with six and eight categories, respectively. Missing ordering sites were imputed as a numeric variable to surpass categorical imputation limitations. By imputing as a numeric variable, all 9999 available ordering site codes were considered. Before modeling, categorical variables were listed as factors and numerical variables were listed as numeric.
Modeling Building
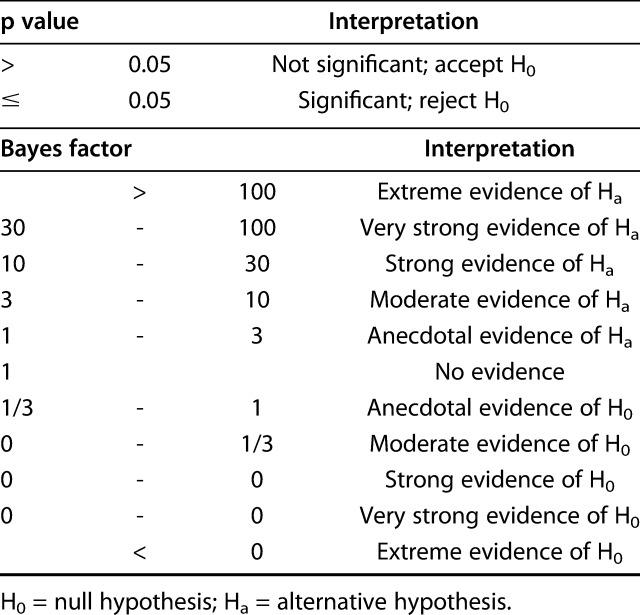
Using the training set, all models were designed to estimate the likelihood of prolonged opioid use beyond 90 days postoperatively. The Bayes factor accounts for prior evidence for an alternative hypothesis, while traditional p values do not. Therefore, we applied a Bayes theorem to compare the training and testing sets [1]. Differences in continuous variables were assessed using the Bayes factor t-test and Welch’s t-test, comparing means (t-test) using the BayesFactor library in R. Differences between categorical variables were assessed using a Bayes factor contingency table comparison (contingency TableBF in R) (Table 3). For comparison, we used Pearson’s chi-square test and Fisher’s exact test, as appropriate. Without a convincing reason why a difference between groups should only be in one direction, we chose a two-sided, unpaired t-test with 0.95 confidence level and otherwise default settings.
Table 3.
Bayes factor contingency table
Feature Selection
We performed feature selection to determine which data features were used to train the machine-learning models. These techniques are unique and specific to each modeling method, and we chose to report only the features associated with the best modeling technique, gradient boosting machine. The feature selection process was unique to each modeling method and is briefly described below. To develop the Bayesian belief network, random forest, and logistic regression models, we used commercially available statistical software (JMP Pro Version 14.1.0, SAS Institute, Cary, NC, USA). For the Bayesian belief network, all 10 variables were considered candidates for inclusion in the model. Using a stepwise process, we pruned unrelated and redundant features from the preliminary models to produce the final model in a manner previously described [15]. Similarly, the RF model was created by incorporating all 10 variables. For comparison, we developed a conventional logistic regression model by incorporating features demonstrating potential significance in a univariate analysis (age, gender, marital status, geographic region, race, total days deployed, rank, combat wounded, ordering site, preoperative morphine equivalents [yes or no], and prolonged postoperative morphine equivalents defined as opioid use at longer than 90 days after ACL reconstruction [yes or no]).
The gradient boosting machine algorithm was created using the GBM package in R. After applying the Boruta algorithm for feature selection based on a 100 tree random forest algorithm, features were narrowed to a final seven features. Then, the Boruta package in R automated the feature selection process for the gradient boosting machine. Based on the random forest (RF) classification algorithm, Boruta systematically eliminates irrelevant variables by comparing their calculated importance and randomly calculated importance. To estimate each first-degree associate’s relative importance, we ranked each variable according to its influence in reducing the loss of function [16]. Finally, we characterized the magnitude and direction of each feature’s positive or negative association with the outcome of interest using the local interpretable model-agnostic explanations (LIME) package in R. [30].
Model Selection
We chose gradient boosting machine because it had the best area under the curve score. Gradient boosting is a decision-tree machine-learning technique that builds an ensemble of shallow and weak trees or learners in succession (rather at than at once as in RF statistical predictive modeling) so each tree learns and improves from the previous tree. Gradient boosting machine train models in a gradual, additive, and sequential manner that strengthens the final product [16]. This means that a gradient boosting machine is a predictor built on the strength of previous, smaller predictors. Although the results from logistic regression and gradient boosting machines were very similar, only one model can be used in implementation. Based on the model’s accuracy and the features of gradient boosting machine, this modeling technique was determined to be the best method for the dataset.
Model Hyperparameter Tuning
One benefit of gradient boosting machine is that the model will continue improving to minimize error. However, this may result in an overemphasis on data outliers and model overfitting. It is important to understand the hyperparameters available to tune a gradient boosting machine to prevent overfitting. These parameters indicate that the gradient boosting machine is variable. These may be categorized into the following categories [16, 38]: (1) Tree structure: the number of iterations or trees and complexity of trees (n.trees and interaction.depth, respectively, in the GBM package in R© Version 3.5.1); (2) Learning rate: the time it takes for the algorithm to adapt (shrinkage in the GBM package); (3) Number of observations: the minimum number of training set samples in a node to commence splitting (n.minobsinnode in the GBM package); and (4) Subsampling rate (bag.fraction in the GBM package). With each iteration, the number of trees and the depth of each tree or degree of feature interactions in the mode are assessed. Shrinkage is the technique of improving the model’s accuracy by decreasing the learning rate or building the model in very small steps. However, with a decreased learning rate, more iterations are required to build the gradient boosting machine. Therefore, we chose to tune the iteration parameter. We monitored the relationship of the error score in the train and validation sets with iterations of the gradient boosting machine. The chosen iteration was that which corresponds to the lowest error score in the validation subset. We set the gradient boosting machine to perform 2500 iterations and set the final model to the ideal number of iterations within the 2500 (Fig. 2). Finally, stochastic gradient boosting was used to ensure the training set’s datapoints were selected randomly.
Fig. 2.
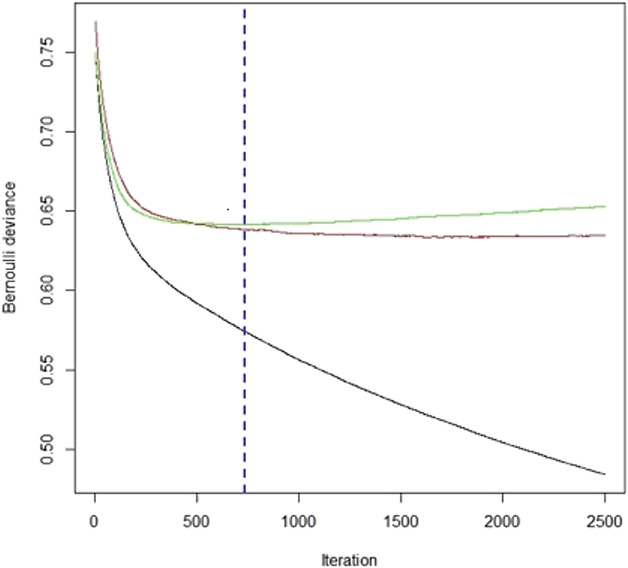
This is a minimum validation of the loss of function curve in which the y-axis represents the Bernoulli error and the x-axis represents the number of iterations for the gradient boosting machine. The green line represents the training dataset and the red line represents the validation set. GBM = gradient boosting machine.
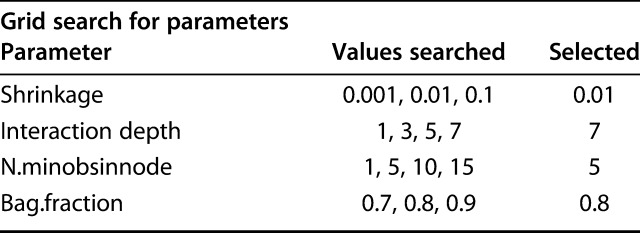
Model tuning helps improve performance and prevent overfitting by stopping stop the machine-learning technique before the model loses its function. However, it may become time-consuming to find the best combination of hyperparameters. To aid this process, we used a hyperparameter grid, in which the computer systematically runs through various inputted options to choose the best combination of parameters. We chose parameters based on a grid search system including a range of values for each hyperparameter and then selected tuning parameters that produce the lowest validation error of all combinations in the hypergrid (Fig. 2). To ensure or verify that we did not overfit the data, a binary loss function (Bernoulli deviance) was determined with each iteration during model development and tuning. The hyperparameters corresponding to the best iteration and minimal validation loss of the gradient boosting machine were interaction depth 7, shrinkage 0.01, n.minobsinnode 5, and bag.fraction 0.8 (Table 4).
Table 4.
Hypergrid parameters
Performance Assessment
We evaluated model performance separately based on measures of calibration (calibration plot), discrimination (area under the receiver operating characteristic curve), and overall model performance (Brier score) [34, 35]. A calibration plot helps determine the agreement between the model predicted outcomes and those observed in the data set. We determined the model’s accuracy by estimating the area under the receiver operating characteristic curve. This score ranges from 0.50 to 1.0, where 1.0 represents the highest discriminatory ability and 0.50 represents the lowest discriminatory ability. For overall performance, a Brier score of 0 indicates perfect model prediction, while a score of 1 indicates the worst model prediction [5]. Then, we evaluated whether each model was suitable for clinical use by performing a decision curve analysis [35, 39]. In the decision curve analysis, each model demonstrated clinical usefulness in predicting whether a patient was at risk of prolonged opioid use. In brief, the x-axis of the decision curve represented a threshold probability, which was the point at which the medical provider would be indecisive about whether a patient would continue using opioids beyond 90 days postoperatively. Before assessing the decision curve, a physician must determine his or her clinical threshold for assuming whether or not a patient will have prolonged opioid use postoperatively. This is called clinical equipoise. Decision curves do not tell the provider how to treat a patient, but they help the provider decide when to use a clinical support tool.
Results
Build a Cross-validated Model That Predicts Risk of Prolonged Opioid Use After a Specific Orthopaedic Procedure
All four modeling algorithms had discriminative performance and were appropriately calibrated to the dataset (Fig. 3). The models demonstrated that statistical predictive modeling could be used to estimate the likelihood of prolonged opioid use at longer than 90 days after ACL reconstruction. The gradient boosting machine had the highest area under the curve by a small margin (0.76 [95% CI 0.73 to 0.79]), followed by logistic regression (0.76 [95% CI 0.73 to 0.78]), Bayesian belief network (0.73 [95% CI 0.71 to 0.76]), and random forest (0.72 [95% CI 0.69 to 0.75]) (Table 5). We chose to use the gradient boosting machine because it had the best area under the curve score, given that other measures were generally comparable with logistic regression. After selecting the gradient boosting machine as the final model to be used in implementation, selecting features, and hypertuning, we found that the Brier score was 0.10 (95% CI 0.09 to 0.11) and the area under the curve was 0.77 (95% CI 0.75 to 0.80) (Fig. 4 ).
Fig. 3.
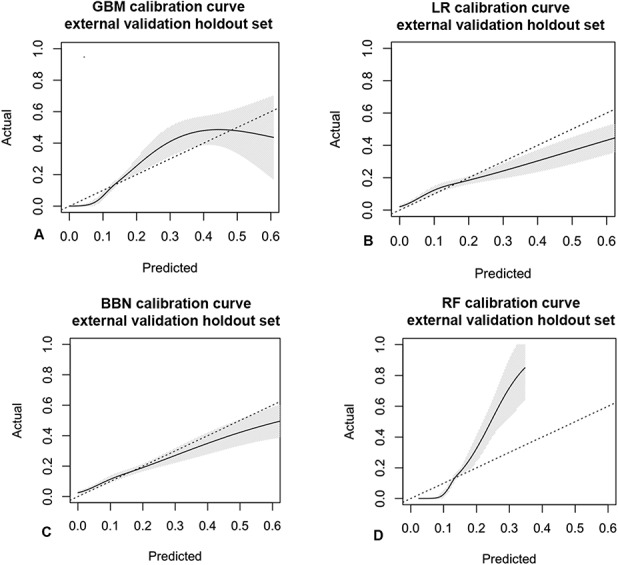
Calibration curves of the validation dataset show agreement between the observed outcomes and those predicted by the (A) gradient boosting machine, (B) logistic regression, (C) Bayesian belief network, and (D) random forest. The shaded region depicts the 95% CI of the predictions. Perfect calibration to the training data should overlie the 45° dotted line. Each model is reasonably well-calibrated to the internal training data; GBM = gradient boosting machine; LR = logistic regression; BBN = Bayesian belief network; RF = random forest.
Table 5.
The accuracy of the predictive model
Fig. 4.
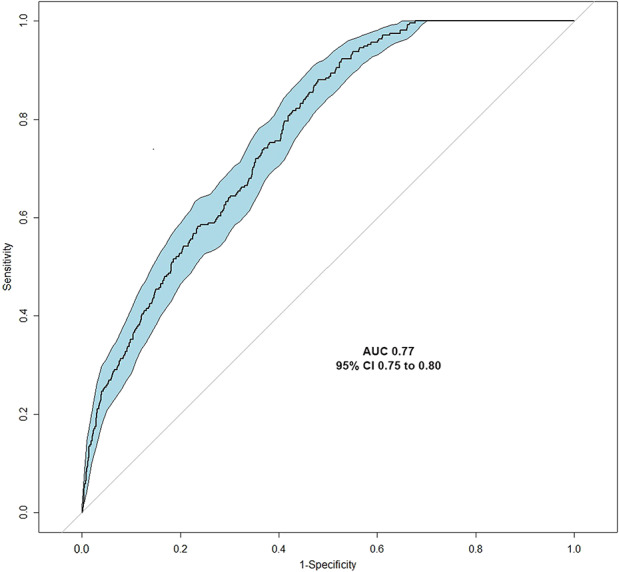
A receiver operating characteristic curve analysis was used to calculate the area under the curve as a measure of the gradient boosting machine model’s accuracy, with an area under the curve cutoff of greater than 0.70 determined a priori. AUC = area under the curve; GBM = gradient booting machine.
Describe the Relationships Between Prognostic and Outcome Variables
The gradient boosting machine had seven features associated with our outcome of interest: opioid prescriptions after ACL reconstruction. In relative order of importance, they were the total number of ordering sites (33), total preoperative morphine equivalents (21), total days deployed (15), age (10), geographic region (6), race (5), and rank (3) (Fig. 5). These measures indicate the relative importance of each variable in the model. For example, ordering site has the strongest influence on the model. It is the most important feature and accounts for 33% of the reduction to the loss function for the gradient boosting machine [28]. Important feature levels that support the outcome of interest in the positive direction are preoperative morphine equivalents (yes), particular pharmacy ordering sites locations, shorter deployment time, and younger age. Top feature levels that show negative directionality are particular pharmacy ordering sites locations, preoperative morphine equivalents (no), longer deployment, race (American Indian or Alaskan native) and rank (junior enlisted) (Fig. 6).
Fig. 5.
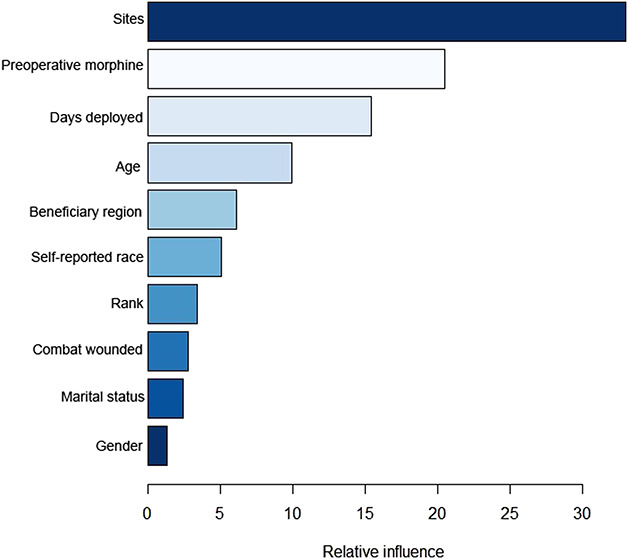
This figure shows features of relative influence for the gradient boosting machine after the Boruta package in R© Version 3.5.1 eliminated irrelevant variables by comparing their calculated importance and randomly calculated importance. GBM = gradient boosting machine.
Fig. 6.
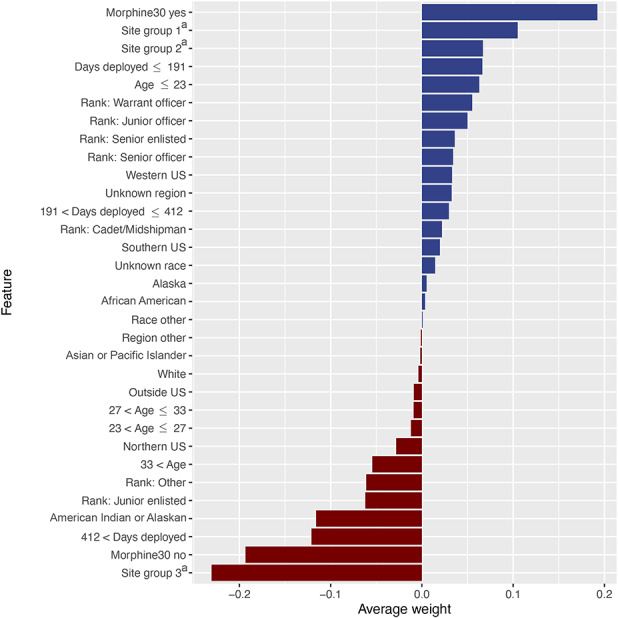
This figure illustrates the directionality (to support or contradict the outcome of interest) of each level of the model features, ranked by average weight of feature level across all cases. Blue horizontal bars (positive feature weight) are associated with feature subcategories that confirm or support the outcome of interest (opioids after 90 days). Red horizontal bars (negative feature weight) are associated with feature subcategories that contradict or refute the outcome of interest (opioids after 90 days). Rank = Cadet/midshipman, Junior enlisted (E1-E4), Junior officer (O1-O3), Senior enlisted (E5-E9), Senior officer (O4-O11), Warrant officer (W1-W5) Region = Western US, Southern US, Northern US, Alaska, Other, Unknown, Outside US Race = African American, Asian or Pacific Islander, White, Other, Unknown. aSite groups includes pharmacies in the following locations (Site group 1 = Alabama, Alaska, Arkansas, Arizona, Colorado, Georgia, District of Columbia, California, Delaware, Kansas, Idaho, Connecticut, Hawaii, Kentucky, Illinois, Florida; Site group 2 = Alaska, California, District of Columbia, Illinois, Louisiana, Massachusetts, Maryland, Maine, Michigan, Missouri, Mississippi, Montana, North Carolina, North Dakota, Nebraska, New Hampshire, New Jersey, New Mexico, Nevada, New York, Ohio, Oklahoma, Pennsylvania, Rhode Island, South Carolina, South Dakota, Tennessee, Texas, Utah, Virginia, Washington, Wyoming; Site group 3 = Alaska, Alabama, Arkansas, Arizona, California, District of Columbia, Florida, Hawaii, Illinois, Louisiana, Massachusetts, Maryland, Maine, Missouri, North Carolina, New York, Ohio, Texas, Virginia, Washington, Wyoming, and pharmacies located in 134 countries)
Determine the Clinical Utility of a Predictive Model Using a Decision Curve Analysis
After demonstrating model accuracy, we performed a decision curve analysis and determined that the gradient boosting machine is clinically useful to help a provider determine if a patient was at risk for prolonged opioid use. The decision curve analysis shows that it is better for the provider to use the model rather than to assume a patient will have prolonged opioid use postoperatively. The net benefit was better at all threshold probabilities (x-axis) if the model was used, rather than assuming the patient would or would not have prolonged opioid use postoperatively (Fig. 7). This means the gradient boosting machine model was the most suitable for clinical application (Fig. 7).
Fig. 7.
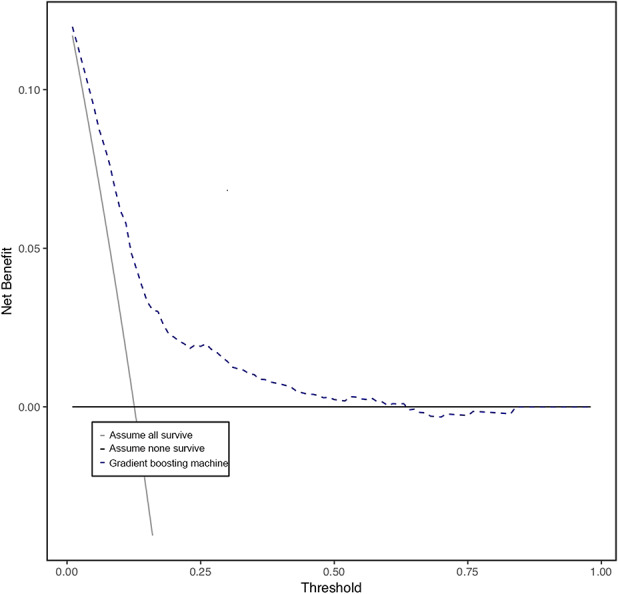
This graph shows the decision curve analysis (dashed line) of the finalized gradient boosting machine model after features were selected and hypertuned. The model should be used rather than assuming all patients (continuous line) or no patients (thick continuous line) will continue to use opioids for longer than 90 days postoperatively.
Discussion
Perioperative and postoperative care is an important opportunity to address the best practices in opioid prescribing. Although opioids may treat acute postoperative pain, short-term opioid use confers an increased risk of long-term use. Prolonged opioid use after elective ACL reconstruction increases the risk of dependence, abuse, lifelong use, and overdose [4, 9, 11, 17, 27, 36]. Therefore, transitioning patients at risk of prolonged use toward opioid alternatives for pain beyond the immediate perioperative period may reduce opioid abuse. As such, there is considerable interest in identifying which patients are at risk so we can prevent this problem. With this in mind, we developed four models designed to estimate the likelihood of prolonged opioid use by patients who underwent elective ACL surgery. All four models demonstrated acceptable calibration and discriminatory ability; however, the gradient boosting machine was for implementation based on performance measures. Through the gradient boosting machine feature selection process, we found seven features that drive the model’s outcome of interest, the most influential being number of pharmacy ordering sites and the preoperative morphine equivalents. We chose to use gradient boosting machine because it had the best area under the curve score, given other measures were generally comparable with logistic regression. After selecting gradient boosting machine as the final model, we found it to be clinically applicable based on the decision curve analysis. The next step the model lifecycle is external validation of the model in other patient populations (based on disease pathologies and patient demographics), which we hope will be followed by incorporation into a web-based application available for clinical use.
Limitations
When evaluating the results of this study, its limitations must be considered. The training and validation data were gathered from a large military data repository. The population studied is from one healthcare system with a relatively narrow age range and all on active-duty patients. Active-duty personnel are predominantly men, thus our data set there has a large gender imbalance. However, the incidence of ACL injury is 3.5 times more common in women than men [41]. Therefore, further external validation sets are imperative to ensure these findings apply to women undergoing ACL reconstruction. Additionally, race in this study was self-reported. Kaplan and Bennett [20] as well as Clinical Orthopaedics and Related Research® proposed guidelines [25] to follow when addressing the topic of ethnicity and race in publications in response to the Uniform Requirements for Manuscripts Submitted to Biomedical Journals. We recognize that the limitations of self-reported race in that it can evolve over time and racial categories commonly used in research are broad and overlapping, making it difficult for an individual to fit perfectly into one of the categories. To avoid undermining conclusions drawn from our research study, we collected other data on variables such as military rank, beneficiary status, beneficiary region, and special operator status to better understand socioeconomic statues and potential health care disparities [25].
Furthermore, other statistical techniques may be used to generate prognostic models. As with all statistical modeling methods, overfitting may occur due to modeling noise or variability that is unique to the training data. We sought to mitigate this effect by creating a unique holdout set on which to validate the models. However, external validation in an independent patient population is necessary before recommending widespread clinical use. When modeling a gradient boosting machine, subsequent predictors learn from mistakes made by previous predictors. With each addition of new decision trees to the model, it becomes more complex, and there is more variance. However, this complexity does not come without a price. The risk of overfitting data to the model while attempting to lower the model’s prediction error must be balanced. Overfitting was controlled with model hyperparameter tuning by monitoring the loss of function or when the test set’s accuracy no longer mirrored that of the training set. These techniques helped tune the model to limit overfitting and improve accuracy.
Additionally, the National Institute of Drug Abuse Consortium to Study Opioid Risks and Trends trials [24] defined long-term opioid use as an opioid use episode lasting longer than 90 days with a 120-day supply of opioids, or greater than 10 opioid prescriptions dispensed within 1 year [9, 10, 24]. The Consortium to Study Opioid Risks and Trends definition is not specific to perioperative patient care, when opioid prescriptions are usually prescribed, and likely underestimates the number of patients using opioids intermittently for prolonged periods. Our definition is similar to that of other recent studies using large population-based samples of patients undergoing surgical procedures [7, 19].
Developing a Machine-learning Model for Prolonged Opioid Use After ACL Surgery
We successfully developed and demonstrated clinical usefulness of a model that accurately predicts our outcome of interest, prolonged opioid use after ACL reconstruction. The development demonstrated that the factors that predict the outcome of interest, opioid prescriptions after ACL reconstruction, appeared to be driven by the ordering site (33), total preoperative morphine equivalents (21), total days deployed (15), age (10), beneficiary (geographic) region (6), race (5), and rank (3). The relative influence numbers listed indicate the percent relative influence of each variable to the outcome variable. Ordering site, for example, accounts for 33% of the observed effect, indicating that it accounts for 33% of the reduction to the loss function for the gradient boosting machine. These represent global relative influences on the model. However, it is easier for a clinician to trust and implement a predictive algorithm if he or she understands the reasons for the prediction. Hence, the local explanations of these features are important because they allow clinicians to interpret characteristics on a case by case level and trust model predictions are correct.
Other studies have developed machine learning models for prediction of the outcome of prolonged opioid use in orthopaedic patient populations with similar performance accuracy of area under the curve approximately 0.80 [21, 22, 23]. However, most prior studies looked at arthroplasty patient populations. In arthroplasty patients, Karhade et al. [23] found the factors that predicted prolonged postoperative opioid prescriptions after THA were age, duration of opioid exposure, preoperative hemoglobin, and preoperative medications.
We believe our study is the first to use predictive modeling to identify patients at risk for prolonged opioid use after arthroscopic surgery. Identifying those at risk of prolonged opioid abuse is important to stratify the patient’s risk before surgical intervention and to educate patients about controlling postoperative pain before opioids are prescribed. We believe the gradient boosting machine could be used to help understand factors leading to a higher likelihood of opioid misuse and possible opioid use disorders after ACL reconstruction. The decision curve analysis does not give an estimation of the likelihood of prolonged opioid use; this is done by the gradient boosting machine. Rather, the decision curve analysis helps determine whether the gradient boosting machine should be used clinically. The gradient boosting machine has clinical utility and can therefore be useful to orthopaedic surgeons to identify at-risk patients before surgery and offer increased support and monitoring to prevent opioid abuse and dependency. We plan to implement this model in the future for clinical use across the Department of Defense, along with a suite of tools.
Conclusions
By identifying patients at risk for opioid addiction in both civilian and active-duty populations, there is potential to transform treatment recommendations and improve shared decision-making for patients undergoing routine orthopaedic procedures. The power of this model is that it will permit the development of a true clinical decision-support tool, which can risk-stratify individual patients with a single numerical score that is easily understandable to both patient and surgeon. A probabilistic model provides insight into how clinical factors are conditionally related. The next step is for the model to undergo external validation to see if it could be broadly applied to other patient populations outside the military healthcare system. Future direction includes potential external validation of this model on more specific demographic subsets, such as gender or race, which could provide detail as to how the model performs on different populations.
Footnotes
All ICMJE Conflict of Interest Forms for authors and Clinical Orthopaedics and Related Research® editors and board members are on file with the publication and can be viewed on request.
The institution of one or more of the authors (GCB) has received, during the study period, funding from the Society of Military Orthopaedic Surgeons (SOMOS) for grant sponsorship of this work.
Each author certifies that neither he or she, nor any member of his or her immediate family, has funding or commercial associations (consultancies, stock ownership, equity interest, patent/licensing arrangements, etc.) that might pose a conflict of interest in connection with the submitted article.
Each author certifies that his or her institution approved the human protocol for this investigation and that all investigations were conducted in conformity with ethical principles of research.
This work was performed at Walter Reed National Military Medical Center, Bethesda, MD, USA.
References
- 1.Anderson AB, Wedin R, Fabbri N, Boland P, Healey J, Forsberg JA. External validation of PATHFx Version 3.0 in patients treated surgically and non-surgically for symptomatic skeletal metastases. Clin Orthop Relat Res. [Published online ahead of print December 6, 2019]. DOI: 10.1097/CORR.0000000000001081. [DOI] [PMC free article] [PubMed]
- 2.Anthony CA, Westermann RW, Bedard N, Glass N, Bollier M, Hettrich CM, Wolf BR. Opioid demand before and after anterior cruciate ligament reconstruction. Am J Sports Med. 2017;45:3098-3103. [DOI] [PubMed] [Google Scholar]
- 3.Baldini A, Korff MV, Lin EHB. A review of potential adverse effects of long-term opioid therapy: a practitioner’s guide. Prim Care Companion CNS Disord. 2012;14: pii: PCC; 11m01326. [DOI] [PMC free article] [PubMed] [Google Scholar]
- 4.Boudreau D, Korff MV, Rutter CM, Saunders K, Ray GT, Sullivan MD, Campbell CI, Merrill JO, Silverberg MJ, Banta-Green C, Weisner C. Trends in long‐term opioid therapy for chronic non‐cancer pain. Pharmacoepidem Dr S. 2009;18:1166-1175. [DOI] [PMC free article] [PubMed] [Google Scholar]
- 5.Brier GW. Verification of forecasts expressed in terms of probability. Mon Weather Rev. 1950;78:1-3. [Google Scholar]
- 6.Brummett CM, Waljee JF, Goesling J, Moser S, Lin P, Englesbe MJ, Bohnert ASB, Kheterpal S, Nallamothu BK. New persistent opioid use after minor and major surgical procedures in US adults. JAMA Surg. 2017;152:e170504. [DOI] [PMC free article] [PubMed] [Google Scholar]
- 7.Buscaglia AC, Paik MC, Lewis E, Trafton JA, Team VOMD. Baseline variation in use of VA & DOD clinical practice guideline recommended opioid prescribing practices across VA health care systems. Clin J Pain. 2015;31:803-812. [DOI] [PubMed] [Google Scholar]
- 8.Califf RM, Woodcock J, Ostroff S. A proactive response to prescription opioid abuse. N Engl J Med. 2016; 374:1480-1485. [DOI] [PubMed] [Google Scholar]
- 9.Chou R, Fanciullo GJ, Fine PG, Adler JA, Ballantye JC, Davies P, Donovan MI, Fishbain DA, Foley KM, Fudin J, Gilson AM, Kelter A, Mauskop A, O’Connor PG, Passik SD, Pasternak GW, Portenoy RK, Rich BA, Roberts RG, Todd KH, Miaskowski C. Clinical guidelines for the use of chronic opioid therapy in chronic noncancer pain. J Pain. 2009;10:113-130.e22. [DOI] [PMC free article] [PubMed] [Google Scholar]
- 10.Chou R, Gordon DB, Leon-Casasola OA de, Rosenberg JM, Bickler S, Brennan T, Carter T, Cassidy CL, Chittenden EH, Degenhardt E, Griffith S, Manworren R, McCarberg B, Montgomery R, Murphy J, Perkal MF, Suresh S, Sluka K, Strassels S, Thirlby R, Viscusi E, Walco GA, Warner L, Weisman SJ, Wu CL. Management of postoperative pain: A clinical practice guideline from the American Pain Society, the American Society of Regional Anesthesia and Pain Medicine, and the American Society of Anesthesiologists’ Committee on Regional Anesthesia, Executive Committee, and Administrative Council. J Pain. 2016;17:131-157. [DOI] [PubMed] [Google Scholar]
- 11.Chou R, Turner JA, Devine EB, Hansen RN, Sullivan SD, Blazina I, Dana T, Bougatsos C, Deyo RA. The effectiveness and risks of long-term opioid therapy for chronic pain: A systematic review for a National Institutes of Health Pathways to Prevention Workshop. Ann Intern Med. 2015;162:276. [DOI] [PubMed] [Google Scholar]
- 12.Collins GS, Reitsma JB, Altman DG, Moons KGM. Transparent Reporting of a Multivariable Prediction model for Individual Prognosis Or Diagnosis (TRIPOD): The TRIPOD Statement. Ann Intern Med. 2015;162:55. [DOI] [PubMed] [Google Scholar]
- 13.Dart RC, Surratt HL, Cicero TJ, Parrino MW, Severtson G, Bucher-Bartelson B, Green JL. Trends in opioid analgesic abuse and mortality in the United States. N Engl J Med . 2015;372: 241-248. [DOI] [PubMed] [Google Scholar]
- 14.Dowell D, Haegerich TM, Chou R. CDC guideline for prescribing opioids for chronic pain--United States. JAMA. 2016;315:1624-1645. [DOI] [PMC free article] [PubMed] [Google Scholar]
- 15.Forsberg JA, Eberhardt J, Boland PJ, Wedin R, Healey JH. Estimating survival in patients with operable skeletal metastases: An application of a Bayesian Belief Network. PLoS One. 2011;6:e19956. [DOI] [PMC free article] [PubMed] [Google Scholar]
- 16.Friedman JH. Greedy function approximation: A gradient boosting machine. Ann Statistics. 2001;29:1189-1232. [Google Scholar]
- 17.Goesling J, Moser SE, Zaidi B, Hassett AL, Hilliard P, Hallstrom B, Clauw DJ, Brummett CM. Trends and predictors of opioid use after total knee and total hip arthroplasty. Pain. 2016;157:1259-1265. [DOI] [PMC free article] [PubMed] [Google Scholar]
- 18.Hoppe JA, Nelson LS, Perrone J, Weiner SG, Prescribing Opioids Safely in the Emergency Department (POSED) Study Investigators. Opioid prescribing in a cross section of US emergency departments. Ann Emerg Med. 2015;66:253-259. [DOI] [PMC free article] [PubMed] [Google Scholar]
- 19.Johnson SP, Chung KC, Zhong L, Shauver MJ, Engelsbe MJ, Brummett C, Waljee JF. Risk of prolonged opioid use among opioid-naïve patients following common hand surgery procedures. J Hand Surg. 2016;41:947-957.e3. [DOI] [PubMed] [Google Scholar]
- 20.Kaplan JB, Bennett T. Use of race and ethnicity in biomedical publication. JAMA. 2003;289:2709. [DOI] [PubMed] [Google Scholar]
- 21.Karhade AV, Ogink PT, Thio QCBS, Cha TD, Gormley WB, Hershman SH, Smith TR, Mao J, Schoenfeld AJ, Bono CM, Schwab JH. Development of machine learning algorithms for prediction of prolonged opioid prescription after surgery for lumbar disc herniation. Spine J. 2019;19:1764-1771. [DOI] [PubMed] [Google Scholar]
- 22.Karhade AV, Ogink PT, Thio QCBS, Broekman MLD, Cha TD, Hershman SH, Mao J, Peul WC, Schoenfeld AJ, Bono CM, Schwab JH. Machine learning for prediction of sustained opioid prescription after anterior cervical discectomy and fusion. Spine J. 2019;19:976-983. [DOI] [PubMed] [Google Scholar]
- 23.Karhade AV, Schwab JH, Bedair HS. Development of machine learning algorithms for prediction of sustained postoperative opioid prescriptions after total hip arthroplasty. J Arthroplasty. 2019;34:2272-2277.e1. [DOI] [PubMed] [Google Scholar]
- 24.Korff MV, Korff MV, Saunders K, Ray GT, Boudreau D, Campbell C, Merrill J, Sullivan MD, Rutter CM, Silverberg MJ, Banta-Green C, Weisner C. De facto long-term opioid therapy for noncancer pain. Clin J Pain. 2008;24:521-527. [DOI] [PMC free article] [PubMed] [Google Scholar]
- 25.Leopold SS, Beadling L, Calabro AM, Dobbs MB, Gebhardt MC, Gioe TJ, Manner PA, Porcher R, Rimnac CM, Wongworawat MD. Editorial: The complexity of reporting race and ethnicity in orthopaedic research. Clin Orthop Relat R. 2018;476:917-920. [DOI] [PMC free article] [PubMed] [Google Scholar]
- 26.Luo W, Phung D, Tran T, Gupta S, Rana S, Karmakar C, Shilton A, Yearwood J, Nevenka D, Ho TB, Venkatesh S, Berk M. Guidelines for developing and reporting machine learning predictive models in biomedical research: A multidisciplinary view. J Med Internet Res. 2016;18:e323. [DOI] [PMC free article] [PubMed] [Google Scholar]
- 27.Manchikanti L, Helm S, Fellows B, Janata JW, Pampati V, Grider JS, Boswell MV. Opioid epidemic in the United States. Pain Physician. 2012;15(3 Suppl):ES9-38. [PubMed] [Google Scholar]
- 28.Natekin A, Knoll A. Gradient boosting machines, a tutorial. Front Neurorobotics. 2013;7:21. [DOI] [PMC free article] [PubMed] [Google Scholar]
- 29.Ramchand R, Rudavsky R, Grant S, Tanielian T, Jaycox L. Prevalence of, risk factors for, and consequences of posttraumatic stress disorder and other mental health problems in military populations deployed to Iraq and Afghanistan. Curr Psychiat Rep. 2015;17:37. [DOI] [PubMed] [Google Scholar]
- 30.Ribeiro MT, Singh S, Guestrin C. Model-agnostic interpretability of machine learning. https://arxiv.org/abs/1606.05386. Accessed March 16, 2020. [Google Scholar]
- 31.Rosenberg JM, Bilka BM, Wilson SM, Spevak C. Opioid therapy for chronic pain: Overview of the 2017 US Department of Veterans Affairs and US Department of Defense Clinical Practice Guideline. Pain Med . 2017; 9:928-941. [DOI] [PubMed] [Google Scholar]
- 32.Schoenfeld AJ, Belmont PJ, Blucher JA, Jiang W, Chaudhary MA, Koehlmoos T, Kang JD, Haider AH. Sustained preoperative opioid use is a predictor of continued use following spine surgery. J Bone Joint Surg. 2018;100:914-921. [DOI] [PubMed] [Google Scholar]
- 33.Stekhoven DJ, Buhlmann P. MissForest--non-parametric missing value imputation for mixed-type data. Bioinformatics. 2011;28:112-118. [DOI] [PubMed] [Google Scholar]
- 34.Steyerberg EW, Vergouwe Y. Towards better clinical prediction models: seven steps for development and an ABCD for validation. Eur Heart J. 2014;35:1925-1931. [DOI] [PMC free article] [PubMed] [Google Scholar]
- 35.Steyerberg EW, Vickers AJ, Cook NR, Gerds T, Gonen M, Obuchowski N, Pencina MJ, Kattan MW. Assessing the performance of prediction models. Epidemiology. 2010;21:128-138. [DOI] [PMC free article] [PubMed] [Google Scholar]
- 36.Sullivan MD, Ballantyne JC. What are we treating with long-term opioid therapy? Arch Intern Med. 2012;172:433-434. [DOI] [PubMed] [Google Scholar]
- 37.Sun EC, Darnall BD, Baker LC, Mackey S. Incidence of and risk factors for chronic opioid use among opioid-naive patients in the postoperative period. JAMA Intern Med. 2016;176: 1286-1293. [DOI] [PMC free article] [PubMed] [Google Scholar]
- 38.UC Business Analytics R Programming Guide. Available at: http://uc-r.github.io/. Accessed March 5, 2020.
- 39.Vickers AJ, Elkin EB. Decision curve analysis: A novel method for evaluating prediction models. Medical Decision Making. 2006;26:565-574. [DOI] [PMC free article] [PubMed] [Google Scholar]
- 40.Volkow ND, McLellan TA, Cotto JH, Karithanom M, Weiss SR. Characteristics of opioid prescriptions in 2009. JAMA. 2011;305: 1299-1301. [DOI] [PMC free article] [PubMed] [Google Scholar]
- 41.Voskanian N. ACL Injury prevention in female athletes: review of the literature and practical considerations in implementing an ACL prevention program. Curr Rev Musculoskelet Medicine. 2013;6:158-163. [DOI] [PMC free article] [PubMed] [Google Scholar]


