Abstract
Marsupials, with short gestation times, have more complex and changing patterns of milk composition compared to eutherians. Maternal immunoglobulins (Ig) that confer immunity on offspring are among the components that change during marsupial lactation. Here the abundances of mammary transcripts encoding Ig heavy chains and their corresponding transporters were quantified in the laboratory opossum, Monodelphis domestica. IgA transcripts are the most abundant in opossum mammary and, with IgM, increased in abundance linearly from birth to weaning. Likewise, the Fc receptor for IgA, the poly-Ig receptor, also increased in abundance throughout lactation. There were few transcripts for IgG or IgE within the opossum mammaries. This is in contrast to that reported for Australian marsupial species. Transcripts for FcRN, the Fc receptor that transports IgG, were detected throughout lactation, and opossum milk is known to contain IgG. Therefore, milk IgG is likely to be taken from maternal circulation, rather than local production. There is a parallel increase in FcRN in the newborn gut that declines around the time when neonates have matured to the point they can make their own IgG. These results are consistent with a transfer of maternal Ig that is coordinated with the development of the neonatal immune system.
Introduction
Milk provides newborn mammals with nutritional as well as immunological value. There is variation, however, across the mammalian lineages on the relative contributions of each of these sets of factors. The contrast is particularly striking when comparing lactation in eutherians to that of marsupials, two mammalian lineages separated by 165 million years (Bininda-Emonds et al. 2007). Immediately following birth, eutherian mammaries produce a unique type of secretion called colostrum. Colostrum is rich in nutrients and antibodies (reviewed in Hurley and Theil 2011). Following the colostral phase, eutherian species produce milk of a relatively consistent composition throughout lactation until weaning (reviewed in Jenness and Sloan 1970; Skibiel et al. 2013). In contrast, the equivalent of the colostral phase is debatable in marsupials and the composition of milk, both nutritionally as well as immunologically, changes during lactation (reviewed in Edwards et al. 2012). These changes appear to relate to the developmental states of the marsupial neonates and likely are an evolutionary adaptation to the short intra-uterine gestation times and limited placentation.
A general pattern of changing nutritional composition within the milk has been described in numerous marsupial species. Early in lactation milk is dilute and contains low levels of proteins and fats with high concentrations of carbohydrates. Later in lactation milk composition transitions to a higher concentration of proteins and fats with little carbohydrates (reviewed in Green and Merchant 1988). The changing nutritional composition as well as offspring behavior has led to the assignment of phases to marsupial lactation (reviewed in Tyndale-Biscoe and Renfree, 1987).
Marsupial lactation has been most extensively studied in the tammar wallaby (Macropus eugenii). Tammar wallabies have two periods of increased expression of immunoglobulins (Ig) and Ig transporters within the mammaries, first following birth and again at the time of transition to weaning (Daly et al. 2007; Joss et al. 2009). Similar patterns have been described in the common brushtail possum (Trichosurus vulpecula) although the phases are less defined within common brushtail possums (Adamski and Demmer 1999; Adamski and Demmer 2000; Adamski et al. 2000).
The South American opossum, Monodelphis domestica, has been the primary model for American marsupials, which diverged from their Australian cousins at least 60 million years ago (Bininda-Emonds et al. 2007). Investigations into macromolecule composition of opossum milk found similar changes throughout lactation and a universal strategy of lactation among the marsupial lineage has been suggested (Crisp et al. 1989; Green et al. 1991). The existence of distinct phases of lactation have not been clearly defined within the opossum. M. domestica lacks a pouch and as such pup behavior does not follow the same pouch emergence behaviors as described in tammar wallabies.
Opossum offspring, like other marsupials, are born at an underdeveloped state compared to eutherian neonates (Old and Deane 2000; Deane and Cooper 1988). Opossums are born developmentally equivalent to that of a day-10 mouse embryo, a day-13 rat embryo, or a day-40 human embryo (La Via et al., 1963; Kuehl-Kovarik et al. 1995; VandeBerg and Robinson, 1997). Neonatal opossums lack many of the cells of the adaptive immune system during the first postnatal week and there is no evidence of in utero transfer of maternal Ig (Samples et al. 1986; Parra et al. 2009; Wang et al. 2012). Newborn opossums, therefore, appear entirely reliant on milk for acquiring passive immunity.
Opossum, a species with a sequenced and annotated genome, has only four of the five Ig heavy chain isotypes, IgM, IgG, IgA and IgE, described in mammals (Mikkelsen et al. 2007; Wang et al 2009). Here we investigated the abundance of transcripts encoding each of these four Ig isotypes and their corresponding Ig transporters, the neonatal Fc receptor (FcRN) and poly-Ig receptor (pIgR), within mammary tissue across the course of opossum lactation.
Materials and Methods
Animal Use and Tissue Collection
Opossums used were from a captive-bred research colony housed at the University of New Mexico Department of Biology Animal Research Facility. This study was approved under protocol numbers 16–200407-MC and 15–200334-B-MC from the University of New Mexico Institutional Animal Care and Use Committee.
Opossum mammary tissues were collected from timed pregnancies as described previously (Hansen et al., 2017). Females used in this study were observed daily and the morning pups were first sighted was counted as postnatal/postpartum day (P) 1. Mammary tissues were collected from at least three females at each time point. Time points collected for this study were the last 24 hours of pregnancy (embryonic day 14, E14) and post-partum (P) days 1, 2, 3, 5, 7, 10, 13, 16, 17, 20, 22, 26, 31, 32, 33, 36, 38, 44, and 52. Mammary tissues were also collected from animals 24–48 hours after pups had been weaned on day 56, (post weaning). Intestinal tissue from at least 3 individuals per time point was collected from pups from postnatal day (P) 5, 7, 10, 16, 22, 32, 36, and 45. Adult opossum intestinal tissues were also collected to serve as controls.
Animals were euthanized by inhaled isoflurane overdose until no evidence of breathing or heartbeat for one minute, followed by decapitation. Tissues were preserved in RNALater buffer (Invitrogen, Carlsbad, CA, USA) at 4°C for 48 hours. The buffer was then removed and tissues were stored at −80°C until extraction.
RNA Extraction, and cDNA synthesis
RNA was extracted using phenol-based extraction methods utilizing Pure Link RNA mini kit (Invitrogen, Carlsbad, CA, USA). 10 μg of whole RNA was treated with DNase using the TURBO DNA-free Kit (Invitrogen, Carlsbad, CA, USA) according to manufacturers’ recommended protocols. 500 ng of DNA cleaned RNA was used to make cDNA pools by reverse transcriptase PCR (RT-PCR) using SuperScript III First Strand Synthesis kit (Invitrogen, Carlsbad, CA, USA). To reduce bias generated during reverse transcription, cDNA synthesis reactions were constructed in triplicate and pooled.
Quantifying Specific Gene Transcripts
Abundance of specific gene transcripts was assessed by Quantitative real-time PCR (qPCR) using the Sso Advanced Universal SYBR Green Supermix (BioRad, Hercules, CA, USA) according to manufacturer’s guidelines for 20μL reactions. qPCR reactions were performed in triplicate on a BioRad CFX96. Primers used in qPCR were designed for the opossum genome according to manufacturer’s parameters for qPCR primers. All primer pairs were designed to span introns in the genomic DNA to distinguish amplification of cDNA. Primer pairs designed to amplify Ig heavy chain encoding transcripts were based on constant (C) region gene sequence. Primer sequences, properties and other pertinent qPCR parameters are reported in Supplementary Table 1. A negative control (no template) reaction was included for each primer pair.
Mammary transcript abundance per targeted gene was normalized for each individual by the Vandesompele method of incorporating multiple reference gene expression levels (Vandesompele et al., 2002). Reference genes used in this study were succinate dehydrogenase subunit A (SDHA) and actin-related protein 2 (ACTR2). These genes were highly expressed at all time points with little variance. They also had M values < 1 as defined in Vandesompele and colleagues (2002). Transcript abundance of FcRN within the neonatal and adult intestines was normalized for each individual by the Pfaffl method utilizing ACTR2 (Pfaffl 2001).
Statistical Analyses
All statistical analyses were completed utilizing the default parameters of Prism 7 software (Graphpad, La Jolla, CA, USA). Grubbs’s outlier analyses were performed to examine for significant outliers within each biological set. All outliers identified per target gene are reported in the Supplementary Figure legends. Mean normalized transcript abundance for biological set was calculated with and without outliers. Biological set average or weekly average is reported per target including standard error of the mean (SEM). Analysis of variance (ANOVA) as well as Pearson’s correlation analyses were calculated for both means and compared for statistical variance. Inclusion of outliers did not significantly alter results, albeit statistical power was decreased with inclusion. Normalized expression of all outliers is represented for each gene target (shown in Supplementary Figures), however was omitted for reported weekly mean expression.
Results
To investigate presence and abundance of transcripts encoding Igs and Ig transporters, mammary tissue was examined from at least three individuals from a total of 21 time points. These time points spanned from the last 24 hours of pregnancy (E14) to 24–48 hours after removal of pups at weaning.
IgA heavy chain transcripts were amplified in qPCR using primers specific for the Ig Cα constant region gene. IgA transcript abundance was found to increase throughout the course of opossum lactation with E14 (week 0) and week 1 being significantly lower than P52 (week 8) (p ≤ 0.01, p ≤ 0.05 figure 1A, Supplementary Figure 1). There was a slight dip in transcript abundance during week 5 that is significantly lower than elevated abundance seen in week 8 (p ≤ 0.01). The greatest individual variation was observed around the time of weaning.
Figure 1: Normalized mammary transcript abundance of IgA (A) and pIgR (B).
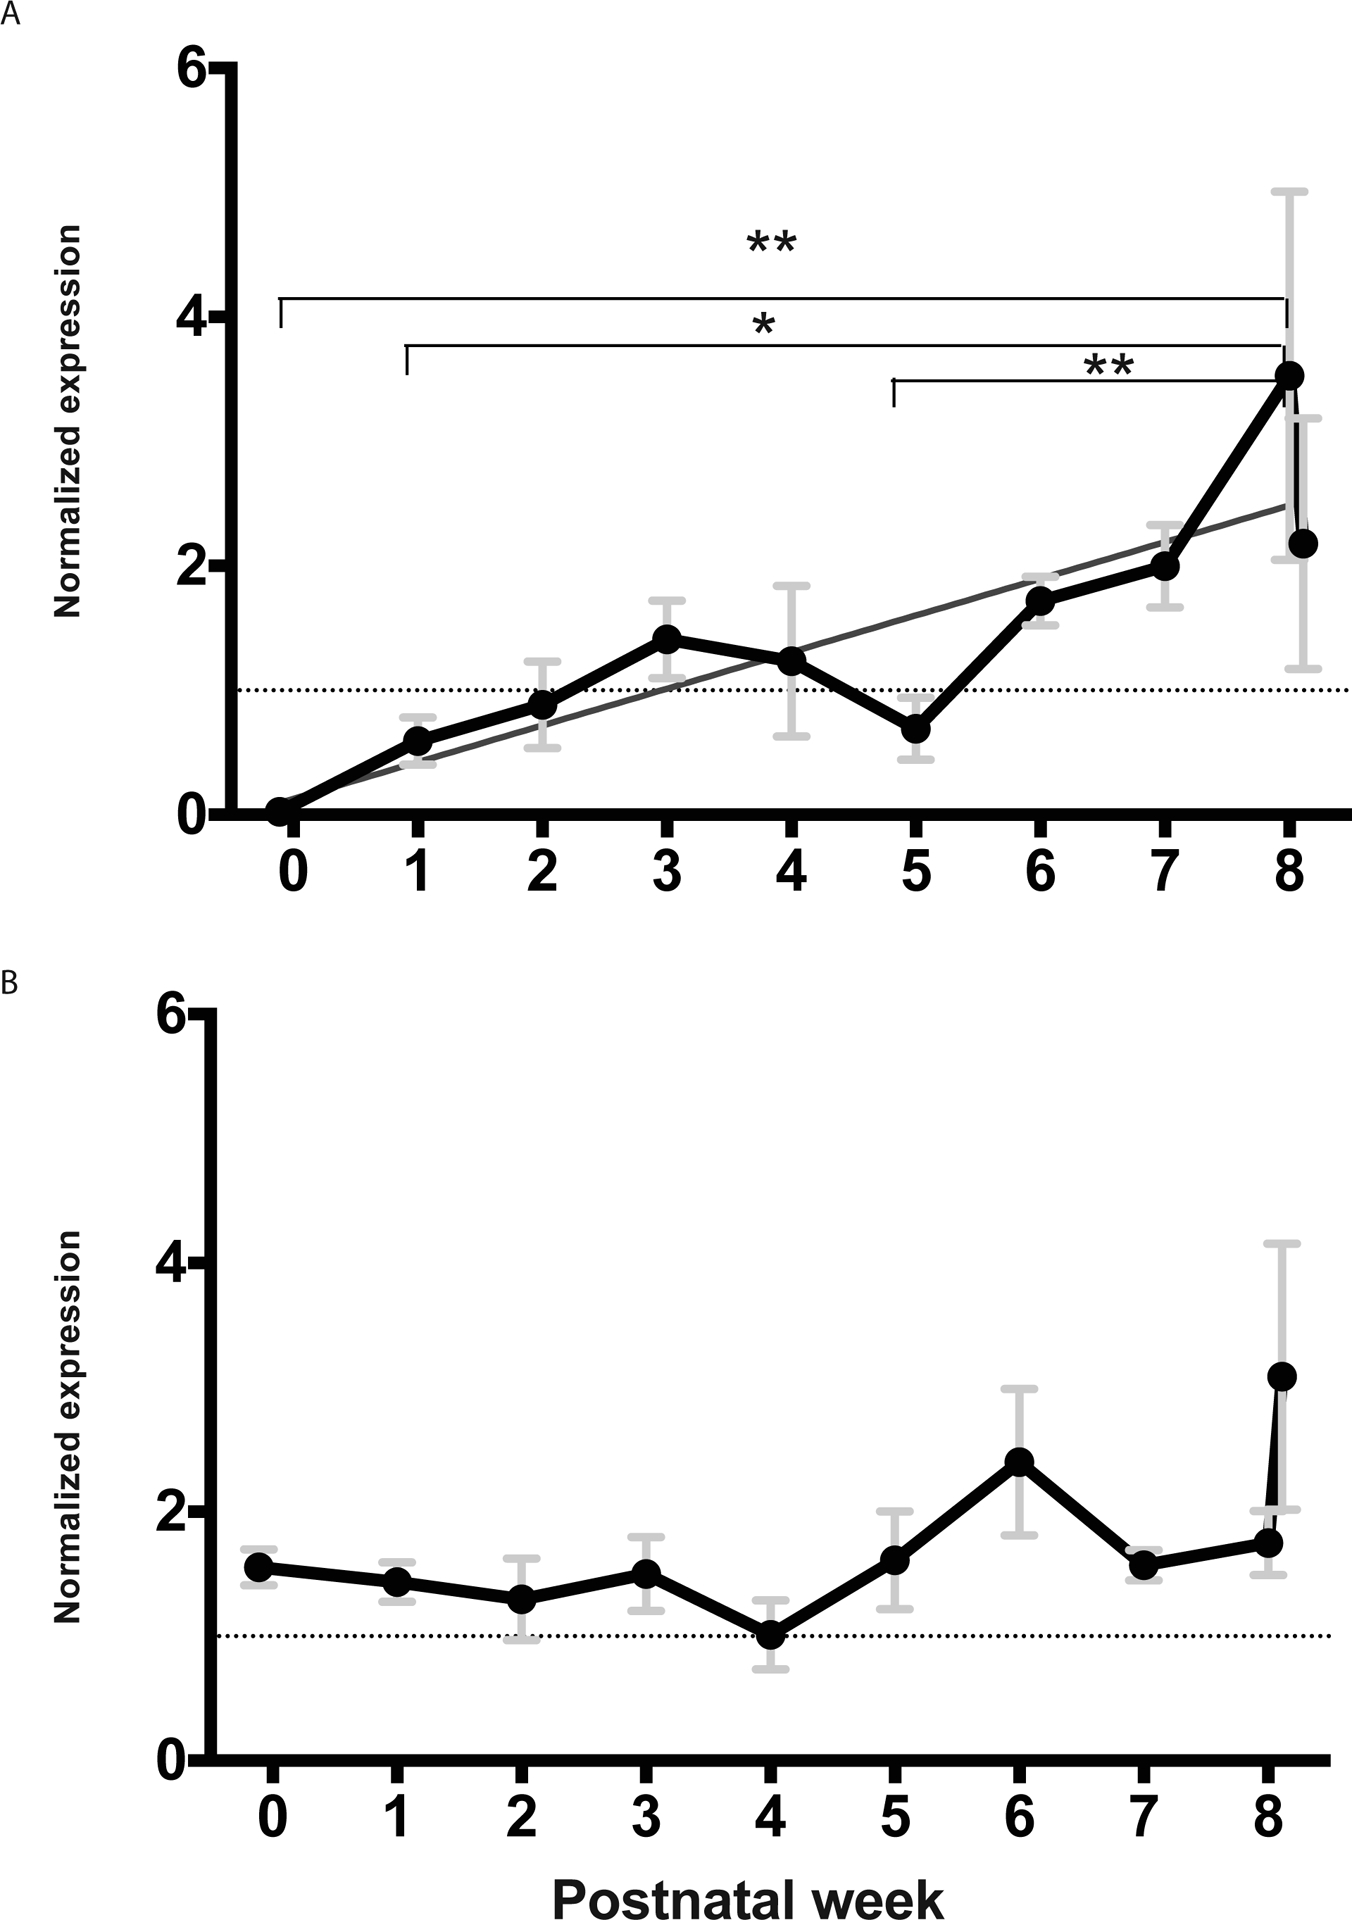
Linear regression values for IgA were p = 0.0014, r2 = 0.7395, slope = 0.2945. Values were normalized to reference genes, ACTR2 and SDHA. Dotted lines indicate normalized expression = 1. Data were pooled by week where week 0 is E14; week 1 is P1, 2, 3, 5, and 7; week 2 is P10 and 13; week 3 is P16, 17, and 20; week 4 is P22 and 26; week 5 is P31, 32, and 33; week 6 is P36 is 38; Week 7 is P44; and week 8 is P52. The final point is post weaning. *p ≤ 0.05, **p ≤ 0.01.
Given the steady increase of IgA transcripts throughout lactation the mammary transcript abundance of the IgA transporter, pIgR, was also investigated. Transcript abundance of pIgR was found to follow a similar pattern as that of IgA (figure 1B). A linear increase in pIgR transcript abundance is evident throughout lactation, however statistical significance was not reached (p = 0.0758). This correlation is stronger when examining individual time points but still fails to reach statistical significance (p = 0.0530, Supplementary Figure 2). The largest variation in pIgR transcript abundance was found after the removal of offspring at weaning. Transcript abundance of pIgR and IgA appears to be highly coordinated throughout lactation except for surrounding parturition (E14 and P1) when pIgR transcripts are significantly more abundant than that for IgA (p ≤ 0.01, figure 2).
Figure 2: Abundance of IgA and pIgR transcripts appears to be highly coordinated throughout lactation.
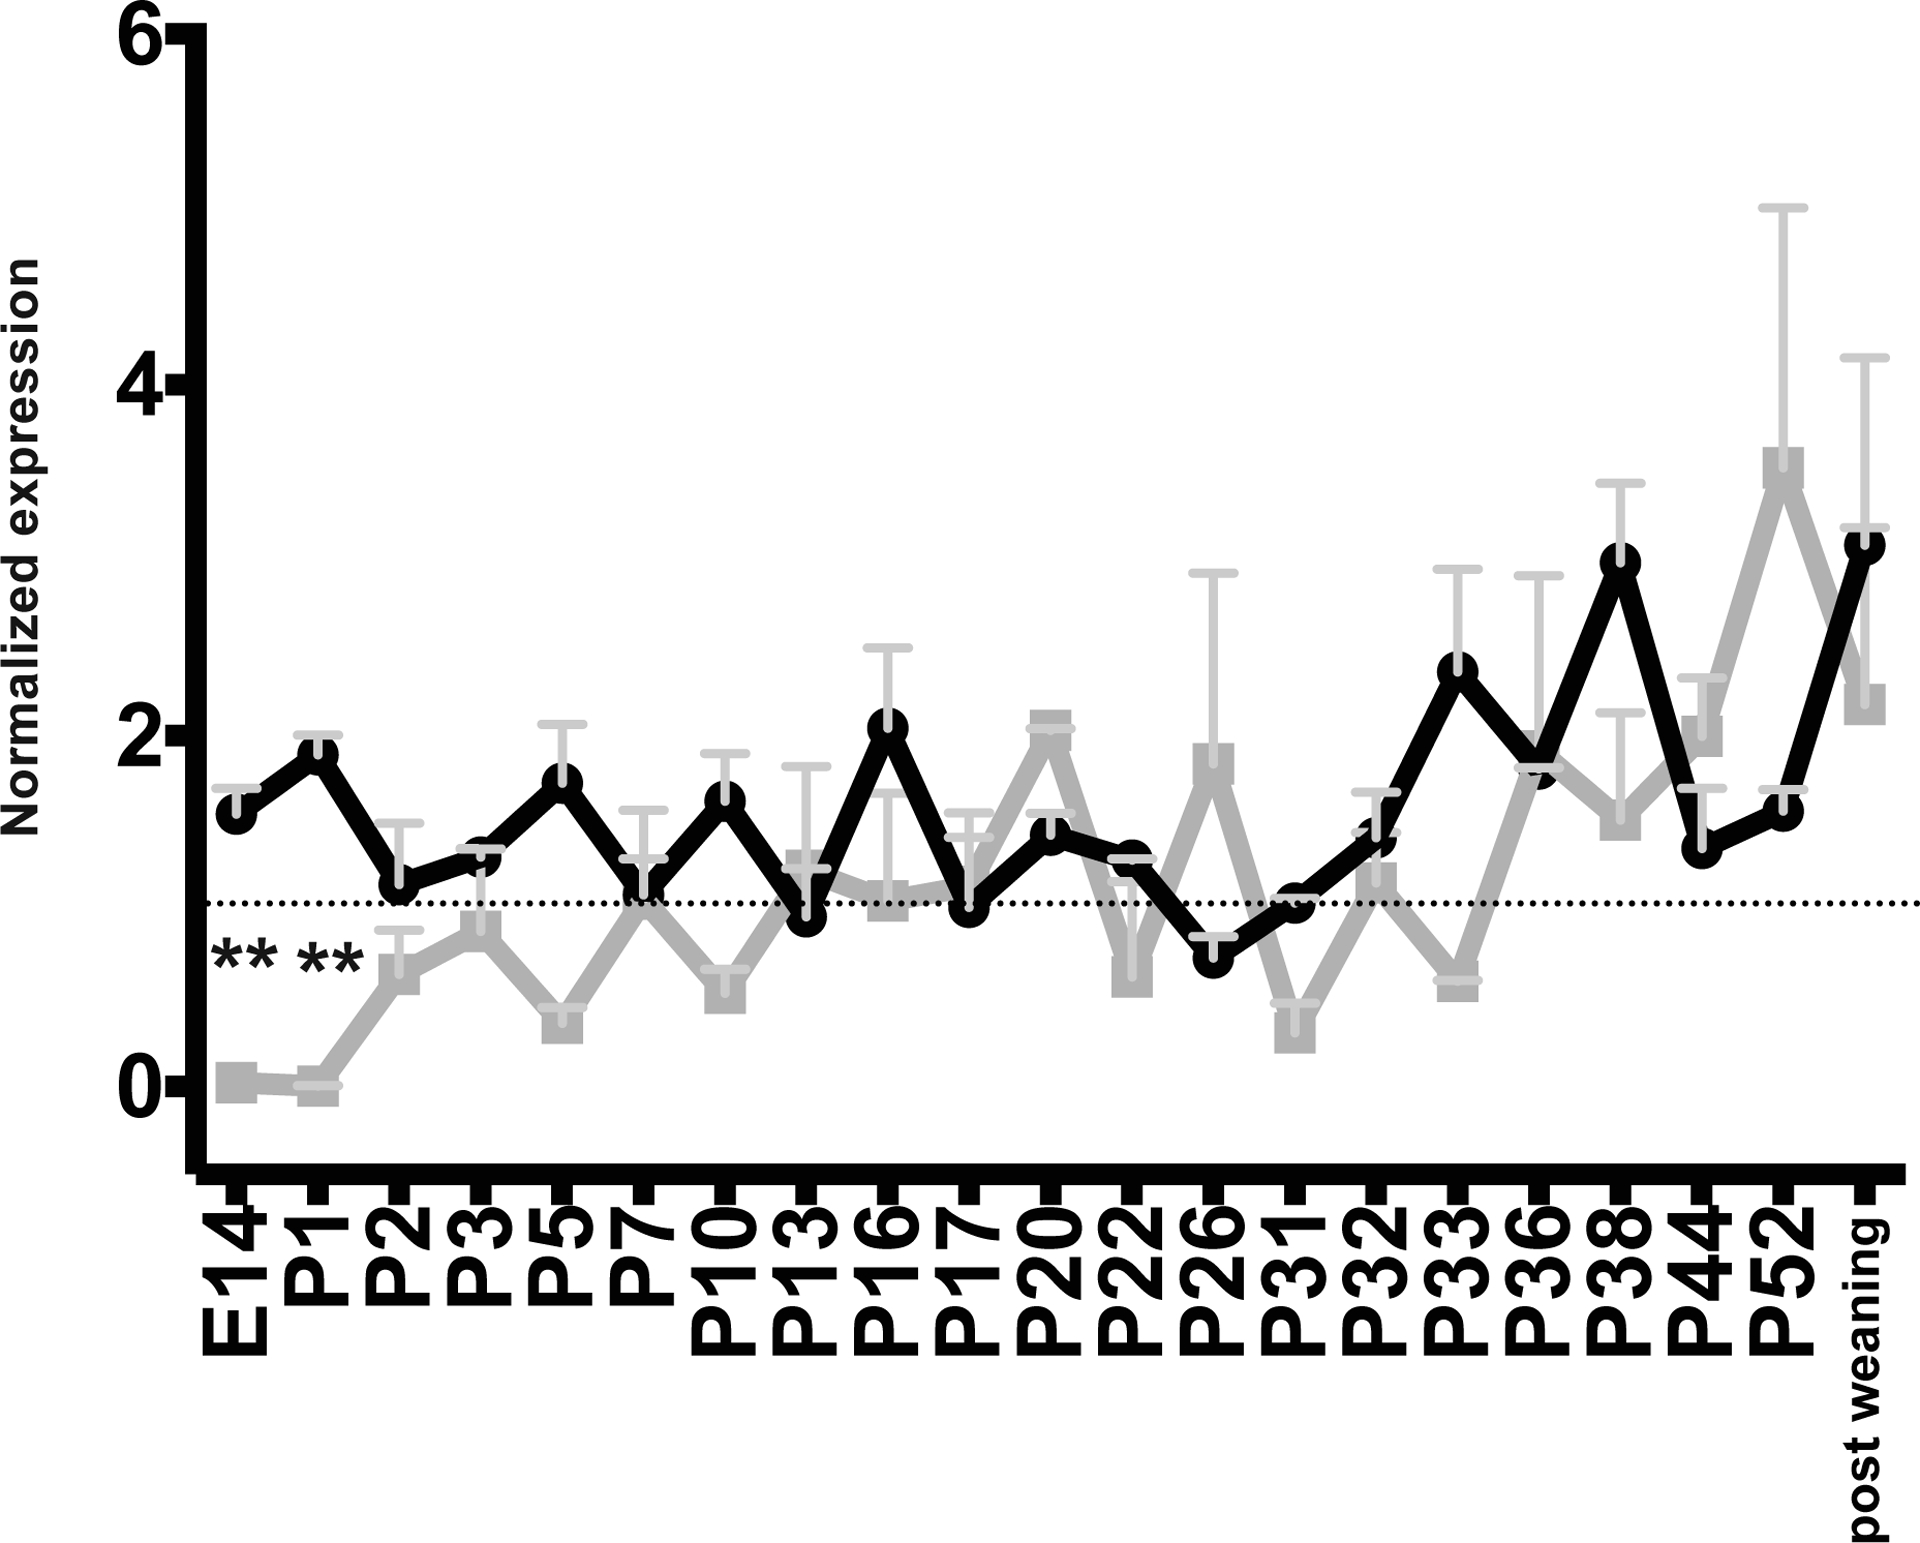
IgA (gray line) and pIgR (black line) transcript abundance reported by day. Annotations as in Figure 1.
Similar to IgA, IgG transcript abundance was quantified by qPCR using primers specific for the Cγ constant region gene. IgG transcripts were the least abundant immunoglobulin isotype within the mammaries, with few transcripts detected at any time point (figure 3A, Supplementary Figure 3). A slight increase in abundance is evident in week 1 and week 6 however these increases are not statistically significant and represent only a few transcripts.
Figure 3: Normalized mammary transcript abundance of IgG (A) and FcRN (B).
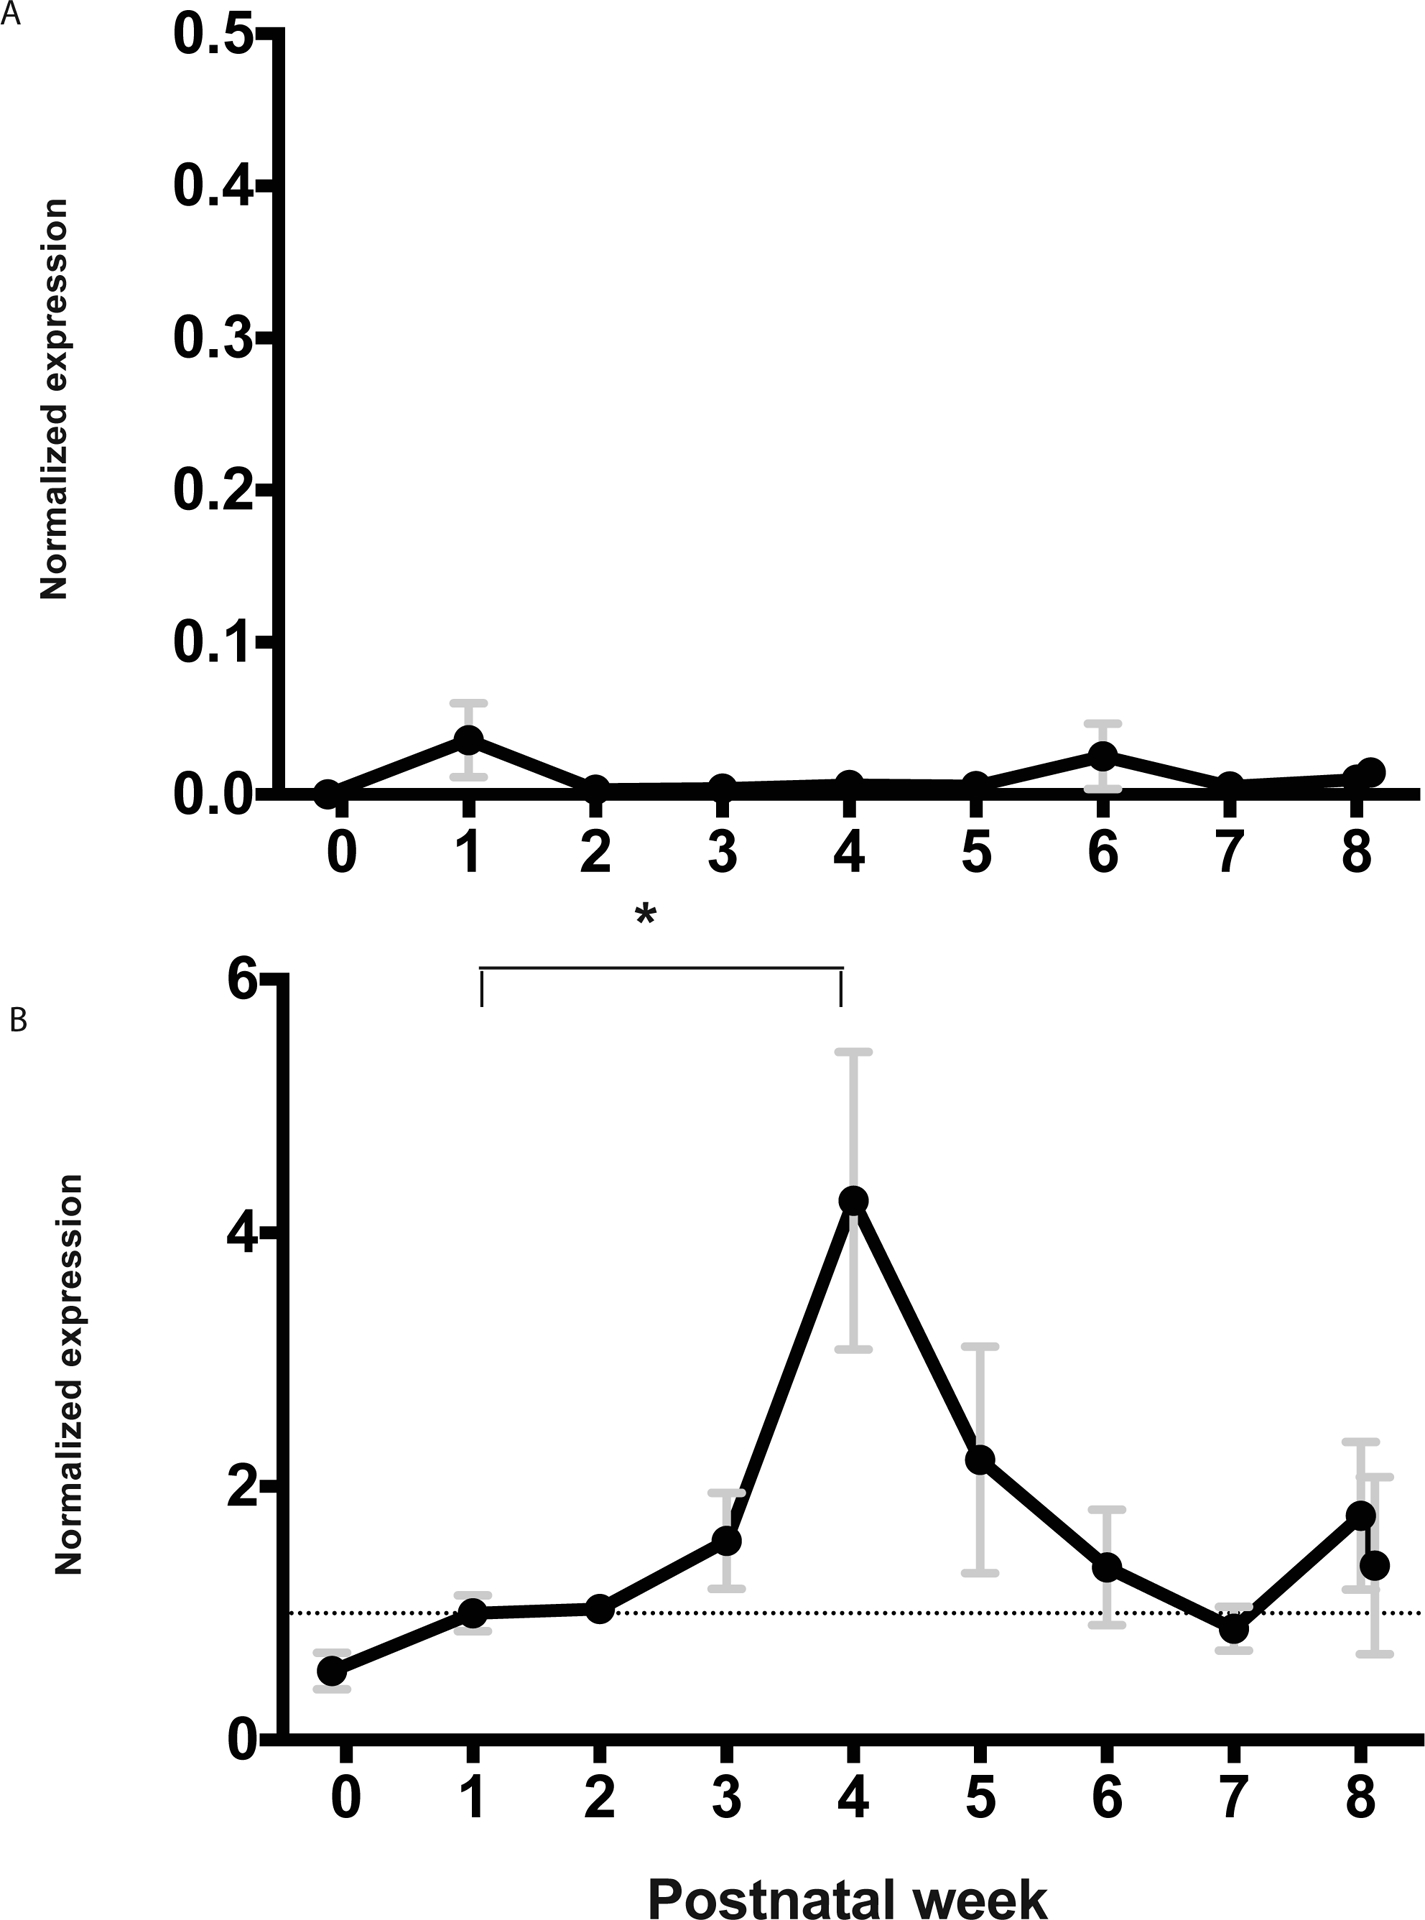
Annotations and data pooling for weeks are as in Figure 1.
Given little evidence of resident IgG production in the opossum mammaries, it is likely that milk IgG is transferred directly from maternal circulation in this species. To investigate this further, FcRN transcript abundance in mammaries was examined. A prominent peak was found surrounding week 4 of lactation (figure 3B, Supplementary Figure 4). A significant increase in transcript abundance was detected between week 1 and week 4 (p < 0.05), followed by a decrease in week 5. Postnatal week 5 was previously found to be the time when neonatal opossums begin producing endogenous IgG (Wang et al 2012). Neonates use FcRN to transfer milk IgG into newborn circulation from the gut lumen (Roopenian et al. 2007). To investigate if there is coordinated timing of FcRN in the newborn gut with that of the mammaries; transcript abundance for FcRN was examined within intestinal tissue of neonates as well. FcRN transcripts were most abundant during the first three weeks of postnatal life and declined between weeks 3 and 5, and remained at baseline until weaning (figure 4).
Figure 4: Normalized transcript abundance of FcRN in neonatal opossum gut.
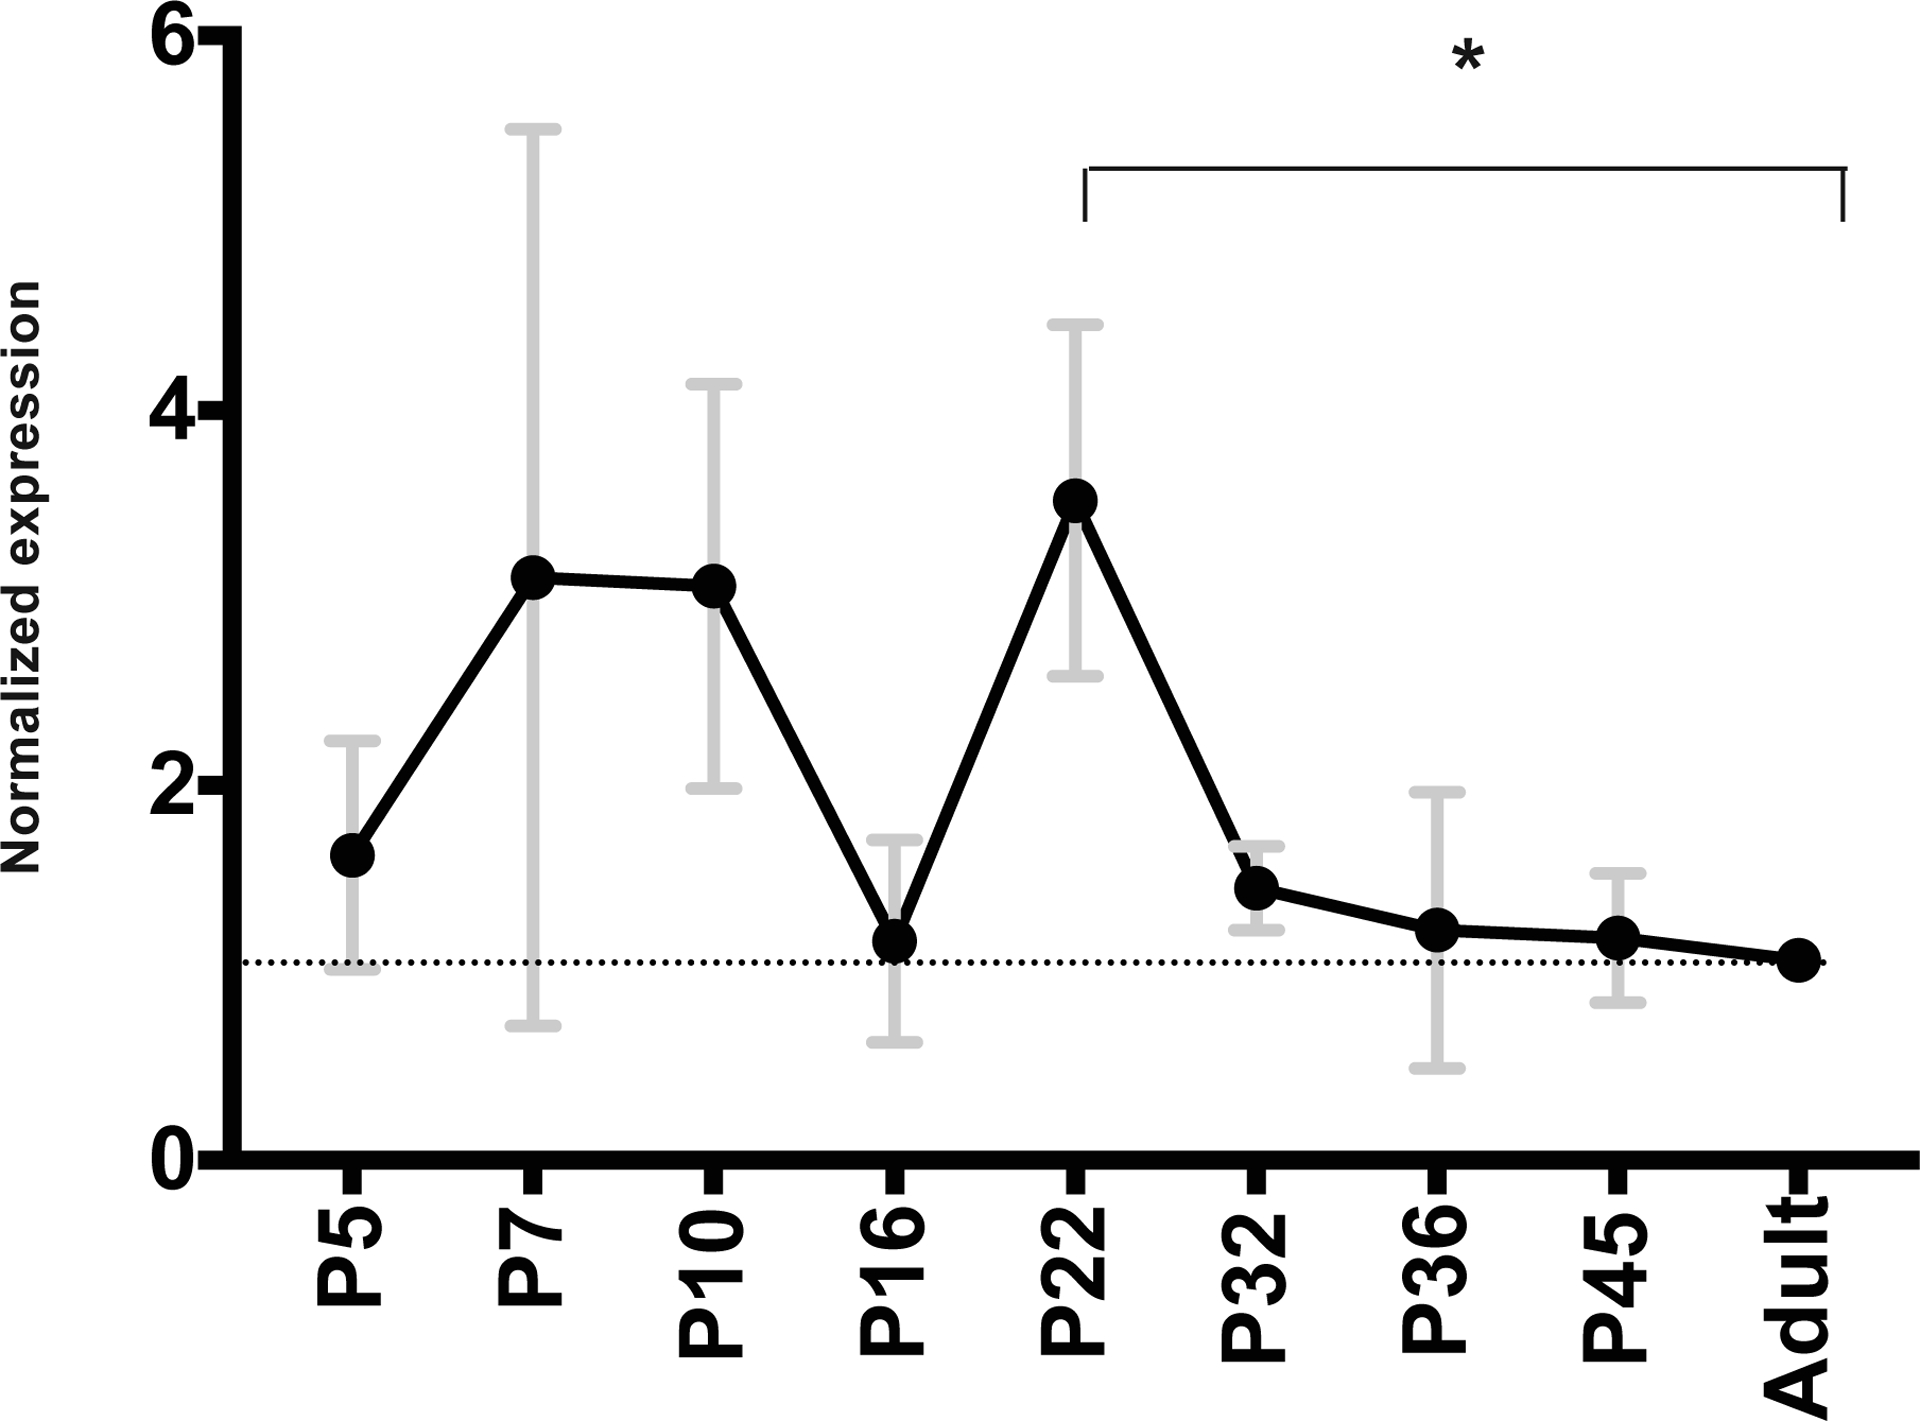
Individual expression was normalized by reference gene ACTR2. Annotations as in Figure 1.
A positive linear increase in IgM transcripts was found in the mammaries across the course of lactation (p = 0.0002, figure 5, Supplementary Figure 5). The largest variation in IgM transcript abundance occurred around the time of weaning. The joining chain (J-chain) utilized in the formation of polymeric immunoglobulins also displays a linear increase in mean transcript abundance throughout lactation similar to that of IgM and IgA (not shown).
Figure 5: Normalized mammary transcript abundance of IgM.
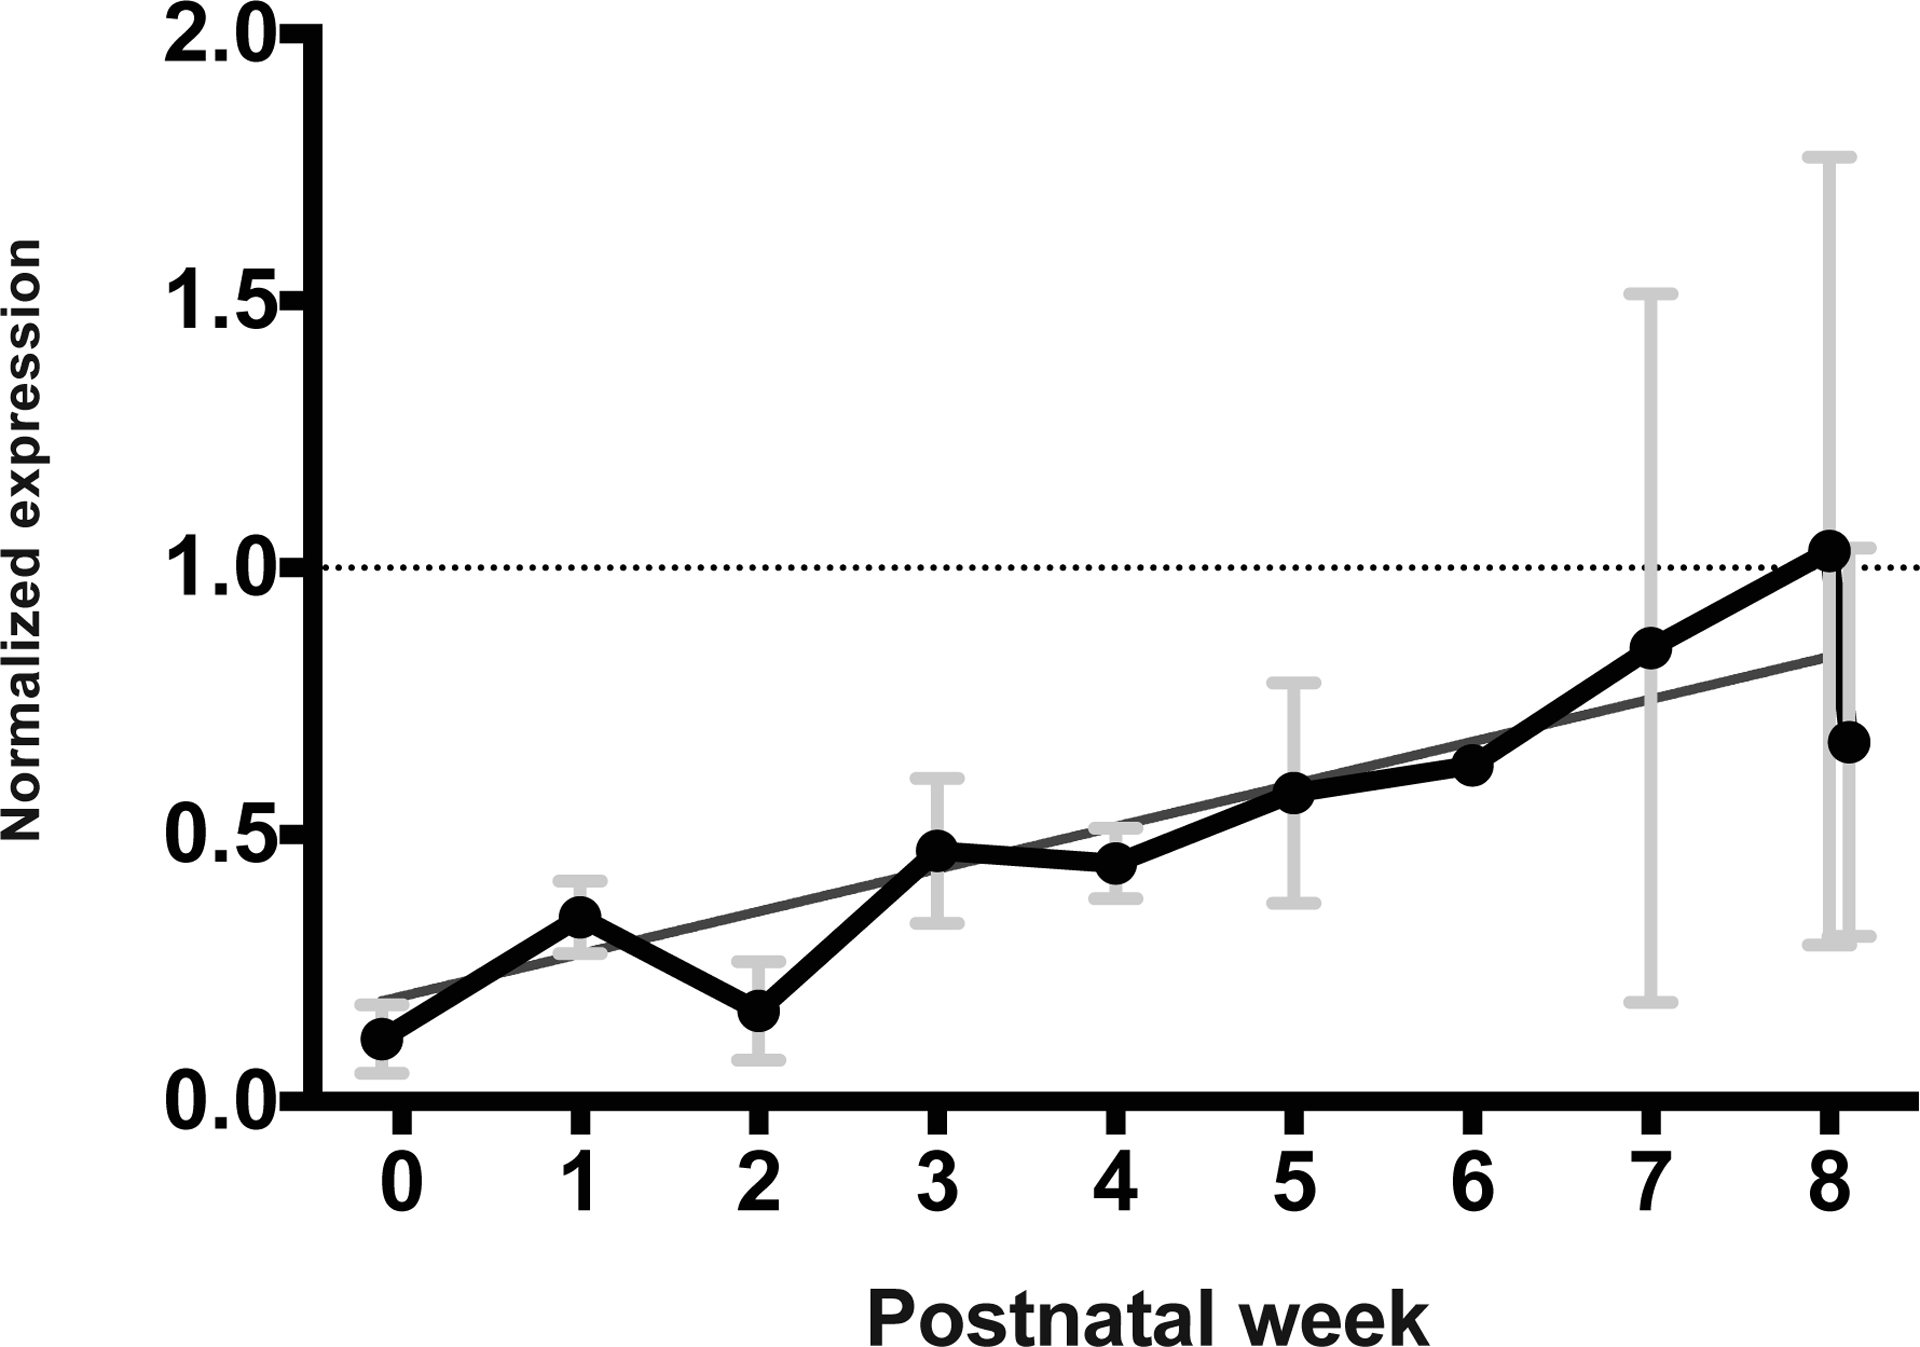
Linear regression values for IgM were p = 0.0002, r2 = 0.8373, slope = 0.08963. Annotations and data pooling for weeks are as in Figure 1.
Transcripts of IgE are in low abundance throughout lactation (not shown). Minimally elevated transcript abundance is present during week 1 and week 4 of lactation, however these differences are not statistically significant and represent relatively few transcripts.
Discussion
Some Australian species of marsupials have been found to have complex, changing patterns of mammary Ig transcripts; patterns that appear to correlate with the developmental stages of their neonates (Trott et al. 2003). Comparable analyses, however, have yet to be reported for opossum, or any American marsupial. In this study we investigated the abundance of mammary transcripts for all four antibody heavy chain isotypes found in opossum, as well the corresponding Ig transporters, FcRN and pIgR.
IgG does not appear to be transcribed within the opossum mammaries during lactation at any time point. Furthermore, endogenous neonatal IgG synthesis is not evident in opossum neonates until postnatal week 5 (Wang et al. 2012). Nonetheless, previous research has detected circulating IgG within offspring immediately following the initiation of suckling (Samples et al. 1986; Wild et al. 1994). Collectively these observations are consistent with IgG in newborn opossums being transferred from maternal circulation rather than de novo synthesis in the mammaries. This hypothesis is supported by the detection of mammary FcRN transcripts prior to birth. The greatest abundance of mammary FcRN transcripts occurs during week 4 (figure 6), just prior to the detection of endogenous IgG transcripts in offspring at week 5 (Wang et al. 2012). Similarly, the peak abundance of neonatal gut FcRN transcripts was during the first three postnatal weeks and declines at a time approaching when they begin to produce their own IgG. This coordinated decline in the transfer of maternal IgG with neonatal immune development would allow the young opossums to begin to develop their own immune repertoires and memory.
Figure 6: Immune related transcripts within the mammaries and neonatal gut correspond with offspring immune development.
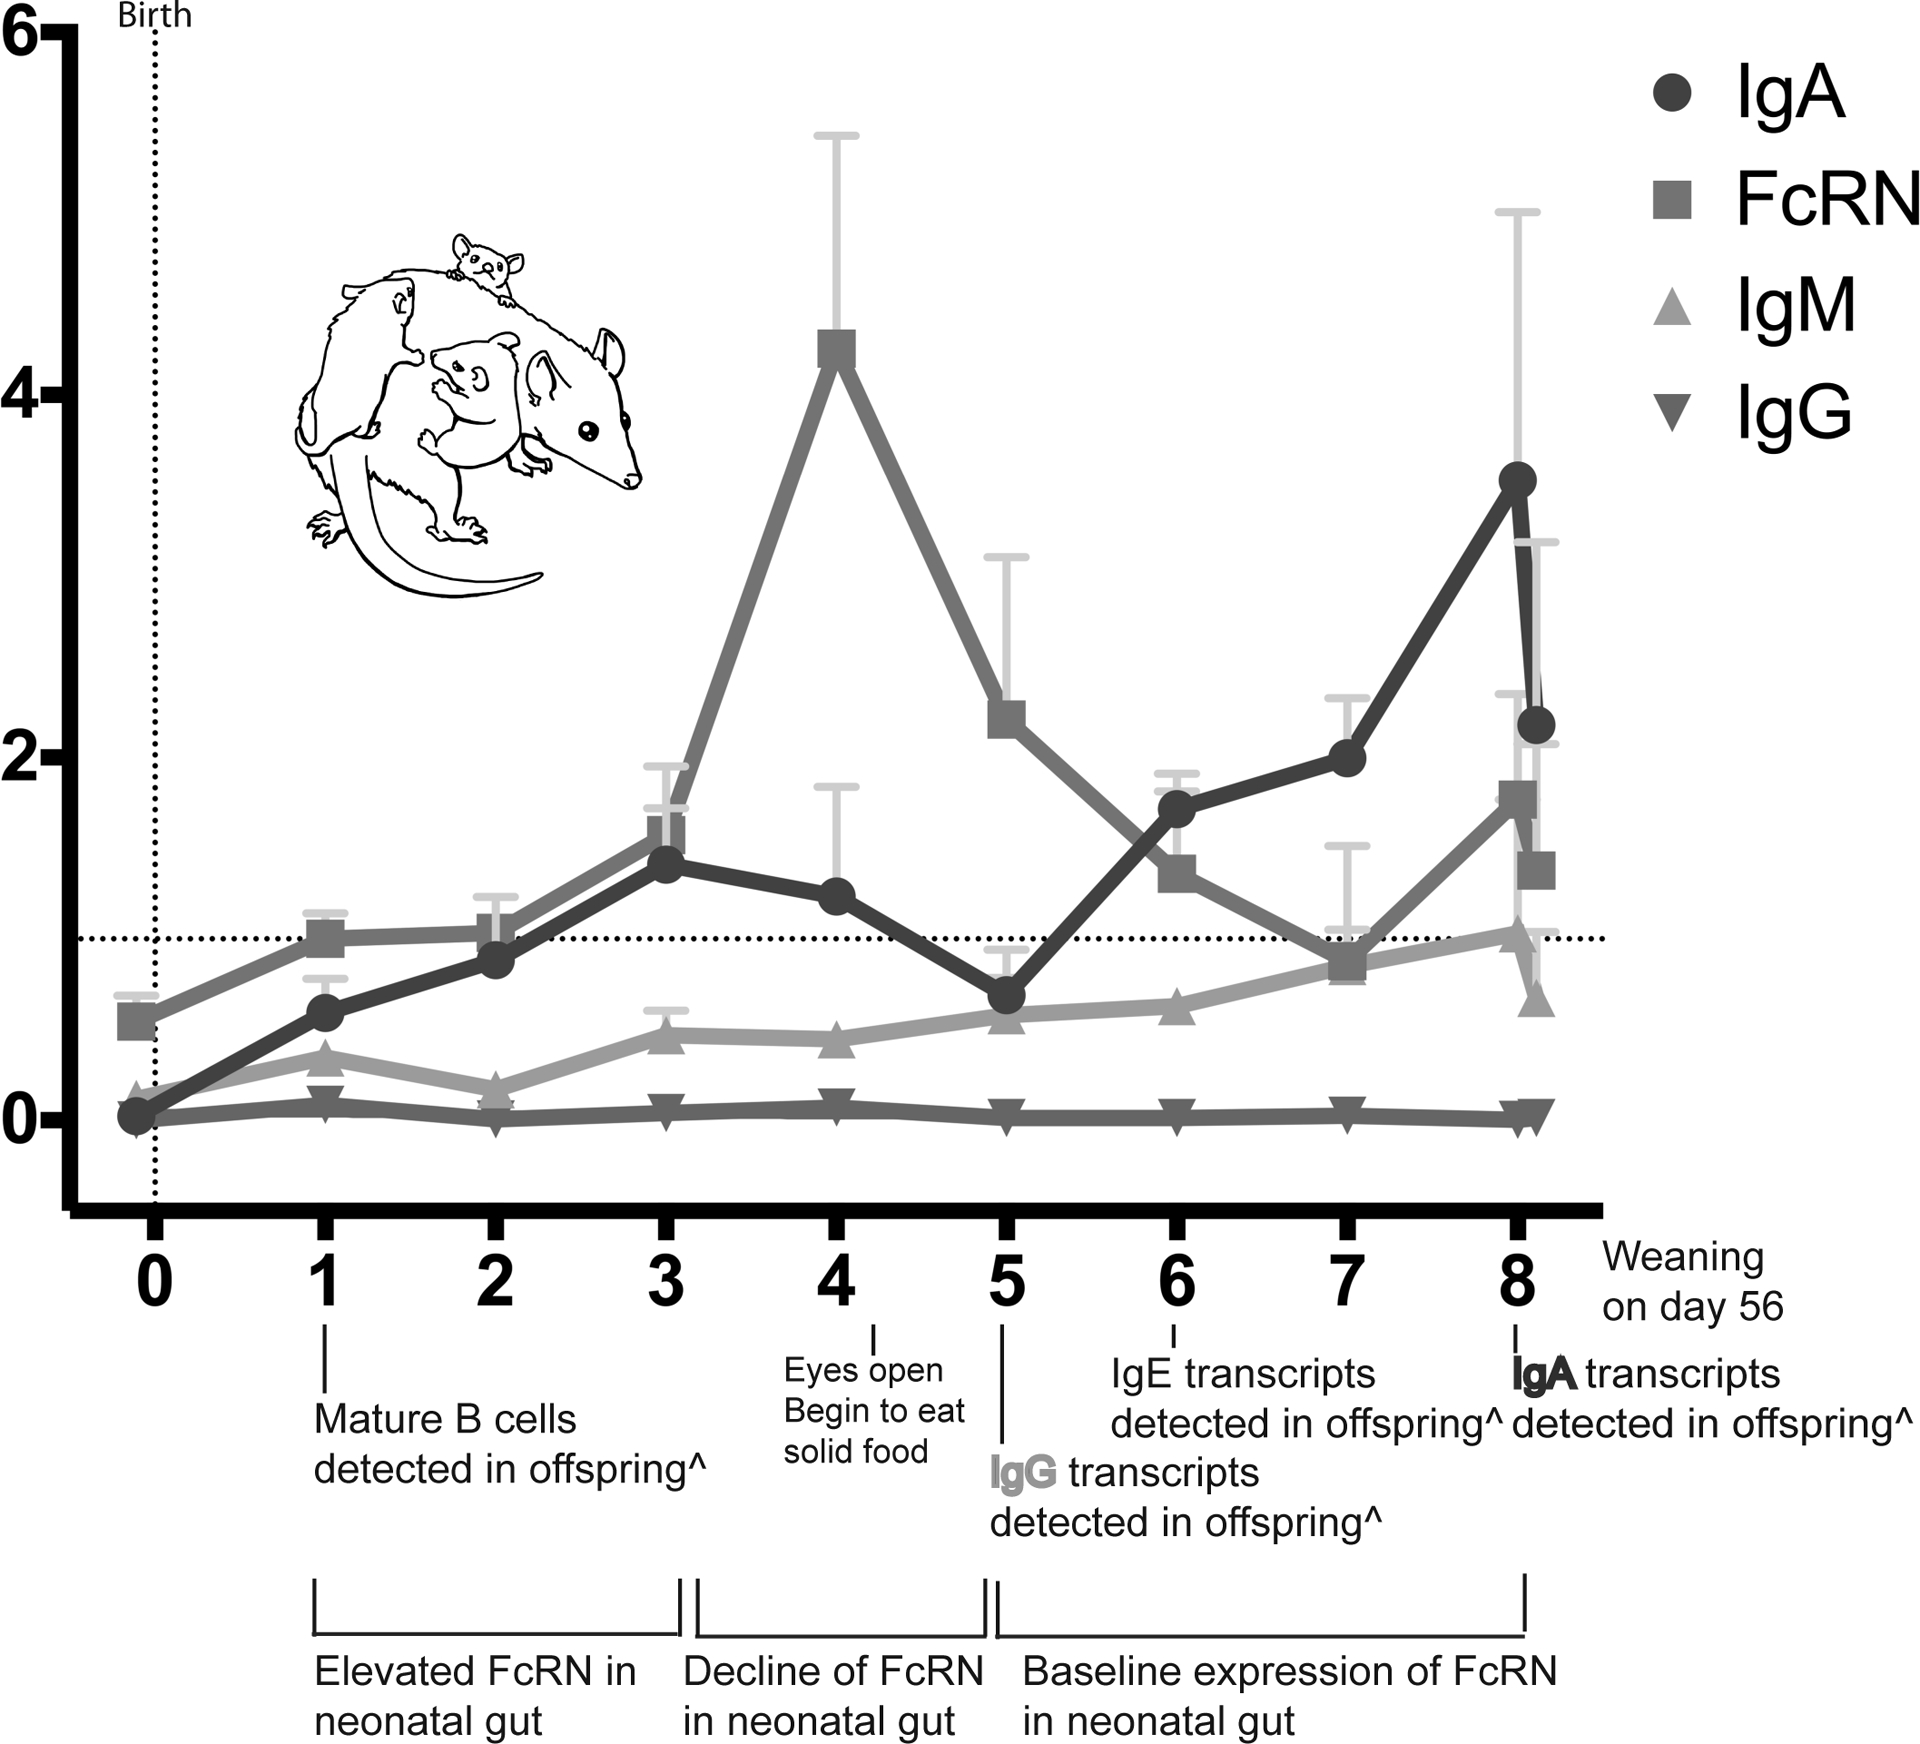
Comparison of results presented in Figures 1, 3, 4, and 5 to developmental milestones in the neonates. âdapted from Wang et al 2012.
In contrast to the results presented here for opossum, the Australian tammar wallaby has IgG transcripts in the mammary tissues, consistent with local production (Daly et al. 2007). FcRN is fairly consistently transcribed throughout lactation in Australian species (Adamski et al. 2000; Daly et al. 2007). These results have led investigators to conclude previously that the IgG in tammar wallaby and common brushtail possum milk is endogenous to the mammaries.
IgA is the immunoglobulin isotype predominantly transcribed within the mammaries of all marsupial species studied, including now the opossum. A biphasic, two-peak pattern of increased IgA expression has been described in both tammar wallabies and common brushtail possums (Adamski and Demmer 1999; Daly et al. 2007). It has been proposed the first peak surrounding parturition times correlates with the early establishment of the enteric microbiome. The second peak, occurring around the transition to late lactation, correlates with the offspring beginning to supplement their diet with solid food in preparation for weaning (Daly et al. 2007). Opossums lack this biphasic pattern. Rather IgA transcripts were found throughout opossum lactation and increased in abundance over time. Opossums do not make IgA until 8 weeks of age, just prior to weaning (Wang et al 2012). Continuous production of mammary IgA in the opossum may be necessary due to the delayed ability of the pups to produce this isotype endogenously.
It is interesting to speculate on the difference between the source of milk IgG and IgA in the opossum. The benefit of extracting IgG from maternal circulation rather than local production may be to provide the young with a spectrum of antibody, broadly specific for pathogens for which the mother has developed immunity. In contrast, IgA is specialized for mucosal sites and, for example, in humans antibody-producing B cells first activated in the gut transit to the mammaries of lactating women (Goldblum et al. 1975; reviewed in Brandtzaeg 2010). This provides the offspring with milk IgA specific for gut microbes. Whether such B cell trafficking occurs in opossums is not yet known, however our results would be consistent with this possibility.
IgM transcripts in opossum mammaries increased linearly throughout lactation, much like IgA. There is little evidence of IgE production in opossum mammaries. These are both also in contrast to the tammar wallaby that displays a biphasic pattern of IgM and IgE production (Daly et al. 2007; Joss et al. 2009).
The differences between the American opossum, and Australian tammar wallabies and common brushtail possums, may be due to speciation and differences in life-history traits such as body size, the presence of a pouch, diets, relative duration of lactation, etc. In particular, the pouchless nature of M. domestica may result in a greater dependence on maternal antibodies. However, another confounding influence might be husbandry. The M. domestica used in this study were indoor, laboratory bred from a well-established colony and free of any known pathogens. The Australian studies likely used animals from more natural, wild conditions, with complex immune histories and potential pathogen exposure. How species differences versus immune history may influence the results are not known. Nonetheless, based on the results presented here, there does not appear to be a universal lactation scheme amongst the marsupial lineage.
Supplementary Material
Supplementary Figure 2: Normalized mammary transcript abundance of pIgR. pIgR transcript abundance by day. Linear regression analyses failed to reach significance (p = 0.0530). One replicate at P36 was identified as a statistically significant outlier. Statistical analyses were performed with and without inclusion of outliers as in Supplementary Figure 1. *p ≤ 0.05, **p ≤ 0.01
Supplementary Figure 1: Normalized mammary transcript abundance of IgA. IgA transcript abundance by day. Linear regression values were p = 0.0001, r2 = 0.5441, slope = 0.03646. One individual at P1, P3, P17, P20, and P33 was identified as a significant outlier among the replicates. Statistical analyses were performed with and without inclusion of these individuals. Inclusion did not significantly alter the overall significance of the analyses. Outlier expression is represented for each time point but has not been included in the mean expression among the biological set shown here. * p ≤ 0.01.
Supplementary Figure 3: Normalized mammary transcript abundance of IgG. IgG transcript abundance by day. Significant outliers were identified at 6 time points, E14, P3, P13, P17, P31, and P44. The outlier at P3 was identified as a significant ‘over-expressor’ for IgG as well as IgM and IgE. This individual may have been experiencing an immune response within the mammaries not related to passive immune transfer at collection that was unknown. Statistical analyses were performed with and without inclusion of outliers as in Supplementary Figure 1.
Supplementary Figure 4: Normalized mammary transcript abundance of FcRN. FcRN transcript abundance by day. *p ≤ 0.05 **p ≤ 0.01. Significant outliers were detected at E14, P3, P13, P17, P31, and P34. Statistical analyses were performed with and without inclusion of outliers as in Supplementary Figure 1.
Supplementary Figure 5: Normalized mammary transcript abundance of IgM. IgM transcript abundance by day. Linear regression values were p = 0.0053, r2 = 0.3433, slope = 0.008895. Significant outliers were detected at P3, P13 and P44. Statistical analyses were performed with and without inclusion of outliers as in Supplementary Figure 1.
Supplementary Table 1: Gene specific primer characteristics utilized in qPCR. Amplification cycling parameters consisted of an initial denaturation step at 95°C for 2 min, followed by 40 cycles of 95 °C for 5 s and GSP annealing temperature (varied see table) for 30 s, a terminating step of 95 °C for 5 s terminating at 65 °C for 31 s. A final melt curve was constructed by 60 cycles of 65 °C for 5 s increasing +0.05 °C/cycle with a ramp of 0.05 °C/cycle. Singularity of product size was also examined per plate by melt curve analyses. A sample from the serial dilution was run on a 2% agarose gel and stained with RedGel Nucleic Acid Stain and viewed under UV light to confirm that a band of the correct size was amplified. Efficiency of the amplification was determined for each primer pair using serial 10 fold dilutions of pooled cDNA. All calculations were performed using BioRad CFX 3.1 (BioRad). Reference gene appropriateness was evaluated using calculated M values and target stability scores across all samples. Gene studies were constructed using BioRad software and an interplate calibrator was utilized across all plates. Several attempts were made to locate efficient IgG primers that spanned an intron. The product of the primer pair reported for IgG was analyzed for singularity of product by the presence of a single band in PCR, melt curve analyses, as well as cloning and sequencing of product. Sequenced products had 100% identity and alignment with target sequence.
Acknowledgements
The authors would like to acknowledge the contributions of Ali Salehpoor, for his assistance with mammary tissue extractions. We would like to thank Dr. Victoria L. Hansen for the use of her drawing in figure 6. We would like to thank the staff of the UNM Biology Animal Research Facility for their assistance with husbandry and care of the M. domestica colony.
This research was funded in part by a National Science Foundation award No. IOS-13531232. Research reported in this publication was supported in part by the National Institute of General Medical Sciences of the National Institutes of Health under award number P30 GM110907. The content is solely the responsibility of the authors and does not necessarily represent the official views of the National Institutes of Health.
Footnotes
Conflicts of interest
The authors declare no conflicts of interests.
References
- Adamski FM, and Demmer J (1999). Two stages of increased IgA transfer during lactation in the marsupial, Trichosurus vulpecula (Brushtail possum). J Immunol. 162 (10), 6009–6015. [PubMed] [Google Scholar]
- Adamski FM, and Demmer J (2000). Immunological protection of the vulnerable marsupial pouch young: two periods of immune transfer during lactation in Trichosurus vulpecula (brushtail possum). Dev Comp Immunol. 24 (5), 491–502. [DOI] [PubMed] [Google Scholar]
- Adamski FM, King AT, and Demmer J (2000). Expression of the Fc receptor in the mammary gland during lactation in the marsupial Trichosurus vulpecula (brushtail possum). Mol Immunol. 37, 435–444. 10.1016/S0161-5890(00)00065-1 [DOI] [PubMed] [Google Scholar]
- Bininda-Emonds ORP, Cardillo M, Jones KE, MacPhee RDE, Beck RMD, Grenyer R, Price SA, Vos RA, Gittleman JL and Purvis A. (2007). The delayed rise of present-day mammals. Nature, 446 (7135), 507–512. 10.1038/nature05634 [DOI] [PubMed] [Google Scholar]
- Brandtzaeg P (2010). The Mucosal Immune System and Its Integration with the Mammary Glands. J Pediatr. 156, (2) Supplement 1, pp. S8–S15. 10.1016/j.jpeds.2009.11.014 [DOI] [PubMed] [Google Scholar]
- Crisp EA, Messer M, and VandeBerg JL (1989). Changes in Milk Carbohydrates during Lactation in a Didelphid Marsupial, Monodelphis domestica. Physiol Zool. (62) 5, pp.1117–1125. [Google Scholar]
- Daly KA, Digby M, Lefèvre C, Mailer S, Thomson P, Nicholas K, and Williamson P (2007). Analysis of the expression of immunoglobulins throughout lactation suggests two periods of immune transfer in the tammar wallaby (Macropus eugenii). Vet Immunol Immunop. 120 (3–4), 187–200. 10.1016/j.vetimm.2007.07.008x [DOI] [PubMed] [Google Scholar]
- Deane EM, and Cooper DW (1988). Immunological development of pouch young marsupials In (Eds Tyndale-Biscoe CH, and Janssens PA) The developing marsupial: models for biomedical research. pp. 190–199. (Berlin: Springer-Verlag; ). [Google Scholar]
- Edwards MJ, Hinds LA, Deane EM, and Deakin JE (2012). A review of complementary mechanisms which protect the developing marsupial pouch young. Dev Comp Immunol. 37 (2), 213–220. 10.1016/j.dci.2012.03.013 [DOI] [PubMed] [Google Scholar]
- Green B & Merchant JC (1988). The Composition of Marsupial Milk In (Eds. Tyndale_Biscoe CH & Janssens PA), The Developing Marsupial (41–54). (Berlin: Springer-Verlag; ). [Google Scholar]
- Green B, VandeBerg JL, and Newgrain K (1991). Milk Composition in an American Marsupials (Monodelphis domestica). Comparative Biochemistry and Physiology, 99B (3), 663–665. 10.1016/0305-0491(91)90351-D [DOI] [PubMed] [Google Scholar]
- Goldblum RM, Ahlstedt S, Carlsson B, Hanson LÅ, Jodal U, Lidin-Janson G, and Sohl-Åkerlund A (1975). Antibody-forming cells in human colostrum after oral immunisation. Nature, 257 (5529), 797. doi: 10.1038/257797a0 [DOI] [PubMed] [Google Scholar]
- Hansen VL, Faber LS, Salehpoor AA, and Miller RD (2017). A pronounced uterine pro-inflammatory response at parturition in a marsupial. P Roy Soc Lond B Bio. doi: 10.1098/rspb.2017.1694 [DOI] [PMC free article] [PubMed] [Google Scholar]
- Hurley WL, and Theil PK (2011). Perspectives on Immunoglobulins in Colostrum and Milk. Nutrients, 3(4), 442–474. 10.3390/nu3040442 [DOI] [PMC free article] [PubMed] [Google Scholar]
- Jenness R, and Sloan RE (1970). The Composition of Milks of Various Species: A Review. Dairy Science Abstracts, 32 (10), 599–612. [Google Scholar]
- Joss JL, Molloy MP, Hinds L, and Deane E (2009). A Longitudinal study of the proteincomponents of marsupial milk from birth to weaning in the M. eugenii (Macropus eugenii). Dev Comp Immunol. 33, 152–161. https://dx.doi.org/10.1186%2Fs12861-015-0063-z [DOI] [PubMed] [Google Scholar]
- Kuehl-Kovarik DS, Sakaguchi J, Sonea II, and Jacobson CD (1995). The Gray Short-Tailed Opossum: A Novel Model for Mammalian Development. Lab Animal, 24 (6), 24–29. 10.1016/0165-3806(96)00102-2 [DOI] [Google Scholar]
- La Via M, Rollands D, and Block M (1963). Antibody formation in embryos. Science. 140; 1219–1220. [DOI] [PubMed] [Google Scholar]
- Mikkelsen TS, Wakefield MJ, Aken B, Amemiya CT, Chang JL, Duke S, Garber M, Gentles AJ, Goodstadt L, Heger A, Jurka J, Kamal M, Mauceli E, Searle SMJ, Sharpe T, Baker ML, Batzer MA, Benos PV, Belov K, Clamp M, Cook A, Cuff J, Das R, Davidow L, Deakin JE, Fazzari MJ, Glass JL, Grabherr M, Greally JM, Gu W, Hore TA, Huttley GA, Jirtle RL, Koina E, Lee JT, Mahony S, Marra MA, Miller RD, Nicholls RD, Oda M, Papenfuss AT, Parra ZE, Pollock DD, Ray DA, Schein JE, Speed TP, Thompson K, VandeBerg JL, Wade CM, Walker Waters, P.D JA, Webber C, Weidman JR, Xie X, Zody MC, Broad Institute Genome Sequencing Platform, Broad Institute Whole Genome Assembly Team, Marshall Graves JA, Ponting CP, Breen M, Samollow PB, Lander ES, and Lindblad-Toh KS (2007). Genome of the marsupial Monodelphis domestica reveals lineage-specific innovation in coding sequences. Nature 447:167–178. 10.1038/nature05805 [DOI] [PubMed] [Google Scholar]
- Old JM, and Deane EM (2000). Development of the immune system and immunological protection in marsupial pouch young. Dev Comp Immunol, 24(5), 445–454. [DOI] [PubMed] [Google Scholar]
- Parra ZE, Baker ML, Lopez AM, Trujillo J, Volpe JM and Miller RD (2009). TCRμ recombination and transcription relative to the conventional TCR during postnatal development in opossums. J Immunol 182:154–163. [DOI] [PMC free article] [PubMed] [Google Scholar]
- Pfaffl MW (2001). A new mathematical model for relative quantification in real-time RT–PCR, Nucleic Acids Research, Volume 29, Issue 9 (1), e45, 10.1093/nar/29.9.e45 [DOI] [PMC free article] [PubMed] [Google Scholar]
- Roopenian DC, and Akilesh S (2007). FcRn: the neonatal Fc receptor comes of age. Nat Rev Immunol. 7 (9), 715–725. 10.1038/nri2155 [DOI] [PubMed] [Google Scholar]
- Samples NK, Vandeberg JL, and Stone WH (1986). Passively acquired immunity in the newborn of a marsupial (Monodelphis domestica). American Journal of Reproductive Immunology and Microbiology : AJRIM, 11 (3), 94–97. 10.1111/j.1600-0897.1986.tb00038.x [DOI] [PubMed] [Google Scholar]
- Skibiel AL, Downing LM, Orr TJ, and Hood WR (2013). The evolution of the nutrient composition of mammalian milks. J Anim Ecol. 82 (6), 1254–1264. 10.1111/1365-2656.12095 [DOI] [PubMed] [Google Scholar]
- Trott JF, Simpson KJ, Moyle RLC, Hearn CM, Shaw G, Nicholas KR, and Renfree MB (2003). Maternal Regulation of Milk Composition, Milk Production, and Pouch Young Development During Lactation in the Tammar wallaby (Macropus eugenii). Biol Reprod. 68 (3), 929–936. 10.1095/biolreprod.102.005934 [DOI] [PubMed] [Google Scholar]
- Tyndale-Biscoe H and Renfree M (1987). Reproductive physiology of marsupials. (Cambridge:Cambridge University Press; ). [Google Scholar]
- Vandeberg JL, and Robinson ES (1997). The laboratory opossum (Monodelphis domestica) in laboratory research. ILAR Jour. 38; 1; 4–12. 10.1093/ilar.38.1.4 [DOI] [PubMed] [Google Scholar]
- Vandersompele J, De Preter K, Pattyn F, Poppe B, Van Roy N, De Paepe A, and Speleman F (2002). Accurate normalization of real-time quantitative RT-PCR data by geometric averaging of multiple internal control genes. Genome Biol, 3 (7) 1–12. [DOI] [PMC free article] [PubMed] [Google Scholar]
- Wang X, Olp JJ, and Miller RD (2009). On the genomics of immunoglobulins in the gray, short-tailed opossum Monodelphis domestica. Immunogenetics. 61, 581–596. https://dx.doi.org/10.1007%2Fs00251-009-0385-8 [DOI] [PMC free article] [PubMed] [Google Scholar]
- Wang X, Sharp AR and Miller RD (2012). Early postnatal B cell ontogeny and antibody repertoire maturation in the opossum, Monodelphis domestica. PLoS ONE. 7(9): e45931 10.1371/journal.pone.0045931 [DOI] [PMC free article] [PubMed] [Google Scholar]
- Wild AE, Burrows TD, and Brand J (1994). IgG Transport Across the Gut of the Suckling Opossum (Monodelphis domestica). Dev Comp Immunol. 18, (1), 75–88. [DOI] [PubMed] [Google Scholar]
Associated Data
This section collects any data citations, data availability statements, or supplementary materials included in this article.
Supplementary Materials
Supplementary Figure 2: Normalized mammary transcript abundance of pIgR. pIgR transcript abundance by day. Linear regression analyses failed to reach significance (p = 0.0530). One replicate at P36 was identified as a statistically significant outlier. Statistical analyses were performed with and without inclusion of outliers as in Supplementary Figure 1. *p ≤ 0.05, **p ≤ 0.01
Supplementary Figure 1: Normalized mammary transcript abundance of IgA. IgA transcript abundance by day. Linear regression values were p = 0.0001, r2 = 0.5441, slope = 0.03646. One individual at P1, P3, P17, P20, and P33 was identified as a significant outlier among the replicates. Statistical analyses were performed with and without inclusion of these individuals. Inclusion did not significantly alter the overall significance of the analyses. Outlier expression is represented for each time point but has not been included in the mean expression among the biological set shown here. * p ≤ 0.01.
Supplementary Figure 3: Normalized mammary transcript abundance of IgG. IgG transcript abundance by day. Significant outliers were identified at 6 time points, E14, P3, P13, P17, P31, and P44. The outlier at P3 was identified as a significant ‘over-expressor’ for IgG as well as IgM and IgE. This individual may have been experiencing an immune response within the mammaries not related to passive immune transfer at collection that was unknown. Statistical analyses were performed with and without inclusion of outliers as in Supplementary Figure 1.
Supplementary Figure 4: Normalized mammary transcript abundance of FcRN. FcRN transcript abundance by day. *p ≤ 0.05 **p ≤ 0.01. Significant outliers were detected at E14, P3, P13, P17, P31, and P34. Statistical analyses were performed with and without inclusion of outliers as in Supplementary Figure 1.
Supplementary Figure 5: Normalized mammary transcript abundance of IgM. IgM transcript abundance by day. Linear regression values were p = 0.0053, r2 = 0.3433, slope = 0.008895. Significant outliers were detected at P3, P13 and P44. Statistical analyses were performed with and without inclusion of outliers as in Supplementary Figure 1.
Supplementary Table 1: Gene specific primer characteristics utilized in qPCR. Amplification cycling parameters consisted of an initial denaturation step at 95°C for 2 min, followed by 40 cycles of 95 °C for 5 s and GSP annealing temperature (varied see table) for 30 s, a terminating step of 95 °C for 5 s terminating at 65 °C for 31 s. A final melt curve was constructed by 60 cycles of 65 °C for 5 s increasing +0.05 °C/cycle with a ramp of 0.05 °C/cycle. Singularity of product size was also examined per plate by melt curve analyses. A sample from the serial dilution was run on a 2% agarose gel and stained with RedGel Nucleic Acid Stain and viewed under UV light to confirm that a band of the correct size was amplified. Efficiency of the amplification was determined for each primer pair using serial 10 fold dilutions of pooled cDNA. All calculations were performed using BioRad CFX 3.1 (BioRad). Reference gene appropriateness was evaluated using calculated M values and target stability scores across all samples. Gene studies were constructed using BioRad software and an interplate calibrator was utilized across all plates. Several attempts were made to locate efficient IgG primers that spanned an intron. The product of the primer pair reported for IgG was analyzed for singularity of product by the presence of a single band in PCR, melt curve analyses, as well as cloning and sequencing of product. Sequenced products had 100% identity and alignment with target sequence.


