

Abstract
Untargeted metabolomics aims to quantify the complete set of metabolites within a biological system, most commonly by liquid chromatography/mass spectrometry (LC/MS). Since nearly the inception of the field, compound identification has been widely recognized as the rate-limiting step of the experimental workflow. In spite of exponential increases in the size of metabolomic databases, which now contain experimental MS/MS spectra for over a half million reference compounds, chemical structures still cannot be confidently assigned to many signals in a typical LC/MS dataset. The purpose of this Perspective is to consider why identification rates continue to be low in untargeted metabolomics. One rationalization is that many naturally occurring metabolites detected by LC/MS are true “novel” compounds that have yet to be incorporated into metabolomic databases. An alternative possibility, however, is that research data do not provide database matches because of informatic artifacts, chemical contaminants, and signal redundancies. Increasing evidence suggests that, for at least some sample types, many unidentifiable signals in untargeted metabolomics result from the latter rather than new compounds originating from the specimen being measured. The implications of these observations on chemical discovery in untargeted metabolomics is discussed.
Introduction
The last few decades have seen an increasing number of ‘omic technologies become available to profile biological systems.1 One such approach, referred to as metabolomics, aims to provide quantitative comparisons of metabolite concentrations between samples. Metabolomics offers some unique advantages relative to the other profiling strategies available, thereby making it highly complementary. First, metabolite concentrations provide a direct readout of biochemical activity.2 A change in one or more metabolite levels signifies an alteration in phenotype. In the context of cellular metabolism, metabolite concentrations typically change as a result of modified enzyme activity or differences in the rates of nutrient consumption and excretion. When profiling genes and proteins, in contrast, enzyme activities and nutrient-exchange rates can only be inferred.3 Second, most biological processes depend upon metabolism.4 Metabolomics provides an opportunity to better define these relationships between cellular functions and biochemical pathways, some of which are likely to be unexpected. From a human disease perspective, such knowledge may reveal new therapeutic targets.5 From the point of view of metabolic engineering, it could contribute to increased cellular production of therapeutics and biofuels, improved crop yields, better strategies for renewable energy, as well as other potential advances in synthetic biology.6–9
A defining attribute of a metabolomic experiment is which metabolites it assays. In theory, the metabolome describes the complete set of all metabolites in a biological system.10 In practice, however, measurement of the entire metabolome in a single experiment is not possible. A challenge, which represents both an exciting opportunity for chemical discovery and an intimidating analytical burden, is that the size of the metabolome is not well defined. Metabolites, typically recognized as the small molecules in cells, may be taken up directly from the environment or produced through endogenous transformation processes. Although the latter can potentially be predicted from genes or proteins, the former is only limited by the chemicals that the biological system encounters. Human tissues and biofluids, for example, contain metabolites derived from the specific foods, drugs, hygiene products, and pollutants to which a person is exposed (the so-called “exposome”).11, 12 Without a list of molecules present in a sample, metabolome coverage is difficult to quantitatively evaluate. Regardless of the size of the metabolome, it is clear that no single profiling experiment can be truly comprehensive for even known metabolites because of the physicochemical diversity of small molecules.13 Experimental methods that are optimal for analysis of hydrophobic metabolites are generally not well suited for analysis of hydrophilic metabolites, and vice versa.14 Attempting to assay as many metabolites as possible in one experiment is an approach known as “untargeted metabolomics”. Although a number of analytical platforms can be used to perform untargeted metabolomics, liquid chromatography/mass spectrometry (LC/MS) is the most commonly applied and will be the focus of our attention here.
One Author’s Reflection (G.J.P.)
Ten years ago, I used to entice chemistry students to pursue a research career in metabolomics by highlighting the thousands of leads from metabolomic data that I argued might represent new naturally occurring compounds in human serum. By that time, we had spent several years analyzing human serum with untargeted metabolomics. After attempting to remove isotopes and well-known adducts from the LC/MS data, we were left with over twelve thousands peaks having a unique combination of retention-time and m/z values (so-called “features”).15 Strikingly, MS and MS/MS data for the overwhelming majority of these features did not provide a match in any of the major metabolomic databases (METLIN, LipidMaps, HMDB, and MassBank). Even when we turned our attention to a well-characterized model organism, E. coli, we obtained an equally small number of chemical identifications.15 Given that MS/MS databases contained most of the metabolites included in conventional biochemistry textbooks, I was excited by the notion that there were potentially thousands of metabolites detected by LC/MS-based metabolomics that had not yet been reported, possibly produced by promiscuous enzyme activity or enzymes with unknown function.16–20
Flashing forward to current times, I still show prospective graduate students a pie chart to illustrate the number of features that we can identify in a typical untargeted metabolomic experiment. Even for E. coli, the proportion that we have structurally characterized remains strikingly small relative to the overall size of the dataset (i.e., just a few percent). From a bird’s-eye view, it may not look like we have made much progress. Indeed, the pie charts I have been showing for the last ten years do not look all that different. Yet, my interpretation of the data has evolved considerably. The goal of this Perspective is to outline developments that have contributed to shifts in my thinking about what, superficially, appears to be the same general set of structural identifications. As T.S. Eliot wrote, “And the end of all our exploring Will be to arrive where we started And know the place for the first time.”21
Defining the unknown
The term “unknowns” is often used in the field of metabolomics, but its meaning depends upon context.22 Generally speaking, an unknown is a feature in a metabolomic dataset for which an identity has not yet been assigned. Theoretically, every feature in a dataset starts as an unknown. After data processing, some unknowns will be identified (e.g., amino acids, central carbon metabolites, etc.) by using typical informatic pipelines. Many unknowns will remain unidentified after standard data processing, meaning that they do not return a match in the metabolomic databases or libraries searched. One possible reason why an unknown does not return a match is because it represents a compound that has not yet been entered in the database or library searched. These unknowns could correspond to novel compounds whose chemical structures have not yet been previously described in the literature, but that is not necessarily the case. In fact, a major goal of this Perspective article is to present evidence that often these unknowns do not represent novel compounds, at least for the samples most commonly analyzed in our laboratory. Rather, many unknowns do not return matches because they are redundant signals, artifacts, and contaminants that are not included in metabolomic databases and libraries (vide infra).23 Other unknowns may arise from unique metabolites that have not yet been incorporated in the databases or libraries searched, but these compounds may still be well-studied chemicals. Consider an example when a drug metabolite is detected from a patient sample. Although the drug metabolite may not be in metabolomic databases, there could be a large body of research describing the chemical. It would be inappropriate to describe this drug metabolite as a novel compound.
Equivocating the term “unknown” with “unknown metabolite” or “novel compound” can be highly misleading. First, an unknown is an unidentified feature. Multiple features will be derived from the same metabolite or compound.24 An unidentified feature could be redundant for a metabolite already identified. Second, some features may be the result of informatic errors and chemical contaminants.25 It should not be assumed that an unidentified feature is biologically meaningful. Third, the number of unknowns in a metabolomic dataset is a function of the informatic methods being applied. When only small databases and libraries are searched, for example, then more unknowns will remain. Thus, the number of unknowns in any particular study is likely to be more indicative of the informatic workflow and experimental techniques being applied rather than the potential for discovery of previously unreported metabolites.
A lesson learned
In 2012, our enthusiasm for discovering previously unreported compounds with LC/MS-based metabolomics was high. A feature with an m/z of 809.1550 captured our attention. We observed it in almost all of the biological samples we had evaluated in negative ion mode, ranging from E. coli to human tissue. At the time, accurate-mass searches in metabolomic databases provided no matches. Although it is typical that many features do not return database matches, our interest in this particular signal was piqued by a statistically significant increase in its intensity in a subset of transformed mammalian cells. We speculated that, whatever the identity of this signal, it may be relevant to the metabolism of some cancers.
We decided to invest effort into structurally characterizing the feature. In total, the project would ultimately involve five graduate students, a postdoctoral fellow, and two professors over a three year period. Our first step was to perform MS/MS analysis. In retrospect, had the fragmentation pattern looked more unfamiliar, we may have abandoned the search. We noted, however, a number of recognizable fragments in the spectra. One fragment had an m/z of 408.01, for example, which is characteristic of molecules containing adenosine diphosphate (Figure 1A). Moreover, after culturing mammalian cells in uniform 13C-glucose, the feature reflected incorporation of five and ten 13C labels. The result was consistent with synthesis of a ribose component, which is a five-carbon sugar, via the pentose phosphate pathway. The data were compelling enough to be presented at the American Association for Cancer Research meeting as a potentially novel metabolite whose level was increased in some cancer cells. Discussion with conference attendees led to speculation that the compound might be a damaged nucleotide, similar to the well-characterized metabolites that others have investigated previously.26–29
Figure 1:
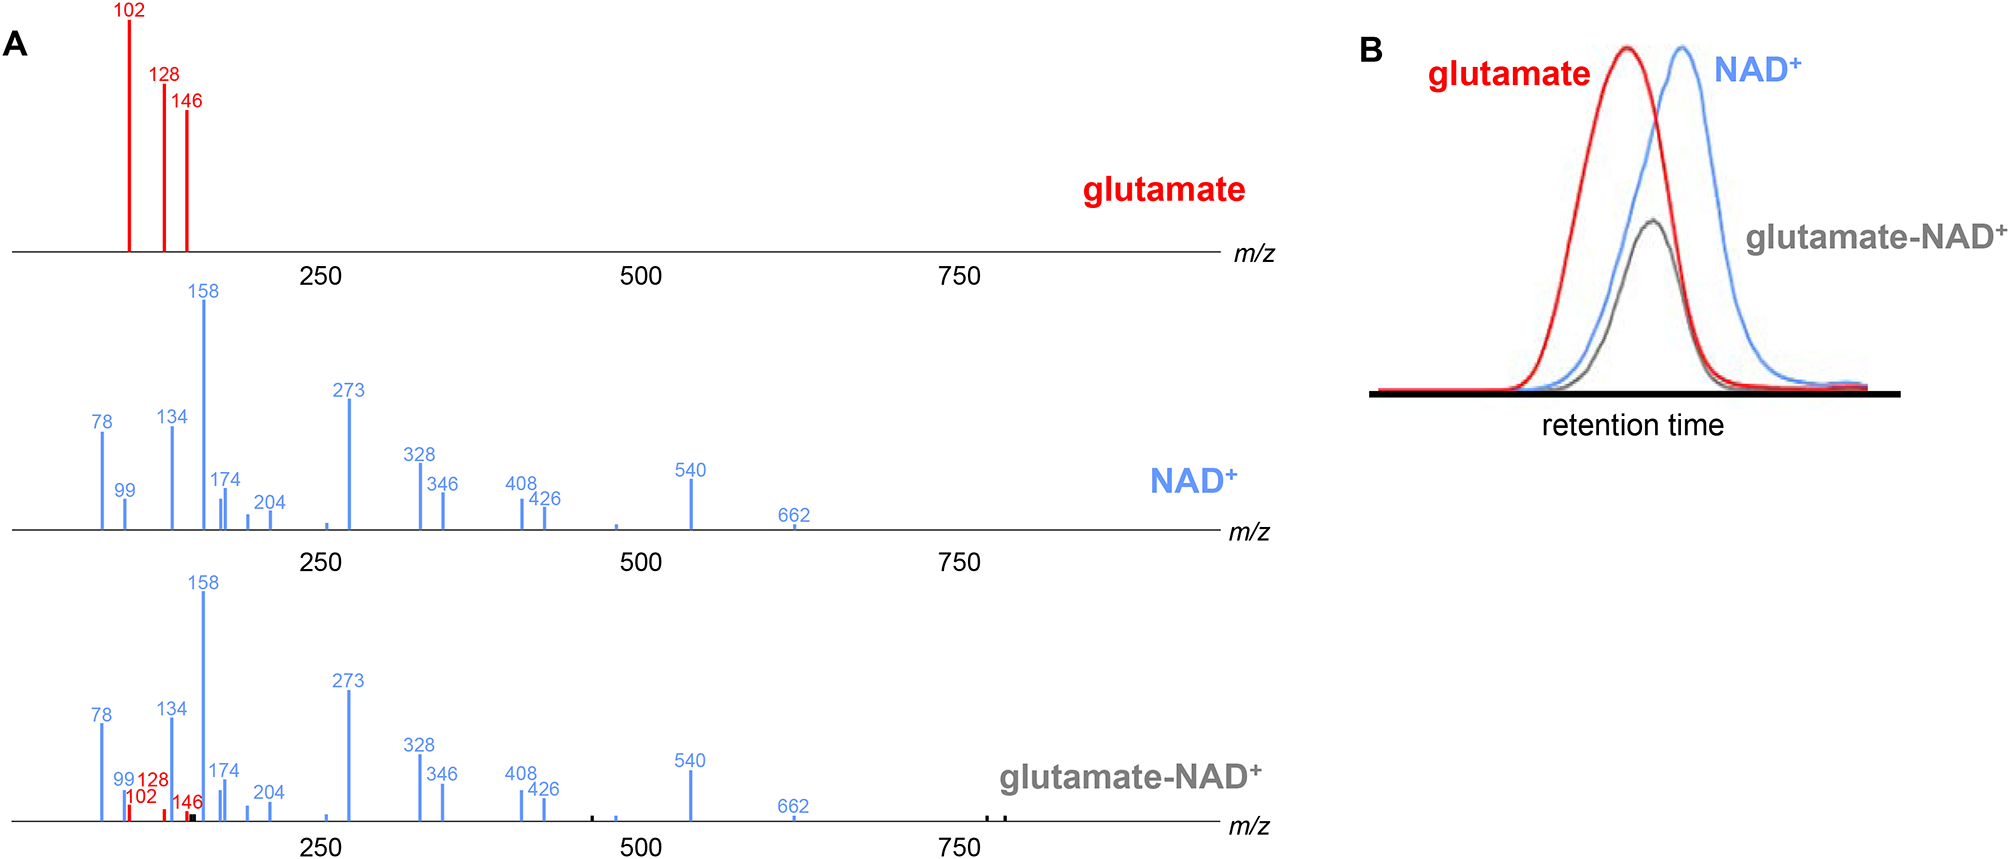
Experimental data from the heteromer of glutamate and NAD+ (m/z 809.1550 in negative-ion mode). (A) MS/MS spectra from glutamate, NAD +, and the glutamate-NAD + heteromer. Fragments detected in both the glutamate and heteromer MS/MS spectra are colored red. Fragments detected in both the NAD+ and the heteromer MS/MS spectra are colored blue. (B) Chromatographic profile of glutamate, NAD +, and a glutamate-NAD + heteromer.
In 2015, we determined that m/z 809.1550 was a heteromer formed through adduction of glutamate and nicotinamide adenine dinucleotide (NAD+) in the source of the mass spectrometer. The change in intensity we had observed was a result of varying levels of glutamate, a constituent of the heteromer, between cell types. The fragmentation patterns looked familiar because they were derived from glutamate and NAD+. The latter contains two ribose moieties, explaining the shift of five and ten mass units after labeling with uniform 13C-glucose. Given that the extracted ion chromatograms of glutamate and NAD+ only partially overlap with the separation method we applied, the profile of the heteromer’s extracted ion chromatogram did not match the profile of either glutamate or NAD+. Thus, the heteromer eluded our searches for redundant features of the same metabolite on the basis of chromatographic peak shape similarity (Figure 1B).
The motivation for sharing this anecdote is to highlight that unknown features without matches in metabolomic databases are not always biologically interesting, even when they show a statistically significant fold-change between sample groups and have seemingly interpretable MS/MS patterns and isotope tracing results. We tend to see only the success stories in research publications.30, 31 Here we show the other side of the coin, where resources are exhausted without reaching a satisfying conclusion. This example, and many others, have taught us to think carefully about the complexity of LC/MS-based metabolomic data. We urge investigators to consider the roadmap of signal classifications below before choosing to invest time in characterizing an unknown feature as a potentially novel compound.
Understanding the challenges of compound identification
Determining the structural identity of features is usually thought of as the bottleneck of the conventional untargeted metabolomic workflow.32–34 For convenience, we will therefore consider steps upstream of feature identification together. These include the following experimental steps, for which thousands of protocols have been published: sample collection, metabolite extraction, chromatographic separation, and mass spectrometry analysis.35–46 Additionally, prior to identification, the features must be detected from the raw data. Feature detection and related informatic functions can be accomplished with any number of well-established software programs.47–51 Graphical user interfaces have been developed for some platforms to facilitate use by investigators with limited expertise in computer programming.52
Given the wealth of protocols available and the simplicity of applying automated software solutions, most researchers can readily go from a biological sample to a list of features.53 Translating feature tables into metabolite names, however, is an arduous process. Without metabolite names, the data provide minimal biochemical insight. Thus, identifying metabolites is generally recognized as a barrier limiting progress in the field. The major challenge is that searching a feature’s accurate mass and experimental MS/MS data against reference libraries frequently does not return a match. Although the number of reference MS/MS spectra curated in house may be small, the amount of reference MS/MS data that are freely or commercially available in metabolomic databases has grown considerably in recent years.15, 54, 55 Experimental MS/MS data are now available for over a half of a million authentic compounds (e.g., standards purchased from companies such as MilliporeSigma).56 We estimate that this is nearly one hundred times more reference MS/MS data than were available a decade ago. The subset of model compounds with MSn spectra, chromatographic retention time, and collisional cross section data from ion-mobility analyses is also expanding.57–60 Remarkably, despite these impressive efforts, data from thousands of features in a standard untargeted metabolomic analysis often still do not match any of the available reference data from authentic compounds.
With the amount of reference data available, it is interesting to consider why the identification rate of features in untargeted metabolomic data (i.e., the number of features structurally characterized relative to the total) continues to be relatively low, even for well-studied samples such as human plasma and E. coli. One possibility is that a large number of features being detected correspond to small molecules that have yet to be included in metabolomic databases and libraries.61 Alternatively, many of the features searched may fail to return matches because they are not metabolites (e.g., artifacts and contaminants) or because they represent metabolites that have been modified in the source of the mass spectrometer (e.g., oligomers, adducts, fragments, etc.).23
The relative frequency of novel compounds, artifacts, contaminants, and redundant signals within an experiment is context dependent. Plants and fungi, for example, are likely to have more novel compounds compared to E. coli.22 Impure solvents and dirty containers, on the other hand, will increase the number of contaminants observed in an experiment. One contaminant can appear in a dataset as many features because of fragments, adducts, heteromers, etc. Similarly, the application of poor data processing methods can create a large number of informatic artifacts. Thus, although the barrier in untargeted metabolomics is often considered to be the informatic challenge of translating features into metabolite names, it is important to recognize that the difficulty of this identification process is highly dependent upon steps upstream in the workflow (Figure 2). Generating a features table may be perceived to be the “easy” part of metabolomics, but the methods applied to perform these routine steps determine the complexity of data interpretation (Figure 3).
Figure 2:

General workflow for performing untargeted metabolomics with LC/MS. The green light indicates steps that are automated and straightforward to perform. The red light indicates steps that are slow and challenging.
Figure 3:
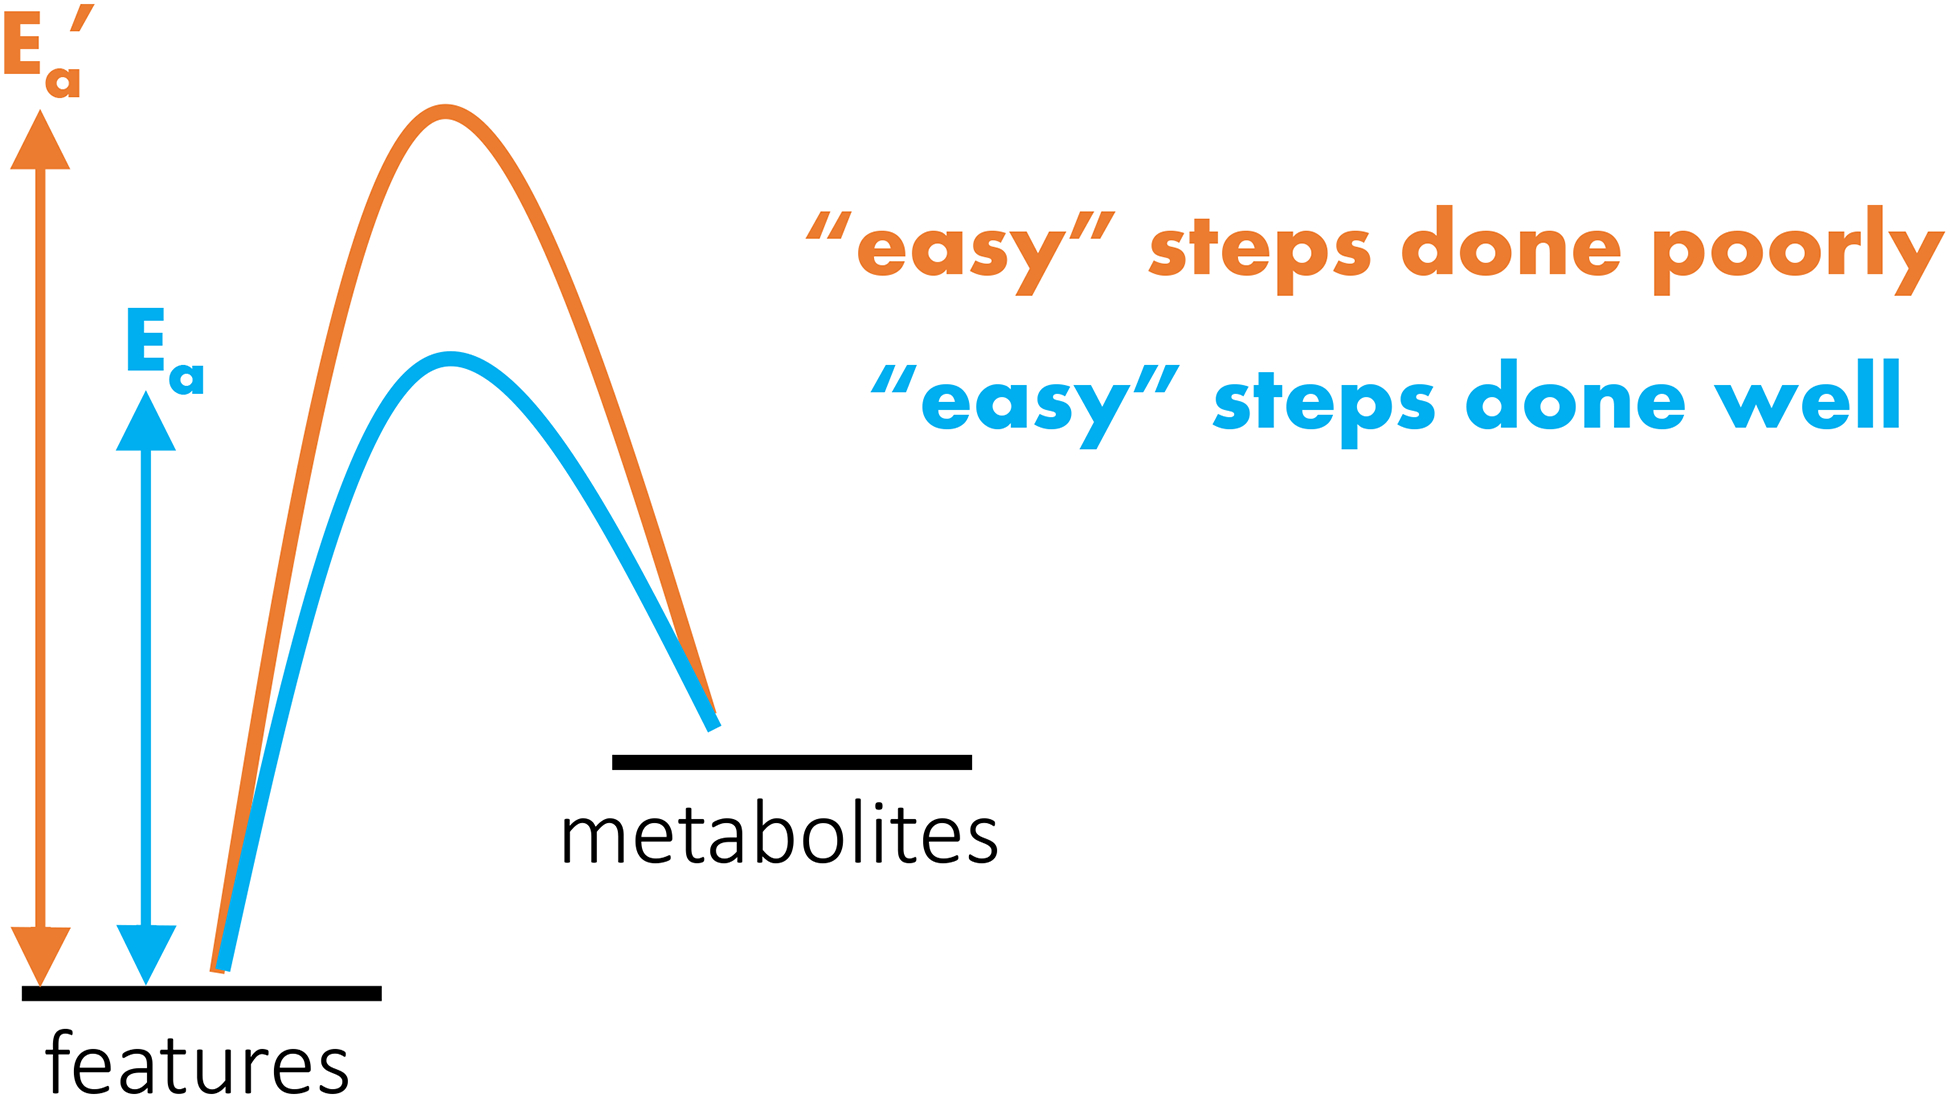
Free-energy analogy for translating features into metabolite identifications. The process is not automated and therefore never spontaneous. When the steps that are colored green in Figure 2 are done rigorously, however, then structurally identifying features requires less “activation energy (Ea)”. This is because the frequency of artifacts, contaminants, and redundant features is decreased.
A map of data complexity in metabolomics
Thus far, we have discussed various types of features that commonly occur when untargeted metabolomics is performed with LC/MS. The goal of this section is to define each and describe their relationship to one another (Figure 4). First, we categorize features as being either biological or non-biological. To distinguish between the two, we consider human plasma as an example. Human plasma contains endogenous small molecules as well as exogenous small molecules (e.g., drugs, exposure chemicals, etc.). These endogenous and exogenous small molecules originate from the sample and therefore we consider any feature that is derived from them to be biological. We note that, by this definition, not all biological features represent compounds that were produced in the sample by enzymes.
Figure 4:
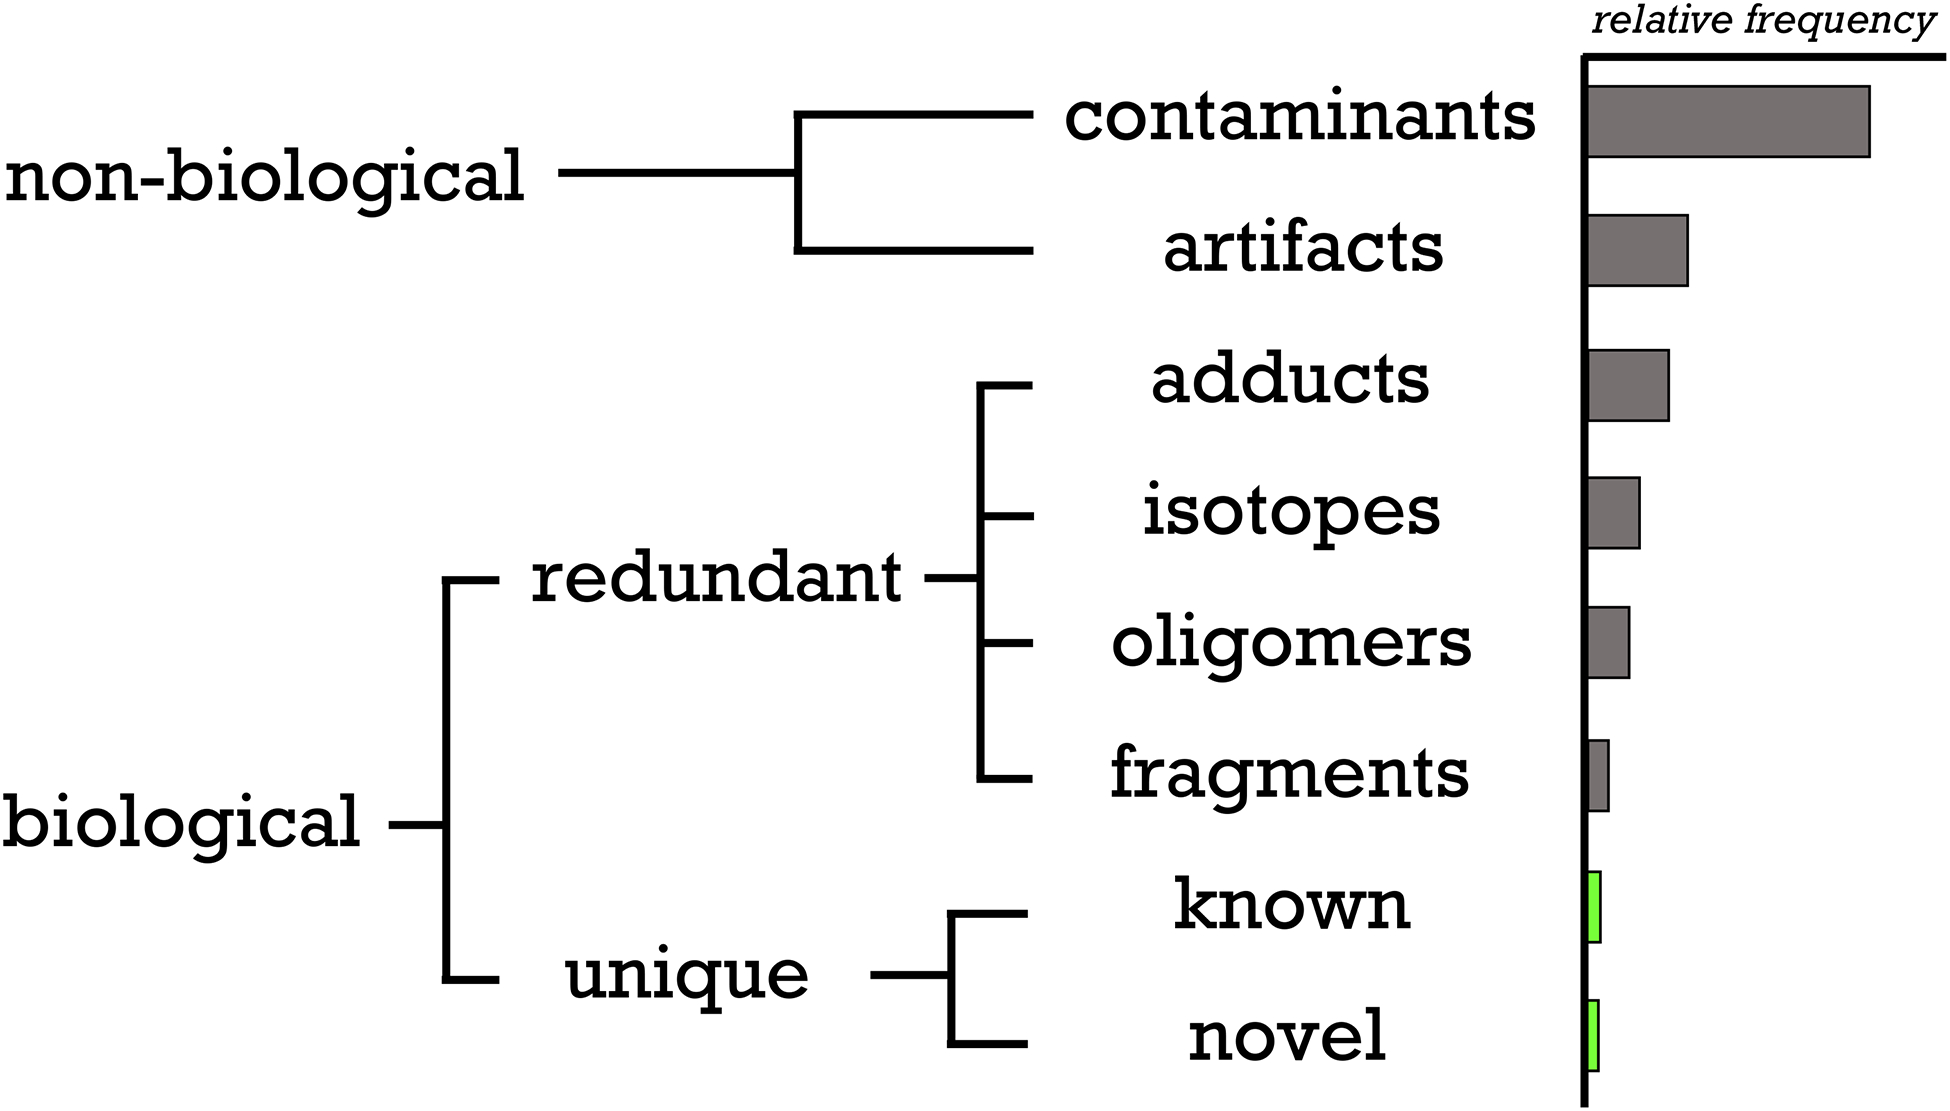
Roadmap of the composition of an untargeted metabolomic dataset. The relative frequency of each type of feature from a representative experiment in our laboratory is shown by the histogram on the right. Redundancies due to multiple-charge states are omitted because of their infrequency. We note that the specific number of features in any one category may vary with experimental method, processing software, sample type, etc.
In contrast, non-biological features do not originate from the sample being measured. There are two major sources of non-biological features: artifacts and contaminants. Although the terms artifacts and contaminants have sometimes been used interchangeably to describe features in LC/MS data, we prefer to adopt the definitions that have been established in the field of NMR.62, 63 Artifacts are man-made signals and do not arise from actual molecules. A common source of artifacts is distorted chromatographic baselines, which may be improperly recognized as a feature during peak detection. Another cause of artifacts is electronic noise from the mass spectrometer.
Unlike artifacts, contaminants do represent real chemicals. Features that arise from contamination are not biologically relevant because the compounds were not originally present in the sample prior to its preparation for metabolomic analysis. Frequent contaminants include solvent impurities, chemical additives used in sample containers, and carry over from a previous experiment. We point out that it can be experimentally challenging to differentiate contaminant features from biological features because they can correspond to the same compound. Palmitate, for instance, is an endogenous metabolite that is synthesized in the cytosol of mammalian cells. It is also used commercially as a slip agent when making plastic containers.64 Features derived from palmitate can therefore be biological and/or non-biological. One strategy to assess the potential conflation of biological and non-biological signals is to analyze a blank, which helps identify background interferences that can then be experimentally or computationally removed.
Given that contaminants are true chemicals, they almost always show up as multiple features in a metabolomic dataset. Here we lump all of these features together as not being biologically meaningful. The structures of each could be individually characterized but, in our laboratory, we usually stop with the annotation of non-biological.
Small molecules originating from a biological sample also typically produce more than one feature.65, 66 We divide these biological features into those that represent unique compounds and those that are redundant. There are multiple causes of redundancy, also called peak degeneracy, which we split into five categories here on the basis of the methods we use to annotate them. (i) Isotopes: the most prevalent naturally occurring isotope in metabolomic data is 13C. When a 13C is substituted for a 12C in a metabolite, the resulting mass shift creates a unique feature. The extent to which 13C and other naturally occurring isotopes contribute to feature degeneracy depends upon the sensitivity and resolving power of the mass spectrometer being used for metabolomic analysis. Compared to the other sources of peak degeneracy elaborated below, naturally occurring isotopes are well defined and can be calculated from chemical formulae. (ii) Fragments: in most LC/MS-based workflows, feature detection is performed on data collected from instruments in MS1 mode where no fragmentation is intended.67 Ideally, all features would therefore correspond to intact metabolites, but some compounds inevitably undergo fragmentation in the instrument at a frequency that is dependent upon the instrument’s settings. Unintentional fragmentation (e.g., in-source fragmentation) contributes to degeneracy because a single compound breaks into two or more pieces, each of which can produce a unique feature. (iii) Adducts: a metabolite undergoes adduction when it interacts with another chemical species in the source of the mass spectrometer to form an ion containing all of the metabolite’s constituent atoms as well as an additional atom or atoms. The chemical species that the metabolite interacts with could be a halogen, ammonium, another metabolite, or even a contaminant. For an adduct to form, all chemical participants must be simultaneously present in the source of the mass spectrometer. Species like halogens and ammonium form adducts with a lot of different metabolites because they originate from solvents, glassware, etc. and are therefore persistent throughout the entire chromatographic run. One common example is sodium adducts, which are characterized by two mass spectral peaks (an [M+H]+ and an [M+Na]+) that are 21.9819 m/z apart. Software programs such as mz.unity take advantage of the frequency that adducts form by looking for recurring mass differences between pairs of mass spectral peaks throughout an experiment.68, 69 In contrast, it is rare for a single metabolite to form adducts with a large number of other metabolites. This is because metabolites can only adduct with other metabolites that co-elute, as observed for the glutamate- NAD+ adduct shown in Figure 1. Consequently, annotating metabolite-metabolite adducts necessitates the application of unique informatic methods. For convenience, we refer to this sub-class of adducts as its own fourth category of redundant signals. (iv) Oligomers: the sub-class of adducts containing two or more metabolites. The oligomers can be homo or hetero in composition, and can also be complicated by the contribution of contaminants with defined chromatographic peak shapes. (v) Multiply charged compounds: although relatively infrequent, one metabolite may form multiple ions with different charge states.70 As an example, a compound can occur as [M-H]1- and [M-2H]2- ions in the same experiment. Charge states can usually be calculated on the basis of the isotopic distribution of the elements in the compound. Taken together, these five categories of redundancy can cause a single metabolite to be represented as more than 100 different features in LC/MS-based metabolomics.68
Each group of degenerate biological features represents a unique compound originating from the sample. The feature in the group corresponding to the protonated or deprotonated compound is likely to be the most informative for structural identification because of the availability of reference data on [M+H]+ and [M-H]− ions relative to others.71 In our experiences with well-studied patient and model-organism samples, a major fraction of the “unknowns” that do not match reference data end up representing non-biological or redundant features. Notably, however, there are a small number of features for which that is not the case.23 Given that these unknowns have been rigorously vetted, it is reasonable to assert that they represent true novel compounds. Notwithstanding, we still provide a couple of caveats. First, our experimental and computational approaches to identify unique biological compounds are evolving. As our methods for annotating data complexity continue to improve, it is likely that some “novel compounds” will prove to be false positives. Second, we must bear in mind that not having reference data for a particular compound may make the metabolite “novel” to the metabolomics community but it could still be a well-studied chemical in other fields.
Show me your credentials
Assigning features from untargeted metabolomic data to the categories listed in Figure 4 has been a longstanding effort in the field.65, 72 The process is challenging and, at this time, not readily automated. A complication is that, for obvious practical reasons, we seek to categorize features without first identifying their structures. To that end, a number of innovative approaches have been developed that rely on one or more of the following: chromatographic peak shape, accurate mass, peak intensity across samples, MS/MS spectra, and isotopic labeling patterns.24, 68, 69, 73–79 Historically, some feature annotations (e.g., naturally occurring isotopes) have been easier to make than others (e.g., metabolite-metabolite heteromers). A detailed description of available annotation methods is beyond the scope of this Perspective, but we direct readers to a recent review by Stanstrup et al. describing many of the associated software packages.80 For convenience, we call features that correspond to biological molecules “credentialed”.
Recently, we sought to perform a rigorous assessment of the number of actual compounds being measured in a representative untargeted metabolomic analysis of E. coli.23 To facilitate credentialing of features, we cultured E. coli in either unlabeled or uniformly 13C-labeled media. After extracting the metabolites, we mix the samples in a defined ratio and perform LC/MS analysis.25 The procedure introduces an isotopic signature into biological features, but not features corresponding to contaminants and artifacts (Figure 5). We were surprised to find that only a small fraction of the total ~25,000 features in the dataset had appropriate isotopic signatures. After removing degeneracy from these biological features, we initially estimated that we were measuring fewer than 900 unique compounds.23 Upon applying some improved strategies to find degenerate features, the number of unique compounds was further reduced to half of that. Additional investigations using different experimental methods and sample types, from our laboratory and others, have produced a comparably small number of credentialed compounds in orthogonal untargeted metabolomic experiments.81
Figure 5:
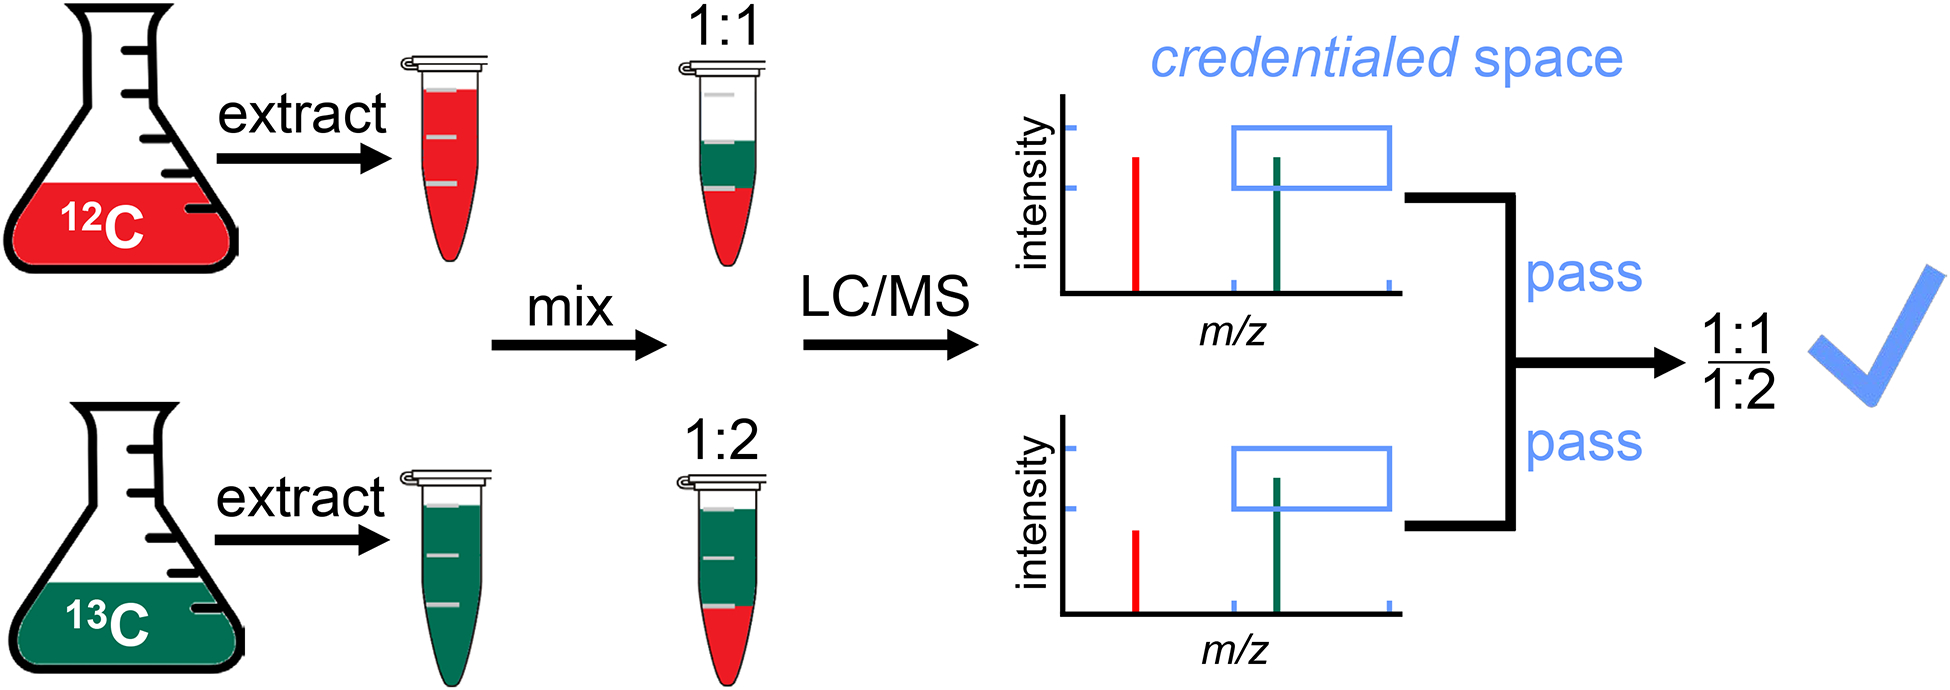
Schematic of an isotope-based credentialing approach. Labeled and unlabeled samples are mixed at either a 1:1 ratio (top) or a 1:2 ratio (bottom). 12C signals are only credentialed if they have a partner peak whose apex is in the blue box in both cases. The x-dimension of the blue box represents m/z and is set based on carbon number. The y-dimension of the blue box represents intensity and is set based on the ratio used for mixing.
It is important not to equate the number of unique compounds being detected in one LC/MS-based metabolomic experiment to the total size of the cellular metabolome, or the total size of the small-molecule exposome.12 Even though untargeted metabolomics is often said to be global and comprehensive, it has long been recognized that metabolite coverage is highly dependent upon experimental conditions.36, 82 Data from credentialing experiments do not indicate that the metabolome is smaller than anticipated, but rather indicate limitations in the experimental coverage of existing LC/MS protocols.38 Indeed, among the hundreds of unique compounds that we have credentialed, there are some that likely represent novel compounds. We also want to point out that while we have focused on the protonated and deprotonated feature of unique biological compounds, we are not suggesting that all of the remaining features be discarded. To the contrary, these features can provide valuable insights. Some examples include leveraging knowledge of informatic artifacts to improve software performance, identifying potentially contaminated laboratory equipment, selecting vials and solvents that lead to the fewest number of non-biological interferences, and using in-source fragments to facilitate identification of metabolites.78, 83–88
Concluding remarks
We have been evaluating the same set of E. coli samples by LC/MS-based metabolomics for nearly a decade. Remarkably, despite impressive increases in the availability of reference data and informatic tools, the percentage of features that we have structurally identified is not strikingly different now relative to when we started. What is different, however, is our perception of why the identification rate is low. While we still believe that there are novel compounds to characterize in our E. coli datasets, the potential we see for chemical discovery has decreased as our understanding of the complexity of metabolomic data has increased.
In our experiences, there are one to two orders of magnitude more metabolomic features than there are unique compounds in a sample.23 We have found that it is challenging for us to structurally identify many of these features by matching them to reference data in metabolomic libraries because they do not correspond to unique metabolites. Instead, they represent artifacts, contaminants, and degeneracy, with the latter sometimes causing a single metabolite to appear as more than 100 different features in the data. The frequency of non-biological and redundant features are heavily influenced by experimental methods and data-processing strategies. Thus, although feature identification is often recognized as the rate-limiting step of metabolomics, its difficulty is at least partly determined by steps upstream of data interpretation, which are dangerously easy to perform with suboptimal procedures.
The perspective that we have provided here has been shaped by our experiences with relatively well-studied samples (e.g., E. coli, mammalian cells, mice, patients, etc.) and commonly applied metabolomic methods. We acknowledge that other sample types and methods could lead to results that are different from those we have discussed. Nonetheless, structurally identifying a novel compound requires considerable time and resources. We urge researchers to be judicious in which features they chose to pursue. We have learned the hard way that just because a feature is statistically elevated in a sample group, produces familiar MS/MS spectra, and has a seemingly interpretable isotope tracing result does not mean that it is necessarily biologically interesting.
Acknowledgements
G.J.P. received financial support for this work from the National Institutes of Health grants R35ES028365, U01CA235482, and R24OD024624.
References
- 1.Hasin Y, Seldin M, and Lusis A (2017) Multi-omics approaches to disease, Genome Biol 18, 83. [DOI] [PMC free article] [PubMed] [Google Scholar]
- 2.Fernie AR, Trethewey RN, Krotzky AJ, and Willmitzer L (2004) Metabolite profiling: from diagnostics to systems biology, Nature Reviews Molecular Cell Biology 5, 763–769. [DOI] [PubMed] [Google Scholar]
- 3.Cravatt BF, and Sorensen EJ (2000) Chemical strategies for the global analysis of protein function, Curr Opin Chem Biol 4, 663–668. [DOI] [PubMed] [Google Scholar]
- 4.DeBerardinis RJ, and Thompson CB (2012) Cellular metabolism and disease: what do metabolic outliers teach us?, Cell 148, 1132–1144. [DOI] [PMC free article] [PubMed] [Google Scholar]
- 5.Wishart DS (2016) Emerging applications of metabolomics in drug discovery and precision medicine, Nature Reviews Drug Discovery 15, 473–484. [DOI] [PubMed] [Google Scholar]
- 6.Hollywood KA, Schmidt K, Takano E, and Breitling R (2018) Metabolomics tools for the synthetic biology of natural products, Curr Opin Biotechnol 54, 114–120. [DOI] [PubMed] [Google Scholar]
- 7.Sumner LW, Lei Z, Nikolau BJ, and Saito K (2015) Modern plant metabolomics: advanced natural product gene discoveries, improved technologies, and future prospects, Nat Prod Rep 32, 212–229. [DOI] [PubMed] [Google Scholar]
- 8.Fernie AR, and Schauer N (2009) Metabolomics-assisted breeding: a viable option for crop improvement?, Trends Genet 25, 39–48. [DOI] [PubMed] [Google Scholar]
- 9.Martien JI, and Amador-Noguez D (2017) Recent applications of metabolomics to advance microbial biofuel production, Curr Opin Biotechnol 43, 118–126. [DOI] [PubMed] [Google Scholar]
- 10.Oliver SG, Winson MK, Kell DB, and Baganz F (1998) Systematic functional analysis of the yeast genome, Trends in Biotechnology 16, 373–378. [DOI] [PubMed] [Google Scholar]
- 11.Wild CP (2012) The exposome: from concept to utility, International Journal of Epidemiology 41, 24–32. [DOI] [PubMed] [Google Scholar]
- 12.Dennis KK, Marder E, Balshaw DM, Cui Y, Lynes MA, Patti GJ, Rappaport SM, Shaughnessy DT, Vrijheid M, and Barr DB (2017) Biomonitoring in the Era of the Exposome, Environ Health Perspect 125, 502–510. [DOI] [PMC free article] [PubMed] [Google Scholar]
- 13.Winder CL, Dunn WB, Schuler S, Broadhurst D, Jarvis R, Stephens GM, and Goodacre R (2008) Global metabolic profiling of Escherichia coli cultures: an evaluation of methods for quenching and extraction of intracellular metabolites, Anal Chem 80, 2939–2948. [DOI] [PubMed] [Google Scholar]
- 14.Naser FJ, Mahieu NG, Wang L, Spalding JL, Johnson SL, and Patti GJ (2018) Two complementary reversed-phase separations for comprehensive coverage of the semipolar and nonpolar metabolome, Anal Bioanal Chem 410, 1287–1297. [DOI] [PMC free article] [PubMed] [Google Scholar]
- 15.Tautenhahn R, Cho K, Uritboonthai W, Zhu Z, Patti GJ, and Siuzdak G (2012) An accelerated workflow for untargeted metabolomics using the METLIN database, Nat Biotechnol 30, 826–828. [DOI] [PMC free article] [PubMed] [Google Scholar]
- 16.(2008) Dark matter, Nature 455, 698. [DOI] [PubMed] [Google Scholar]
- 17.Fiehn O, Barupal DK, and Kind T (2011) Extending biochemical databases by metabolomic surveys, J Biol Chem 286, 23637–23643. [DOI] [PMC free article] [PubMed] [Google Scholar]
- 18.Schwab W (2003) Metabolome diversity: too few genes, too many metabolites?, Phytochemistry 62, 837–849. [DOI] [PubMed] [Google Scholar]
- 19.Patti GJ, Yanes O, and Siuzdak G (2012) Innovation: Metabolomics: the apogee of the omics trilogy, Nat Rev Mol Cell Biol 13, 263–269. [DOI] [PMC free article] [PubMed] [Google Scholar]
- 20.Prosser GA, Larrouy-Maumus G, and de Carvalho LPS (2014) Metabolomic strategies for the identification of new enzyme functions and metabolic pathways, EMBO Rep 15, 657–669. [DOI] [PMC free article] [PubMed] [Google Scholar]
- 21.Eliot TS (1942) Little Gidding, Faber and Faber, London. [Google Scholar]
- 22.Wishart DS (2009) Computational strategies for metabolite identification in metabolomics, Bioanalysis 1, 1579–1596. [DOI] [PubMed] [Google Scholar]
- 23.Mahieu NG, and Patti GJ (2017) Systems-Level Annotation of a Metabolomics Data Set Reduces 25000 Features to Fewer than 1000 Unique Metabolites, Anal Chem 89, 10397–10406. [DOI] [PMC free article] [PubMed] [Google Scholar]
- 24.Kuhl C, Tautenhahn R, Bottcher C, Larson TR, and Neumann S (2012) CAMERA: an integrated strategy for compound spectra extraction and annotation of liquid chromatography/mass spectrometry data sets, Anal Chem 84, 283–289. [DOI] [PMC free article] [PubMed] [Google Scholar]
- 25.Mahieu NG, Huang X, Chen YJ, and Patti GJ (2014) Credentialing features: a platform to benchmark and optimize untargeted metabolomic methods, Anal Chem 86, 9583–9589. [DOI] [PMC free article] [PubMed] [Google Scholar]
- 26.Niehaus TD, Richardson LG, Gidda SK, ElBadawi-Sidhu M, Meissen JK, Mullen RT, Fiehn O, and Hanson AD (2014) Plants utilize a highly conserved system for repair of NADH and NADPH hydrates, Plant Physiol 165, 52–61. [DOI] [PMC free article] [PubMed] [Google Scholar]
- 27.Golubev AG (1996) [The other side of metabolism], Biokhimiia 61, 2018–2039. [PubMed] [Google Scholar]
- 28.Tawfik DS (2010) Messy biology and the origins of evolutionary innovations, Nat Chem Biol 6, 692–696. [DOI] [PubMed] [Google Scholar]
- 29.Showalter MR, Cajka T, and Fiehn O (2017) Epimetabolites: discovering metabolism beyond building and burning, Curr Opin Chem Biol 36, 70–76. [DOI] [PMC free article] [PubMed] [Google Scholar]
- 30.Artyukhin AB, Yim JJ, Srinivasan J, Izrayelit Y, Bose N, von Reuss SH, Jo Y, Jordan JM, Baugh LR, Cheong M, Sternberg PW, Avery L, and Schroeder FC (2013) Succinylated octopamine ascarosides and a new pathway of biogenic amine metabolism in Caenorhabditis elegans, The Journal of biological chemistry 288, 18778–18783. [DOI] [PMC free article] [PubMed] [Google Scholar]
- 31.Kalisiak J, Trauger SA, Kalisiak E, Morita H, Fokin VV, Adams MWW, Sharpless KB, and Siuzdak G (2009) Identification of a new endogenous metabolite and the characterization of its protein interactions through an immobilization approach, J Am Chem Soc 131, 378–386. [DOI] [PMC free article] [PubMed] [Google Scholar]
- 32.Chaleckis R, Meister I, Zhang P, and Wheelock CE (2019) Challenges, progress and promises of metabolite annotation for LC-MS-based metabolomics, Curr Opin Biotechnol 55, 44–50. [DOI] [PubMed] [Google Scholar]
- 33.Blazenovic I, Kind T, Ji J, and Fiehn O (2018) Software Tools and Approaches for Compound Identification of LC-MS/MS Data in Metabolomics, Metabolites 8. [DOI] [PMC free article] [PubMed] [Google Scholar]
- 34.Bingol K, and Brüschweiler R (2017) Knowns and unknowns in metabolomics identified by multidimensional NMR and hybrid MS/NMR methods, Current opinion in biotechnology 43, 17–24. [DOI] [PMC free article] [PubMed] [Google Scholar]
- 35.Geier FM, Want EJ, Leroi AM, and Bundy JG (2011) Cross-platform comparison of Caenorhabditis elegans tissue extraction strategies for comprehensive metabolome coverage, Anal Chem 83, 3730–3736. [DOI] [PubMed] [Google Scholar]
- 36.Masson P, Alves AC, Ebbels TM, Nicholson JK, and Want EJ (2010) Optimization and evaluation of metabolite extraction protocols for untargeted metabolic profiling of liver samples by UPLC-MS, Anal Chem 82, 7779–7786. [DOI] [PubMed] [Google Scholar]
- 37.Patti GJ (2011) Separation strategies for untargeted metabolomics, J Sep Sci 34, 3460–3469. [DOI] [PubMed] [Google Scholar]
- 38.Wang L, Naser FJ, Spalding JL, and Patti GJ (2019) A Protocol to Compare Methods for Untargeted Metabolomics, Methods Mol Biol 1862, 1–15. [DOI] [PMC free article] [PubMed] [Google Scholar]
- 39.Dietmair S, Timmins NE, Gray PP, Nielsen LK, and Kromer JO (2010) Towards quantitative metabolomics of mammalian cells: development of a metabolite extraction protocol, Anal Biochem 404, 155–164. [DOI] [PubMed] [Google Scholar]
- 40.Lorenz MA, Burant CF, and Kennedy RT (2011) Reducing time and increasing sensitivity in sample preparation for adherent mammalian cell metabolomics, Anal Chem 83, 3406–3414. [DOI] [PMC free article] [PubMed] [Google Scholar]
- 41.Ivanisevic J, Zhu ZJ, Plate L, Tautenhahn R, Chen S, O’Brien PJ, Johnson CH, Marletta MA, Patti GJ, and Siuzdak G (2013) Toward ‘omic scale metabolite profiling: a dual separation-mass spectrometry approach for coverage of lipid and central carbon metabolism, Anal Chem 85, 6876–6884. [DOI] [PMC free article] [PubMed] [Google Scholar]
- 42.Bajad SU, Lu W, Kimball EH, Yuan J, Peterson C, and Rabinowitz JD (2006) Separation and quantitation of water soluble cellular metabolites by hydrophilic interaction chromatography-tandem mass spectrometry, J Chromatogr A 1125, 76–88. [DOI] [PubMed] [Google Scholar]
- 43.Lindahl A, Saaf S, Lehtio J, and Nordstrom A (2017) Tuning Metabolome Coverage in Reversed Phase LC-MS Metabolomics of MeOH Extracted Samples Using the Reconstitution Solvent Composition, Anal Chem 89, 7356–7364. [DOI] [PubMed] [Google Scholar]
- 44.Gross RW (2017) The evolution of lipidomics through space and time, Biochim Biophys Acta Mol Cell Biol Lipids 1862, 731–739. [DOI] [PMC free article] [PubMed] [Google Scholar]
- 45.Stevens VL, Hoover E, Wang Y, and Zanetti KA (2019) Pre-Analytical Factors that Affect Metabolite Stability in Human Urine, Plasma, and Serum: A Review, Metabolites 9, 156. [DOI] [PMC free article] [PubMed] [Google Scholar]
- 46.Want EJ, Wilson ID, Gika H, Theodoridis G, Plumb RS, Shockcor J, Holmes E, and Nicholson JK (2010) Global metabolic profiling procedures for urine using UPLC-MS, Nature Protocols 5, 1005–1018. [DOI] [PubMed] [Google Scholar]
- 47.Mahieu NG, Genenbacher JL, and Patti GJ (2016) A roadmap for the XCMS family of software solutions in metabolomics, Curr Opin Chem Biol 30, 87–93. [DOI] [PMC free article] [PubMed] [Google Scholar]
- 48.Pluskal T, Castillo S, Villar-Briones A, and Oresic M (2010) MZmine 2: modular framework for processing, visualizing, and analyzing mass spectrometry-based molecular profile data, BMC Bioinformatics 11, 395. [DOI] [PMC free article] [PubMed] [Google Scholar]
- 49.Tsugawa H, Cajka T, Kind T, Ma Y, Higgins B, Ikeda K, Kanazawa M, VanderGheynst J, Fiehn O, and Arita M (2015) MS-DIAL: data-independent MS/MS deconvolution for comprehensive metabolome analysis, Nat Methods 12, 523–526. [DOI] [PMC free article] [PubMed] [Google Scholar]
- 50.Lommen A, and Kools HJ (2012) MetAlign 3.0: performance enhancement by efficient use of advances in computer hardware, Metabolomics 8, 719–726. [DOI] [PMC free article] [PubMed] [Google Scholar]
- 51.Chong J, Soufan O, Li C, Caraus I, Li S, Bourque G, Wishart DS, and Xia J (2018) MetaboAnalyst 4.0: towards more transparent and integrative metabolomics analysis, Nucleic Acids Res 46, W486–W494. [DOI] [PMC free article] [PubMed] [Google Scholar]
- 52.Spicer R, Salek RM, Moreno P, Canueto D, and Steinbeck C (2017) Navigating freely-available software tools for metabolomics analysis, Metabolomics 13, 106. [DOI] [PMC free article] [PubMed] [Google Scholar]
- 53.Cho K, Mahieu NG, Johnson SL, and Patti GJ (2014) After the feature presentation: technologies bridging untargeted metabolomics and biology, Curr Opin Biotechnol 28, 143–148. [DOI] [PMC free article] [PubMed] [Google Scholar]
- 54.Kind T, Liu KH, Lee DY, DeFelice B, Meissen JK, and Fiehn O (2013) LipidBlast in silico tandem mass spectrometry database for lipid identification, Nat Methods 10, 755–758. [DOI] [PMC free article] [PubMed] [Google Scholar]
- 55.Wishart DS, Feunang YD, Marcu A, Guo AC, Liang K, Vazquez-Fresno R, Sajed T, Johnson D, Li C, Karu N, Sayeeda Z, Lo E, Assempour N, Berjanskii M, Singhal S, Arndt D, Liang Y, Badran H, Grant J, Serra-Cayuela A, Liu Y, Mandal R, Neveu V, Pon A, Knox C, Wilson M, Manach C, and Scalbert A (2018) HMDB 4.0: the human metabolome database for 2018, Nucleic Acids Res 46, D608–D617. [DOI] [PMC free article] [PubMed] [Google Scholar]
- 56.Siuzdak G (2019) METLIN at Half a Million Standards with Experimental ESI-MS/MS Data, In MetaboNews (Forsythe IJ, Ed.), pp 4–6. [Google Scholar]
- 57.Leaptrot KL, May JC, Dodds JN, and McLean JA (2019) Ion mobility conformational lipid atlas for high confidence lipidomics, Nat Commun 10, 985. [DOI] [PMC free article] [PubMed] [Google Scholar]
- 58.Zheng X, Aly NA, Zhou Y, Dupuis KT, Bilbao A, Paurus VL, Orton DJ, Wilson R, Payne SH, Smith RD, and Baker ES (2017) A structural examination and collision cross section database for over 500 metabolites and xenobiotics using drift tube ion mobility spectrometry, Chem Sci 8, 7724–7736. [DOI] [PMC free article] [PubMed] [Google Scholar]
- 59.Codesido S, Randazzo GM, Lehmann F, Gonzalez-Ruiz V, Garcia A, Xenarios I, Liechti R, Bridge A, Boccard J, and Rudaz S (2019) DynaStI: A Dynamic Retention Time Database for Steroidomics, Metabolites 9. [DOI] [PMC free article] [PubMed] [Google Scholar]
- 60.Yang X, Neta P, and Stein SE (2017) Extending a Tandem Mass Spectral Library to Include MS(2) Spectra of Fragment Ions Produced In-Source and MS(n) Spectra, J Am Soc Mass Spectrom 28, 2280–2287. [DOI] [PubMed] [Google Scholar]
- 61.Cooper BT, Yan X, Simon-Manso Y, Tchekhovskoi DV, Mirokhin YA, and Stein SE (2019) Hybrid Search: A Method for Identifying Metabolites Absent from Tandem Mass Spectrometry Libraries, Anal Chem. [DOI] [PMC free article] [PubMed] [Google Scholar]
- 62.Stejskal EO, and Schaefer J (1975) Removal of artifacts from cross-polarization NMR experiments, Journal of Magnetic Resonance (1969) 18, 560–563. [Google Scholar]
- 63.Schaefer J, and Stejskal EO (1974) Baseline artifacts in high-resolution fourier transform NMR spectra, Journal of Magnetic Resonance (1969) 15, 173–176. [Google Scholar]
- 64.Yao CH, Liu GY, Yang K, Gross RW, and Patti GJ (2016) Inaccurate quantitation of palmitate in metabolomics and isotope tracer studies due to plastics, Metabolomics 12. [DOI] [PMC free article] [PubMed] [Google Scholar]
- 65.Tautenhahn R, Böttcher C, and Neumann S (2007) Annotation of LC/ESI-MS Mass Signals, pp 371–380, Springer Berlin Heidelberg, Berlin, Heidelberg. [Google Scholar]
- 66.Nash WJ, and Dunn WB (2019) From mass to metabolite in human untargeted metabolomics: Recent advances in annotation of metabolites applying liquid chromatography-mass spectrometry data, TrAC Trends in Analytical Chemistry 120, 115324. [Google Scholar]
- 67.Goudarzi M, Weber WM, Mak TD, Chung J, Doyle-Eisele M, Melo DR, Brenner DJ, Guilmette RA, and Fornace AJ Jr. (2015) Metabolomic and lipidomic analysis of serum from mice exposed to an internal emitter, cesium-137, using a shotgun LC-MS(E) approach, J Proteome Res 14, 374–384. [DOI] [PMC free article] [PubMed] [Google Scholar]
- 68.Mahieu NG, Spalding JL, Gelman SJ, and Patti GJ (2016) Defining and Detecting Complex Peak Relationships in Mass Spectral Data: The Mz.unity Algorithm, Anal Chem 88, 9037–9046. [DOI] [PMC free article] [PubMed] [Google Scholar]
- 69.Brown M, Dunn WB, Dobson P, Patel Y, Winder CL, Francis-McIntyre S, Begley P, Carroll K, Broadhurst D, Tseng A, Swainston N, Spasic I, Goodacre R, and Kell DB (2009) Mass spectrometry tools and metabolite-specific databases for molecular identification in metabolomics, Analyst 134, 1322–1332. [DOI] [PubMed] [Google Scholar]
- 70.Kind T, and Fiehn O (2010) Advances in structure elucidation of small molecules using mass spectrometry, Bioanalytical Reviews 2, 23–60. [DOI] [PMC free article] [PubMed] [Google Scholar]
- 71.Benton HP, Ivanisevic J, Mahieu NG, Kurczy ME, Johnson CH, Franco L, Rinehart D, Valentine E, Gowda H, Ubhi BK, Tautenhahn R, Gieschen A, Fields MW, Patti GJ, and Siuzdak G (2015) Autonomous metabolomics for rapid metabolite identification in global profiling, Anal Chem 87, 884–891. [DOI] [PMC free article] [PubMed] [Google Scholar]
- 72.Brown M, Wedge DC, Goodacre R, Kell DB, Baker PN, Kenny LC, Mamas MA, Neyses L, and Dunn WB (2011) Automated workflows for accurate mass-based putative metabolite identification in LC/MS-derived metabolomic datasets, Bioinformatics (Oxford, England) 27, 1108–1112. [DOI] [PMC free article] [PubMed] [Google Scholar]
- 73.Broeckling CD, Afsar FA, Neumann S, Ben-Hur A, and Prenni JE (2014) RAMClust: a novel feature clustering method enables spectral-matching-based annotation for metabolomics data, Anal Chem 86, 6812–6817. [DOI] [PubMed] [Google Scholar]
- 74.Kachman M, Habra H, Duren W, Wigginton J, Sajjakulnukit P, Michailidis G, Burant C, and Karnovsky A (2019) Deep annotation of untargeted LC-MS metabolomics data with Binner, Bioinformatics. [DOI] [PMC free article] [PubMed] [Google Scholar]
- 75.Alonso A, Julia A, Beltran A, Vinaixa M, Diaz M, Ibanez L, Correig X, and Marsal S (2011) AStream: an R package for annotating LC/MS metabolomic data, Bioinformatics 27, 1339–1340. [DOI] [PubMed] [Google Scholar]
- 76.DeFelice BC, Mehta SS, Samra S, Cajka T, Wancewicz B, Fahrmann JF, and Fiehn O (2017) Mass Spectral Feature List Optimizer (MS-FLO): A Tool To Minimize False Positive Peak Reports in Untargeted Liquid Chromatography-Mass Spectroscopy (LC-MS) Data Processing, Anal Chem 89, 3250–3255. [DOI] [PMC free article] [PubMed] [Google Scholar]
- 77.Uppal K, Walker DI, and Jones DP (2017) xMSannotator: An R Package for Network-Based Annotation of High-Resolution Metabolomics Data, Anal Chem 89, 1063–1067. [DOI] [PMC free article] [PubMed] [Google Scholar]
- 78.Domingo-Almenara X, Montenegro-Burke JR, Guijas C, Majumder EL, Benton HP, and Siuzdak G (2019) Autonomous METLIN-Guided In-source Fragment Annotation for Untargeted Metabolomics, Anal Chem 91, 3246–3253. [DOI] [PMC free article] [PubMed] [Google Scholar]
- 79.Stupp GS, Clendinen CS, Ajredini R, Szewc MA, Garrett T, Menger RF, Yost RA, Beecher C, and Edison AS (2013) Isotopic ratio outlier analysis global metabolomics of Caenorhabditis elegans, Anal Chem 85, 11858–11865. [DOI] [PMC free article] [PubMed] [Google Scholar]
- 80.Stanstrup J, Broeckling CD, Helmus R, Hoffmann N, Mathe E, Naake T, Nicolotti L, Peters K, Rainer J, Salek RM, Schulze T, Schymanski EL, Stravs MA, Thevenot EA, Treutler H, Weber RJM, Willighagen E, Witting M, and Neumann S (2019) The metaRbolomics Toolbox in Bioconductor and beyond, Metabolites 9. [DOI] [PMC free article] [PubMed] [Google Scholar]
- 81.Wang L, Xing X, Chen L, Yang L, Su X, Rabitz H, Lu W, and Rabinowitz JD (2019) Peak Annotation and Verification Engine for Untargeted LC-MS Metabolomics, Anal Chem 91, 1838–1846. [DOI] [PMC free article] [PubMed] [Google Scholar]
- 82.Yanes O, Tautenhahn R, Patti GJ, and Siuzdak G (2011) Expanding coverage of the metabolome for global metabolite profiling, Anal Chem 83, 2152–2161. [DOI] [PMC free article] [PubMed] [Google Scholar]
- 83.Plumb RS, Johnson KA, Rainville P, Smith BW, Wilson ID, Castro-Perez JM, and Nicholson JK (2006) UPLC/MS(E); a new approach for generating molecular fragment information for biomarker structure elucidation, Rapid Commun Mass Spectrom 20, 1989–1994. [DOI] [PubMed] [Google Scholar]
- 84.Seitzer PM, and Searle BC (2019) Incorporating In-Source Fragment Information Improves Metabolite Identification Accuracy in Untargeted LC-MS Data Sets, J Proteome Res 18, 791–796. [DOI] [PubMed] [Google Scholar]
- 85.Godzien J, Armitage EG, Angulo S, Martinez-Alcazar MP, Alonso-Herranz V, Otero A, Lopez-Gonzalvez A, and Barbas C (2015) In-source fragmentation and correlation analysis as tools for metabolite identification exemplified with CE-TOF untargeted metabolomics, Electrophoresis 36, 2188–2195. [DOI] [PubMed] [Google Scholar]
- 86.Xu YF, Lu W, and Rabinowitz JD (2015) Avoiding misannotation of in-source fragmentation products as cellular metabolites in liquid chromatography-mass spectrometry-based metabolomics, Anal Chem 87, 2273–2281. [DOI] [PMC free article] [PubMed] [Google Scholar]
- 87.Mahieu NG, Spalding J, and Patti GJ (2015) Warpgroup: Increased Precision of Metabolomic Data Processing by Consensus Integration Bound Analysis, Bioinformatics 32, 268–275. [DOI] [PMC free article] [PubMed] [Google Scholar]
- 88.Spalding JL, Naser FJ, Mahieu NG, Johnson SL, and Patti GJ (2018) Trace Phosphate Improves ZIC-pHILIC Peak Shape, Sensitivity, and Coverage for Untargeted Metabolomics, J Proteome Res 17, 3537–3546. [DOI] [PMC free article] [PubMed] [Google Scholar]