Abstract
Elucidating the kinetics of DNA passage through a solid-state nanopore is a fertile field of research, and mechanisms for controlling capture, passage, and trapping of biopolymers are likely to find numerous technological applications. Here we present a nanofiltered nanopore device, which forms an entropic cage for DNA following first passage through the nanopore, trapping the translocated DNA and permitting recapture for subsequent reanalysis and investigation of kinetics of passage under confinement. We characterize the trapping properties of this nanodevice by driving individual DNA polymers into the nanoscale gap separating the nanofilter and the pore, forming an entropic cage similar to a “two pores in series” device, leaving polymers to diffuse in the cage for various time lengths, and attempting to recapture the same molecule. We show that the cage results in effectively permanent trapping when the radius of gyration of the target polymer is significantly larger than the radii of the pores in the nanofilter. We also compare translocation dynamics as a function of translocation direction in order to study the effects of confinement on DNA just prior to translocation, providing further insight into the nanopore translocation process. This nanofiltered nanopore device realizes simple fabrication of a femtoliter nanoreactor in which to study fundamental biophysics and biomolecular reactions on the single-molecule level. The device provides an electrically-permeable single-molecule trap with a higher entropic barrier to escape than previous attempts to fabricate similar structures.
Keywords: nanopore, nanotechnology, nanofabrication, DNA, entropy, nanoconfinement, nanoporous membrane
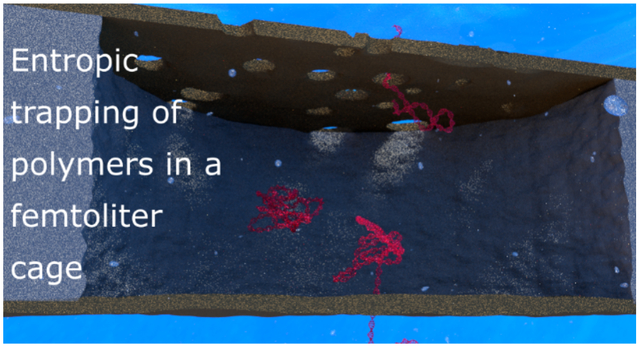
Graphical Abstract
Introduction
Nanopores allow for highly sensitive electrical detection of single biomolecules,1 and many applications have gained attention in recent years. Among them are DNA sequencing;2,3 investigating single biomolecular reactions;4 identifying particular sequences of DNA through the use of barcodes;5 elucidating fundamental physics of polymers and their transport through pores at the single-molecule level,6–9 which is intrinsic to many processes of life.10–13
The study of confinement effects on DNA prior to translocation through a nanoscale pore has been undertaken before, in order to examine the drift-diffusion model under various levels of confinement14,15 compared to free solution;8 the passage time dependence on DNA conformation;7 and the trapping of DNA in entropic cages.16 While a handful of studies have explored single-molecule entropic trapping with nanopores,16 the potential escape routes are generally quite large compared to relevant target polymers for biomedical applications, and, as we will demonstrate, entropy-based traps quickly lose their efficiency as polymer length decreases. The ability to trap relatively short polymers would be very useful. For example, M13 (~7000 bp, radius of gyration 150 nm, contour length 2500 nm) is of great interest as a scaffold for the assembly of DNA origami nanostructures17–19 or as a barcoding nanocarrier for biosensing applications.20–24 In order for the trap to apply a confining effect to the molecule of interest, the largest linear dimension of the escape routes in the trap (the major axis of the pores) must be small compared to the free solution radius of gyration of the polymer. This condition is not possible to realize for short polymers using previously reported trap configurations and fabrication approaches.
In addition to entropic traps, several other polymer trapping methods have been explored. The use of plasmonic nanostructures has been proposed and validated in simulation, in which near-field excitation of a plasmonic structure is used to apply optical forces directly to DNA.25,26 Trapping of long polymers has been demonstrated experimentally using a two-pore system, in which the DNA molecule is caught and stretched between two competing nanopores.27,28 Using nanopores smaller in diameter than DNA has also been shown to enable long passage times and temporary trapping of polymers.29,30 Finally, dielectrophoresis has been used to trap and concentrate DNA prior to interrogation with a nanopore.31
In this work, we propose the use of ultrathin nanoporous silicon nitride7,32 (NPN) membranes as a capping nanofilter layer for a confining well above a nanopore to entropically confine polymers for long times. This allows us to considerably improve on the trapping efficiency, since the reduced size of escape routes in the nanofilter layer provides a higher entropic barrier to escape than previously reported trap architectures.
Briggs et al. previously reported integration of NPN nanofilter membranes upstream of nanopore sensors in order to affect translocation kinetics.7 Here, we present the use of these nanofiltered nanopore devices in reverse configuration as an entropic nanocage.
Experimental
Device Geometry
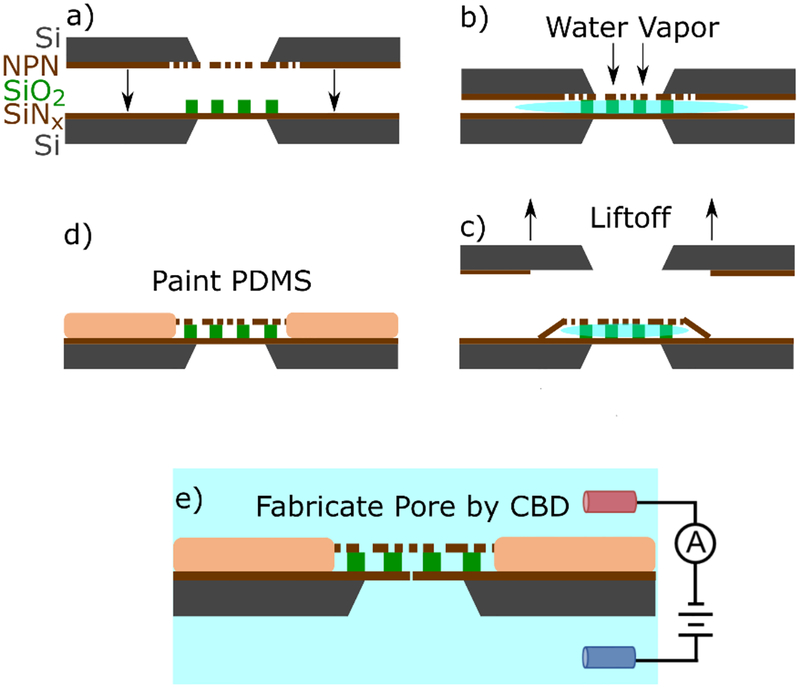
The entropic trapping device employed in this work consists of a SiNx membrane separated from a nanoporous nitride membrane (a nanofilter) by a SiO2 spacer containing a hexagonal grid of microwells with a diameter of approximately 4.5 μm. The assembly and construction of the nanofiltered nanopore device is described in full elsewhere and is schematically illustrated in Figure 1,7 utilizing a water-vapour delamination approach to attach a nanofilter over a substrate patterned with a spacer layer. Devices are either ozone cleaned for 15 min or plasma cleaned at 20 W for 20 s before assembly. The same cleaning procedure is repeated again before painting with PDMS to reduce device capacitance. The cavity between the two membranes is wetted by evacuating the device before immersion in ethanol. After immersion, the vacuum is slowly broken, pulling ethanol into the cavity. The device is immersed in water to replace the ethanol by diffusion, and mounted in a custom 3D-printed flow cell.
Figure 1:
A schematic illustrating of the assembly of the entropic trap. a) two chips containing an intact 20 nm thick SiNx sensing membrane decorated with an 800 nm SiO2 spacer containing a hexagonal grid of 4.5 μm microwells is brought into close proximity with a NPN membrane. b) water vapour floods the cavity and provides a weak adhesion force between the two membranes. c) the NPN support chip is lifted off, leaving behind the NPN layer capping the trapping cavities. d) Polydimethylsiloxane (PDMS) is painted around dual membrane stack, and over some of the interface to reduce device capacitance and permanently bond the two membranes. e) A nanopore is formed in one of the cavities at random using controlled breakdown.
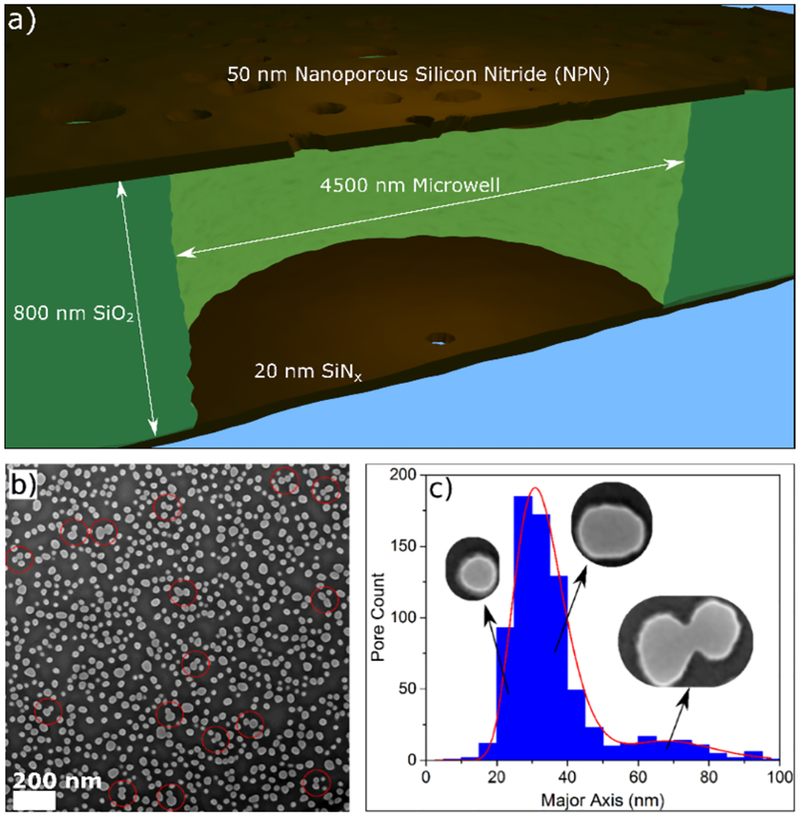
The particular geometry used here consists of an 800 nm separation between a 50 nm-thick nanofilter membrane (i.e. the nanofilter) and a 20 nm-thick silicon nitride (SiNx) membrane (i.e. the membrane which will containing the sensing pore), as depicted in Figure 2a. The two membranes are separated by a SiO2 spacer containing a hexagonal grid of microwells with diameter of 4.5μm, resulting in a 13 fL cavity. A nanopore is randomly fabricated33 in one of the microwells using controlled breakdown (CBD).7,34 We refer to this single pore made by CBD as the sensing pore, since the electrical signal we measure experimentally is sensitive only to this pore. The average porosity of the nanofilter membranes is 19.1%, measured by dividing the total open pore area to the total membrane area, as measured by images such as that shown in Figure 2b. The average effective nanofilter pore diameter ranges from 24 to 31 nm, varying over the area of the nanofilter membrane, with a standard deviation of 9 nm, measured by fitting an ellipse with axis lengths a and b to each identified pore and reporting the effective radius as . The approximate number density pores is 312 pores/μm2, estimated by directly counting pores identified in TEM images. Of particular interest to the performance of these devices as entropic traps for linear polymers is the major axis distribution of pores in the nanofilter, which is plotted in Figure 2c.
Figure 2:
a) Schematic of a cross-section of a single microwell in the device geometry, not to scale. The 50 nm thick NPN nanofilter, containing pores with an average diameter of 31 ± 9 nm, is separated from a 20 nm thick SiNx membrane by an 800 nm SiO2 spacer containing an array of 4500 nm diameter wells, one of which contains the sensing pore. b) SEM image of the nanofilter membrane, showing a random distribution of pores. The scale bar is 200 nm. Note that in several places, indicated with red circles, neighbouring pores overlap, resulting in a single large oblong merged pore. c) Distribution of pore sizes as measured by their major axis (not average diameter, which ins plotted in Supporting Information Section S2). The data is well fit by two log-normal distributions. The corresponding representative pores in the insets are taken from (b).
Due to the manufacturing process, the nanofilter is prone to variability in the pore layouts, which are effectively randomly distributed on the membrane. One of the more striking features in Figure 2b is clustering of pores, which can sometimes result in merged pores. Merged pores are usually much longer in one of their dimensions, forming a quasi-elliptic, rather than circular, cross sections. Further work on the flow through these fringe geometries was performed by Madejski et al.35
It is clear from Figure 2c that the distribution of pore sizes when measured by major axis length is bimodal. The first peak in the distribution corresponds to standard nanopores present on the nanofilter. The second, much smaller peak represents pores that have partially merged together to make a single pore that is much longer in one of its dimensions, which we will demonstrate has important implications for the performance of the entropic trap.
Sensing Pore Fabrication
Nanopores are fabricated using CBD, described in detail in our previous work.30,33,36 Nanopore fabrication is carried out in 2M KCl at pH 8 using a gradual voltage increase up to 15V. Some membranes took several hours longer to fabricate than expected given the membrane properties, most likely due to partial wetting of the cavity between the membranes.7 After the pore is formed, KCl is replaced with 3.6M LiCl37 at pH 8 and the pore is grown to the desired pore size (6–15 nm) by applying 4 s square voltage pulses (4–5 V). Both salt solutions are buffered to pH 8 with 10 mM HEPES. Some pores were left immersed in salt solution to stabilize before DNA experiments, if the IV and noise properties were not optimal immediately following the growing stage.30
Simulation Setup
Simulations of the diffusive mode of operation were conducted to better understand the behaviour of 1.2kbp dsDNA. We used an effective multiscale approach to model the system. For the bulk of the device cavity, the DNA molecules were modelled as particles representing the center of mass (COM). The diffusion of these effective particles was simulated using Brownian dynamics (BD). As the dynamics of the entire chain become important near the nanofilter we conducted separate simulations where we modelled the DNA as a wormlike chain, and used coarse-grained Langevin dynamics (CGLD)38 to simulate its motion. The CGLD simulations were used to estimate the probability that a polymer located close to a filter pore will successfully cross the membrane, rather than diffusing back into the bulk of the device. These success probabilities were used to couple the BD and the CGLD simulations via a special boundary condition for the nanofilter in the BD simulations. Further details for the simulations are presented in Supporting Information Section S1.
Data Acquisition and Analysis
DNA samples (NoLimits individual DNA fragments from Thermo Fisher Scientific) were mixed in 3.6 M LiCl pH 8 to desired DNA concentration (2–5 nM) for translocation experiments. DNA molecules are manipulated using ±200 mV biases.
Custom LabVIEW software, interfaced with a National Instruments DAQ card (USB-6353), is used to acquire data during DNA translocation experiments. This software was further used to automate the recapture experiments. The automation module was designed to change the applied voltage upon detecting a complete translocation event. A positive voltage (200 mV) is applied to capture a DNA molecule, with the sensing pore side of the device grounded. Upon detection of a translocation event the software terminates the applied voltage for the required time delay, and then applies −200 mV to attempt to recapture the DNA molecule, waiting up to 5 minutes before declaring an event to be lost. The feedback loop for voltage changes was closed in software every millisecond, resulting in an effective response time of a few milliseconds. The Axopatch 200B is used to amplify the current signal using a sampling frequency of 500 kHz or 1 MHz and hardware low-pass filtered at 100 kHz.
Analysis and fitting of DNA translocation events through the sensing pore is performed using a custom implementation of the CUSUM algorithm39,40, which is freely available online (https://github.com/shadowk29/CUSUM). Origin is used for nonlinear fitting and data presentation.
Results and Discussion
There are two modes of operation used with this device, diffusive trapping, in which no external force is applied to drive the escape of the polymer out of the cage, and driven trapping, in which the capture voltage is maintained for a given time while many molecules are loaded into the cavity before the field is reversed and recapture is attempted.
Diffusive Trapping
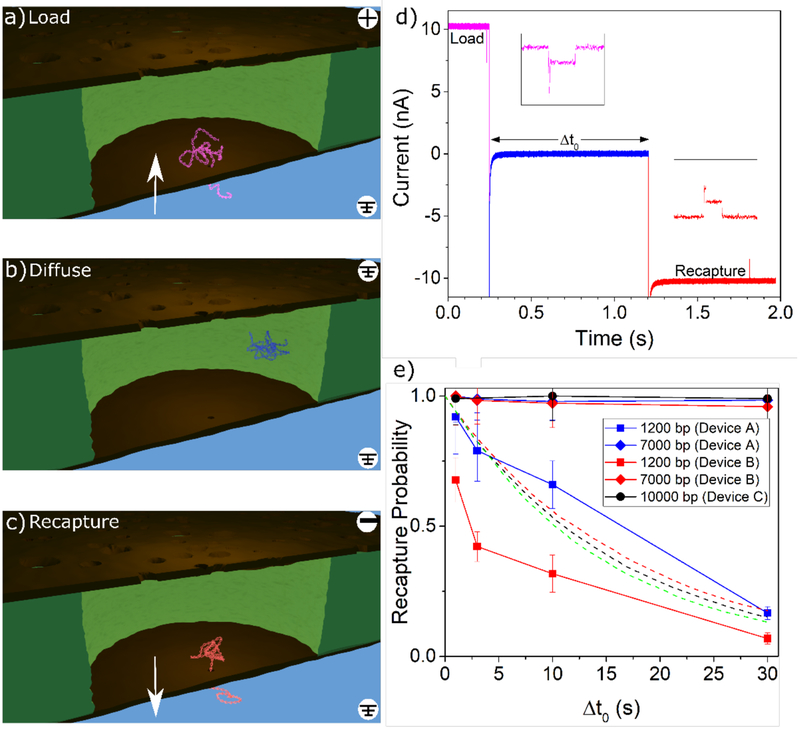
We first present results in the diffusive trapping mode. In order to compare kinetics of DNA passage into and out of the confining space between the membranes, we introduce double-stranded DNA (dsDNA) to the sensing pore side of the device, ranging from 1.2 kbp to 10 kbp in length. In this configuration, a single DNA molecule is captured into the entropic cage through the sensing pore (loading step, Figure 3a), and the voltage bias is immediately (within ~1 ms) turned off and maintained at zero for various delay times Δt0 (diffusion step, Figure 3b). The voltage is then reversed to drive the DNA molecule back out through the sensing pore (recapture step, Figure 3c). Once the voltage bias is reversed to attempt to recapture, it is maintained until an event is detected, or 5 minutes passes without a recapture event. For 10 kbp polymers, this wait time is increased to 10 minutes to account for the slower diffusive dynamics.
Figure 3:
The diffusive trapping mode. a) DNA is captured by the sensing pore and pulled upwards into the cavity in between the two membranes. b) In the diffusive trapping mode, immediately following capture, the field is turned off, and the captured DNA is allowed to freely diffuse around the cavity under no applied voltage. c) The voltage is reversed and the DNA, if still trapped in the cavity, is recaptured by the sensing pore. Renders are for conceptual illustration only; geometry and DNA are not to scale. d) A representative current trace showing a single capture-recapture event in the diffusive trapping mode, with a 1s delay. Additional events are shown in Supporting Information Section S3. e) Experimental recapture probability trends for varying delay times in the diffusive trapping mode (solid lines). Three different devices (indicated by marker colour) were used for these diffusive experiments. Squares correspond to 1.2 kbp, diamonds to 7 kbp, and circles to 10 kbp. The sensing pores had diameters of 9.5 nm (Device A: 577 loading events for 1.2 kbp, 727 loading events for 7 kbp), 7.5 nm (Device B: 430 loading events for 1.2 kbp, 426 loading events for 7 kbp), and 11.5 nm (Device C: 305 loading events for 10 kbp). Dashed lines show simulation results for 1.2 kbp DNA in devices whose filters contained 40, 75, and 160 nanofilter pores with diameters of 90 nm (green), 80 nm (red), and 70 nm (black), respectively. Error bars are estimated using simple Poisson statistics.
An example of a typical resulting current trace is given in Figure 3d. In order to fully understand the kinetics of DNA in the trap, we also performed simulations of diffusive escape of DNA through the nanofilter, which are detailed in the Methods section. The resulting experimental and simulation data are presented and compared in Figure 3e.
In the diffusive trapping mode, sufficiently large polymers remained trapped for all delay times tested. Figure 3e shows data for the recapture probabilities of 7 kbp and 10 kbp dsDNA, with blob size of ~150 nm and ~180 nm respectively. It essentially remains at 1 (i.e. always recapturing the trapped polymer) for all Δt0 tested, up to 30 s. From our simulations we estimate the half-life for escape from the trap to be on the order of hours. This trapping efficiency is a remarkable feature of these nanofiltered nanopore devices, since a translocating polymer is otherwise lost to the bulk reservoir if the field is not inverted within milliseconds following its passage. Indeed, Gershow et al.8 showed that the majority of 4 kbp and 6 kbp molecules diffuse out of recapture range within just a few tens of milliseconds when no trapping force is present to keep them in the vicinity of the sensing pore, consistent with our own control experiments. The trapping efficiency achieved here is also improved compared to a previous attempt by Liu et al.16 to fabricate entropic cages for DNA, for which the pore opening of the cavity provided a large escape route, such that it would always be possible for short polymers to escape via diffusion. This limited efficient trapping to long DNA strands (λ DNA, 48.3 kbp, Lc ≈ 16.4 μm, Rg ≈ 400 nm).
In contrast, in the nanofiltered nanopore device the radius of gyration of the polymer significantly exceeds the size of the nanopores in the nanoporous membrane, and thus the entropic cost of passage through the filter is non-negligible. DNA is therefore unlikely to escape by diffusion alone. Thus, sufficiently large polymers can remain trapped for quite a long time.
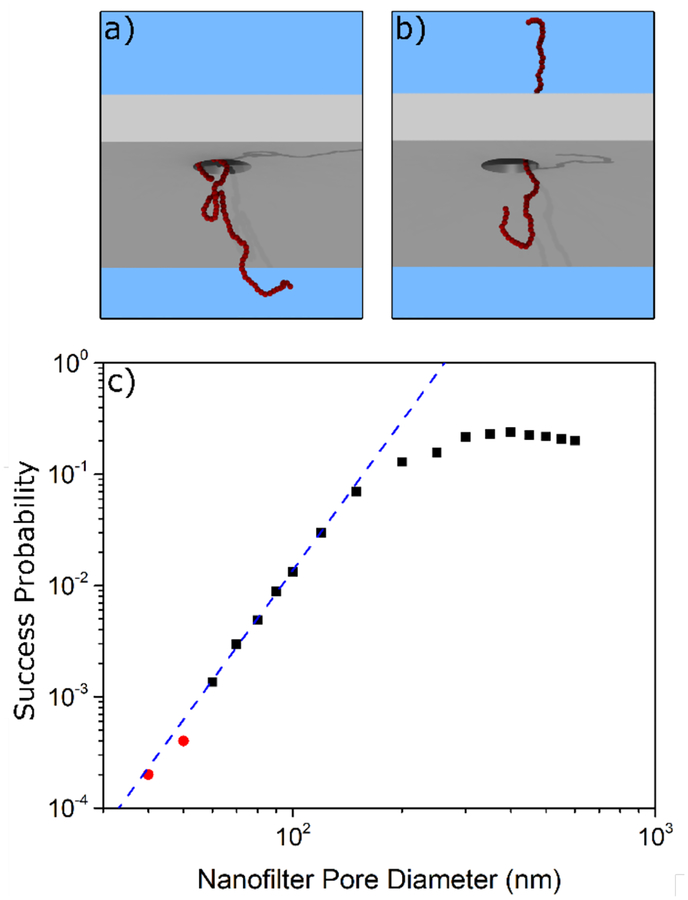
Our simulations show that the probability of a DNA strand crossing a filter pore becomes very small as the pore radius decreases. Figure 4c shows the success probability for a polymer corresponding to 1.2kbp DNA as a function of filter pore diameter. For pores smaller than 120 nm the success probability follows a strong power law behaviour (with an exponent of approximately 4.45). For pore diameters below 60 nm, successful translocations were rare. Whereas most simulations in Figure 4c were repeated until 200 successful crossings were observed, simulations for the two smallest pore sizes were repeated until a prescribed number of failed events had occurred. After 10,000 failed events, only 4 translocations were observed for a filter pore diameter of 50 nm and only 2 at 40 nm. Conversely, for large pore diameters exceeding 120 nm, the success probability begins to saturate as the polymer no longer experiences appreciable deformation in crossing the filter. Note that the saturation value, at approximately 23%, is a consequence of our simulation methodology. The success probability is defined as the probability for a polymer located close to a filter pore to translocate before diffusing a significant distance away; this differs from the translocation probability as defined in other work.41
Figure 4:
a) A snapshot of a 1.2 kbp (with Rg ~ 55 nm) equivalent DNA polymer during a simulated escape attempt by diffusion through the nanofilter. b) The same polymer at a later moment in time as it crosses the membrane. c) The simulated probability that the polymer will successfully cross the membrane before diffusing away from the filter.
The simulation results suggest that only a small fraction of the filter pores contribute appreciably to the leakage of 1.2 kbp DNA observed in Figure 3e. The distribution of pore major axis lengths can be seen in Figure 2c. The largest peak in the distribution corresponds to single filter pores, and it is clear from the distribution that single filter pores rarely exceed a major axis length of 50 nm. As shown Figure 4c, simulations suggest that minimal escape is expected through these filter pores.
However, the pore size distribution in Figure 2c is bimodal, and there is a separate population of pores with much larger sizes. These are merged pores and although they are relatively rare, they have a significant impact on the trapping efficiency. From Figure 2c the average pore size of the secondary population is around 80 nm and as per Figure 4c, we expect leaking through these pores to be non-negligible for 1.2 kbp DNA. For the devices used in this work, approximately 10±1% of nanofilter pores have a major axis length in the secondary population and it is through these merged pores that we can explain the escape of the smaller polymer. This explanation also gives insight into the origin of the differences in trapping efficiency for the two different 1.2 kbp polymer experiments, which most likely arises from differences in the details of the nanofilter pore size distributions – especially the merged pores. This implies that the trapping efficiency of any particular device is dominated by the number and size of merged pores in the nanofilter pore size distribution for that device, a property that can be tuned at the manufacturing level by changing the porosity and average pore size.
To gain quantitative insight into the relationship between the leaking rate and the number of filter pores and their size, simulations were performed in which the number and size of the nanofilter nanopores were varied. The results are included as dashed lines in Figure 3e. The simulation data clearly shows that a small number of large merged pores (e.g. 40 pores of diameter 90 nm) can give rise to the same escape probability as a larger number of smaller pores (e.g. 160 pores of diameter 70 nm). Further, good agreement with experimental results was found for these different combinations, validating this physical picture. There are some discrepancies in the shape of the curves, but these most likely arise from the assumptions of constant nanofilter pore size and uniform shape.
Whereas over 80% of the 1.2 kbp DNA strands escaped from the device in 20–30 seconds, the larger molecules exhibited virtually no leakage over the same timescale. Simulations (included in Supporting Information Section S1) indicate that, for fixed filter pore sizes, the overall escape time from the device grows very rapidly with chain length. From these simulations we estimate that the half-life for 7 kbp DNA to escape from the device exceeds half an hour, and that for 10 kbp DNA is on the order of hours.
Driven Trapping
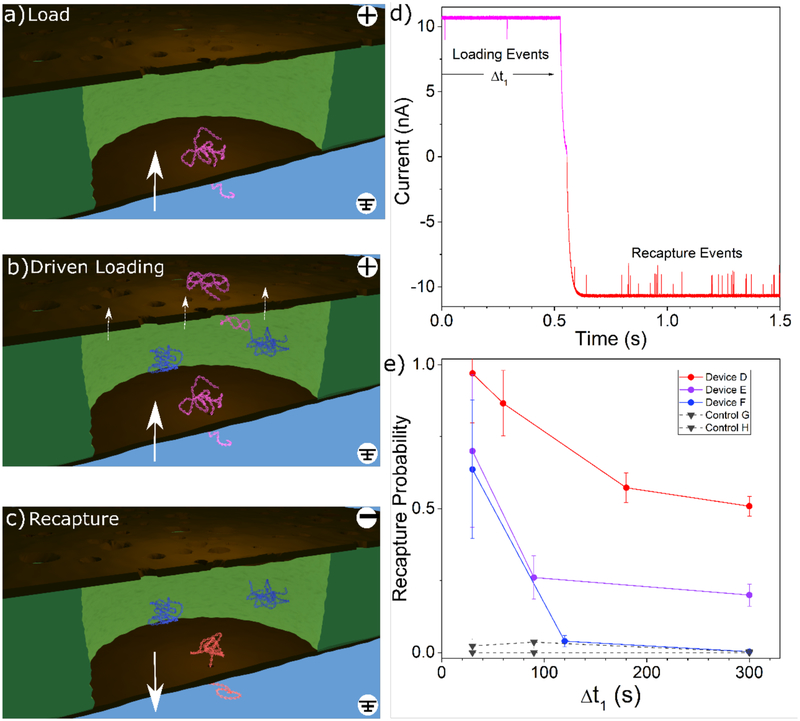
In the driven trapping mode of operation, the order of events is the same, but we maintain the 200 mV capture voltage even as molecules are captured, driving new molecules through the sensing pore and into the gap between membranes while previously translocated ones are still in the cage. The experimental sequence is depicted schematically in Figure 5a–c. In this mode, previously trapped molecules have the ability to escape through the nanofilter under the weak driving force present there (~10 μV, estimated by considering the relative resistances of NPN material over a single microwell as compared to the sensing pore resistance). While this force is not enough to significantly change the escape probability during any one attempt, the additional driving force does increase the rate at which escape attempts are made. Figure 5d shows a time series of the nanopore current just before and just after the voltage change for a particular driven trapping experiment, showing multiple recapture events as soon as the voltage polarity is flipped. After a loading time Δt1, the voltage is reversed and any molecules still in the gap are recaptured and counted. Typically, a few tens to a few hundred events were recaptured before the cavity was depleted, depending on the loading duration. The recapturing voltage is maintained until no event is detected for 5 minutes, or 10 minutes in the case of polymers 10 kbp or longer.
Figure 5:
a) DNA is captured by the sensing pore and pulled into the cavity in between the two membranes. b) In the “driven trapping” mode, other DNA molecules can continue to be captured into the cavity though the sensing pore and can also escape through the nanofilter under the influence an applied voltage. c) The voltage is reversed and any DNA trapped in the cavity is recaptured by the sensing pore. Renders are for conceptual illustration only; geometry and DNA are not to scale. d) A representative current trace showing the transitional region of a driven trapping experiment for an applied voltage of ±200 mV for device D. e) Recapture probability for increasing loading durations in the driven trapping configuration. 7 kbp dsDNA was used for all driven trapping experiments. Three nanofiltered nanopores (circles) and two standard control nanopores (inverted triangles) were used. In alphabetical order, sensing pores had diameters of 10.0 nm (736 loading events), 7.8 nm (90 loading events), 8.1 nm (410 loading events), 7.9 nm (790 loading events), and 8.6 nm (577 loading events). Error bars are estimated using simple Poisson statistics.
During driven trapping experiments, we usually observed nonzero recapture probabilities for various loading durations Δt1, as shown in Figure 5e. Note that the recapture probability defined in the driven trapping case is conceptually different from the diffusive case. While it is still calculated as the ratio of molecules entering the cavity to molecules leaving it, because DNA molecules that enter early in the capture step have more time to attempt escape, this quantity no longer represents the probability that any given molecule remains trapped. We find that the recapture probability decreases as the loading duration increases, eventually levelling off at long delays as an equilibrium is established between the rate of capture by the sensing pore and the rate of escape through the nanofilter. The exact value at which this equilibrium is reached varies significantly between devices, being dependent on both the sensing pore size and the details of the nanofilter pore distribution, both in terms of physical size and spatial distribution in relation to the sensing pore. In comparison, the control experiments (black inverted triangles), consisting of devices with a standard pore without a nanofilter, yielded virtually zero recapture probability, since the electric field quickly pushes DNA out of the capture region and into free solution in the absence of the nanofilter.8 While it is clear that DNA is readily able to traverse the nanofilter as long as a bias is applied, the fact that there is a significant number of DNA recaptured suggests that the presence of the nanofilter presents a barrier which slows DNA in transit before escape, similar in principle to reptation through a gel medium.
For the three nanofiltered nanopore devices used in Figure5, we also compared capture rates in the three possible translocation configurations: loading through the sensing pore (Figure 5a–b), recapture from the entropic cage by the sensing pore (Figure 5c), and capture through the nanofilter (as shown in previous work7).
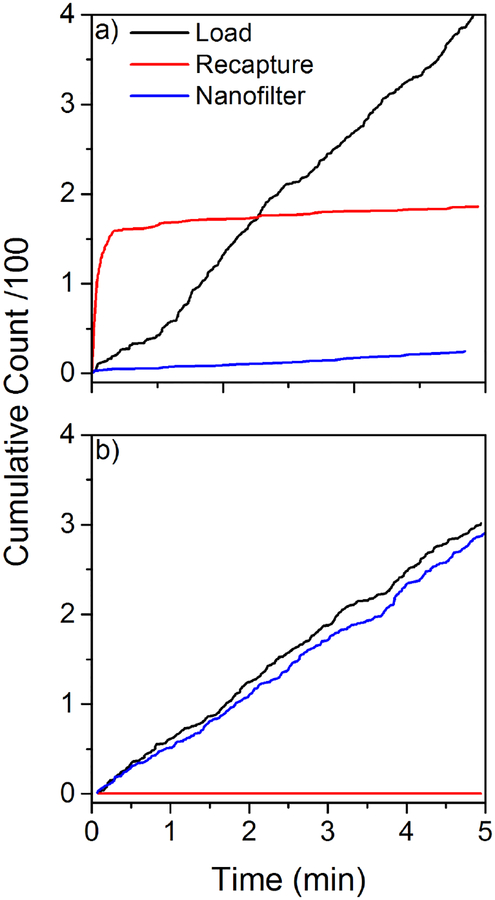
Because of the confining geometry of the entropic cage, molecules in the gap take relatively little time to find the sensing pore once the recapture voltage is established. If a large number of molecules are trapped in the cage, one would expect this to manifest itself as a high capture rate at the very beginning of the recapture process. We observed significant variation between the behaviors of different devices in the driven trapping mode. Figure 6 illustrates the two extremes of this behavior range. In Figure 6a, we see that in device D, the initial capture rate in the recapture step is very high compared to both other translocation modes (also illustrated in Figure 5d), indicating that this device is a strong entropic trap which locally increases the concentration of trapped dsDNA in the gap as compared to the bulk. We also observe a very low capture rate through the nanofilter for this device, consistent with the idea that the nanofilter presents a strong entropic barrier to translocation in this case. At the other extreme, device F (Figure 6b) has essentially the same capture rate through the nanofilter as it does through the sensing pore during the loading step, and shows hardly any recapture, consistent with the idea that the nanofilter is not a strong entropic barrier in this device. Device E falls in between these two extremes.
Figure 6:
Cumulative event counts in the three translocation modes (load/back: capture by the sensing pore into the cavity; recapture/red: capture by the sensing pore from the cavity; nanofilter/blue: capture by the sensing pore through the nanofilter) for two devices during 5 minutes loading experiments in the driven trapping mode at 200 mV, showing the extremes of the possible trapping behaviors with 7 kbp dsDNA. a) Cumulative event counts for device D, which is a very efficient trap. b) Cumulative event counts for device F, which is not an efficient trap.
A low amplification of the recapture rate as compared to the loading rate indicates a device with inefficient trapping properties, with a nanofilter that presents only a weak barrier to escape the cage. Device which are poor traps (low recapture rate) have a rate of capture through the nanofilter comparable to the loading rate through the sensing pore, while devices with initially higher recapture rate as compared to the loading rate are indicative of a strongly trapping device, and are associated with low rates of capture through the nanofilter. These observations further highlight and support our previous observations that the variation between devices must come from the inherent variability in the local properties of the nanofilter pore distribution for any particular device.7
Translocation Kinetics
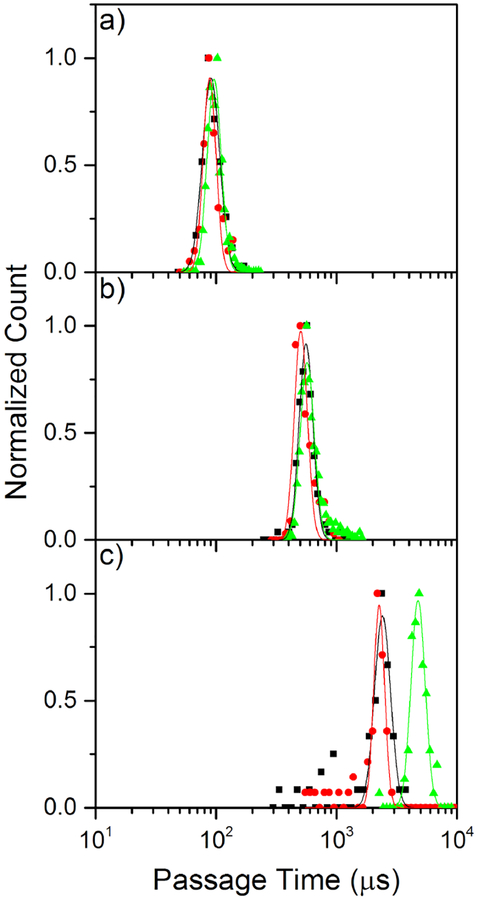
We finally compare the translocation kinetics of these three modes using 1.2, 7, and 10 kbp dsDNA. Figure 7 shows passage time histograms for all three modes of capture with these lengths of dsDNA. Consistent with our previous work,7 the passage time distributions are well characterized by a log-normal distribution for the unfolded DNA events. As can be seen in Figure 7a–b, using 1.2 kbp and 7 kbp dsDNA, the passage time histograms are indistinguishable for all three possible translocation modes, having a mean and standard deviation of 93±17 μs and 547±62 μs, respectively. For the 10 kbp molecules presented in Figure 7c, however, passage through the nanofilter first results in much longer passage times than the other modes, yielding translocation times of 4770±640 μs for nanofilter capture as compared to 2370±360 μs for passage through the sensing pore alone in either direction.
Figure 7:
Passage times for loading (black squares), recapture (red circles), and nanofilter capture (green triangles) experiments. a) Histograms of passage times of the three capture modes for 1.2 kbp dsDNA capture by a 6.9 nm diameter sensing pore (240 loading events, 89 recapture events, and 4549 nanofilter events). b) Corresponding histograms of passage times for 7 kbp dsDNA using the same pore as (a) (139 loading events, 139 recapture events, and 1276 nanofilter events). c) Corresponding histograms of passage times for 10kbp dsDNA using a 7.2 nm diameter sensing pore (90 loading events, 88 recapture events, and 78 nanofilter events). Only passage times for unfolded, single-level translocation events are included. All experiments are performed in 3.6 M LiCl pH 8 at 200 mV.
While one might expect that confinement of dsDNA in the cage should lead to different passage kinetics depending on the direction of passage,5 the degree of confinement achieved here was most likely not sufficient to observe this effect. Since the radii of gyration of all polymers used (55 nm, 151 nm, and 181 nm) were smaller than the gap height (800 nm), this is probably not surprising. The only significant difference in translocation kinetics was observed for capture through the nanofilter for the longest polymers, 10kbp dsDNA, which is likely due to increased interaction between the polymer and the nanofilter than a result of confinement effects.7
Of particular note is that the large gap heights between the membranes used in this work, which permits passage of much longer polymers than previously reported,7 extending the range of polymers lengths that can be reliably captured through the nanofilter without clogging. However, due to the additional relaxation of the polymer as it traverses the increased gap height compared to our previous work, the improvement to passage time distribution width is small.
Conclusions
We have presented the application of NPN as a nanofilter within molecular distances from a sensing nanopore, forming a nanofiltered nanopore device as a means to confine and entropically trap single linear dsDNA molecules in a femtoliter cage for extended periods of time. With this structure, we are able to study the kinetics of DNA translocation in the presence of an entropic barrier to escape from a confining cavity. Through both experiment and simulation we have shown that while the efficiency of NPN as a trapping layer for short polymers is dependent on the details of the local nanofilter pore size distribution, it can be used to trap linear polymers for experimentally relevant timescales. We have also demonstrated that devices with a larger gap height can reliably be used to study longer polymers than previously reported without clogging the sensing pore.
The understanding that the trapping efficiency of the nanodevice is dictated by the outliers in the nanofilter pore size distribution will be of vital importance in guiding the design of similar devices in the future. As shown in our previous work, atomic layer deposition can be used to shrink pores in the nanofilter and separate merged pores, allowing confinement of even smaller polymers than those presented here. Using the NPN membrane as a capping layer for the cage allows for free flow of ions, small biomolecules, and biochemical reagents into the cage32 while providing an entropic force to indefinitely confine DNA. The device presented here improves dramatically on previous attempts to trap16 and recapture8 polymers, decreasing the pore diameter of escape route by a factor of 10 while also decreasing the electrical resistance of the capping layer, improving the trapping efficiency.
Supplementary Material
Acknowledgements
The authors acknowledge the R21 NIH grant R21EB024120 to VTC and JLM for financial support, and the Natural Sciences and Engineering Research Council of Canada (NSERC) grant CRDPJ 530554–18 to VTC and HdH, and Discovery Grant 2014–06091 to HdH. KB acknowledges the financial support of the Vanier Canadian Graduate Scholarship program. VTC thanks the Province of Ontario for an Early Researcher Award. The authors acknowledge SiMPore Inc. for their expertise in designing the nanofiltered nanopore devices.
Footnotes
Conflicts of Interest
KB, GRM, JLM, and VTC declare competing financial interest in the form of a patent on the nanofiltered nanopore device. JLM is a cofounder of SiMPore Inc. All other authors declare no competing financial interest.
Supporting Information
Supporting Information Section S1: Simulation Setup. Supporting Information Section S2: Effective Pore Diameter Distribution. Supporting Information Section S3: Additional Event Traces
References
- (1).Fologea D; Gershow M; Ledden B; McNabb DS; Golovchenko JA; Li J Detecting Single Stranded DNA with a Solid State Nanopore. Nano Lett 2005, 5 (10), 1905–1909. 10.1021/nl051199m. [DOI] [PMC free article] [PubMed] [Google Scholar]
- (2).Derrington IM; Butler TZ; Collins MD; Manrao E; Pavlenok M; Niederweis M; Gundlach JH Nanopore DNA Sequencing with MspA. Proc. Natl. Acad. Sci. U. S. A 2010, 107 (37), 16060–16065. 10.1073/pnas.1001831107. [DOI] [PMC free article] [PubMed] [Google Scholar]
- (3).Clarke J; Wu H-C; Jayasinghe L; Patel A; Reid S; Bayley H Continuous Base Identification for Single-Molecule Nanopore DNA Sequencing. Nat. Nanotechnol 2009, 4 (4), 265–270. 10.1038/nnano.2009.12. [DOI] [PubMed] [Google Scholar]
- (4).Mathé J; Visram H; Viasnoff V; Rabin Y; Meller A Nanopore Unzipping of Individual DNA Hairpin Molecules. Biophys. J 2004, 87 (5), 3205–3212. [DOI] [PMC free article] [PubMed] [Google Scholar]
- (5).Bell NAW; Chen K; Ghosal S; Ricci M; Keyser UF Asymmetric Dynamics of DNA Entering and Exiting a Strongly Confining Nanopore. Nat. Commun 2017, 8 (1), 380 10.1038/s41467-017-00423-9. [DOI] [PMC free article] [PubMed] [Google Scholar]
- (6).Oukhaled G; Mathé J; Biance a.-L.; Bacri L; Betton J-M; Lairez D; Pelta J; Auvray L Unfolding of Proteins and Long Transient Conformations Detected by Single Nanopore Recording. Phys. Rev. Lett 2007, 98 (15), 98–101. 10.1103/PhysRevLett.98.158101. [DOI] [PubMed] [Google Scholar]
- (7).Briggs K; Madejski G; Magill M; Kastritis K; De Haan HWHW; McGrath JLJL; Tabard-Cossa V DNA Translocations through Nanopores under Nanoscale Preconfinement. Nano Lett 2018, 18 (2), 660–668. 10.1021/acs.nanolett.7b03987. [DOI] [PMC free article] [PubMed] [Google Scholar]
- (8).Gershow M; Golovchenko J. a. Recapturing and Trapping Single Molecules with a Solid-State Nanopore. Nat. Nanotechnol 2007, 2 (12), 775–779. 10.1038/nnano.2007.381. [DOI] [PMC free article] [PubMed] [Google Scholar]
- (9).Sean D; de Haan HW; Slater GW Translocation of a Polymer through a Nanopore Starting from a Confining Nanotube. Electrophoresis 2015, 36 (5), 682–691. 10.1002/elps.201400418. [DOI] [PubMed] [Google Scholar]
- (10).Peters R Functionalization of a Nanopore: The Nuclear Pore Complex Paradigm. Biochim. Biophys. Acta - Mol. Cell Res 2009, 1793 (10), 1533–1539. 10.1016/j.bbamcr.2009.06.003. [DOI] [PMC free article] [PubMed] [Google Scholar]
- (11).Van Nies P; Kowalczyk SW; Kapinos L; Blosser TR; Lim RYH; Dekker C; Magalhães T; van Nies P; Lim RYH; Dekker C Single-Molecule Transport across an Individual Biomimetic Nuclear Pore Complex. Nat. Nanotechnol 2011, 6 (7), 433–438. 10.1038/nnano.2011.88. [DOI] [PubMed] [Google Scholar]
- (12).Tamura K; Hara-Nishimura I The Molecular Architecture of the Plant Nuclear Pore Complex. J. Exp. Bot 2013, 64 (4), 823–832. 10.1002/jgrd.50393. [DOI] [PubMed] [Google Scholar]
- (13).Stewart M Molecular Mechanism of the Nuclear Protein Import Cycle. Nat. Rev. Mol. Cell Biol 2007, 8 (3), 195–208. 10.1038/nrm2114. [DOI] [PubMed] [Google Scholar]
- (14).Pedone D; Langecker M; Münzer AM; Wei R; Nagel RD; Rant U Fabrication and Electrical Characterization of a Pore–Cavity–Pore Device. J. Phys. Condens. Matter 2010, 22 (45), 454115 10.1088/0953-8984/22/45/454115. [DOI] [PubMed] [Google Scholar]
- (15).Langecker M; Pedone D; Simmel FC; Rant U Electrophoretic Time-of-Flight Measurements of Single DNA Molecules with Two Stacked Nanopores. Nano Lett 2011, 11 (11), 5002–5007. 10.1021/nl2030079. [DOI] [PubMed] [Google Scholar]
- (16).Liu X; Mihovilovic Skanata M; Stein D Entropic Cages for Trapping DNA near a Nanopore. Nat. Commun 2015, 6, 6222 10.1038/ncomms7222. [DOI] [PubMed] [Google Scholar]
- (17).Kick B; Praetorius F; Dietz H; Weuster-Botz D Efficient Production of Single-Stranded Phage DNA as Scaffolds for DNA Origami. Nano Lett 2015, 15 (7), 4672–4676. 10.1021/acs.nanolett.5b01461. [DOI] [PMC free article] [PubMed] [Google Scholar]
- (18).Wang P; Meyer TA; Pan V; Dutta PK; Ke Y The Beauty and Utility of DNA Origami. Chem 2017, 2 (3), 359–382. 10.1016/j.chempr.2017.02.009. [DOI] [Google Scholar]
- (19).Said H; Schüller VJ; Eber FJ; Wege C; Liedl T; Richert C M1.3 - A Small Scaffold for DNA Origami. Nanoscale 2013, 5 (1), 284–290. 10.1039/c2nr32393a. [DOI] [PubMed] [Google Scholar]
- (20).Plesa C; Van Loo N; Ketterer P; Dietz H; Dekker C Velocity of DNA during Translocation through a Solid State Nanopore. Nano Lett 2015, 15 (1), 732–737. 10.1021/nl504375c. [DOI] [PubMed] [Google Scholar]
- (21).Kong J; Bell NAW; Keyser UF Quantifying Nanomolar Protein Concentrations Using Designed DNA Carriers and Solid-State Nanopores. Nano Lett 2016, 16 (6), 3557–3562. 10.1021/acs.nanolett.6b00627. [DOI] [PMC free article] [PubMed] [Google Scholar]
- (22).Kong J; Zhu J; Keyser UF Single Molecule Based SNP Detection Using Designed DNA Carriers and Solid-State Nanopores. Chem. Commun 2017, 53 (2), 436–439. 10.1039/c6cc08621g. [DOI] [PubMed] [Google Scholar]
- (23).Bell NAW; Keyser UF Specific Protein Detection Using Designed DNA Carriers and Nanopores. J. Am. Chem. Soc 2015, 137 (5), 2035–2041. 10.1021/ja512521w. [DOI] [PMC free article] [PubMed] [Google Scholar]
- (24).Bell NAW; Keyser UF Digitally Encoded DNA Nanostructures for Multiplexed, Single-Molecule Protein Sensing with Nanopores. Nat. Nanotechnol 2016, 11 (7), 645–651. 10.1038/nnano.2016.50. [DOI] [PubMed] [Google Scholar]
- (25).Belkin M; Chao S-H; Jonsson MP; Dekker C; Aksimentiev A Plasmonic Nanopores for Trapping, Controlling Displacement, and Sequencing of DNA. ACS Nano 2015. 10.1021/acsnano.5b04173. [DOI] [PMC free article] [PubMed] [Google Scholar]
- (26).Kotnala A; Gordon R Quantification of High-Efficiency Trapping of Nanoparticles in a Double Nanohole Optical Tweezer. Nano Lett 2014, 14 (2), 853–856. 10.1021/nl404233z. [DOI] [PubMed] [Google Scholar]
- (27).Pud S; Chao S-H; Belkin M; Verschueren D; Huijben T; van Engelenburg C; Dekker C; Aksimentiev A Mechanical Trapping of DNA in a Double-Nanopore System. Nano Lett 2016, 16 (12), 8021–8028. 10.1021/acs.nanolett.6b04642. [DOI] [PMC free article] [PubMed] [Google Scholar]
- (28).Liu X; Zhang Y; Nagel R; Reisner W; Dunbar WB Controlling DNA Tug-of-War in a Dual Nanopore Device. arXiv 2018, No. 1811.11105v1, 1–33. [DOI] [PubMed] [Google Scholar]
- (29).Mirsaidov U; Comer J; Dimitrov V; Aksimentiev A; Timp G Slowing the Translocation of Double-Stranded DNA Using a Nanopore Smaller than the Double Helix. Nanotechnology 2010, 21 (39), 395501 10.1088/0957-4484/21/39/395501. [DOI] [PMC free article] [PubMed] [Google Scholar]
- (30).Briggs K; Kwok H; Tabard-Cossa V Automated Fabrication of 2-Nm Solid-State Nanopores for Nucleic Acid Analysis. Small 2014, 10 (10), 2077–2086. 10.1002/smll.201303602. [DOI] [PubMed] [Google Scholar]
- (31).Freedman KJ; Otto LM; Ivanov AP; Barik A; Oh S-H; Edel JB Nanopore Sensing at Ultra-Low Concentrations Using Single-Molecule Dielectrophoretic Trapping. Nat. Commun 2016, 7, 10217 10.1038/ncomms10217. [DOI] [PMC free article] [PubMed] [Google Scholar]
- (32).DesOrmeaux JPS; Winans JD; Wayson SE; Gaborski TR; Khire TS; Striemer CC; McGrath JL Nanoporous Silicon Nitride Membranes Fabricated from Porous Nanocrystalline Silicon Templates. Nanoscale 2014, 6 (18), 10798–10805. 10.1039/c4nr03070b. [DOI] [PubMed] [Google Scholar]
- (33).Briggs K; Charron M; Kwok H; Le T; Chahal S; Bustamante J; Waugh M; Tabard-Cossa V Kinetics of Nanopore Fabrication during Controlled Breakdown of Dielectric Membranes in Solution. Nanotechnology 2015, 26 (8), 084004 10.1088/0957-4484/26/8/084004. [DOI] [PubMed] [Google Scholar]
- (34).Kwok H; Briggs K; Tabard-Cossa V Nanopore Fabrication by Controlled Dielectric Breakdown. PLoS One 2014, 9 (3), e92880 10.1371/journal.pone.0092880. [DOI] [PMC free article] [PubMed] [Google Scholar]
- (35).Madejski G; Lucas K; Pascut F; Webb K; McGrath J TEM Tomography of Pores with Application to Computational Nanoscale Flows in Nanoporous Silicon Nitride (NPN). Membranes (Basel) 2018, 8 (2), 26 10.3390/membranes8020026. [DOI] [PMC free article] [PubMed] [Google Scholar]
- (36).Kwok H; Waugh M; Bustamante JJ; Briggs K; Tabard-Cossa V Long Passage Times of Short SsDNA Molecules through Metallized Nanopores Fabricated by Controlled Breakdown. Adv. Funct. Mater 2014, 24 (48), 7745–7753. 10.1002/adfm.201402468. [DOI] [Google Scholar]
- (37).Kowalczyk SW; Wells DB; Aksimentiev A; Dekker C Slowing down DNA Translocation through a Nanopore in Lithium Chloride. Nano Lett 2012, 12 (2), 1038–1044. 10.1021/nl204273h. [DOI] [PMC free article] [PubMed] [Google Scholar]
- (38).Slater GW; Holm C; Chubynsky MV; de Haan HW; Dube A; Grass K; Hickey OA; Kingsburry C; Sean D; Shendruk TN; et al. Modeling the Separation of Macromolecules: A Review of Current Computer Simulation Methods. Electrophoresis 2009, 30 (5), 792–818. 10.1002/elps.200800673. [DOI] [PubMed] [Google Scholar]
- (39).Forstater JH; Briggs K; Robertson JWF; Ettedgui J; Marie-Rose O; Vaz C; Kasianowicz JJ; Tabard-Cossa V; Balijepalli A MOSAIC: A Modular Single-Molecule Analysis Interface for Decoding Multistate Nanopore Data. Anal. Chem 2016, 88 (23). 10.1021/acs.analchem.6b03725. [DOI] [PMC free article] [PubMed] [Google Scholar]
- (40).Raillon C; Granjon P; Graf M; Steinbock LJ; Radenovic A Fast and Automatic Processing of Multi-Level Events in Nanopore Translocation Experiments. Nanoscale 2012, 4 (16), 4916–4924. 10.1039/c2nr30951c. [DOI] [PubMed] [Google Scholar]
- (41).Muthukumar M Polymer Translocation; CRC Press, 2011. [Google Scholar]
Associated Data
This section collects any data citations, data availability statements, or supplementary materials included in this article.


