

Abstract
Inflammation can increase the excitability of bronchopulmonary C-fibers leading to excessive sensations and reflexes (e.g. wheeze and cough). We have previously shown modulation of peripheral nerve terminal mitochondria by antimycin A causes hyperexcitability in TRPV1-expressing bronchopulmonary C-fibers through the activation of protein kinase C (PKC). Here, we have investigated the PKC isoform responsible for this signaling. We found PKCβ1, PKCδ and PKCε were expressed by many vagal neurons, with PKCα and PKCβ2 expressed by subsets of vagal neurons. In dissociated vagal neurons, antimycin A caused translocation of PKCα but not the other isoforms, and only in TRPV1-lineage neurons. In bronchopulmonary C-fiber recordings, antimycin A increased the number of action potentials evoked by α,β-methylene ATP. Selective inhibition of PKCα, PKCβ1 and PKCβ2 with 50nM bisindolylmaleimide I prevented the antimycin-induced bronchopulmonary C-fiber hyperexcitability, whereas selective inhibition of only PKCβ1 and PKCβ2 with 50nM LY333531 had no effect. We therefore conclude that PKCα is required for antimycin-induced increases in bronchopulmonary C-fiber excitability.
Keywords: Nociceptor, mitochondria, vagal, antimycin A, hyperexcitability, PKC isoform
1. Introduction
Vagal sensory afferents sense the physical and chemical environment of the airways, and their activation leads to reflex regulation of the respiratory and cardiovascular systems (Kubin et al., 2006). Unmyelinated afferents (C-fibers) are activated by a host of noxious irritants and inflammatory agents due to their expression of specific receptors (Hooper et al., 2016; Undem et al., 2004; Wang et al., 2017). The activation of these so-called ‘nociceptive’ C-fibers triggers defensive reflexes and sensations such as cough, bronchospasm, hypersecretion, wheeze and dyspnea (Lee, 2009; Mazzone and Undem, 2016; Taylor-Clark, 2015). Excessive C-fiber activity likely contributes to the debilitating chronic cough, wheeze, and airway hyperreactivity associated with inflammatory airway disease such as asthma (Carr and Lee, 2005; McAlexander et al., 2015; Trankner et al., 2014; Undem and Taylor-Clark, 2014).
In addition to their role in ATP generation and biosynthesis, mitochondria may contribute to inflammatory signaling cascades (Sena and Chandel, 2012), particularly in chronic diseases such as diabetes mellitus, cardiovascular disease, asthma and irritable bowel syndrome (Chowdhury et al., 2012; Hall and Wiley, 1998; Huang et al., 2005; Reddy, 2011; Rocha et al., 2010). Mitochondria have been shown to increase ROS production in response to hypoxia, neurotrophins, tumor necrosis factor-α and Toll-like receptors (Bell et al., 2007; Corda et al., 2001; Pehar et al., 2007; West et al., 2011). Mitochondrial dysfunction may play a substantial role in signaling in sensory afferent function because mitochondria are densely packed within afferent peripheral terminals (Hung et al., 1973; von During and Andres, 1988). We have shown that mitochondrial dysfunction caused by the electron transfer complex III inhibitor antimycin A evoked acute bronchopulmonary C-fiber activation via the downstream gating of transient receptor potential ankyrin 1 (TRPA1) and TRPV1 (Nesuashvili et al., 2013; Stanford et al., 2019). In addition, antimycin A also caused bronchopulmonary C-fiber hyperexcitability to both mechanical and chemical stimuli (Hadley et al., 2014). This hyperexcitability was independent of TRPA1 and TRPV1 channels but was blocked by bisindolylmaleimide I (BIM I), a selective inhibitor of PKC, but not by its inactive analog BIM V (Hadley et al., 2014).
PKC isoforms are divided into 3 subfamilies: conventional (cPKC; α, β1, β2 and γ), novel (nPKC; δ, ε, η and θ) and atypical (aPKC; μ, ζ and λ/ι) (Cosentino-Gomes et al., 2012). Although the expression of PKC isoforms in vagal sensory afferents has not yet been systematically studied, studies in spinal dorsal root ganglion (DRG) show that somatosensory afferents express multiple isoforms and that PKCε in particular plays a critical role in inflammation-induced plasticity (Cesare et al., 1999; Joseph and Levine, 2010; Wu et al., 2012). The goal of the present project was to identify the PKC isoform responsible for the antimycin-induced bronchopulmonary C-fiber hyperexcitability. Our previous study (Hadley et al., 2014) used 1μM BIM I (a.k.a. Gö68050 and GF109203X), which would be expected to completely inhibit cPKC and nPKC isoforms and partially inhibit aPKC isoforms (Anastassiadis et al., 2011; Way et al., 2000; Wu-Zhang and Newton, 2013). Here, we show that 5 PKC isoforms (α, β1, β2, δ and ε) are present in vagal sensory afferents, but only PKCα translocates to the membrane in response to antimycin A in vitro. Furthermore, selective inhibition of α, β1 and β2 isoforms with 50nM BIM I prevents antimycin-induced bronchopulmonary C-fiber hyperexcitability, whereas selective inhibition of only β1 and β2 isoforms with 50nM LY333531 (a.k.a. ruboxistaurin) had no effect. We therefore conclude that PKCα is required for antimycin-induced increases in bronchopulmonary C-fiber excitability.
2. Experimental Procedures
2.1. Animals
TRPV1Cre/Cre (Trpv1tm1(cre)Bbm, 017769, Jackson Laboratory) were mated with ROSA26-tdTomatofl/fl (B6.Cg-Gt(ROSA)26Sortm9(CAG-tdTomato)Hze/J, 007909, Jackson Laboratory) to yield TRPV1Cre/+/ROSA26-tdTomatofl/+ (TRPV1-tdtomato) mice. Genotype of the offspring was confirmed using polymerase chain reaction. Wild type C57BL/6J mice were purchased from Jackson Laboratory (000664). Offspring were weaned at 21 postnatal days and up to 4 littermates were housed per cage under normal condition (20 ° C, a 12hrs dark/light cycle). Mice were provided with standard rodent chow and water ad libitum. All experiments were performed with approval from the University of South Florida Institutional Animal Care and Use Committee (AAALAC #000434). In total, 104 mice (29 TRPV1-tdtomato and 75 C57BL/6J) were used in this study.
2.2. Immunofluorescence
Male TRPV1-tdTomato mice (6–10 weeks) were euthanized by CO2 inhalation and transcardially perfused with ice-cold PBS followed by perfusion fixation with ice-cold 3.7% formaldehyde (FA). Vagal ganglia were dissected out and post-fixed for 1 hr in 3.7% FA at 4 ° C. Tissues were washed in PBS to remove residual FA and transferred to 20% sucrose solution for cryoprotection. Tissue were mounted in OCT (optimal cutting temperature) compound and snap frozen in dry ice. Vagal ganglia were sectioned in 20 μm slices and collected onto Superfrost plus slides. Slides were then air-dried at room temperature in the dark overnight. For immunofluorescence, tissue was permeabilized with 0.3% Triton X-100 in PBS (PBSTx) for 15 min followed by blocking with 1% bovine serum albumin (BSA)/10% Donkey Serum (DS)/0.3% PBSTx. Tissue was incubated overnight at 4°C with the appropriate PKC isoform primary antibody (raised in rabbit) diluted 1:500 in blocking buffer (except for the β1 antibody which was diluted 1:100). After washing with 0.2% Tween 20 in PBS (PBST) three times for 10 min, tissue was incubated with Alexa Fluor 647-labeled anti-rabbit secondary antibody (Life Technologies, Carlsbad, CA) diluted 1:1000 in 1% BSA/5% DS in 0.2% PBST for 1h. Tissue was washed with 0.2% PBST three times for 10 min and rinsed briefly with H2O. Slides were air-dried and mounted with DPX mounting medium (Sigma Aldrich, St. Louis, MO). Images were taken of tdTomato (excitation of 546 nm) and Alexa Fluor 647 (excitation of 633 nm) with an Olympus FV1200 confocal microscope equipped with 20X UPLAN SAPO, 0.75NA. z-stack images (each of 20 μm) of 3 to 6 different vagal nodose ganglia were taken from 3 TRPV1-tdtomato mice, and projection images were obtained using Fiji software. The number of neurons expressing tdTomato and/or a given PKC isoform were counted in each section.
2.3. Immunocytochemistry to measure PKC Translocation in dissociated mouse vagal neurons
Vagal ganglia were obtained from male TRPV1-tdtomato mice (6–10 weeks) expressing tdTomato in TRPV1+ cells. Mice were euthanized by CO2 asphyxiation, then exsanguination. Although the nodose and jugular are fused in mice, the nodose ganglia can be grossly isolated during dissection. Vagal nodose ganglia were dissected out and immediately enzymatically dissociated using collagenase/dispase as described in (Stanford et al., 2019). Isolated neurons were plated onto coverslips precoated with poly-D-lysine (MP Biomedicals; Irvine, CA) and laminin (Invitrogen; Waltham, MA), and incubated at 37 °C in L-15 (supplemented with 10% fetal bovine serum; Corning, Corning, NY), and used within 24 hrs. Dissociated mouse vagal neurons on glass coverslips were treated with either vehicle (0.1% ethanol), 10 μM antimycin A or 300 nM phorbol-12-myristate-13-acetate (PMA; LC Laboratories, Woburn, MA) by direct addition to culture media and mixing. Neurons were fixed 2 min (for PMA) or 10 min (for vehicle and Antimycin A) later using fresh 3.7% paraformaldehyde (10 min at room temperature) to preserve PKC subcellular location. Neurons were permeabilized using phosphate-buffered saline containing 0.1% Triton X-100 (PBSTx, Sigma Aldrich, St. Louis, MO) for 10 minutes at room temperature and blocked using PBS with 0.025% Tween 20 (PBST; Sigma Aldrich, St. Louis, MO) containing 2% bovine serum albumin (Sigma Aldrich, St. Louis, MO) for 45 minutes at room temperature. Cells were stained using the appropriate PKC isoform primary antibody diluted 1:500 (except for the β1 antibody which was diluted 1:100). Antibodies were made up in blocking buffer and left on cells overnight at 4 °C. Cells were washed three times using PBSTx and then incubated with an Alexa Fluor 647-labeled anti-rabbit secondary antibody (Life Technologies, Carlsbad, CA) diluted 1:1000 in blocking buffer and left on cells for 1 hour at room temperature. After three washes with PBSTx, coverslips were mounted onto glass slides using VECTASHIELD(R) Mounting Medium with 4′,6-diamidino-2-phenylindole (DAPI; Vector Laboratories, Burlingame, CA) and sealed with nail polish. Imaging was performed using an Olympus FV1200 confocal microscope with a 63× objective as follows: DAPI (excitation of 405 nm), tdTomato (excitation of 546 nm) and Alexa Fluor 647 (excitation of 633 nm). Analysis of staining intensity was performed using ImageJ. A straight line was drawn across each neuron in a region excluding the DAPI-identified nucleus, and the Multi-plot function was used to plot the profile of the staining. The ratio of the peak staining at the edge of the neuron to the average staining across the center third of the cell was generated to give the membrane/cytosolic ratio for a given PKC isoform. Neurons were allocated into tdTomato+ and tdTomato− groups. The membrane/cytosolic ratio for a specific neuronal group in response to vehicle, antimycin A and PMA was compared using a one-way ANOVA using Sidak’s multiple comparisons test (p<0.05 taken as significant). In total, 9 experiments each were performed for PKCα (450 neurons) and PKCε (1259 neurons) and 3 experiments each were performed for PKCβ1 (139 neurons), PKCβ2 (90 neurons) and PKCδ (129 neurons). 26 TRPV1-tdtomato mice were used in these studies.
2.4. PKC antibodies
PKC isoform antibodies used from Santa Cruz Biotechnology (Santa Cruz, CA) were as follows: cPKCα (sc208), cPKCβ2 (sc210), PKCδ (sc937), nPKCε (sc214), cPKCγ (sc211) PKCμ (sc935), and PKCθ (sc212). PKCβ1 from Abcam (Eugene, OR; ab195039). All primary antibodies were raised in rabbits.
2.5. Bronchopulmonary C-fiber extracellular recordings
Male C57BL/6J mice were killed by CO2 asphyxiation followed by exsanguination. The innervated isolated lung preparation was isolated in Krebs bicarbonate buffer solution (composed of (mM): 118 NaCl, 5.4 KCl, 1.0 NaH2PO4, 1.2 MgSO4, 1.9 CaCl2, 25.0 NaHCO3 and 11.1 D-glucose, and equilibrated with 95% O2 and 5% CO2 (pH 7.3–7.4)) containing 3 μM indomethacin, as previously described (Hadley et al., 2014; Stanford et al., 2019). A sharp glass electrode (containing 3 M NaCl) was inserted into the vagal ganglion and recorded action potentials were amplified (Microelectrode AC amplifier 1800; A-M Systems, Everett, WA, USA), filtered (0.3 kHz of low cut-off and 1 kHz of high cut-off), and analyzed by NerveOfIt software (Phocis, Baltimore, MD, USA). Action potential discharge was quantified off-line and recorded in 1 s bins. The background activity was usually either absent or less than 2 Hz.
To measure conduction velocity, an electrical stimulation (S44; Grass Instruments, Quincy, MA, USA) was applied to the center of the receptive field. The conduction velocity of the individual bronchopulmonary afferent was calculated by dividing the distance along the nerve pathway by the time delay between the shock artifact and the action potential evoked by electrical stimulation. Only bronchopulmonary C-fibers with conduction velocities <0.7 m/s were included in the study, as only this group of afferents has been previously shown to undergo an increase in excitability in response to mitochondrial dysfunction by antimycin A (Hadley et al., 2014). Mechanical stimulation was determined using manual application of calibrated von Frey fibers to the center of the receptive field. We then determined the action potential discharge response to the P2X2/3 agonist α,β methylene ATP (α,β-mATP, 30 μM) intratracheally applied as a 1 ml bolus over 10 s. This submaximal dose is sufficient to activate all P2X2/3-expressing vagal bronchopulmonary C-fibers. While P2X3 receptors are expressed in virtually all vagal sensory neurons, P2X2 receptors are only expressed in nodose vagal neurons (Nassenstein et al., 2010; Wang et al., 2017). α,β-mATP only causes significant activation of bronchopulmonary afferents projected from nodose sensory neurons (Nassenstein et al., 2010; Undem et al., 2004). Only fibers activated by both mechanical stimulation and α,β-mATP were included in the study. The lungs were then treated with either 0.1% ethanol (control) or antimycin A (20 μM). Ten minutes later the action potential discharge response to α,β-mATP (30 μM) was again determined. In some cases, the lungs were pretreated intratracheally with either 50 nM BIM I or LY333531 for 10 mins prior and 10 mins following bolus antimycin treatment in order to inhibit specific PKC isoforms involved in the development of hyperexcitability. At the end of the experiment we determined the bronchopulmonary C-fiber response to the TRPV1 agonist capsaicin (1 μM) in order to confirm nociceptive status of the afferent. Due to the irreversible inhibition of complex III by antimycin (Stowe and Camara, 2009; Turrens et al., 1985), only one antimycin A treatment was used per preparation.
C-fiber hyperexcitability to α,β-mATP treatment was quantified by dividing the total number of action potentials discharged within 120s after antimycin A treatment by the total number of action potentials discharged within 120s before antimycin A treatment as before (Hadley et al., 2014) and then multiplying by 100. This normalized quantification of excitability could then be compared between different treatment groups using a one-way ANOVA using Sidak’s multiple comparisons test (p<0.05 taken as significant). In total 75 C-fibers from 75 mice were studied.
3. Results
We used immunofluorescence to characterize the expression of eight PKC isoforms (α, β1, β2, γ, δ, ε, θ and μ) in the vagal nodose ganglia of TRPV1Cre/+/ROSA26-tdTomatofl/+ (TRPV1-tdtomato) mice (Fig 1A), which express tdTomato in TRPV1-lineage nociceptive vagal neurons (Kim et al., 2020; Stanford et al., 2019). As expected, tdTomato expression was noted in a substantial subset of vagal nodose neurons in all slices (Figs 1A and B). PKCβ1, PKCδ and PKCε were widely expressed in vagal nodose neurons and >97% of tdTomato+ neurons expressed these isoforms (Fig 1). PKCα was expressed in a subset of vagal nodose neurons (Fig 1A and B), and was preferentially co-expressed with tdTomato (Fig 1C). Overall, 50±4.8% of tdTomato+ neurons expressed PKCα (Fig 1D). Unlike PKCβ1, PKCβ2 expression was restricted to a minor subset of vagal nodose neurons, with only 15±2.8% of tdTomato+ neurons expressing this isoform (Fig 1). We found no evidence of PKCγ, PKCθ or PKCμ expression in vagal neurons (Fig 1). In general, PKC isoform expression was located in the cytosol of vagal neurons, although PKCδ was also observed in the nucleus of vagal neurons. It should be noted that the nodose vagal ganglia, jugular vagal ganglia and the petrosal ganglia (which projects the glossopharyngeal nerve) are fused in the mouse. Although the grossly identifiable nodose ganglia is the largest portion of this complex (Kim et al., 2020; Nassenstein et al., 2010), it is possible that some of the neurons presented in Fig. 1 are jugular or petrosal neurons.
Figure 1:
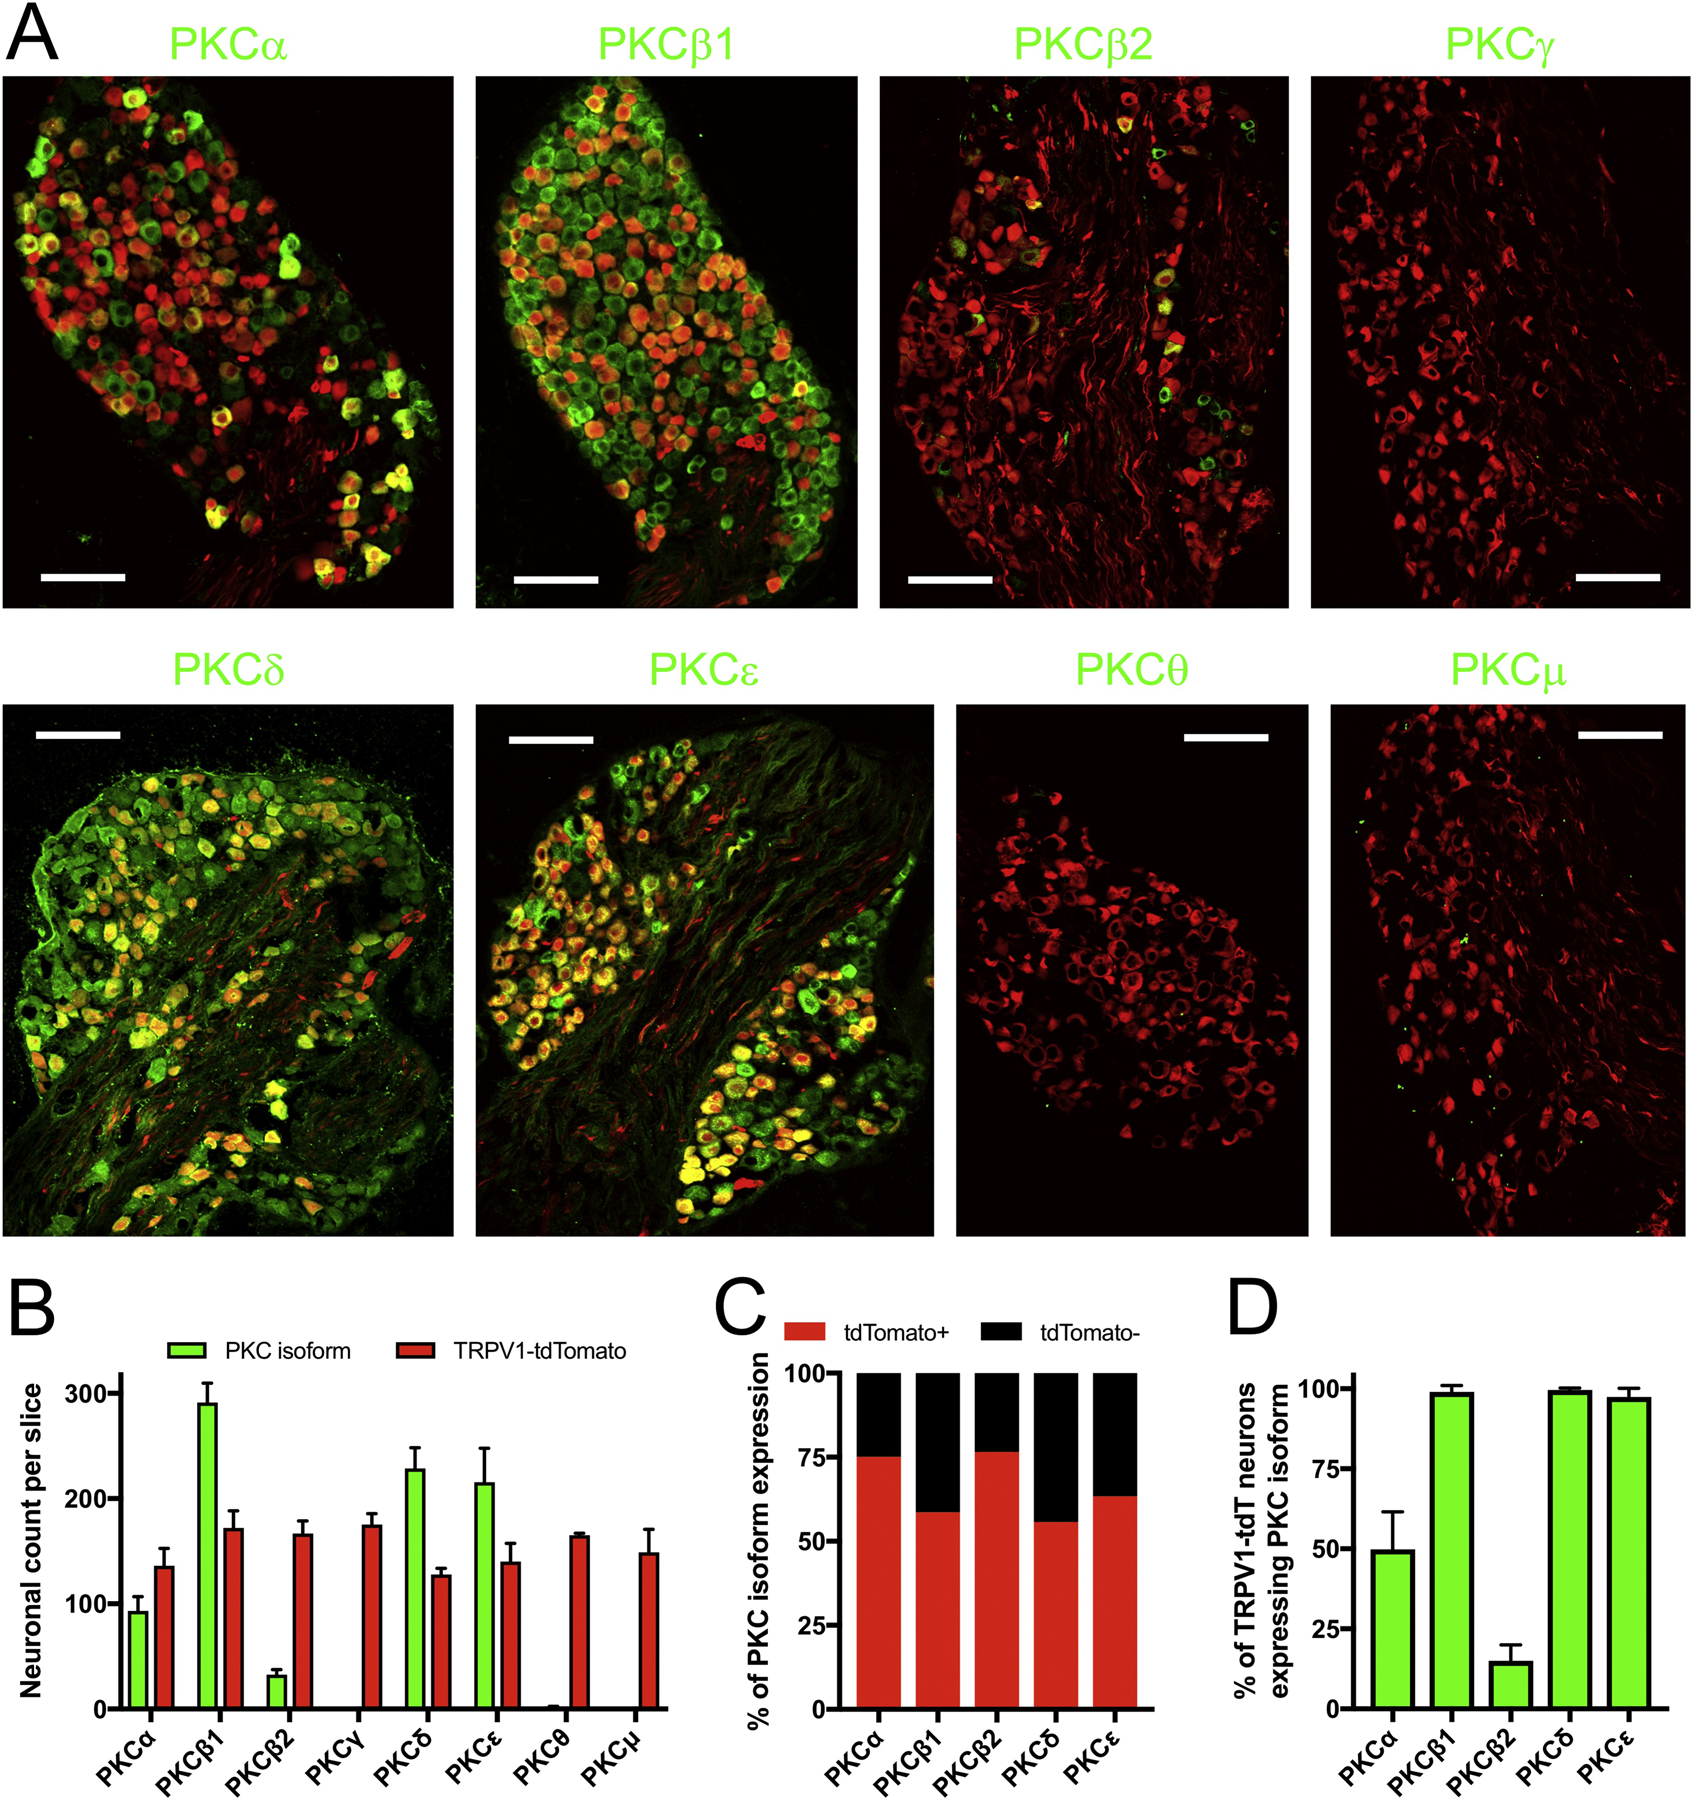
Immunofluorescence characterization of PKC isoform expression in vagal sensory ganglia of TRPV1-tdTomato mice. A, specific isoform immunoreactivity determined by selective primary antibody (e.g. PKCα) shown in green. tdTomato (identifying TRPV1-lineage neurons) shown in red. Scale denotes 100 μm. B, mean±SEM of the number of neurons with specific PKC isoform immunoreactivity (green columns) and tdTomato expression (red columns) in each slice (n>3 slices). C, the % of neurons with specific PKC isoform immunoreactivity that are tdTomato+ or tdTomato−. D, mean±SEM of the percentage of tdTomato-expressing neurons that also expressed specific PKC isoform immunoreactivity (n>3 slices).
Typically, quiescent PKC isoforms are located in the cytosol, and upon activation translocate to the plasma membrane in order to phosphorylate target proteins (Cosentino-Gomes et al., 2012). We have previously shown that antimycin A caused the translocation of PKC (identified by a pan-PKC antibody) from the cytosol to the plasma membrane of some dissociated vagal neurons in vitro (Hadley et al., 2014). Here, we used immunocytochemistry to investigate the antimycin-evoked translocation of vagal PKC isoforms (α, β1, β2, δ and ε) in vagal nodose neurons dissociated from TRPV1-tdTomato mice. Again, a subset of vagal neurons expressed tdTomato, identifying them as TRPV1-lineage nociceptive neurons. Consistent with our immunofluorescence data, most dissociated neurons expressed PKCβ1, PKCδ and PKCε, whereas PKCα and PKCβ2 were only expressed in subsets of vagal neurons (Figs 2, 3 and 4). The vast majority of PKC isoform immunoreactivity was observed within the cytosol of vagal neurons under control conditions, although some PKCδ immunoreactivity was observed in the nucleus (Figs 2, 3 and 4). Treatment with the cPKC and nPKC activator PMA (300 nM, 2mins) caused translocation of PKCα to the plasma membrane in tdTomato+ neurons (p<0.05), but this did not reach significance in tdTomato− neurons (p=0.11) (Fig 2). PMA caused translocation of PKCβ1 to the membrane in only a few neurons (Fig 3A), and this reached significance for the tdTomato+ population (p<0.05) but not the tdTomato− population (p>0.05)(Fig 3B). PMA caused translocation of PKCβ2, PKCδ and PKCε to the plasma membrane in both tdTomato+ and tdTomato− populations (p<0.05) (Figs 3 and 4). Treatment of vagal neurons with antimycin A (10 μM, 10 mins) caused the translocation of PKCα, but this only occurred in tdTomato+ neurons (p<0.05)(Fig 2). Antimycin A failed to induce the translocation of other PKC isoforms (p>0.05 in all cases)(Figs 3 and 4).
Figure 2:

Translocation of PKCα in vagal neurons in response to antimycin A and PMA. A and B, single z-plane representative images of dissociated cells fixed following control (0.1% ethanol, 10 mins), antimycin A (10 μM, 10 mins) or PMA (300 nM, 2 mins). PKCα immunoreactivity shown in green. Nuclei stained with DAPI (in blue). A, tdTomato shown in red with TRPV1-lineage neurons identified by white arrowheads. Scale denotes 20 μm. B, high magnification images of PKCα immunoreactivity in individual tdTomato+ neurons following control, antimycin A or PMA (upper panels). Scale denotes 10 μm. PKCα immunoreactivity was determined along the single white and presented against distance in lower panels. C, quantification of the PKCα membrane/cytosol ratio in tdTomato+ (red) and tdTomato− (black) neurons in response to control (Con), antimycin A (AA) and PMA. Box and whisker plots represent the median with 2.5 to 97.5 percentile, with outliers identified by individual points. * denotes significant difference from control conditions (p<0.05). n numbers in each group are shown in parentheses below each plot.
Figure 3:
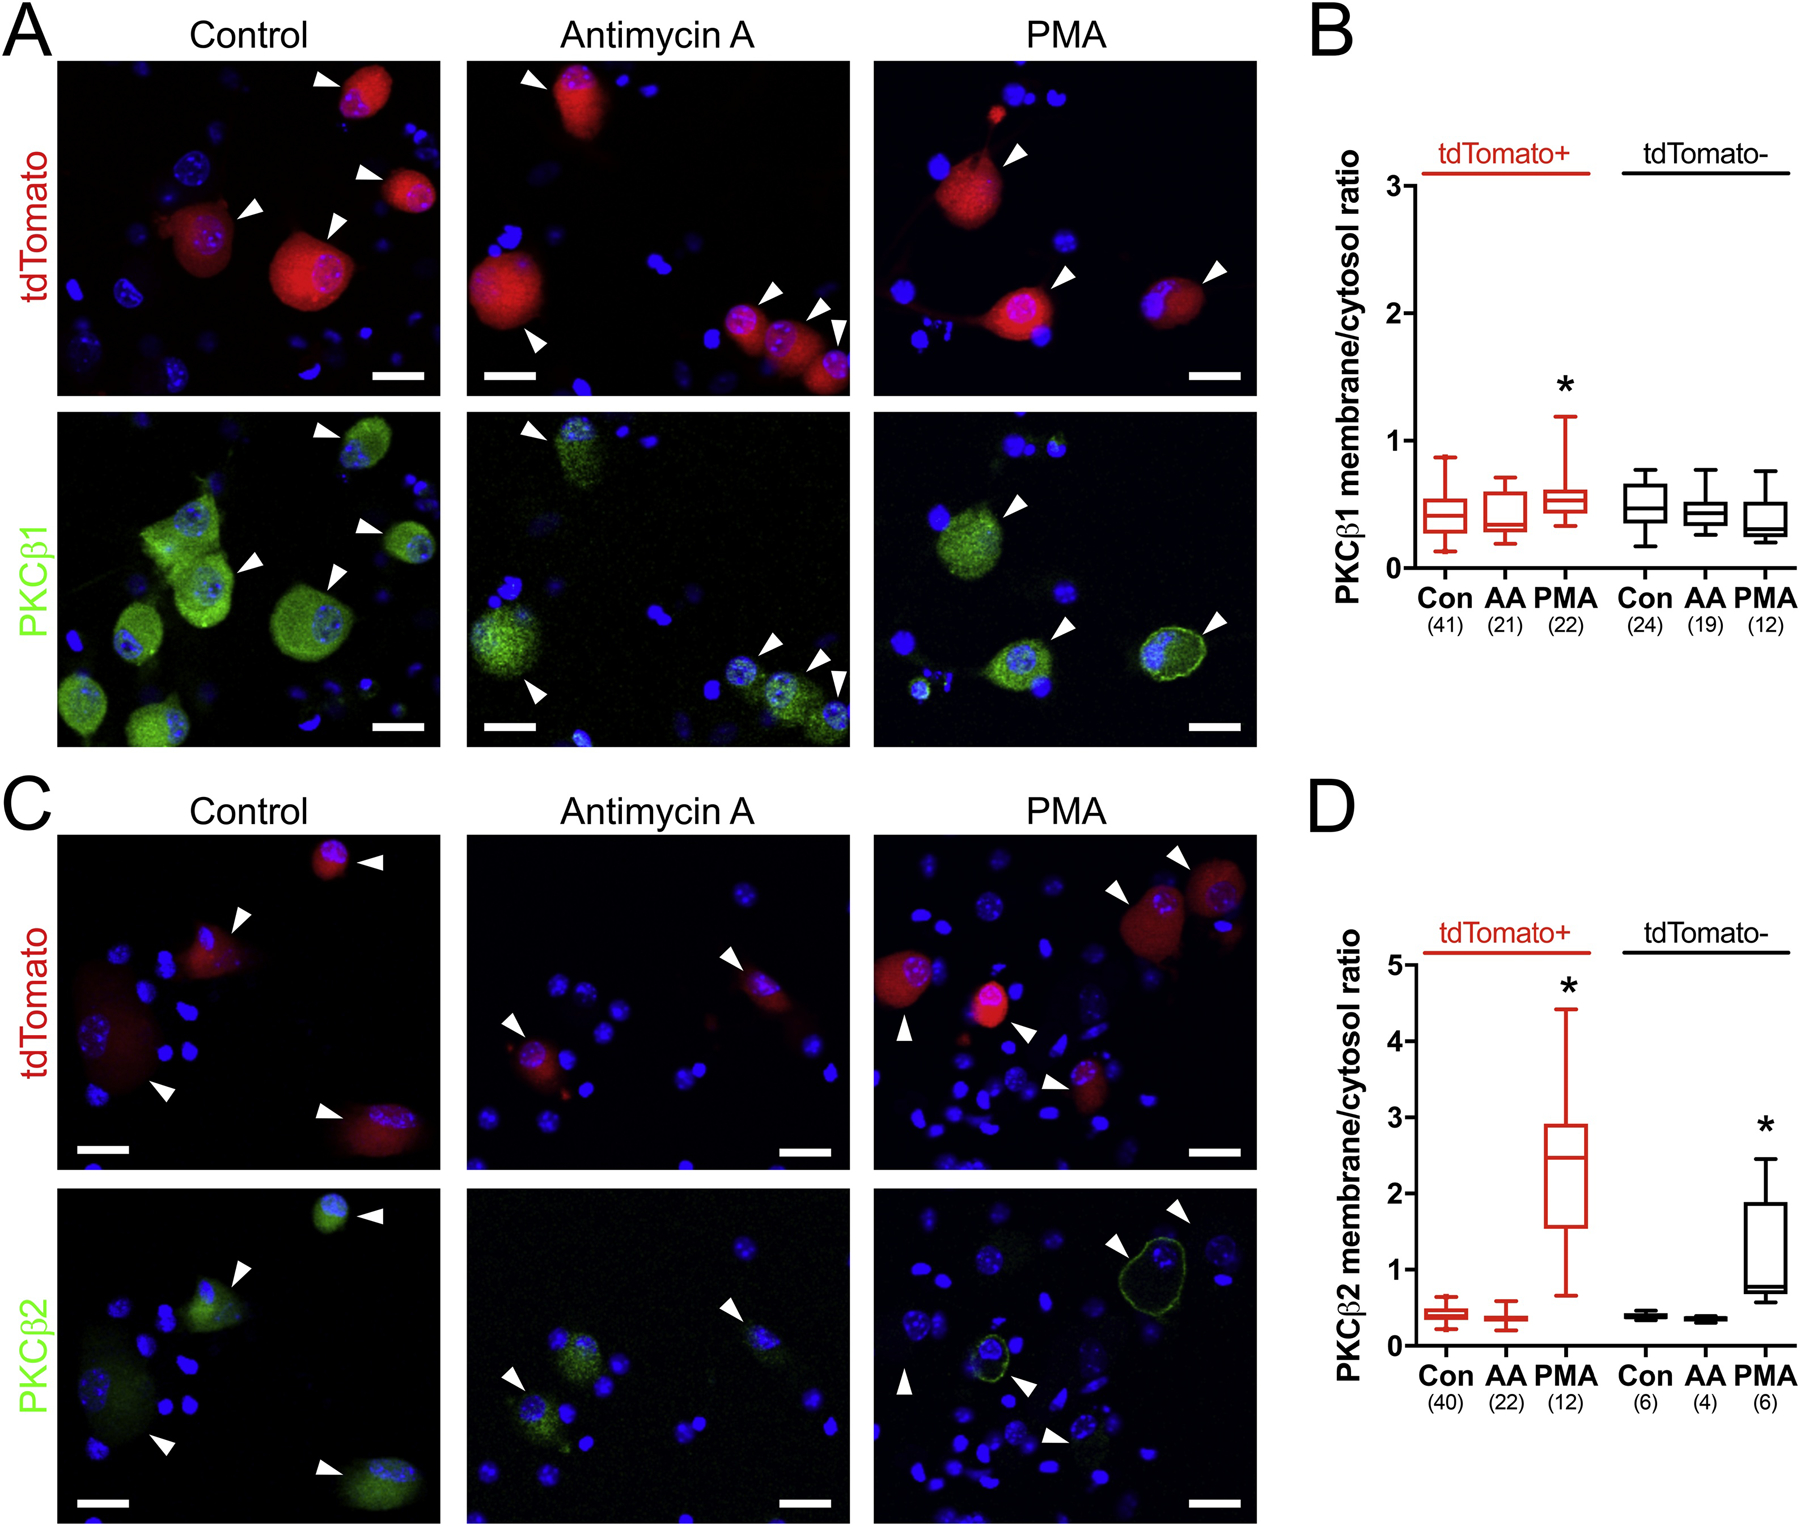
Translocation of PKCβ isoforms in vagal neurons in response to antimycin A and PMA. A, and C, single z-plane representative images of dissociated cells fixed following control (0.1% ethanol, 10 mins), antimycin A (10 μM, 10 mins) or PMA (300 nM, 2 mins). Specific PKCβ isoform immunoreactivity shown in green. tdTomato shown in red with TRPV1-lineage neurons identified by white arrowheads. Nuclei stained with DAPI (in blue). Scale denotes 20 μm. B and D, quantification of the PKC isoform membrane/cytosol ratio in tdTomato+ (red) and tdTomato− (black) neurons in response to control (Con), antimycin A (AA) and PMA. Box and whisker plots represent the median with 2.5 to 97.5 percentile, with outliers identified by individual points. * denotes significant difference from control conditions (p<0.05). n numbers in each group are shown in parentheses below each plot. A and B, PKCβ1. C and D, PKCβ2.
Figure 4:

Translocation of nPKC isoforms in vagal neurons in response to antimycin A and PMA. A and C, single z-plane representative images of dissociated cells fixed following control (0.1% ethanol, 10 mins), antimycin A (10 μM, 10 mins) or PMA (300 nM, 2 mins). Specific isoform immunoreactivity shown in green. tdTomato shown in red with TRPV1-lineage neurons identified by white arrowheads. Nuclei stained with DAPI (in blue). Scale denotes 20 μm. B and D, quantification of the PKC isoform membrane/cytosol ratio in tdTomato+ (red) and tdTomato− (black) neurons in response to control (Con), antimycin A (AA) and PMA. Box and whisker plots represent the median with 2.5 to 97.5 percentile, with outliers identified by individual points. * Significant difference from control conditions (p<0.05). n numbers in each group are shown in parentheses below each plot. A and B, PKCδ. C and D, PKCε.
To investigate the role of PKCα in the antimycin-induced hyperexcitability of bronchopulmonary C-fibers, we have studied single fiber recordings in a mouse ex vivo lung-vagal ganglia preparation. The action potential discharge evoked from C-fiber terminals within the lung by α,β-mATP (30 μM), the selective P2X2/3 agonist that activates almost all vagal nodose bronchopulmonary C-fibers (Nassenstein et al., 2010; Undem et al., 2004), was determined before and 10 mins after bolus treatment with either vehicle (0.1% ethanol) or antimycin A (20 μM). In some cases, lungs were pretreated with PKC inhibitors to assess the role of specific PKC isoforms. In total 75 individual C-fibers were studied, with conduction velocities ranging from 0.35 to 0.68 m/s (mean 0.52 m/s), identifying them as slowly conducting C-fibers with activation profiles consistent with vagal nociceptors (Kollarik et al., 2003). There were no differences in the conduction velocities of fibers allocated to specific experimental groups (p>0.05, not shown). As expected, α,β-mATP-induced action potential discharge in bronchopulmonary C-fibers was reproducible under control/vehicle conditions (n=28, mean excitability of 100.0±5.9%, range 47.6 – 183%, Fig 5). Consistent with our previous study (Hadley et al., 2014), α,β-mATP-evoked responses in these slow C-fibers were significantly augmented following treatment with antimycin A (n=28, mean excitability of 319.7±38%, range 66.4 – 888%, p<0.05 compared to vehicle, Fig 5). We pretreated the lungs with 50 nM BIM I, which is expected to inhibit only PKCα, PKCβ1 and PKCβ2 (Anastassiadis et al., 2011; Way et al., 2000; Wu-Zhang and Newton, 2013), for 10 mins prior and 10 mins following bolus antimycin treatment. BIM I abolished antimycin-evoked C-fiber hyperexcitability (n=11, mean excitability of 115.8±9.0%, range 82.4 – 172%, p<0.05 compared to antimycin alone, Fig 5). We also pretreated the lungs with 50 nM LY333531, which is expected to inhibit only PKCβ1 and PKCβ2 (Anastassiadis et al., 2011; Way et al., 2000; Wu-Zhang and Newton, 2013) for 10 mins prior and 10 mins following bolus antimycin treatment. LY333531 failed to inhibit the antimycin-evoked C-fiber hyperexcitability (n=8, mean excitability of 259.7±50%, range 121 – 558%, p<0.05 compared to vehicle, p>0.05 compared to antimycin alone, Fig 5). Consistent with their C-fiber conduction velocities, all C-fibers responded to the TRPV1 agonist capsaicin (1 μM) with a peak discharge of 19±1.6 Hz.
Figure 5:

Antimycin-induced bronchopulmonary C-fiber hyperexcitability is dependent on PKCα signaling. A, representative action potential discharge in single bronchopulmonary C-fibers in response to paired challenges with α,β-mATP (30 μM), separated by control conditions, or treatment with either antimycin A (20 μM), or antimycin A with BIM I (50 nM) or antimycin A with LY333531 (50 nM). B, mean±SEM response to 2nd application of α,β-mATP normalized to response to 1st application of α,β-mATP prior to either vehicle (white bar, n=28), antimycin A (20 μM, black bar, n=28), antimycin A with BIM I (50 nM, black bar, n=11) or antimycin A with LY333531 (50 nM, black bar, n=8) in bronchopulmonary C-fibers. * Significant increase in 2nd α,β-mATP-induced responses compared to vehicle (p<0.05). # Significant decrease in 2nd α,β-mATP-induced responses compared to antimycin A alone (p<0.05).
4. Discussion
Our previous work has shown that mitochondrial dysfunction evoked by antimycin A has profound effects on a subset of bronchopulmonary C-fibers. We have shown that antimycin A evoked action potential discharge from slowly conducting vagal bronchopulmonary C-fibers via the gating of TRPA1 and TRPV1 (Nesuashvili et al., 2013; Stanford et al., 2019). This activation typically lasted for 2–7 mins. In addition, antimycin A induced a state of hyperexcitability to both mechanical and chemical stimuli in these TRPV1-expressing C-fibers (Hadley et al., 2014). Nevertheless, this hyperexcitability was independent of TRPA1 and TRPV1 (Hadley et al., 2014). Using a concentration of BIM I (1 μM) that would be expected to completely inhibit cPKC and nPKC isoforms and partially inhibit aPKC isoforms, we previously showed that PKC was required for the antimycin-induced hyperexcitability (Hadley et al., 2014). The inactive analog BIM V (1 μM) had no effect on the antimycin-induced hyperexcitability. In this study, we have identified PKCα as the likely candidate for mediating the antimycin-induced hyperexcitability of bronchopulmonary C-fibers.
Our immunofluorescence and immunocytochemistry data indicate that multiple PKC isoforms are expressed in vagal sensory afferents. We found that PKCβ1, PKCδ and PKCε were expressed in a large number of nodose neurons, including almost all nociceptive TRPV1-lineage neurons. Whereas PKCα and PKCβ2 were only expressed in subsets of vagal neurons (~50% and ~15% of TRPV1-lineage neurons, respectively). We found no evidence for PKCγ, PKCθ or PKCμ expression. PKC isoforms have not previously been studied at the protein level in vagal neurons, but deep sequencing of mRNA in vagal neurons supports our observations of the expression of multiple isoforms (although PKCβ1 and PKCβ2 are not distinguished in these assays). Low input analysis of vagal neurons pre-allocated to TRPV1+ and TRPV1− groups indicated that transcripts for PKCα, PKCβ, PKCδ, PKCε, PKCλ and PKCζ were detectable in both groups, whereas transcripts for PKCθ was only observed in TRPV1+ neurons and transcripts for PKCμ was only observed in TRPV1− neurons (Wang et al., 2017). Single cell RNA sequencing of vagal neurons has identified transcripts for PKCα, PKCβ, PKCδ, PKCε, PKCζ and PKCθ in various nociceptive clusters (Kupari et al., 2019). Similarly, single cell RNA sequencing of airway-specific vagal neurons identified transcripts for PKCα, PKCβ, PKCδ, PKCε, PKCζ, PKCλ and PKCμ in specific clusters (Mazzone et al., 2019). In general, the transcript data supports our positive immunofluorescence and immunocytochemistry signals for PKCα, PKCβ1, PKCβ2, PKCδ and PKCε in vagal nociceptive neurons. Furthermore, the lack of PKCγ expression reported here is consistent with the published transcript data. Nevertheless, we also found no evidence of PKCθ or PKCμ expression in vagal neurons, which were previously identified at the transcript level. It is possible that these reported transcripts do not yield detectable protein. The expression pattern of PKC isoforms in vagal neurons is similar to western blot and immunocytochemistry data in DRG neurons (PKCα, PKCβ1, PKCβ2, PKCδ, PKCε, and PKCζ) (Cesare et al., 1999; Olah et al., 2002), although the single cell RNA sequencing of these neurons (Usoskin et al., 2015) also has minor discrepancies with the protein expression.
Of the 5 PKC isoforms detected in the vagal nodose ganglia, only PKCα translocated from the cytosol to the plasma membrane in vagal neurons in response to antimycin A. Interestingly, this only occurred in TRPV1-lineage neurons. This is consistent with our previous report that antimycin A only causes hyperexcitability in slowly conducting C-fibers (which are the only airway afferents in the mouse that express TRPV1) (Hadley et al., 2014). There are no selective small molecule inhibitors of PKCα, thus we took a combinatory approach with the PKC inhibitors BIM I and LY333531. Although BIM I can inhibit all PKC isoforms, the reported IC50 for PKCα (8.4 nM), PKCβ (18 nM), PKCδ (210 nM), PKCε (132 nM) and PKCζ (5.8 μM) (Way et al., 2000) suggests that some degree of selectivity can be achieved at lower doses. 50nM BIM I completely abolished the antimycin-induced C-fiber hyperexcitability, suggesting the possible involvement of PKCα, PKCβ1 or PKCβ2. LY333531 is a selective inhibitor of PKCβ1 and PKCβ2 (IC50 of 4.7 and 5.9 nM, respectively), with little effect on PKCα (360 nM), PKCδ (250 nM), PKCε (600 nM) and PKCζ (>10 μM) (Way et al., 2000). 50nM LY333531 had no effect on antimycin-induced C-fiber hyperexcitability, thus suggesting that PKCα, rather than PKCβ1 or PKCβ2, was critical to this response.
The importance of PKCα in mediating bronchopulmonary C-fiber hyperexcitability caused by antimycin is somewhat inconsistent with our immunohistochemistry that indicated only 50% of vagal nodose neurons expressed PKCα. Based upon the range of antimycin-evoked hyperexcitability measured in our electrophysiological studies, it is possible that not all C-fibers became hyperexcitable. It is also possible that PKCα is present in a greater proportion of TRPV1-expressing afferents innervating the airways compared to other organs. Although we did not determine the expression of PKCα in airway afferents specifically, this hypothesis is consistent with single neuron transcriptomics of vagal sensory afferents, which demonstrated measurable PKCα transcripts in almost all neurons that also contain TRPV1 transcripts (Mazzone et al., 2019).
The mechanism linking antimycin-induced mitochondrial dysfunction with PKCα activation in vagal nociceptors is presently unclear. PKCα is activated in the multiple tissues during inflammation/injury (Dempsey et al., 2007; Geraldes and King, 2010; Tseng et al., 2019). Our previous studies show that both the PKC translocation and the C-fiber hyperexcitability evoked by antimycin was mimicked by H2O2 and was inhibited by antioxidants (Hadley et al., 2014), thus suggesting a role for mitochondrial ROS. Redox regulation of PKC isoforms appears to be highly dependent on isoform, cell type and other biological variables (Cosentino-Gomes et al., 2012). At low concentrations, ROS have been shown to directly activate and induce translocation to the plasma membrane of PKCα, PKCβ1, PKCβ2, PKCγ, PKCδ, PKCε and PKCζ via oxidation of cysteines in the zinc fingers within the regulatory domain (Knapp and Klann, 2000; Konishi et al., 1997). At high concentrations (e.g. 10mM H2O2), ROS inactivate PKC via cysteine oxidation within the catalytic kinase domain. In other cell types, redox activation has largely focused on PKCα, PKCδ and PKCε signaling (Bouwman et al., 2007; Costa et al., 2006; Li et al., 1999; Muscella et al., 2015; Thamilselvan et al., 2009; Tseng et al., 2019). That only PKCα was activated in the vagal neurons suggests that other unknown factors may regulate this cascade. Furthermore, we have previously shown that antimycin A evokes similar mitochondrial membrane depolarization and mitochondrial ROS production in TRPV1+ and TRPV1− vagal neurons (Stanford and Taylor-Clark, 2018), thus it is likely that some additional unknown factor is required for the selective translocation of PKCα in TRPV1-lineage neurons.
Activation of PKC causes non-specific hyperexcitability of both vagal and DRG nociceptive afferents (Baker, 2005; Hadley et al., 2014; Ikeda et al., 2005; Matsumoto et al., 2007; Wu et al., 2012), likely via the phosphorylation of plasma membrane proteins, including voltage-gated sodium channels. Afferent PKCε was first identified as a major regulator of hyperalgesia in the somatosensory system (Cesare et al., 1999; Joseph and Levine, 2010; Wu et al., 2012). More recently, afferent PKCα has also been implicated in hyperalgesia (Bai et al., 2020; Ferreira et al., 2005; Gu et al., 2016; Gu et al., 2018). These DRG studies provide support for the role of PKCα in vagal nociceptive hyperexcitability identified in this study.
In summary, we have determined the PKC isoforms expressed in the soma of vagal sensory neurons, and we have shown that antimycin A causes the translocation of only PKCα in vagal TRPV1-lineage sensory neurons. Although we have not visualized PKCα or its translocation in the peripheral terminals of vagal bronchopulmonary C-fibers, exposure of these peripheral terminals to a PKCα inhibitor prevented the development of antimycin-induced C-fiber hyperexcitability. Multiple lines of evidence suggest that mitochondria are a target of inflammatory signaling in multiple disease states including diabetes mellitus, cardiovascular disease, asthma and irritable bowel syndrome, in particular causing mitochondrial ROS production (Sena and Chandel, 2012). The evidence provided here suggests a mechanism by which mitochondrial dysfunction can induce afferent hyperexcitability, which may contribute to the airway hyperreflexia (cough, wheeze, bronchospasm) associated with inflammatory airway diseases (Carr and Lee, 2005; McAlexander et al., 2015; Trankner et al., 2014; Undem and Taylor-Clark, 2014). It is also possible that this mechanism contributes to sensory dysfunction in inflammatory states in other tissues.
Highlights.
Vagal sensory neurons express multiple PKC isoforms
Antimycin causes translocation of only PKCα, only in TRPV1-lineage vagal neurons
Antimycin causes hyperexcitability of bronchopulmonary C-fibers via PKCα
Acknowledgements
This work was supported by the National Institutes of Health (R01HL119802).
Abbreviations
- α,β-mATP
α,β-methylene ATP
- BIM I
bisindolylmaleimide I
- BSA
bovine serum albumin
- DRG
dorsal root ganglion
- FA
formaldehyde
- PMA
phorbol-12-myristate-13-acetate
- PBS
phosphate-buffered saline
- PKC
Protein kinase C
- TRPA1
Transient receptor potential ankyrin 1
- TRPV1
Transient receptor potential vanilloid 1
Footnotes
Publisher's Disclaimer: This is a PDF file of an unedited manuscript that has been accepted for publication. As a service to our customers we are providing this early version of the manuscript. The manuscript will undergo copyediting, typesetting, and review of the resulting proof before it is published in its final form. Please note that during the production process errors may be discovered which could affect the content, and all legal disclaimers that apply to the journal pertain.
References
- Anastassiadis T, et al. , 2011. Comprehensive assay of kinase catalytic activity reveals features of kinase inhibitor selectivity. Nat Biotechnol. 29, 1039–45. [DOI] [PMC free article] [PubMed] [Google Scholar]
- Bai Q, et al. , 2020. Protein kinase C-alpha upregulates sodium channel Nav1.9 in nociceptive dorsal root ganglion neurons in an inflammatory arthritis pain model of rat. J Cell Biochem. 121, 768–778. [DOI] [PubMed] [Google Scholar]
- Baker MD, 2005. Protein kinase C mediates up-regulation of tetrodotoxin-resistant, persistent Na+ current in rat and mouse sensory neurones. J Physiol. 567, 851–67. [DOI] [PMC free article] [PubMed] [Google Scholar]
- Bell EL, et al. , 2007. The Qo site of the mitochondrial complex III is required for the transduction of hypoxic signaling via reactive oxygen species production. J Cell Biol. 177, 1029–36. [DOI] [PMC free article] [PubMed] [Google Scholar]
- Bouwman RA, et al. , 2007. Sevoflurane-induced cardioprotection depends on PKC-alpha activation via production of reactive oxygen species. Br J Anaesth. 99, 639–45. [DOI] [PubMed] [Google Scholar]
- Carr MJ, Lee LY, 2005. Plasticity of peripheral mechanisms of cough. Respir Physiol Neurobiol. [DOI] [PubMed] [Google Scholar]
- Cesare P, et al. , 1999. Specific involvement of PKC-epsilon in sensitization of the neuronal response to painful heat. Neuron. 23, 617–24. [DOI] [PubMed] [Google Scholar]
- Chowdhury SK, Smith DR, Fernyhough P, 2012. The role of aberrant mitochondrial bioenergetics in diabetic neuropathy. Neurobiol Dis. [DOI] [PubMed] [Google Scholar]
- Corda S, et al. , 2001. Rapid reactive oxygen species production by mitochondria in endothelial cells exposed to tumor necrosis factor-alpha is mediated by ceramide. Am J Respir Cell Mol Biol. 24, 762–8. [DOI] [PubMed] [Google Scholar]
- Cosentino-Gomes D, Rocco-Machado N, Meyer-Fernandes JR, 2012. Cell Signaling through Protein Kinase C Oxidation and Activation. Int J Mol Sci. 13, 10697–721. [DOI] [PMC free article] [PubMed] [Google Scholar]
- Costa AD, et al. , 2006. The mechanism by which the mitochondrial ATP-sensitive K+ channel opening and H2O2 inhibit the mitochondrial permeability transition. J Biol Chem. 281, 20801–8. [DOI] [PubMed] [Google Scholar]
- Dempsey EC, Cool CD, Littler CM, 2007. Lung disease and PKCs. Pharmacol Res. 55, 545–59. [DOI] [PubMed] [Google Scholar]
- Ferreira J, et al. , 2005. Mechanisms involved in the nociception produced by peripheral protein kinase c activation in mice. Pain. 117, 171–81. [DOI] [PubMed] [Google Scholar]
- Geraldes P, King GL, 2010. Activation of protein kinase C isoforms and its impact on diabetic complications. Circ Res. 106, 1319–31. [DOI] [PMC free article] [PubMed] [Google Scholar]
- Gu Y, et al. , 2016. Epac-protein kinase C alpha signaling in purinergic P2X3R-mediated hyperalgesia after inflammation. Pain. 157, 1541–50. [DOI] [PMC free article] [PubMed] [Google Scholar]
- Gu Y, Li G, Huang LYM, 2018. Inflammation induces Epac-protein kinase C alpha and epsilon signaling in TRPV1-mediated hyperalgesia. Pain. 159, 2383–2393. [DOI] [PubMed] [Google Scholar]
- Hadley SH, Bahia PK, Taylor-Clark TE, 2014. Sensory nerve terminal mitochondrial dysfunction induces hyperexcitability in airway nociceptors via protein kinase C. Mol Pharmacol. 85, 839–48. [DOI] [PMC free article] [PubMed] [Google Scholar]
- Hall KE, Wiley JW, 1998. Neural injury, repair and adaptation in the GI tract. I. New insights into neuronal injury: a cautionary tale. Am J Physiol. 274, G978–83. [DOI] [PubMed] [Google Scholar]
- Hooper JS, et al. , 2016. Characterization of cardiovascular reflexes evoked by airway stimulation with allylisothiocyanate, capsaicin, and ATP in Sprague-Dawley rats. J Appl Physiol (1985). 120, 580–91. [DOI] [PMC free article] [PubMed] [Google Scholar]
- Huang TJ, et al. , 2005. Neurotrophin-3 prevents mitochondrial dysfunction in sensory neurons of streptozotocin-diabetic rats. Exp Neurol. 194, 279–83. [DOI] [PubMed] [Google Scholar]
- Hung KS, et al. , 1973. Ultrastructure of nerves and associated cells in bronchiolar epithelium of the mouse lung. J Ultrastruct Res. 43, 426–37. [DOI] [PubMed] [Google Scholar]
- Ikeda M, et al. , 2005. The effect of PKC activity on the TTX-R sodium currents from rat nodose ganglion neurons. Life Sci. 78, 47–53. [DOI] [PubMed] [Google Scholar]
- Joseph EK, Levine JD, 2010. Multiple PKCepsilon-dependent mechanisms mediating mechanical hyperalgesia. Pain. 150, 17–21. [DOI] [PMC free article] [PubMed] [Google Scholar]
- Kim SH, et al. , 2020. Mapping of sensory nerve subsets within the vagal ganglia and the brainstem using reporter mice for Pirt, TRPV1, 5HT3 and Tac1 expression. eNeuro. [DOI] [PMC free article] [PubMed] [Google Scholar]
- Knapp LT, Klann E, 2000. Superoxide-induced stimulation of protein kinase C via thiol modification and modulation of zinc content. J Biol Chem. 275, 24136–45. [DOI] [PubMed] [Google Scholar]
- Kollarik M, et al. , 2003. Capsaicin-sensitive and -insensitive vagal bronchopulmonary C-fibres in the mouse. J Physiol. 551, 869–79. [DOI] [PMC free article] [PubMed] [Google Scholar]
- Konishi H, et al. , 1997. Activation of protein kinase C by tyrosine phosphorylation in response to H2O2. Proc Natl Acad Sci U S A. 94, 11233–7. [DOI] [PMC free article] [PubMed] [Google Scholar]
- Kubin L, et al. , 2006. Central pathways of pulmonary and lower airway vagal afferents. J Appl Physiol. 101, 618–27. [DOI] [PMC free article] [PubMed] [Google Scholar]
- Kupari J, et al. , 2019. An Atlas of Vagal Sensory Neurons and Their Molecular Specialization. Cell Rep. 27, 2508–2523.e4. [DOI] [PMC free article] [PubMed] [Google Scholar]
- Lee LY, 2009. Respiratory sensations evoked by activation of bronchopulmonary C-fibers. Respir Physiol Neurobiol. 167, 26–35. [DOI] [PMC free article] [PubMed] [Google Scholar]
- Li PF, et al. , 1999. Requirement for protein kinase C in reactive oxygen species-induced apoptosis of vascular smooth muscle cells. Circulation. 100, 967–73. [DOI] [PubMed] [Google Scholar]
- Matsumoto S, et al. , 2007. Effect of 8-bromo-cAMP on the tetrodotoxin-resistant sodium (Nav 1.8) current in small-diameter nodose ganglion neurons. Neuropharmacology. 52, 904–24. [DOI] [PubMed] [Google Scholar]
- Mazzone SB, Undem BJ, 2016. Vagal Afferent Innervation of the Airways in Health and Disease. Physiol Rev. 96, 975–1024. [DOI] [PMC free article] [PubMed] [Google Scholar]
- Mazzone SB, et al. , 2019. Transcriptional Profiling of Individual Airway Projecting Vagal Sensory Neurons. Mol Neurobiol. [DOI] [PubMed] [Google Scholar]
- McAlexander MA, et al. , 2015. Vagotomy reverses established allergen-induced airway hyperreactivity to methacholine in the mouse. Respir Physiol Neurobiol. 212–214, 20–4. [DOI] [PMC free article] [PubMed] [Google Scholar]
- Muscella A, et al. , 2015. PKC-delta/PKC-alpha activity balance regulates the lethal effects of cisplatin. Biochem Pharmacol. 98, 29–40. [DOI] [PubMed] [Google Scholar]
- Nassenstein C, et al. , 2010. Phenotypic distinctions between neural crest and placodal derived vagal C-fibres in mouse lungs. J Physiol. 588, 4769–83. [DOI] [PMC free article] [PubMed] [Google Scholar]
- Nesuashvili L, et al. , 2013. Sensory nerve terminal mitochondrial dysfunction activates airway sensory nerves via transient receptor potential (TRP) channels. Mol Pharmacol. 83, 1007–19. [DOI] [PMC free article] [PubMed] [Google Scholar]
- Olah Z, Karai L, Iadarola MJ, 2002. Protein kinase C(alpha) is required for vanilloid receptor 1 activation. Evidence for multiple signaling pathways. J Biol Chem. 277, 35752–9. [DOI] [PubMed] [Google Scholar]
- Pehar M, et al. , 2007. Mitochondrial superoxide production and nuclear factor erythroid 2-related factor 2 activation in p75 neurotrophin receptor-induced motor neuron apoptosis. J Neurosci. 27, 7777–85. [DOI] [PMC free article] [PubMed] [Google Scholar]
- Reddy PH, 2011. Mitochondrial Dysfunction and Oxidative Stress in Asthma: Implications for Mitochondria-Targeted Antioxidant Therapeutics. Pharmaceuticals (Basel). 4, 429–456. [DOI] [PMC free article] [PubMed] [Google Scholar]
- Rocha M, et al. , 2010. Oxidative stress and endothelial dysfunction in cardiovascular disease: mitochondria-targeted therapeutics. Curr Med Chem. 17, 3827–41. [DOI] [PubMed] [Google Scholar]
- Sena LA, Chandel NS, 2012. Physiological roles of mitochondrial reactive oxygen species. Mol Cell. 48, 158–67. [DOI] [PMC free article] [PubMed] [Google Scholar]
- Stanford KR, Taylor-Clark TE, 2018. Mitochondrial modulation-induced activation of vagal sensory neuronal subsets by antimycin A, but not CCCP or rotenone, correlates with mitochondrial superoxide production. PLoS One. 13, e0197106. [DOI] [PMC free article] [PubMed] [Google Scholar]
- Stanford KR, et al. , 2019. Antimycin A-induced mitochondrial dysfunction activates vagal sensory neurons via ROS-dependent activation of TRPA1 and ROS-independent activation of TRPV1. Brain Res. 1715, 94–105. [DOI] [PMC free article] [PubMed] [Google Scholar]
- Stowe DF, Camara AK, 2009. Mitochondrial reactive oxygen species production in excitable cells: modulators of mitochondrial and cell function. Antioxid Redox Signal. 11, 1373–414. [DOI] [PMC free article] [PubMed] [Google Scholar]
- Taylor-Clark TE, 2015. Peripheral neural circuitry in cough. Curr Opin Pharmacol. 22, 9–17. [DOI] [PMC free article] [PubMed] [Google Scholar]
- Thamilselvan V, Menon M, Thamilselvan S, 2009. Oxalate-induced activation of PKC-alpha and -delta regulates NADPH oxidase-mediated oxidative injury in renal tubular epithelial cells. Am J Physiol Renal Physiol. 297, F1399–410. [DOI] [PMC free article] [PubMed] [Google Scholar]
- Trankner D, et al. , 2014. Population of sensory neurons essential for asthmatic hyperreactivity of inflamed airways. Proc Natl Acad Sci U S A. 111, 11515–20. [DOI] [PMC free article] [PubMed] [Google Scholar]
- Tseng HC, et al. , 2019. Lysophosphatidylcholine-induced mitochondrial fission contributes to collagen production in human cardiac fibroblasts. J Lipid Res. 60, 1573–1589. [DOI] [PMC free article] [PubMed] [Google Scholar]
- Turrens JF, Alexandre A, Lehninger AL, 1985. Ubisemiquinone is the electron donor for superoxide formation by complex III of heart mitochondria. Arch Biochem Biophys. 237, 408–14. [DOI] [PubMed] [Google Scholar]
- Undem BJ, et al. , 2004. Subtypes of vagal afferent C-fibres in guinea-pig lungs. J Physiol. 556, 905–17. [DOI] [PMC free article] [PubMed] [Google Scholar]
- Undem BJ, Taylor-Clark T, 2014. Mechanisms underlying the neuronal-based symptoms of allergy. J Allergy Clin Immunol. 133, 1521–34. [DOI] [PMC free article] [PubMed] [Google Scholar]
- Usoskin D, et al. , 2015. Unbiased classification of sensory neuron types by large-scale single-cell RNA sequencing. Nat Neurosci. 18, 145–53. [DOI] [PubMed] [Google Scholar]
- von During M, Andres KH, 1988. Structure and functional anatomy of visceroreceptors in the mammalian respiratory system. Prog Brain Res. 74, 139–54. [DOI] [PubMed] [Google Scholar]
- Wang J, et al. , 2017. Distinct and common expression of receptors for inflammatory mediators in vagal nodose versus jugular capsaicin-sensitive/TRPV1-positive neurons detected by low input RNA sequencing. PLoS One. 12, e0185985. [DOI] [PMC free article] [PubMed] [Google Scholar]
- Way KJ, Chou E, King GL, 2000. Identification of PKC-isoform-specific biological actions using pharmacological approaches. Trends Pharmacol Sci. 21, 181–7. [DOI] [PubMed] [Google Scholar]
- West AP, et al. , 2011. TLR signalling augments macrophage bactericidal activity through mitochondrial ROS. Nature. 472, 476–80. [DOI] [PMC free article] [PubMed] [Google Scholar]
- Wu DF, et al. , 2012. PKCepsilon phosphorylation of the sodium channel NaV1.8 increases channel function and produces mechanical hyperalgesia in mice. J Clin Invest. 122, 1306–15. [DOI] [PMC free article] [PubMed] [Google Scholar]
- Wu-Zhang AX, Newton AC, 2013. Protein kinase C pharmacology: refining the toolbox. Biochem J. 452, 195–209. [DOI] [PMC free article] [PubMed] [Google Scholar]