

Abstract
Evaluation of the subtalar joint using conventional radiographs is difficult. The purpose of this study was to assess how the posterior facet of the subtalar joint is projected on eight standard radiographic views of the foot and ankle. Weightbearing computed tomography (CT) scans of 27 volunteers without ankle pathology were performed. Eight standard views of the foot and ankle (antero-posterior [AP] view, mortise view, subtalar view, four different Broden views) were reconstructed using digitally reconstructed radiographs (DRRs). The appearance of the posterior facet of the subtalar joint was assessed for each view. In addition, the position of the joint line was projected onto three-dimensional (3-D) models of the calcaneus. We found (1) on the AP view of the ankle joint, the posterior part of the posterior facet is visualized and appears convex (calcaneal side); (2) on the mortise view of the ankle joint, a slightly more anterior part (compared to the AP view) is visualized and appears either convex or flat; (3) on the subtalar view, the anterior part of the posterior facet is visualized and appears either convex, flat or concave; (4) using the Broden views, the posterior and anterior part of the posterior facet can be visualized. This study clarifies which parts of the posterior facet of the subtalar joint are visualized on eight standard views of the foot and ankle.
Keywords: Subtalar Joint, Weightbearing CT, Imaging, Anatomy
1. Introduction
The role the subtalar joint plays in the development of ankle joint disorders has been investigated extensively in recent years.1,7,9,10,12–15,18,23 It has been suggested that the subtalar joint morphology (e.g. convex vs. flat) and orientation (e.g. slope) specifically of the posterior facet may influence the evolution of ankle osteoarthritis.13,23 In addition, assessment of the subtalar joint during reconstructive surgery (e.g. fixation of calcaneal or talus fractures, correcting osteotomies, etc.) is difficult. For this reason, several radiographic views have been employed to visualize the subtalar joint in a clinical setting. However, the value each of these views provides is uncertain. A previous study found that the usage of conventional radiographs to assess the subtalar joint in both healthy and diseased ankles is limited.12 Nevertheless, research has not systematically evaluated which aspects of the three-dimensional (3-D) anatomy of the subtalar joint are visualized on two-dimensional (2-D) radiographic views commonly used to image the hindfoot region. Such information is critical to developing improved methods to diagnose subtalar pathology.
With the introduction of weightbearing computed tomography (CT) scans, a more detailed analysis of the subtalar joint during loading became possible.4,12 Recent studies using weightbearing CT have shown that the morphology of the posterior facet in the coronal plane differs between individuals.1,7,8,12–15,18 Although a promising technology for imaging the subtalar joint, weightbearing CT scans have yet to become a clinical standard. Bearing this in mind, radiographs will continue to serve as the primary means to assess foot and ankle disorders, including subtalar pathology.4,12
The purpose of this study was to characterize the posterior facet of the subtalar joint on eight standard radiographs of the foot and ankle. For this, the appearance of the posterior facet was assessed by determining the morphology (e.g. convex vs. flat vs. concave; 2-D images), and configuration (e.g. slope; 2-D images). In addition, the aspect of the posterior facet visualized on the same radiographs have been assessed by using 3-D reconstructions of weightbearing CT images as the reference standard. This provides additional understanding which areas of the posterior facet can be visualized on standard radiographs, and how they appear (morphology and configuration) in a healthy cohort. We hypothesized that: I) different viewing perspectives alter the appearance of the posterior facet; and II) various aspects of the posterior facet can be assessed using conventional radiographs.
2. Methods
2.1. Data Source
Institutional Review Board (IRB) approval (Ethics Committee Northwest/ Central Switzerland, BASEC 2016–01343) and a material transfer agreement between the University of Utah, USA, (#5885) and the Kantonsspital Baselland, Switzerland, were obtained with IRB approval at the University of Utah (#65620). Twenty-seven (27) healthy volunteers were included in this study. Baseline characteristics are summarized in Table I. Inclusion criteria were volunteers between 40 to 70 years of age without a history of ankle trauma or surgical procedures. Exclusion criteria were patients with a planovalgus or cavovarus deformity based on clinical and radiographic assessment. The volunteers were examined prior to inclusion by an orthopaedic surgeon.
Table I:
Baseline Characteristics
| Characteristics | Mean (SD, Range) |
|---|---|
| Age (Years) | 50 (7.3, 40–66) |
| Gender (Male : Female; %) | 25.9 : 74.1 |
| Side (Left : Right; %) | 48.1 : 51.9 |
| Height (cm) | 169.4 (6.4, 157–180) |
| Weight (kg) | 72.8 (12.4, 57–102) |
| BMI (kg/m2) | 25.3 (3.8, 18.9–30.4) |
SD, Standard Deviation
2.2. Imaging and Measurements
Each volunteer underwent a weightbearing CT scan (Planmed Verity, Planmed Oy, Helsinki, Finland; 0.2mm slice thickness, 1mm slice interval). These CT scans were used to create 3-D models via segmentation of the tibia, talus, and calcaneus (Amira, v6.0.1, Visage Imaging, San Diego, CA, USA). For one specimen, the midfoot (navicular, cuboid, medial to lateral cuneiform) was additionally segmented to exclude interference from the midfoot during assessment. Next, the ridge of the articular surface of the posterior facet was labeled on the segmented 3-D models of the calcaneus by applying the second principle of curvature (PostView, v2.1.0, FEBio, Salt Lake City, UT, USA). Six anatomic landmarks of the posterior facet of the subtalar joint (calcaneal side) were defined using virtual beads, and included the: (1) antero-medial point, (2) medial point, (3) posterior point, (4) superior point, (5) lateral point, and the (6) antero-lateral point. Calculations of the landmarks were mathematically performed using MATLAB Version R2017b (MathWorks, Natick, MA, USA). The six bead locations were iteratively evaluated to identify the anatomical direction minimums and maximums that fell within the nodal locations identified by the ridge of the articular surface. Therefore, this was mathematically reproducible across patient specific calcaneal surface models. Each calcaneus was aligned in reference to the second metatarsal before the beads were placed. Virtual bead placement was overseen by an orthopaedic surgeon (N.K.) to facilitate correct anatomic placement.
Digitally reconstructed radiographs (DRRs) were reconstructed from the 3-D models by projecting the CT image data to a plane representing eight radiographic views. We chose this approach in-lieu of standard radiographs because we could control the radiographic projections precisely, thereby eliminating errors caused by inconsistencies in the positioning of the patient and X-ray equipment. Of note, prior research has demonstrated that measurements of DRRs are sufficiently equivalent to measurements of conventional radiographs.4 The eight DRR views of the foot and ankle included the: (1) the antero-posterior (AP) view;3 (2) the mortise view (20 degrees internal rotation out of the AP view);21 (3) the subtalar joint view (modified Harries Beth view);9,16,22 (4) the 40/30 degrees Broden view (40 degrees internal rotation and 30 degrees upwards tilt of the foot);17 and multiple (5–8) Broden views (45/10 to 45/40 degrees).5,11 These eight views were selected as they are frequently used to image the ankle (AP and mortise view) and subtalar joint (subtalar view, Broden views) in the coronal plane.16 The calcaneal and talar side of the subtalar joint were visualized using DRRs, but beads were only placed on the posterior facet of the calcaneus. On each DRR, the morphology of the calcaneal posterior facet was rated as either convex, flat, or concave.8 Two angles were measured on DRRs to assess the configuration of the visible subtalar joint line: (1) the angle between the surface of the talus and the posterior facet of the calcaneus (subtalar inclination angle, SIA) was calculated to evaluate the position of the talus in relation to the calcaneus;13 (2) the angle between a line from the medial and lateral border of the posterior facet to a vertical line (calcaneal slope, Supplemental Figure 1). In addition, the subtalar joint line defined on each DRR was projected onto the posterior facet of the corresponding 3-D model of the calcaneus. Thus, evaluation of which aspect of the subtalar joint was visible on each standard view was made possible.
2.3. Statistical Analysis
To test for differences of the SIA and calcaneal slope between the AP and each other view (mortise view, subtalar view, Broden views), student’s T-tests were used. As the Broden views are defined as a specific sequence of radiographs, a one-way ANOVA followed by a Tukey’s post-hoc analysis was performed to test differences between multiple Broden views. Inter- and intra-observer agreement was assessed using the two-way random intraclass correlation coefficient (ICC) and presented with a 95% confidence interval (95% CI). One orthopaedic surgeon (N.K.) and one postdoctoral research associate (A.L.L.) independently assessed the SIA and calcaneal slope to assess the inter-observer agreement for each view. A second assessment was done for calculation of the intra-observer agreement. Agreement was considered to be very good for an ICC > 0.80; good with an ICC = 0.61–0.80; moderate with an ICC = 0.41 – 0.60; fair with an ICC = 0.21–0.4; and poor with an ICC < 0.20.24 Statistical significance was set as P<0.05. MATLAB and IBM SPSS Statistics Version 25.0 (Armonk, NY, USA) was used for statistical analyses.
3. Results
3.1. Subtalar Joint Morphology
The morphology of the posterior facet varied between the different radiographic views (Table II). While the posterior facet appeared convex on the AP view, one third of the individuals showed a flat morphology on the mortise view (two thirds remained convex on the mortise view). A convex, flat, or concave morphology was equally distributed on the subtalar view. For the Broden views, the percentage of flat subtalar joints increased with further upwards inclination of the foot, while the percentage of concave subtalar joints decreased.
Table II:
Subtalar Joint Morphology
| Convex | Flat | Concave | |
|---|---|---|---|
| AP View | 100 % | 0.0 % | 0.0 % |
| Mortise View | 63.0 % | 37.0 % | 0.0 % |
| Subtalar View | 37.0 % | 37.0 % | 26.0 % |
| 30/40 BV | 0.0 % | 33.3 % | 66.7 % |
| 45/10 BV | 0.0 % | 33.3 % | 66.7 % |
| 45/20 BV | 0.0 % | 37.0 % | 63.0 % |
| 45/30 BV | 0.0 % | 40.7 % | 59.3 % |
| 45/40 BV | 0.0 % | 48.1 % | 51.9 % |
AP, Antero-Posterior
BV, Broden View
3.2. Subtalar Joint Configuration
The SIA and the calcaneal slope differed significantly when measured on the AP view compared to all other views except for the SIA assessed on the 45/20 Broden view (Supplemental Table I). Almost all measurements within the Broden views differed significantly from each other (Supplemental Figure 2). Inter-observer agreement was moderate for the SIA and poor for the calcaneal slope on the AP view. Intra-observer agreement was good for the calcaneal slope on the same views. The other agreements ranged from 0.814 to 0.988 for the SIA, and from 0.846 to 0.991 for the calcaneal slope and were rated as very good (Supplemental Table II).
3.3. Projection of the Joint Line
The position of the subtalar joint line projected onto 3-D models of the calcaneus changed between different views. On the AP and mortise view, the posterior aspect of the posterior facet was visualized (Figure 1). On the subtalar view, a more anterior aspect of the posterior facet was visualized. In addition, the middle facet was visible. Broden views with little upwards tilt of the foot (e.g. 10 degrees) showed the posterior aspect of the posterior facet. A more anterior aspect was visualized with further upwards tilting of the foot using the Broden views (e.g. 40 degrees, Figure 2).
Figure 1.
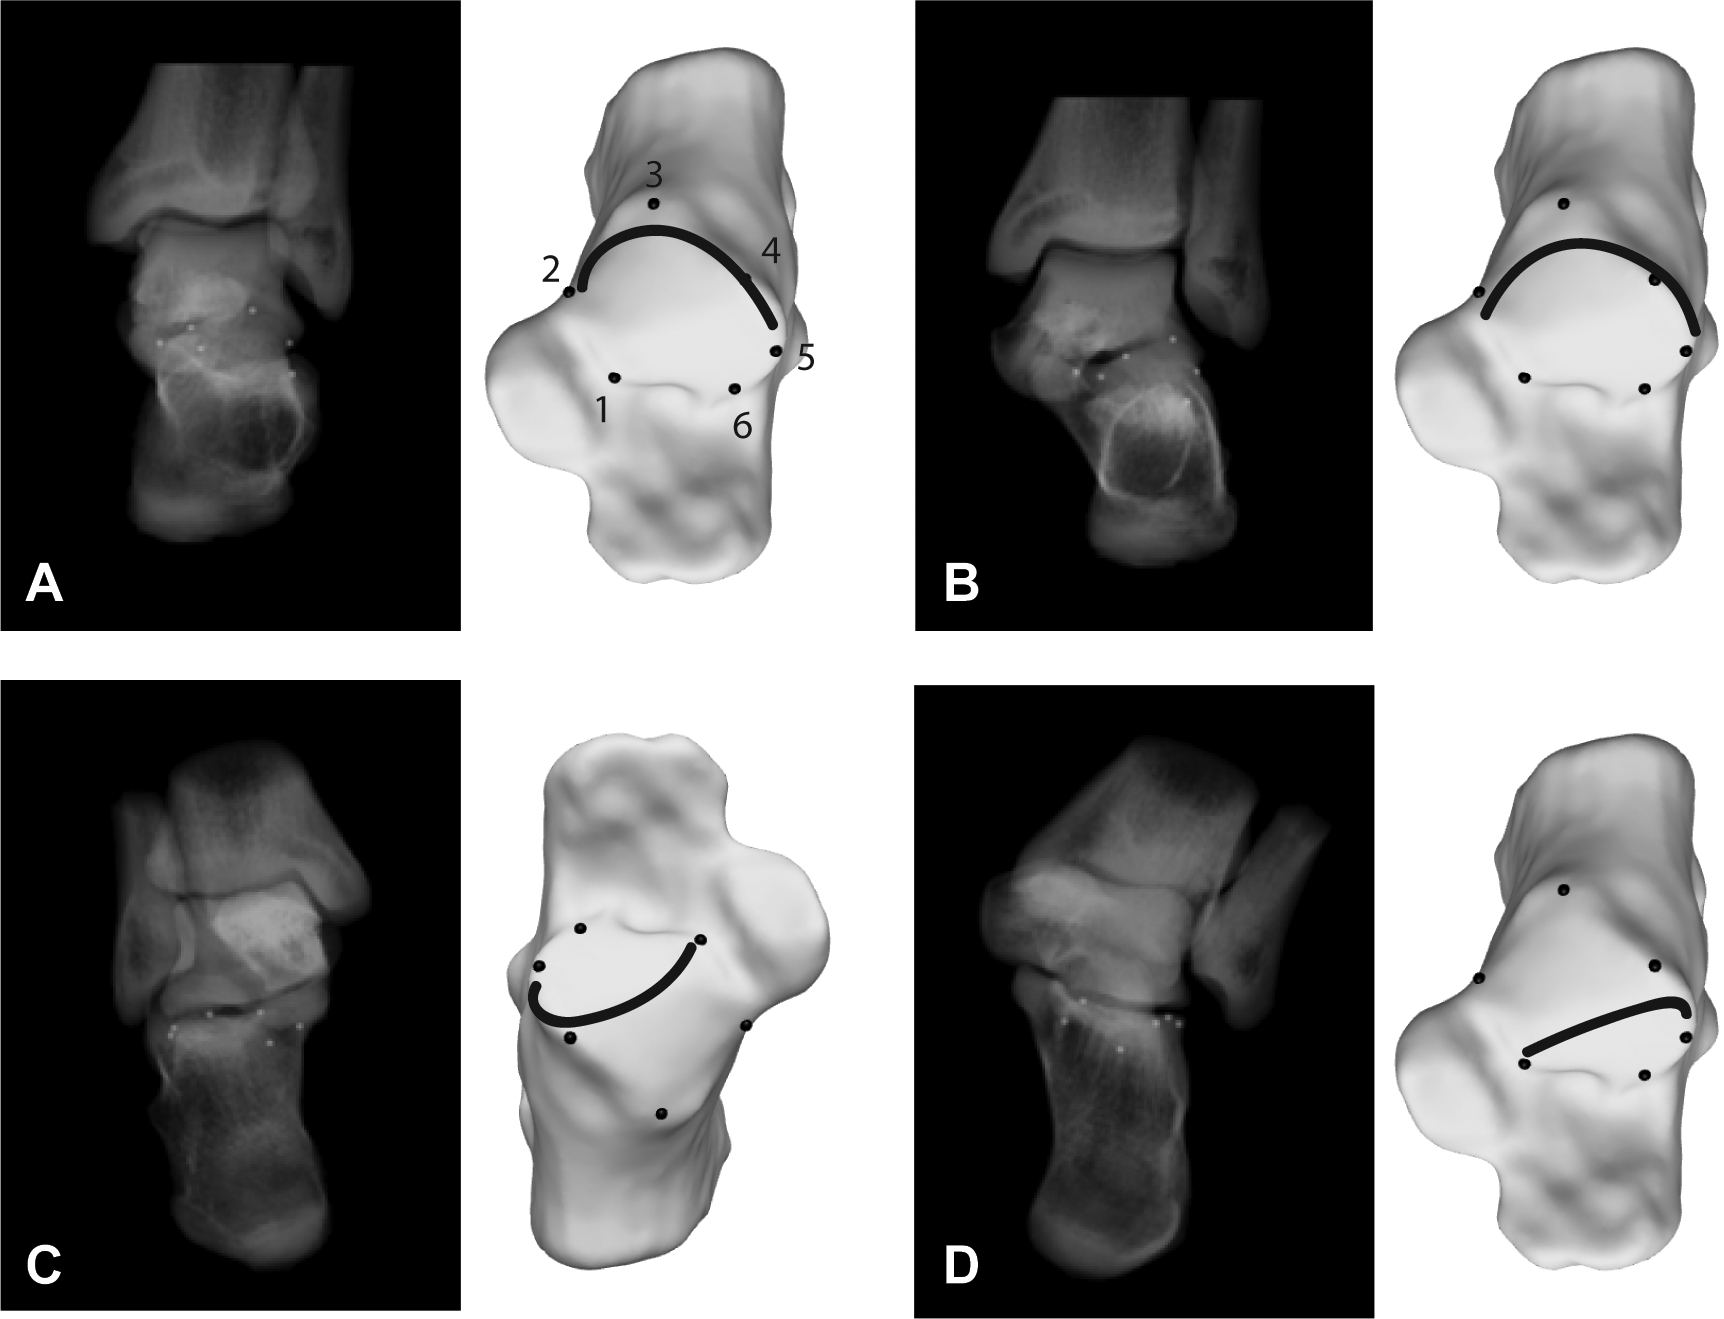
Projection of the joint line on 3-D models of the calcaneus. (1-A) Antero-posterior (AP view). Digitally reconstructed radiographs (DRRs) with inserted beads are shown, followed by a projection of the joint line on a 3-D model of the calcaneus; 1) antero-medial point, 2) medial point, 3) posterior point, 4) superior point, 5) lateral point, 6) antero-lateral point. (1-B) Mortise view showing a slightly more anterior aspect of the posterior facet (subtalar joint) compared to the AP view. (1-C) Subtalar view. The joint line is projected on the anterior third of the posterior facet. In addition, the medial facet is visible. (1-D) 30/40 degrees Broden view. Broden views provide a more perpendicular view on the posterior facet of the subtalar joint.
Figure 2.
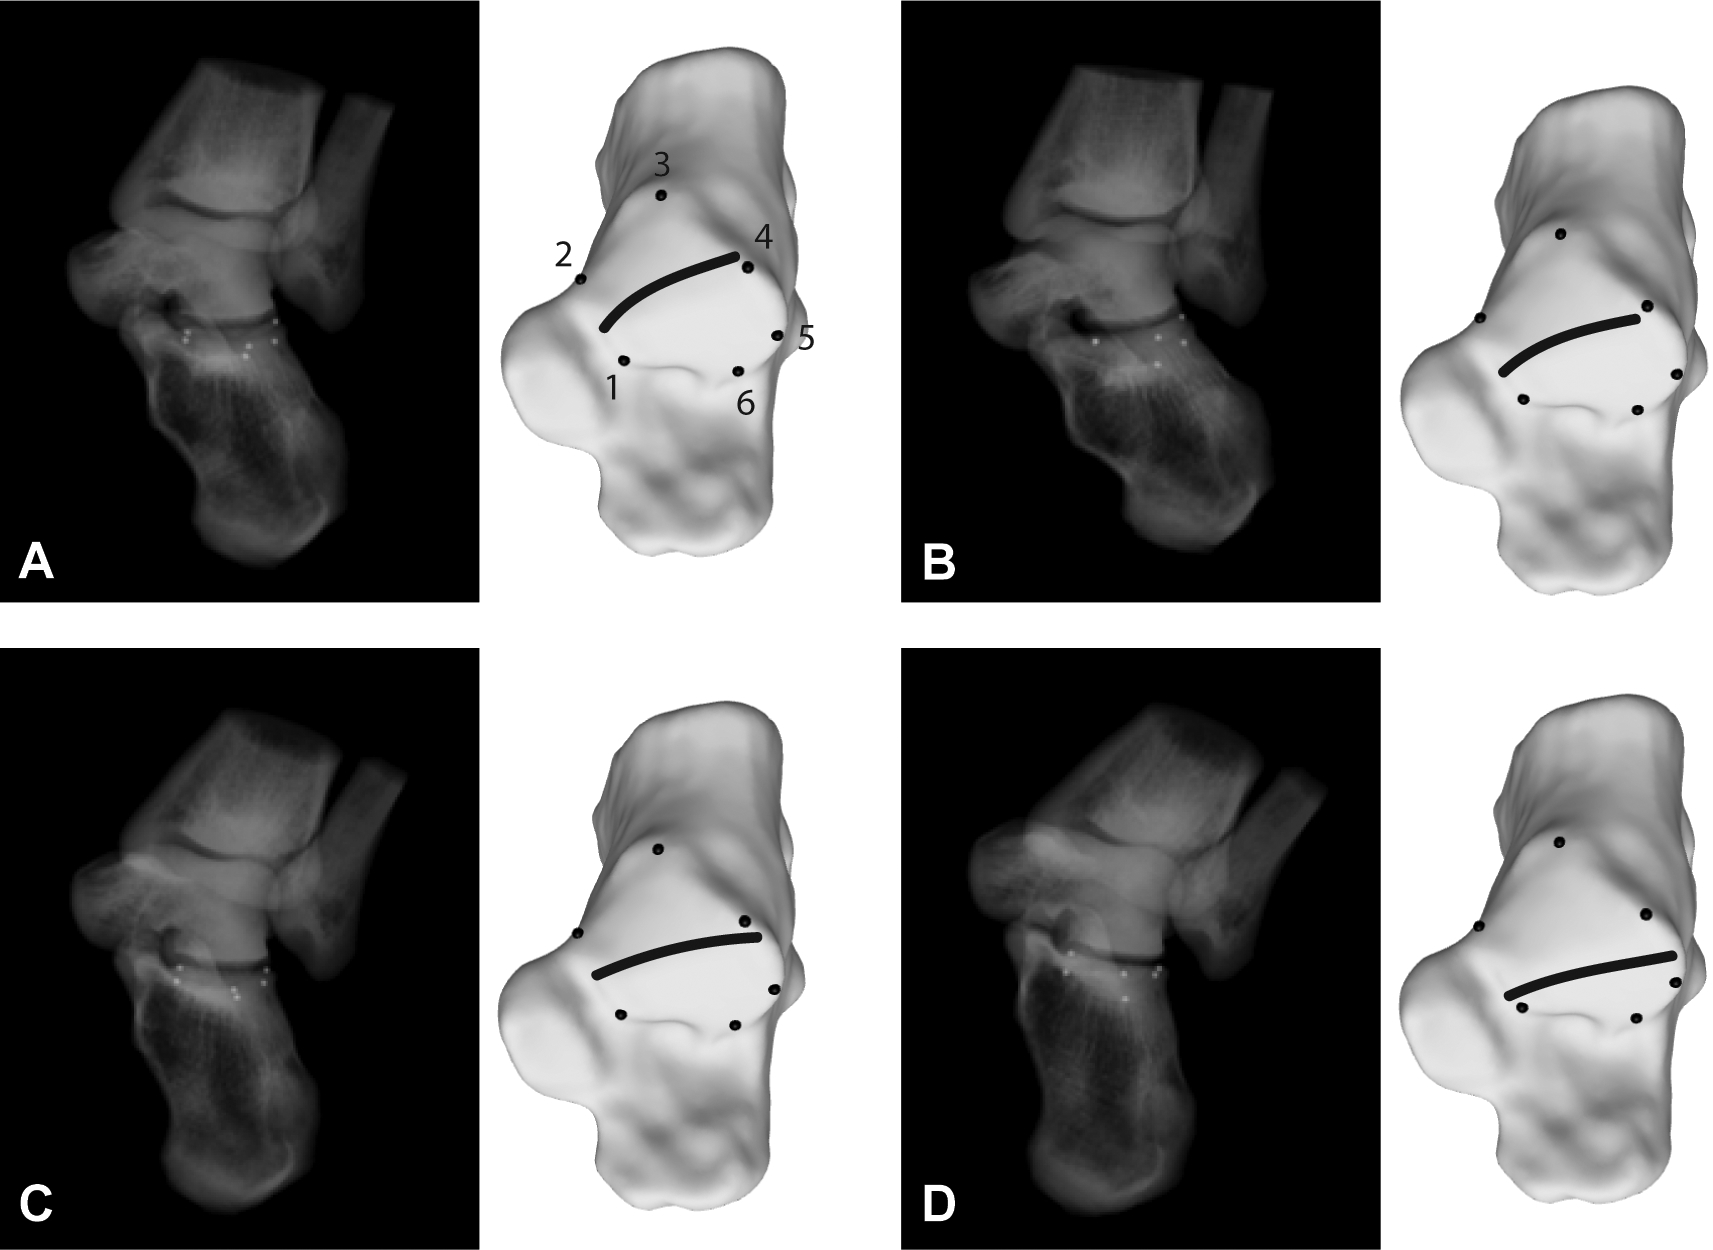
Projection of the joint line on 3-D models of the calcaneus. (2-A) 45/10 degrees Broden view. Digitally reconstructed radiographs (DRRs) with inserted beads are shown, followed by a reconstruction of the joint line on a 3-D model of the calcaneus; 1) antero-medial point, 2) medial point, 3) posterior point, 4) superior point, 5) lateral point, 6) antero-lateral point. Note, five beads are visualized in the 45/10 degrees view due to anterior beads being overlapped in this projection view. (2-B) 45/20 degrees Broden view showing a more anterior aspect of the posterior facet (subtalar joint) compared to the 45/10 degrees Broden view. (2-C) 45/30 degrees Broden view showing an even more anterior aspect. (2-D) 45/40 degrees Broden view showing the most anterior aspect of the posterior facet compared to the other views.
4. Discussion
The four main findings of this study are: (1) on the weightbearing AP view of the ankle joint, the posterior aspect of the posterior facet (calcaneal side) is visualized and appears convex; (2) on the weightbearing mortise view of the ankle joint, a slightly more anterior aspect of the posterior facet (compared to the AP view) is visualized and appears either convex or flat; (3) on the weightbearing subtalar view, the anterior aspect of the posterior facet is visualized and appears either convex, flat or concave; (4) using weightbearing Broden views, the posterior and anterior aspect of the posterior facet can be visualized. The morphology of the posterior facet changes from concave (45/10 degrees Broden view) to flat (45/40 degrees Broden view).
The subtalar joint was not clearly visible on most reconstructed AP views in this study. With 20 degrees internal rotation (mortise view), the visibility of the joint line (posterior facet) increases. This also explains the excellent reliability of measurements of the SIA and the calcaneal slope for the mortise view compared to the AP view. However, only the posterior aspect of the posterior facet can be visualized using either the AP or the mortise view, limiting the utility of these views for assessing the subtalar joint. The subtalar view visualized a more anterior aspect of the subtalar joint compared to the mortise view. Although this view was originally used to assess the compensatory mechanism of the subtalar joint our results question if visualization of only one aspect of the subtalar joint in a static position is sufficient to describe this compensatory mechanism. A 30/ 40 degrees Broden view has been proposed by several authors to assess the stability of the subtalar joint (with application of inversion stress).17,20 Currently, however, stress radiographs are rarely used in clinical practice to diagnose subtalar joint instability. Using multiple Broden views (45 degrees internal rotation) that differ by an interval of 10 degrees of upwards tilt, we found that a stepwise visual assessment of the posterior, middle, and anterior aspect of the posterior facet was made possible. An anatomic study showed that the Broden views provide a more perpendicular view of the posterior facet.19 Based on the current investigation, we believe that multiple Broden views outperform any other standard view for assessing the morphology of the posterior facet of the subtalar joint.
Studies using single weightbearing CT images showed significant differences in the orientation of the posterior facet from anterior to posterior (screw shape morphology).1,7,12–14,18 We found similar results using DRRs: the posterior aspect of the joint (45/10 degrees Broden view) showed a more varus inclination compared to the anterior aspect, which was in a more neutral alignment. Nevertheless, different radiographic views are necessary for a detailed assessment of the posterior facet, which is a considerable drawback compared to CT scans. Although DRRs reconstructed out of a weightbearing CT scan dataset have shown to be more reliable in defining hindfoot malalignment compared to conventional radiographs, it is questionable if this novel imaging modality will replace X-rays in the days to come.6 A detailed analysis of specific areas is possible using single CT images, but also the alignment can be assessed using DRRs. Therefore, it is likely that weightbearing CT will become more important for evaluation for hindfoot pathologies in the future.
A recent study using weightbearing coronal CT images assessed the morphology of the posterior facet.8 Each facet was either defined as concave (talar side, corresponds to a convex morphology on the calcaneal side) or flat. In a cohort of 59 healthy feet, 88% showed a concave morphology, while 12% showed a flat shape. Different shapes were also observed on DRRs. However, the shape differed between the viewing perspectives. Therefore, it is likely that the different morphology of the posterior facet is dependent on the viewing perspective rather than on anatomic differences between individuals. A detailed analysis of the shape of the posterior facet would be necessary to answer this question. In addition, establishing normal variants that are not associated with symptoms or limited function would be beneficial to better identify pathologic conditions.
This study has several limitations. First, conventional radiographs in daily practice will have a greater chance of rotational errors compared to DRRs. This may minimize the generalizability of our findings. Also, the Broden views were initially used to assess the calcaneus in case of a fracture.5 Therefore, those views were done in non-weightbearing condition.5 Second, only healthy volunteers were included in this study. Further investigations are necessary to better understand the projection of the subtalar joint on conventional radiographs in symptomatic patients. Third, only the posterior facet of the subtalar joint was assessed in this study. The impact of the middle and anterior facet is poorly understood and needs further attention in future studies.2 Fourth, only standard views of the foot and ankle were assessed. Other views may visualize the subtalar joint in greater detail. Further studies investigating the impact of rotation/ inclination on the projection of the subtalar joint on conventional radiographs are necessary to determine which view best visualizes the subtalar joint.
To conclude, a detailed understanding of the presentation of the subtalar joint in healthy ankles on standard radiographs is necessary to understand changes in diseased ankles (e.g. peritalar instability, ankle osteoarthritis, etc.). Further studies that use both DRRs and CT images on diseased ankles under weightbearing conditions are necessary to develop a reliable method to assess the subtalar joint.
Supplementary Material
Supplemental Figure 1. Assessment of the subtalar configuration on digitally reconstructed radiographs (DRRs). (1-A) Antero-posterior (AP) view of the ankle joint. The subtalar inclination angle (SIA) is defined as the angle between the surface of the talus and a line between the medial and lateral border of the subtalar joint. The calcaneal slope is defined as the angle between the line connecting the medial and lateral border of the subtalar joint and a vertical line. (1-B) 45/10 degrees Broden view showing the same angles. The morphology of the subtalar joint differs from the AP view. (1-C) Subtalar view. The X-ray beam is projected 30 degrees downwards (posterior to anterior). The medial facet is additionally visible.
Supplemental Figure 2. Subtalar inclination angle (SIA) and calcaneal slope measurements on five Broden views. Comparisons marked with an Asterix (*) indicate no statistical differences, while the other groups demonstrated significant differences (P < 0.05). (2-A) Comparison of the SIA between the Broden views. (2-B) Comparison of the calcaneal slope between the Broden views.
Acknowledgement
Nicola Krähenbühl was supported by a research grant from the Swiss National Science Foundation (SNF; P2BSP3_174979). The study was additional supported by a grant from the Swiss Orthopaedic Society (Swiss Orthopaedics) and from the Peery Research Foundation (University of Utah).
Contributor Information
Nicola Krahenbuhl, Department of Orthopaedics, University of Utah, 590 Wakara Way, Salt Lake City, UT 84108, USA.
Amy L. Lenz, Department of Orthopaedics, University of Utah, 590 Wakara Way, Salt Lake City, UT 84132, USA.
Rich Lisonbee, Department of Orthopaedics, University of Utah, 590 Wakara Way, Salt Lake City, UT 84108, USA.
Manja Deforth, Department of Orthopaedics, Kantonsspital Liestal, Rheinstrasse 26, 4410 Liestal, Switzerland.
Lukas Zwicky, Department of Orthopaedics, Kantonsspital Liestal, Rheinstrasse 26, 4410 Liestal, Switzerland.
Beat Hintermann, Department of Orthopaedics, Kantonsspital Baselland, Rheinstrasse 26, 4410 Liestal, Switzerland.
Charles L. Saltzman, Department of Orthopaedics, University of Utah, 590 Wakara Way, Salt Lake City, UT 84108, USA.
Andrew E. Anderson, Department of Orthopaedics, University of Utah, 590 Wakara Way, Salt Lake City, UT 84108, USA.
Alexej Barg, Department of Orthopaedics, University of Utah, 590 Wakara Way, Salt Lake City, UT 84108, USA.
References
- 1.Apostle KL, Coleman NW, Sangeorzan BJ: Subtalar joint axis in patients with symptomatic peritalar subluxation compared to normal controls. Foot Ankle Int. 35(11):1153–1158, 2014. 10.1177/1071100714546549 [DOI] [PubMed] [Google Scholar]
- 2.Barbaix E, Van Roy P, Clarys JP: Variations of anatomical elements contributing to subtalar joint stability: intrinsic risk factors for post-traumatic lateral instability of the ankle? Ergonomics. 43(10):1718–1725, 2000. 10.1080/001401300750004122 [DOI] [PubMed] [Google Scholar]
- 3.Barg A, Amendola RL, Henninger HB, et al. : Influence of Ankle Position and Radiographic Projection Angle on Measurement of Supramalleolar Alignment on the Anteroposterior and Hindfoot Alignment Views. Foot Ankle Int. 36(11):1352–1361, 2015. 10.1177/1071100715591091 [DOI] [PubMed] [Google Scholar]
- 4.Barg A, Bailey T, Richter M, et al. : Weightbearing Computed Tomography of the Foot and Ankle: Emerging Technology Topical Review. Foot Ankle Int. 39(3):376–386, 2018. 10.1177/1071100717740330 [DOI] [PubMed] [Google Scholar]
- 5.Broden B: Roentgen examination of the subtaloid joint in fractures of the calcaneus. Acta radiol. 31(1):85–91, 1949. [DOI] [PubMed] [Google Scholar]
- 6.Burssens A, Peeters J, Buedts K, et al. : Measuring hindfoot alignment in weight bearing CT: A novel clinical relevant measurement method. Foot Ankle Surg. 22(4):233–238, 2016. 10.1016/j.fas.2015.10.002 [DOI] [PubMed] [Google Scholar]
- 7.Cody EA, Williamson ER, Burket JC, et al. : Correlation of Talar Anatomy and Subtalar Joint Alignment on Weightbearing Computed Tomography With Radiographic Flatfoot Parameters. Foot Ankle Int. 37(8):874–881, 2016. 10.1177/1071100716646629 [DOI] [PubMed] [Google Scholar]
- 8.Colin F, Horn Lang T, Zwicky L, et al. : Subtalar joint configuration on weightbearing CT scan. Foot Ankle Int. 35(10):1057–1062, 2014. 10.1177/1071100714540890 [DOI] [PubMed] [Google Scholar]
- 9.Hayashi K, Tanaka Y, Kumai T, et al. : Correlation of compensatory alignment of the subtalar joint to the progression of primary osteoarthritis of the ankle. Foot Ankle Int. 29(4):400–406, 2008. 10.3113/FAI.2008.0400 [DOI] [PubMed] [Google Scholar]
- 10.Hintermann B, Knupp M, Barg A: Peritalar instability. Foot Ankle Int. 33(5):450–454, 2012. 10.3113/FAI.2012.0450 [DOI] [PubMed] [Google Scholar]
- 11.Isherwood I: A radiological approach to the subtalar joint. J Bone Joint Surg. 43(3), 1961. [Google Scholar]
- 12.Krahenbuhl N, Horn-Lang T, Hintermann B, Knupp M: The subtalar joint: A complex mechanism. EFORT Open Rev. 2(7):309–316, 2017. 10.1302/2058-5241.2.160050 [DOI] [PMC free article] [PubMed] [Google Scholar]
- 13.Krahenbuhl N, Siegler L, Deforth M, et al. : Subtalar joint alignment in ankle osteoarthritis. Foot Ankle Surg. 2017. 10.1016/j.fas.2017.10.004 [DOI] [PubMed] [Google Scholar]
- 14.Krahenbuhl N, Tschuck M, Bolliger L, et al. : Orientation of the Subtalar Joint: Measurement and Reliability Using Weightbearing CT Scans. Foot Ankle Int. 37(1):109–114, 2016. 10.1177/1071100715600823 [DOI] [PubMed] [Google Scholar]
- 15.Kunas GC, Probasco W, Haleem AM, et al. : Evaluation of peritalar subluxation in adult acquired flatfoot deformity using computed tomography and weightbearing multiplanar imaging. Foot Ankle Surg. 24(6):495–500, 2018. 10.1016/j.fas.2017.05.010 [DOI] [PubMed] [Google Scholar]
- 16.Lopez-Ben R: Imaging of the subtalar joint. Foot Ankle Clin. 20(2):223–241, 2015. 10.1016/j.fcl.2015.02.009 [DOI] [PubMed] [Google Scholar]
- 17.Louwerens JW, Ginai AZ, van Linge B, Snijders CJ: Stress radiography of the talocrural and subtalar joints. Foot Ankle Int. 16(3):148–155, 1995. 10.1177/107110079501600308 [DOI] [PubMed] [Google Scholar]
- 18.Probasco W, Haleem AM, Yu J, et al. : Assessment of coronal plane subtalar joint alignment in peritalar subluxation via weight-bearing multiplanar imaging. Foot Ankle Int. 36(3):302–309, 2015. 10.1177/1071100714557861 [DOI] [PubMed] [Google Scholar]
- 19.Sarrafian SK: Biomechanics of the subtalar joint complex. Clin Orthop Relat Res. (290):17–26, 1993. [PubMed] [Google Scholar]
- 20.Sijbrandij ES, van Gils AP, van Hellemondt FJ, et al. : Assessing the subtalar joint: the Broden view revisited. Foot Ankle Int. 22(4):329–334, 2001. 10.1177/107110070102200410 [DOI] [PubMed] [Google Scholar]
- 21.Takao M, Ochi M, Naito K, et al. : Computed tomographic evaluation of the position of the leg for mortise radiographs. Foot Ankle Int. 22(10):828–831, 2001. 10.1177/107110070102201009 [DOI] [PubMed] [Google Scholar]
- 22.Tanaka Y, Takakura Y, Fujii T, et al. : Hindfoot alignment of hallux valgus evaluated by a weightbearing subtalar x-ray view. Foot Ankle Int. 20(10):640–645, 1999. [DOI] [PubMed] [Google Scholar]
- 23.Wang B, Saltzman CL, Chalayon O, Barg A: Does the subtalar joint compensate for ankle malalignment in end-stage ankle arthritis? Clin Orthop Relat Res. 473(1):318–325, 2015. 10.1007/s11999-014-3960-8 [DOI] [PMC free article] [PubMed] [Google Scholar]
- 24.Yeung TW, Chan CY, Chan WC, et al. : Can pre-operative axial CT imaging predict syndesmosis instability in patients sustaining ankle fractures? Seven years’ experience in a tertiary trauma center. Skeletal Radiol. 44(6):823–829, 2015. 10.1007/s00256-015-2107-7 [DOI] [PubMed] [Google Scholar]
Associated Data
This section collects any data citations, data availability statements, or supplementary materials included in this article.
Supplementary Materials
Supplemental Figure 1. Assessment of the subtalar configuration on digitally reconstructed radiographs (DRRs). (1-A) Antero-posterior (AP) view of the ankle joint. The subtalar inclination angle (SIA) is defined as the angle between the surface of the talus and a line between the medial and lateral border of the subtalar joint. The calcaneal slope is defined as the angle between the line connecting the medial and lateral border of the subtalar joint and a vertical line. (1-B) 45/10 degrees Broden view showing the same angles. The morphology of the subtalar joint differs from the AP view. (1-C) Subtalar view. The X-ray beam is projected 30 degrees downwards (posterior to anterior). The medial facet is additionally visible.
Supplemental Figure 2. Subtalar inclination angle (SIA) and calcaneal slope measurements on five Broden views. Comparisons marked with an Asterix (*) indicate no statistical differences, while the other groups demonstrated significant differences (P < 0.05). (2-A) Comparison of the SIA between the Broden views. (2-B) Comparison of the calcaneal slope between the Broden views.