

Abstract
Crystal growth of semiconductor nanowires from a liquid droplet depends on the stability of this droplet’s liquid–solid interface. Because of the assisting property of the droplet, growth will be hindered if the droplet is displaced onto the nanowire sidewalls. Using real-time observation of such growth by in situ transmission electron microscopy combined with theoretical analysis of the surface energies involved, we observe a reoccurring truncation at the edge of the droplet–nanowire interface. We demonstrate that creating a truncation widens the parameter range for having a droplet on the top facet, which allows continued nanowire growth. Combining experiment and theory provides an explanation for the previously reported truncation phenomenon of the growth interface based only on droplet wetting dynamics. In addition to determining the fundamental limits of droplet-assisted nanowire growth, this allows experimental estimation of the surface tension and the surface energies of the nanowire such as the otherwise metastable wurtzite GaAs {101̅0} facet.
Formation of semiconductor nanowires from a nanoscale liquid droplet by the vapor–liquid–solid process is an important example of complex, multiphase crystal growth. This process allows for the formation of anisotropic crystals with highly precise selectivity for crystal phase,1 composition,2,3 morphology,4,5 and properties.6 While the nucleation step and its role in material properties have been investigated in detail,7−9 less attention has been paid to the overall stability of the process and the conditions required for the droplet to remain at the top of the nanowire during growth.10,11 This condition is essential to prevent nanowire kinking and spontaneous change of growth orientation,12,13 displacement of the droplet from the nanowire,14 and failure of the growth process itself.10 A fundamental stability criterion for a droplet to remain at the top of a nanowire during its growth has been proposed by Nebol’sin and Shchetinin10 based on ex situ observations and earlier theoretical work15,16 (see the work by Makkonen17 for a modern discussion of Young’s equation). The wetting properties of the droplet during nanowire growth have subsequently been investigated, theoretically by addressing the droplet stability,18−20 and experimentally by focusing on morphology.21−24 In situ observations,8,22,23,25 including the result presented here, have shown the droplet–nanowire interface to be dynamic during growth. In this Letter, we show that the dynamic interface can be explained as an effect of droplet wetting and the surface energies involved.
The Nebol’sin-Shchetinin model predicts an upper bound for
having a droplet on the top nanowire facet by relating the ratio of
the surface energies of the solid and liquid phases in contact with
the vapor (γsv and γlv) to the wetting angle and tapering of the nanowire.10 Although the model is widely accepted, its predictions
frequently disagree with experimental observations, for instance,
growth of self-assisted GaAs26 and InAs27 nanowires has been extensively reported, although
the relevant surface energy ratios in these cases fall outside the
predicted stability range (γsv/γlv ≈ 2 compared to the maximum ratio
of  for untapered
nanowires10). While the surface energies
are key to understanding nucleation
and growth of crystals along with the droplet wetting, no experimental
studies have, to our knowledge, investigated the absolute energies
during nanoscale growth. Instead, experimentalists have relied on
ratios and theoretical predictions for various surface reconstruction
and passivation. Moreover, the model is based on the assumption that
the interface between droplet and nanowire is flat, which, according
to in situ experimental results,8,22,23,25 is not always the case during
growth. These experimental reports instead indicate a dynamic interface
that may become truncated during growth, which could be one of the
reasons for the mismatch between experimental and theoretical studies.
for untapered
nanowires10). While the surface energies
are key to understanding nucleation
and growth of crystals along with the droplet wetting, no experimental
studies have, to our knowledge, investigated the absolute energies
during nanoscale growth. Instead, experimentalists have relied on
ratios and theoretical predictions for various surface reconstruction
and passivation. Moreover, the model is based on the assumption that
the interface between droplet and nanowire is flat, which, according
to in situ experimental results,8,22,23,25 is not always the case during
growth. These experimental reports instead indicate a dynamic interface
that may become truncated during growth, which could be one of the
reasons for the mismatch between experimental and theoretical studies.
In this Letter, we address the stability of the droplet wetting the nanowire top facet during growth by combining in situ real-time transmission electron microscopy (TEM) observations of GaAs nanowire growth with a theoretical model that expands on the Nebol’sin-Shchetinin stability criterion to allow the possibility of interface truncation. This experiment provides an explanation for the truncation formation based on droplet wetting rather than involving the crystal growth process itself. Given that the truncating facet has been observed to oscillate, in both size and truncation angle,8,22 we also consider a lower limit of the surface energy ratio and wetting of a (truncated) droplet-nanowire interface to evaluate the condition for which a specific truncation would be probable. By measuring the droplet wetting angle in situ during growth and estimating its surface tension, we demonstrate that the stability range for nanowire growth with a liquid droplet is extended by formation of a truncated interface. Consequently, based on the droplet wetting model correlated to presence of truncation, we are able to experimentally estimate the surface energy of the metastable wurtzite crystal sidewall {101̅0}.
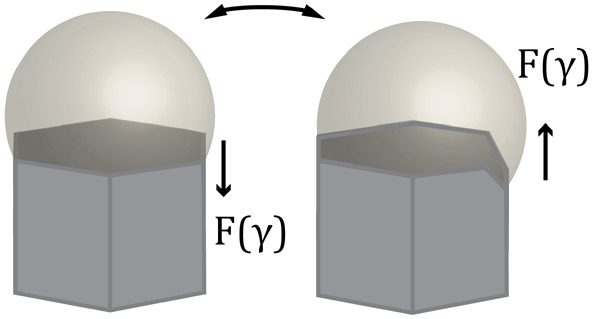
To include the possibility of truncation into the droplet stability condition, we introduce an additional geometrical relation (ϕ) between the surface (capillary) forces resulting from the corresponding surface energies, as depicted in Figure 1. The figure shows the droplet–nanowire morphology, illustrating the relevant surface energies and their relative orientation using tapering (δ), wetting (β), and truncation (ϕ) angles. To compare the surface forces, we consider the solid–vapor, liquid–vapor, and liquid–solid interfaces to have the surface energies γsv, γlv, and γls, respectively. Balancing the horizontal forces laterally at the triple-phase boundary (arrows) in Figure 1 provides a geometrical relation between the surface energies of the system according to
| 1 |
Figure 1.

Surface forces pulling on a droplet, based on surface energies at the interfaces (γvs, γlv, γls), are superimposed on a conventional transmission electron micrograph of a Au-droplet on top of a GaAs nanowire. This overview is accompanied by a schematic illustrating the angles used for orienting these forces with respect to each other, taking into account the dependence of truncation (ϕ), tapering (δ), and wetting angle (β). Note that the wetting angle is consistently defined relative to the plane perpendicular to the growth direction.
Similarly, the vertical components of the surface forces are evaluated by addressing a downward resulting force to study the limits for a droplet to remain stable on the top facet:
| 2 |
Elimination of γls, using eqs 1 and 2, provides the geometrical condition for the surface energy ratio when the droplet wets part of the nanowire sidewall (i.e., the solid–vapor interface):
| 3 |
Thus, eq 3 represents a lower limit for the surface energy ratio.
For the droplet to remain stable on the top facet while having a downward resulting force requires that the resulting force must be directed upward as soon as the liquid starts to wet the nanowire sidewall. If the resulting force continues to be downward, the droplet would be expected to be displaced from the top facet to the sidewall.14,28 This results in an upper bound for the surface energy ratio to allow the droplet to remain on the top facet and can be represented by following inequality:
| 4 |
This ratio reduces to sin β – cos β for
untapered
nanowires with a nontruncated interface between droplet and nanowire,
just as in the model without truncation.10 The bounds presented, eqs 3 and 4, are drawn in Figure 2 for untapered nanowires with
a flat growth interface (ϕ = 0°) and for truncated growth
fronts (ϕ > 0°). It is evident that a truncation can
extend
the stability limit for having a droplet on the top of a nanowire,
or a pillar-like structure, allowing higher surface energy ratios
than  .
.
Figure 2.
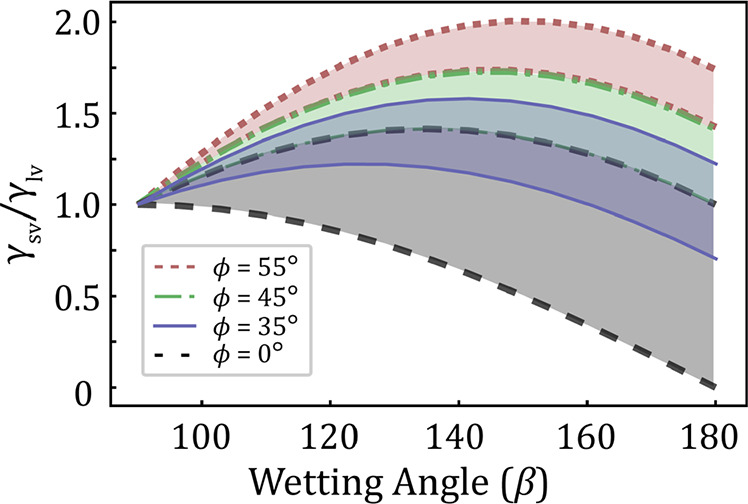
Theoretically predicted intervals for having a droplet on the top facet of a nanowire during growth. The predictions are drawn based on eqs 3 and 4 for untapered (δ = 0°) nanowires with varied truncation angle (ϕ). We observe how the maximum allowed surface energy ratio (apex) increases as the truncation angle increases. Note how the lower bound for 45° and 35° overlaps with the upper bound for 0° and 45°, respectively.
To test the predictions of the model, (0001̅)-oriented Au-assisted wurtzite GaAs nanowires were grown on a SiNx grid in a transmission electron microscope by supplying tri-methyl-gallium (TMGa) and arsine. The precursors were supplied in parallel, through the sample holder, to the locally heated sample area (420 °C). When successively increasing the flow of Ga precursor, the size of the Au–Ga droplet was observed to increase as presented in Figure 3a and b. The volume increase is attributed to Ga accumulation in the droplet, which in turn would lower the droplet surface tension since the Au content remains the same and Ga has a lower surface tension. This allows us to study several combinations of surface energy ratios and wetting angles to test our model using growth parameters similar to previous reported work on Au–GaAs nanowire growth.29,30 To compare the experimental observations of the droplet to the model, we estimated droplet composition by measuring the volume of the droplet from continuously recorded TEM images with 50 ms exposure time. Direct measurement of droplet composition cannot be performed simultaneously with the imaging. Initially, that is, during steady growth conditions prior to increasing the Ga-precursor flow, we measured the composition of the droplet using X-ray energy dispersive spectroscopy. This compositional measurement was correlated with the projected volume of the droplet at the same conditions. The observed variations in the droplet volume could then be converted into relative change in Ga concentration. This approach allowed us to estimate the composition of a gradually changing droplet and directly correlate it to the geometry of the droplet–nanowire interface for each individual frame in an image sequence. This indirect method for finding the droplet composition from droplet volume has been validated in a previous study.29 Data for an individual nanowire are presented as Supporting Information showing how a droplet on the nanowire evolves over time with respect to wetting angle and interface geometry (truncated or not).
Figure 3.
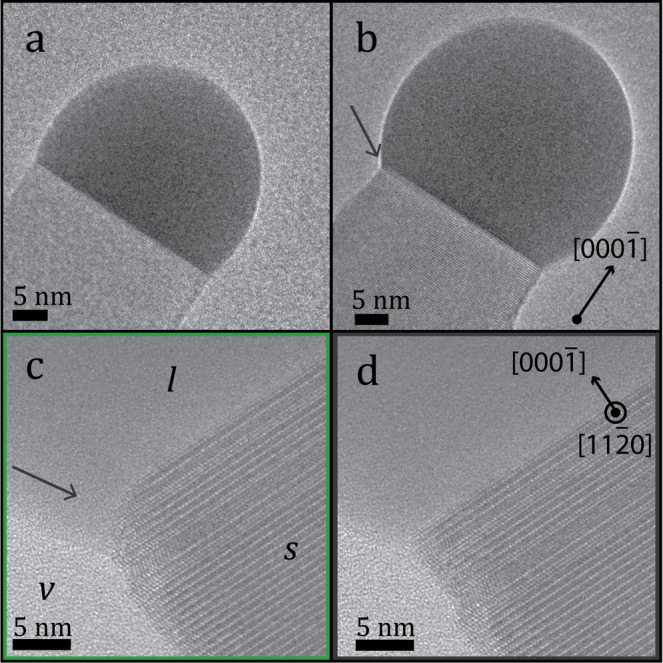
(a, b) Real-time TEM observations during wurtzite crystal growth showed that the droplet, of darker contrast, increased in size due to higher Ga flow. (b, c) As the droplet expanded, we observed a truncation of the edge of the interface between the nanowire and the droplet, indicated by arrows. (d) However, this is not always present but dynamically moves with the droplet and returns to a flat interface from time to time. (a, b) The dynamic behavior of the increasing droplet size and the high resolution recording of the truncation event are provided as Supporting Movies I and II.
As the size of the droplet increases, we observe truncation of the liquid–solid interface as seen in Figure 3c. However, this truncation is not always present during the conditions for our growth as shown by the snapshot taken 2 s later, which is presented in Figure 3d. On the basis of image recordings, provided as Supporting Information, we observe that the truncation size changes in time, similar to previous reports that have connected it to the droplet supersaturation.8 In contrast to the work on Ge, where they observed an altering truncation angle with time, we observe fixed angles that reoccur. For truncation of the GaAs growth front, we observe truncation angles ranging between 35 and 55° favoring truncation angles of 45°. On the basis of the image recordings during GaAs nanowire growth as the Ga flow into the droplet was successively increased, we measured the wetting (β) and tapering angles (δ) and estimated the liquid tension based on the droplet volume. These parameters, along with the truncation angle (ϕ), were used to compare our stability model in Figure 2 with experimental data. For this comparison, we display the stability regime for a nontruncated interface facet and for the average experimental truncation angle (45°) in Figure 4.
Figure 4.
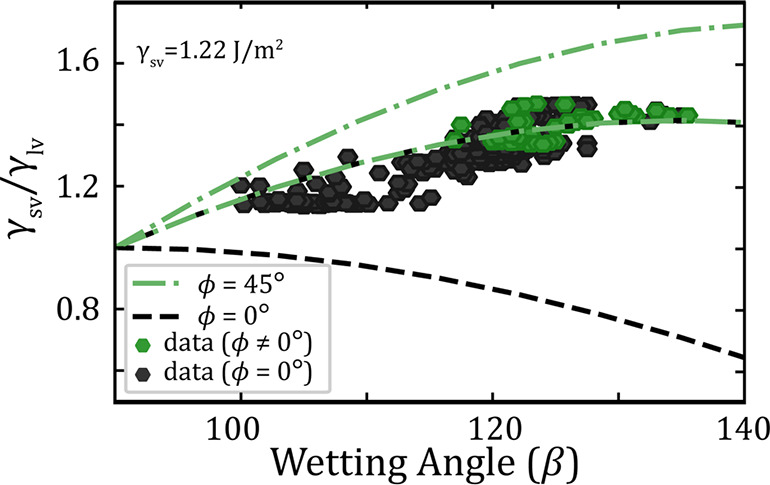
Surface energy ratio (γsv/γlv) as a function of droplet wetting angle (β) to the horizontal crystal facet. The dashed lines mark the lower and upper limit for having a droplet wetting the top facet for an untapered (δ = 0°) nanowire, with (green) and without (black) truncation. The accompanied data (hexagons) are the experimental result from the in situ microscopy in this Letter, measured both when a truncation is present (green) and not (black).
The experimental data included in Figure 4 have been extracted from measurements of the wetting angle and the estimate of the droplet volume for individual micrographs. Assuming that the imaging of the droplet is a two-dimensional projection of a spheroidal cap, and that any change in droplet volume relates to Ga concentration, this allows for an estimation of the droplet composition for each frame of interest. From the composition, the surface tension is estimated by linear extrapolation from the pure species (Au31 and Ga32), and details on the estimation are provided as Supporting Information. Each extracted data point is then related to whether a truncation has occurred recently (within 0.5 s), presented as green or black in Figure 4. From these data, we are able to determine an experimental upper limit for the liquid–solid interface (γls,0001̅) as well as an estimate of the solid–vapor surface energy (γvs,101̅0), which will be discussed further. By evaluating eq 1 for the wetting angle (β) and surface tension (γlv) of a droplet residing on a nanowire without tapering or truncation (ϕ, δ = 0°), we observe that γls,0001̅ does not exceed 0.6 J/m2. This estimation is slightly lower than the previously calculated interface energy between solid GaAs and solid Au of approximately 0.7 J/m2.33 Further details and limitations are supplied as Supporting Information. To estimate the surface energy of the nanowire sidewall (γvs), we utilize our observations together with the stability interval presented earlier (eqs 3 and 4).
From the figure, we observe that the experimental observations of nontruncated interfaces (black) correlate with droplets having lower surface energy ratio (γsv/γlv) in comparison to most of the cases where truncation is present (green). On the other hand, for wetting angles larger than 120°, both truncated and nontruncated droplet–nanowire interfaces occur for similar surface energy ratios and wetting. This is reasonable when taking into account that the interface is changing dynamically when forming or removing a truncation during growth, and that the droplet does not change significantly in volume or shape within the 50 ms between each acquired image. Further, we observed an increased probability of forming a truncation as a function of droplet size. The combination of experimental data and the stability model supports the idea that a truncation of the top facet could increase the stability for having a droplet wetting the top of a nanowire.
Since we observe a regime where both truncated and (relatively) flat interfaces can exist as a result of the dynamic behavior of the droplet, we know that such a region must appear at the model boundary between a probably truncation (green) and flat (gray) interface. As a result, we have fitted the solid–vapor surface energy of the nanowire side-facet ({101̅0}) to be 1.22 J/m2 as presented in Figure 4. This is then compared to the existing theoretical calculations for the GaAs {101̅0} using unreconstructed surface (1.3 J/m234) and density functional theory including surface reconstruction and passivation (0.40 < γvs,101̅0 < 1.06 J/m235−37). For this value of the surface energy, we find that most of the data points for the nontruncated interface (black dots) fall below the predicted upper stability limit for growth with a flat interface, while most of the data for the truncated interface (green dots) fall above this upper limit, and within the stability range for an interface with a truncation of 45°. Changes of this fitted surface energy (γsv) result in a vertical shift of the experimental data (plotted data) but not the drawn stability limits (lines) as they depend on the geometrical orientation of the capillary forces. Lowering the surface energy by 0.1 J/m2 will shift all data down (0.08 units) and therefore also shift the data related to a truncation into the nontruncated region and vice versa if increased. Fitting optimization and data for a fitted surface energy of 1.22 ± 0.1 J/m2 are provided as Supporting Information for visual reference.
Using the solid–vapor surface energy as a fitting parameter for our data to the model, we are able to compare the experimentally optimum surface energy with the theoretical predictions made with different reconstructions and methods. Our fitted surface energy of the nanowire sidewall of 1.22 J/m2 is close to the theoretical prediction for the energy of the dangling bonds of the unreconstructed {101̅0} GaAs surface (1.3 J/m2).34 Under the condition that the liquid–solid interfaces are similar and that the edge energy is neglected, we provide insight into the fundamental crystal surface property by combining theoretical models and experimental data. While this is an experimental estimation, it is important to note that the surface energy is a key factor for the nucleation theory of crystal growth.7,22 To further develop the theory behind crystal growth, it is of importance to narrow the large interval of surface energies predicted by theoretical estimations (ranging from 0.435 to 1.3 J/m234).
While our model is based on a force balance of surface tensions, eq 1 can be derived by minimization of surface energies.38 Although surface tensions and surface energies are not directly interchangeable for an interface to a solid, the comparable values for liquid–solid interface energies indicate that the difference is small. By comparing our experimental data for both truncated and flat interfaces, we can extract values that are very similar to the predicted surface energies for Au–GaAs and GaAs–vapor interfaces for the facets of interest.
To conclude, we have theoretically assessed the truncation formation as a result of droplet stability on the top of a nanowire by addressing the possibility of forming a truncation of the droplet–nanowire interface. Experimentally, we have demonstrated an increased wetting stability of the droplet, allowing for larger ratios between the surface tension and solid surface energy as an effect of forming a truncation. By combining our model with in situ TEM observations of Au-assisted growth of wurtzite GaAs nanowires, we evaluated the surface energies involved and estimated γsl,0001̅ limited by 0.6 J/m2 and γsv,101̅0 as 1.22 J/m2. This demonstrates that the combination of in situ growth observations and theoretical models is a powerful mean to assess important material parameters for which there are wide variances in theoretical calculations and limited experimental validation.
Methods
In Situ Nanowire Growth and Droplet Expansion. The nanowire growth of wurtzite GaAs was initiated from 30 nm aerosol generated Au-particles deposited onto microelectro-mechanical chip with electron transparent SiNx windows (Norcada Inc.). The growth was conducted in an aberration-corrected (CEOS B-COR) Hitachi HF3300S environmental transmission electron microscope, operated with a cold field emission gun with the acceleration voltage of 300 keV. Crystal growth at the elevated temperature proceeded the introduction of tri-methyl-gallium (TMGa) and arsine (AsH3) through the sample holder. To promote precursor decomposition, the sample area was local heated to 420 °C by resistively heating of an embedded tungsten coil surrounding the SiNx windows. The droplet volume was increased by increasing the partial pressure of TMGa an order of magnitude from 10–4 Pa while keeping the AsH3 partial pressure constant at 1 Pa. The partial pressures were calibrated by correlating the column pressure (Inficon MPG400 pressure gauge) with residual gas analysis (SRS RGA 300) for known flows of precursor material as presented in previous work.29,30 Continuous recording with 50 ms exposure time allowed tracking of the projected droplet volume over time.
X-ray Energy Dispersive Spectroscopy. Prior to any experiment, the Au content of each droplet studied was measured using X-ray energy dispersive spectroscopy (26 and 28 at. % for the measurements presented within the letter). Any change in volume was then attributed to Ga and was estimated by measuring the change in projected droplet volume for individual frames. The approach resulted in Ga composition ranging from 22 to 70 at. % Ga over the course of the experiments. On the basis of reference X-ray energy dispersive spectroscopy, we extracted the Au content and thus the following changes in droplet volume were attributed to change in Ga content, which is in agreement with earlier report on volume–composition relation.29 The X-ray signal was collected for 60 s using a silicon drift detector (X-MaxN 80T, Oxford Instruments) protected by a Moxtek AP window and quantified using virtual standards based on kα,Si-factors and the Cliff-Lorimer thin-foil approach using the K- and L-lines of Ga (kK,Ga = 1.603) and Au (kL,Au= 2.721), respectively.39 In this Letter, the uncertainty interval for the X-ray EDS measurement, combining uncertainty of the experimental measurement and the uncertainty of the internal quantification using the Aztec software (Oxford Instruments), is approximately 1 at. %.
Surface Energy Estimation. On the basis of the composition, we estimated the surface tension based on linear combination of the surface energy of Au31 and Ga.32 By sorting the collected data depending on the interface morphology (truncated or flat corner), we fitted the solid–vapor surface energy, based on the surface tension, to agree with our observations. Further experimental details on volume extraction and surface energy estimations are presented as Supporting Information.
Acknowledgments
The authors acknowledge financial support from the Knut and Alice Wallenberg Foundation (KAW), NanoLund, and the Swedish Research Council (VR).
Supporting Information Available
The Supporting Information is available free of charge at https://pubs.acs.org/doi/10.1021/acs.jpclett.0c00387.
Recording of incorporation of gallium into the droplet (AVI)
High resolution close-up on truncation event (AVI)
Model derivation; droplet wetting angle as a function experiment progression in time correlated with interface geometry imaging and growth; volume and surface tension estimation; estimation of surface energies (PDF)
The authors declare no competing financial interest.
Supplementary Material
References
- Joyce H. J.; Wong-Leung J.; Gao Q.; Tan H. H.; Jagadish C. Phase Perfection in Zinc Blende and Wurtzite III-V Nanowires Using Basic Growth Parameters. Nano Lett. 2010, 10, 908. 10.1021/nl903688v. [DOI] [PubMed] [Google Scholar]
- Björk M. T.; Ohlsson B. J.; Sass T.; Persson A. I.; Thelander C.; Magnusson M. H.; Deppert K.; Wallenberg L. R.; Samuelson L. One-dimensional Heterostructures in Semiconductor Nanowhiskers. Appl. Phys. Lett. 2002, 80, 1058–1060. 10.1063/1.1447312. [DOI] [Google Scholar]
- Venkatesan S.; Madsen M. H.; Schmid H.; Krogstrup P.; Johnson E.; Scheu C. Direct observation of interface and nanoscale compositional modulation in ternary III-As heterostructure nanowires. Appl. Phys. Lett. 2013, 103, 1–5. 10.1063/1.4818338. [DOI] [Google Scholar]
- Namazi L.; Nilsson M.; Lehmann S.; Thelander C.; Dick K. A. Selective GaSb Radial Growth on Crystal Phase Engineered InAs Nanowires. Nanoscale 2015, 7, 10472–10481. 10.1039/C5NR01165E. [DOI] [PubMed] [Google Scholar]
- Zou J.; Paladugu M.; Wang H.; Auchterlonie G. J.; Guo Y. N.; Kim Y.; Gao Q.; Joyce H. J.; Tan H. H.; Jagadish C. Growth mechanism of truncated triangular III-V nanowires. Small 2007, 3, 389–393. 10.1002/smll.200600503. [DOI] [PubMed] [Google Scholar]
- Im H. S.; Jung C. S.; Park K.; Jang D. M.; Lim Y. R.; Park J. Band gap tuning of twinned GaAsP ternary nanowires. J. Phys. Chem. C 2014, 118, 4546–4552. 10.1021/jp500458j. [DOI] [Google Scholar]
- Glas F.; Harmand J. C.; Patriarche G. Why Does Wurtzite Form in Nanowires of III-V Zinc Blende Semiconductors?. Phys. Rev. Lett. 2007, 99, 146101. 10.1103/PhysRevLett.99.146101. [DOI] [PubMed] [Google Scholar]
- Gamalski A. D.; Ducati C.; Hofmann S. Cyclic supersaturation and triple phase boundary dynamics in germanium nanowire growth. J. Phys. Chem. C 2011, 115, 4413–4417. 10.1021/jp1095882. [DOI] [Google Scholar]
- Dubrovskii V. G. Influence of the Group V Element on the Chemical Potential and Crystal Structure of Au-catayzed III-V Nanowires. Appl. Phys. Lett. 2014, 104, 053110. 10.1063/1.4864276. [DOI] [Google Scholar]
- Nebol’sin V. A.; Shchetinin A. A. Role of Surface Energy in the Vapor-Liquid-Solid Growth of Silicon. Inorg. Mater. 2003, 39, 899–903. 10.1023/A:1025588601262. [DOI] [Google Scholar]
- Roper S. M.; Anderson A. M.; Davis S. H.; Voorhees P. W.; Roper S. M.; Anderson A. M.; Davis S. H.; Voorhees P. W. Radius selection and droplet unpinning in vapor-liquid-solid-grown nanowires. J. Appl. Phys. 2010, 107, 114320. 10.1063/1.3434403. [DOI] [Google Scholar]
- Schwarz K. W.; Tersoff J. From Droplets to Nanowires: Dynamics of Vapor-Liquid-Solid Growth. Phys. Rev. Lett. 2009, 102, 1–4. 10.1103/PhysRevLett.102.206101. [DOI] [PubMed] [Google Scholar]
- Wang J.; Plissard S.; Hocevar M.; Vu T. T. T.; Zehender T.; Immink G. G. W.; Verheijen M. A.; Haverkort J.; Bakkers E. P. A. M. Position-controlled [100] InP Nanowire Arrays. Appl. Phys. Lett. 2012, 100, 053107. 10.1063/1.3679136. [DOI] [Google Scholar]
- Tornberg M.; Dick K. A.; Lehmann S. Thermodynamic Stability of Gold-Assisted InAs Nanowire Growth. J. Phys. Chem. C 2017, 121, 21678–21684. 10.1021/acs.jpcc.7b06138. [DOI] [Google Scholar]
- Young T. An Essay on the Cohesion of Fluids. Philos. Trans. R. Soc. London 1805, 95, 65–87. 10.1098/rstl.1805.0005. [DOI] [Google Scholar]
- Voronkov V. V. Process at the boundary of crystalization front.pdf. Kristallografiya 1974, 19, 922–929. [Google Scholar]
- Makkonen L. Young’s equation revisited. J. Phys.: Condens. Matter 2016, 28, 135001. 10.1088/0953-8984/28/13/135001. [DOI] [PubMed] [Google Scholar]
- Nebol’sin V. A.; Dunaev A. I.; Tatarenkov A. F.; Shmakova S. S. Scenarios of stable Vapor-Liquid Droplet-Solid Nanowire growth. J. Cryst. Growth 2016, 450, 207–214. 10.1016/j.jcrysgro.2016.01.033. [DOI] [Google Scholar]
- Dubrovskii V. G. Development of Growth Theory for Vapor-Liquid-Solid Nanowires: Contact Angle, Truncated Facets, and Crystal Phase. Cryst. Growth Des. 2017, 17, 2544–2548. 10.1021/acs.cgd.7b00076. [DOI] [Google Scholar]
- Ghisalberti L.; Potts H.; Friedl M.; Zamani M.; Güniat L.; Tütüncüoglu G.; Carter W. C.; Fontcuberta A. Questioning liquid droplet stability on nanowire tips: from theory to experiment. Nanotechnology 2019, 30, 285604. 10.1088/1361-6528/ab139c. [DOI] [PubMed] [Google Scholar]
- Davidson F. M.; Lee D. C.; Fanfair D. D.; Korgel B. A. Lamellar Twinning in Semiconductor Nanowires. J. Phys. Chem. C 2007, 111, 2929. 10.1021/jp0672205. [DOI] [Google Scholar]
- Wen C. Y.; Tersoff J.; Hillerich K.; Reuter M. C.; Park J. H.; Kodambaka S.; Stach E. A.; Ross F. M. Periodically Changing Morphology of the Growth Interface in Si, Ge, and GaP Nanowires. Phys. Rev. Lett. 2011, 107, 1–4. 10.1103/PhysRevLett.107.025503. [DOI] [PubMed] [Google Scholar]
- Jacobsson D.; Panciera F.; Tersoff J.; Reuter M. C.; Lehmann S.; Hofmann S.; Dick K. A.; Ross F. M. Interface Dynamics and Crystal Phase Switching in GaAs Nanowires. Nature 2016, 531, 317. 10.1038/nature17148. [DOI] [PMC free article] [PubMed] [Google Scholar]
- Kim W.; Dubrovskii V. G.; Vukajlovic-plestina J.; Francaviglia L.; Gu L.; Potts H.; Friedl M.; Leran J.-b.; Fontcuberta A.; et al. Bistability of Contact Angle and Its Role in Achieving Quantum-Thin Self-Assisted GaAs nanowires. Nano Lett. 2018, 18, 49. 10.1021/acs.nanolett.7b03126. [DOI] [PubMed] [Google Scholar]
- Oh S. H.; Chisholm M. F.; Kauffmann Y.; Kaplan W. D.; Luo W.; Rühle M.; Scheu C. Oscillatory Mass Transport in Vapor-Liquid-Solid Growth of Sapphire Nanowires. Science 2010, 330, 489–493. 10.1126/science.1190596. [DOI] [PubMed] [Google Scholar]
- Cirlin G. E.; Dubrovskii V. G.; Samsonenko Y. B.; Bouravleuv A. D.; Durose K.; Proskuryakov Y. Y.; Mendes B.; Bowen L.; Kaliteevski M. A.; Abram R. A. Self-catalyzed, Pure Zincblende GaAs Nanowires Grown on Si(111) by Molecular Beam Epitaxy. Phys. Rev. B: Condens. Matter Mater. Phys. 2010, 82, 035302. 10.1103/PhysRevB.82.035302. [DOI] [Google Scholar]
- Dubrovskii V. G.; Sibirev N. V.; Harmand J. C.; Glas F. Growth Kinetics and Crystal Structure of Semiconductor Nanowires. Phys. Rev. B: Condens. Matter Mater. Phys. 2008, 78, 235301. 10.1103/PhysRevB.78.235301. [DOI] [Google Scholar]
- Kelrich A.; Sorias O.; Calahorra Y.; Kauffmann Y.; Gladstone R.; Cohen S.; Orenstein M.; Ritter D. InP Nanoflag Growth from a Nanowire Template by in Situ Catalyst Manipulation. Nano Lett. 2016, 16, 2837–2844. 10.1021/acs.nanolett.6b00648. [DOI] [PubMed] [Google Scholar]
- Maliakkal C. B.; Jacobsson D.; Tornberg M.; Persson A. R.; Johansson J.; Wallenberg R.; Dick K. A. In situ analysis of catalyst composition during gold catalyzed GaAs nanowire growth. Nat. Commun. 2019, 10, 4577. 10.1038/s41467-019-12437-6. [DOI] [PMC free article] [PubMed] [Google Scholar]
- Maliakkal C. B.; Mårtensson E. K.; Tornberg M.; Jacobsson D.; Persson A. R.; Johansson J.; Wallenberg R.; Dick K. A. Independent Control of Nucleation and Layer Growth in Nanowires. ACS Nano 2020, 10.1021/acsnano.9b09816. [DOI] [PMC free article] [PubMed] [Google Scholar]
- Novakovic R.; Ricci E.; Gnecco F. Surface and Transport Properties of Au-In Liquid Alloys. Surf. Sci. 2006, 600, 5051–5061. 10.1016/j.susc.2006.08.024. [DOI] [Google Scholar]
- Hardy S. C. The Surface Tension of Liquid Gallium. J. Cryst. Growth 1985, 71, 602–606. 10.1016/0022-0248(85)90367-7. [DOI] [Google Scholar]
- Sakong S.; Du Y. A.; Kratzer P. Atomistic modeling of the Au droplet-GaAs interface for size-selective nanowire growth. Phys. Rev. B: Condens. Matter Mater. Phys. 2013, 88, 1–9. 10.1103/PhysRevB.88.155309. [DOI] [Google Scholar]
- Sibirev N. V.; Timofeeva M. a.; Bol’shakov a. D.; Nazarenko M. V.; Dubrovskii V. G. Surface energy and crystal structure of nanowhiskers of III–V semiconductor compounds. Phys. Solid State 2010, 52, 1531–1538. 10.1134/S1063783410070309. [DOI] [Google Scholar]
- Leitsmann R.; Bechstedt F. Surface Influence on Stability and Structure of Hexagon-Shaped III-V Semiconductor Nanorods. J. Appl. Phys. 2007, 102, 1–9. 10.1063/1.2783899. [DOI] [Google Scholar]
- Galicka M.; Bukała M.; Buczko R.; Kacman P. Modelling the Structure of GaAs and InAs Nanowires. J. Phys.: Condens. Matter 2008, 20, 454226. 10.1088/0953-8984/20/45/454226. [DOI] [Google Scholar]
- Pankoke V.; Kratzer P.; Sakong S. Calculation of the Diameter-dependent Polytypism in GaAs Nanowires from an Atomic Motif Expansion of the Formation Energy. Phys. Rev. B: Condens. Matter Mater. Phys. 2011, 84, 075455. 10.1103/PhysRevB.84.075455. [DOI] [Google Scholar]
- Roura P.; Fort J. Local thermodynamic derivation of Young’s equation. J. Colloid Interface Sci. 2004, 272, 420–429. 10.1016/j.jcis.2004.01.028. [DOI] [PubMed] [Google Scholar]
- Cliff G.; Lorimer G. The Quantitative Analysis of Thin Specimens. J. Microsc. 1975, 103, 203. 10.1111/j.1365-2818.1975.tb03895.x. [DOI] [Google Scholar]
Associated Data
This section collects any data citations, data availability statements, or supplementary materials included in this article.