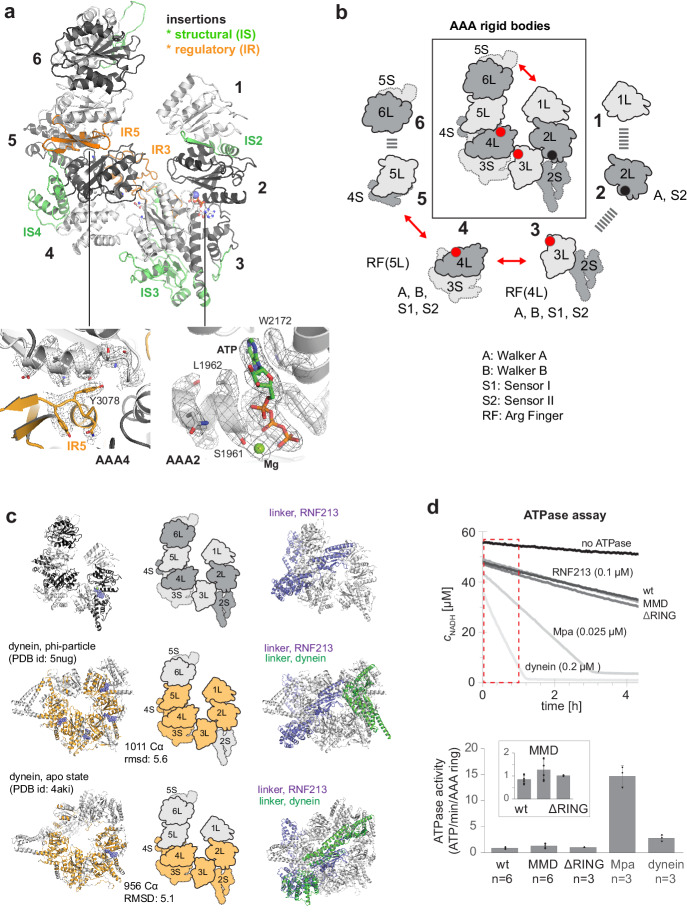
Figure 2. AAA core adopts a dynein-like fold.
(a) Organization of the 6 AAA domains, shown in alternating gray tones, highlighting insertions with structural (IS, green) and regulatory (IR, orange) roles. Orientation is similar as in Figure 1c. The insets below illustrate the EM density of the IR5 motif blocking via Tyr3078 nucleotide binding to AAA4 and the ATP molecule tightly bound at AAA2 (also shown in Video 1). (b) Schematic cartoon of the ATPase core emphasizing the AAA ‘rigid bodies’ formed between the L domain of one and the S domain of the previous unit (Wang et al., 2001). The catalytically competent ATPase sites (red dots), the ATP-bound AAA2 (black dot), and the respective functional motifs for ATP binding and hydrolysis are indicated. (c) Structural superposition of RNF213 (top row) with two dynein states (Phi particle, middle; apo dynein, bottom). The left panel illustrates the aligned dynein domains (orange), the middle shows the corresponding cartoon of the matching RNF213 AAA portions, and the right panel highlights the upstream linker of RNF213 (lilac) superimposed with phi-particle and apo dynein structures (AAA core, grey; linker, green). (d) ATPase assay comparing RNF213 variants with dynein and a processive ATPase, the unfoldase Mpa. The top panel illustrates representative NADH decay curves, with used protein concentrations being indicated. The region for calculating reaction rates is highlighted in red. The lower panel quantifies the respective ATPase rates calculated per AAA ring. Rates for tested RNF213 variants are also shown enlarged. Error bars indicate standard deviation.
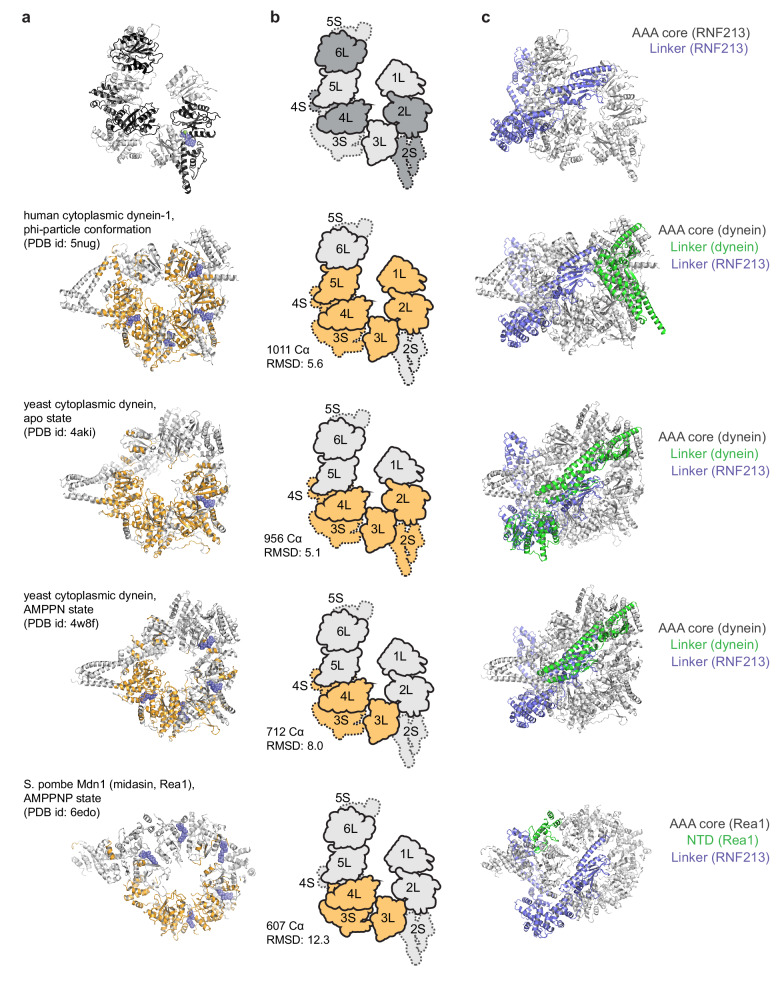
Figure 2—figure supplement 1. Structural comparison of RNF213 with dynein-like proteins, containing 6 AAA units in a single polypeptide.
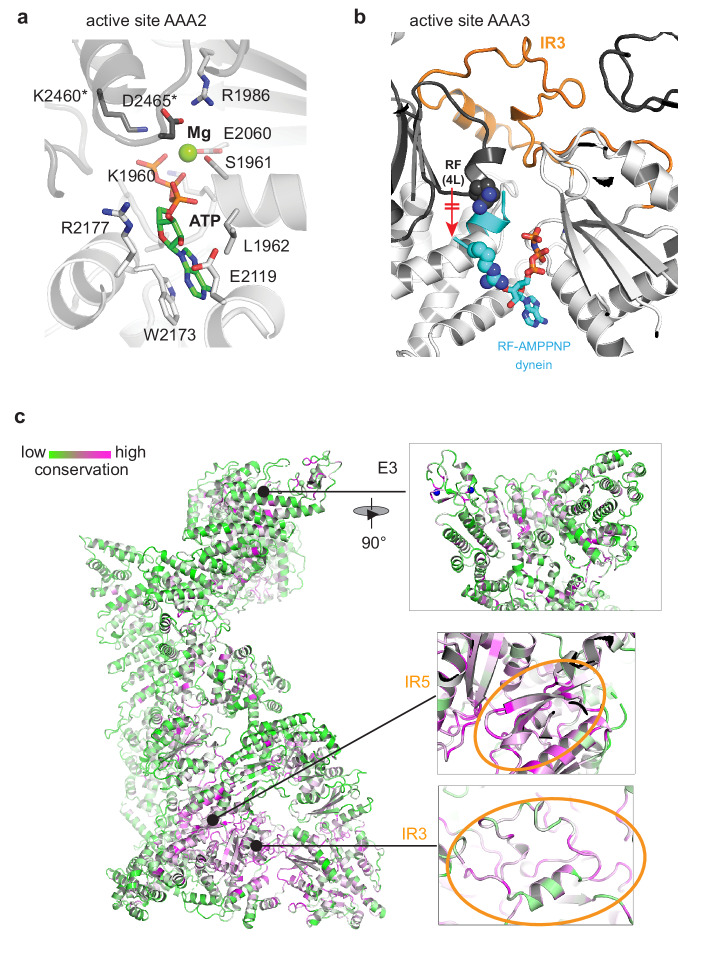
Figure 2—figure supplement 2. Conservation pattern of RNF213 mapped to the cryo-EM structure.
Figure 2—figure supplement 3. Structural comparison of RNF213 and Rea1.


