

Abstract
Objective
This study aimed to examine 1) if the Strong Hearts, Healthy Communities intervention (SHHC) improved social network members’ (SNMs) weight, exercise, and diet, and 2) if SNMs’ weight and behavioral changes were modified by their relationship closeness and/or spatial closeness with trial participants.
Methods
Eight towns received the SHHC intervention, which focused on building individual healthy behaviors and creating supportive social and built environments for exercise and healthy eating. Eight towns received an education-only control intervention. SNMs (n=487) were recruited to complete a questionnaire at baseline and outcome at six months that asked about demographics, weight, height, exercise, and eating habits.
Results
SHHC’s effect on SNMs differed depending on their relationship closeness with trial participants. Among SNMs who had a very close relationship with trial participants, those associated with intervention group trial participants lost more weight and decreased BMI more than those associated with the control group (weight [kg] between-group difference: Δ=−1.68; 95% CI=−3.10, −0.25; p=0.021; BMI between-group difference: Δ=−0.60; 95% CI=−1.16, −0.04; p=0.034). Spatial closeness did not modify any of SHHC’s ripple effects.
Conclusions
Relationship closeness, rather than spatial closeness, played an important role in influencing a rural community-based intervention’s ripple effects.
Keywords: weight loss, obesity, ripple effect, social network, rural health
Introduction
In the US, rural populations disproportionally experience higher levels of obesity in comparison to their non-rural counterparts (1). This could be partially due to the social challenges faced by rural residents to active living and healthy eating including social isolation (2), limited social support (3–5), abundance of food-centric social events with unhealthy foods (6,7), limited organized outdoor activities (4,8), expectations on duties and caregiving responsibilities (5), and few role models for healthy living (9). Therefore, investigating ways to overcome social barriers to healthy living among rural residents might be an effective way to mitigate rural health disparities. One potential strategy is to engage and support rural residents’ social network members (SNMs) in physical activity and healthy eating.
Increasing evidence has suggested that SNMs can exert influence on behaviors and weight status. Some review studies have found that individuals tend to exhibit concordance with their family members and friends in terms of health behaviors (10) and weight (11). A small but growing number of studies have also suggested that if individuals change their exercise or diet habits, family members might also adopt these new health behaviors (12–17).
In addition, prior cross-sectional studies have shed light on the importance of relationship closeness, rather than spatial closeness, on associations with weight and related behaviors. For example, among spouses, friends, brothers, and sisters of Framingham Heart Study participants, only spouses showed strong concordance in eating patterns over time, despite other family members living in the same household (18). Similarly, some studies found that close relationships, such as those with partners, friends, and family, have greater impacts on weight status than spatial relationships, such as those with neighbors and coworkers (19). Others also suggested that, in comparison to perceived social ties, geographical proximity of networks might have limited influence on obesity status (20,21).
Given that rural populations tend to have closer relationships with others compared to non-rural populations (22), leveraging rural individuals’ closer social ties to influence others’ weight and health behaviors may be a cost-effective strategy to alleviate rural health disparities. However, none of the prior ripple effect studies have focused on rural populations, nor have they investigated how relationship closeness and spatial closeness might play a role in influencing ripple effects within the context of an intervention.
The aim of this study was to examine ripple effects on weight, exercise, and dietary patterns within Strong Hearts, Healthy Communities (SHHC), a rural community-based randomized behavior change intervention trial. We hypothesized that the intervention group’s SNMs would have greater improvement in terms of weight, body mass index (BMI), exercise, and diet quality, compared to the control group’s SNMs. In addition, we further examined whether or not SNMs’ weight and behavioral changes were modified by their relationship closeness and/or spatial closeness with trial participants. Based on findings from prior studies (18–21), we hypothesized that relationship closeness, but not spatial closeness, would have a significant interaction with the SHHC intervention. We further hypothesized that SNMs who had very close relationships with trial participants and were spatially close to these trial participants would have greater weight and behavioral changes.
Methods
Context
This secondary analysis examined ripple effects of a behavior change intervention trial, SHHC, which aimed to reduce cardiovascular disease risk factors among rural US women. From this point onwards, women who participated in the original trial are referred as trial participants. Study protocol, trial participants flow, and trial participant characteristics have been described elsewhere (23,24). Between 2015 and 2016, 194 sedentary midlife and older women with excess weight or obesity participated in the SHHC trial for 24 weeks in 16 medically underserved rural towns in Montana and New York. Our previous findings showed that in comparison to those in the control group, trial participants in the intervention group (SHHC) had statistically significant weight loss, BMI reduction, increased intake of fruit and vegetables combined, and increased walking MET-minutes per week (24,25). The study was approved by Cornell University and Bassett Healthcare Network Institutional Review Boards.
Eight towns received the SHHC intervention (n=101)—a 48-session (twice a week for 24 consecutive weeks) intervention with multiple components that were designed to increase physical activity and improve diet quality. These components included in-class exercise sessions, capacity-building activities, field-based learning, and other activities that were designed to promote positive behavioral changes through cultivating supportive social and built environments. In addition, intervention group trial participants were provided with tips and strategies to engage SNMs in exercise and healthy eating, such as inviting them to try new exercises and healthy foods, engaging them in decision-making, and offering and receiving support from each other. The other eight towns received an education-only control intervention, Strong Hearts, Healthy Women (SHHW), that only provided general information on healthy living (n=93). Trial participants in the SHHW group met once every four weeks for 24 weeks for a total of six sessions.
Data collection
Social network members recruitment
Family members, friends, coworkers, and/or other SNMs were nominated by trial participants on the baseline questionnaire to participate in pre- and post-intervention questionnaires; trial participants provided contact information for each nominated SNM. Trial participants provided SNM nominations and completed baseline data collection prior to randomization. In other words, trial participants did not know their treatment assignment when they provided SNM nominations. All SNMs referred by trial participants were eligible to participate as long as they were at least 18 years old and provided consent. There were no BMI or weight eligibility criteria for SNMs. SNMs gave written consent on the first page of the social network baseline online survey. Of the entire trial participant sample, the median number of social network referrals was 1 (IQR: [0, 4]). Figure 1 shows the SNMs’ flow through the study.
Figure 1 – Social network members flow of the Strong Hearts, Healthy Communities trial.
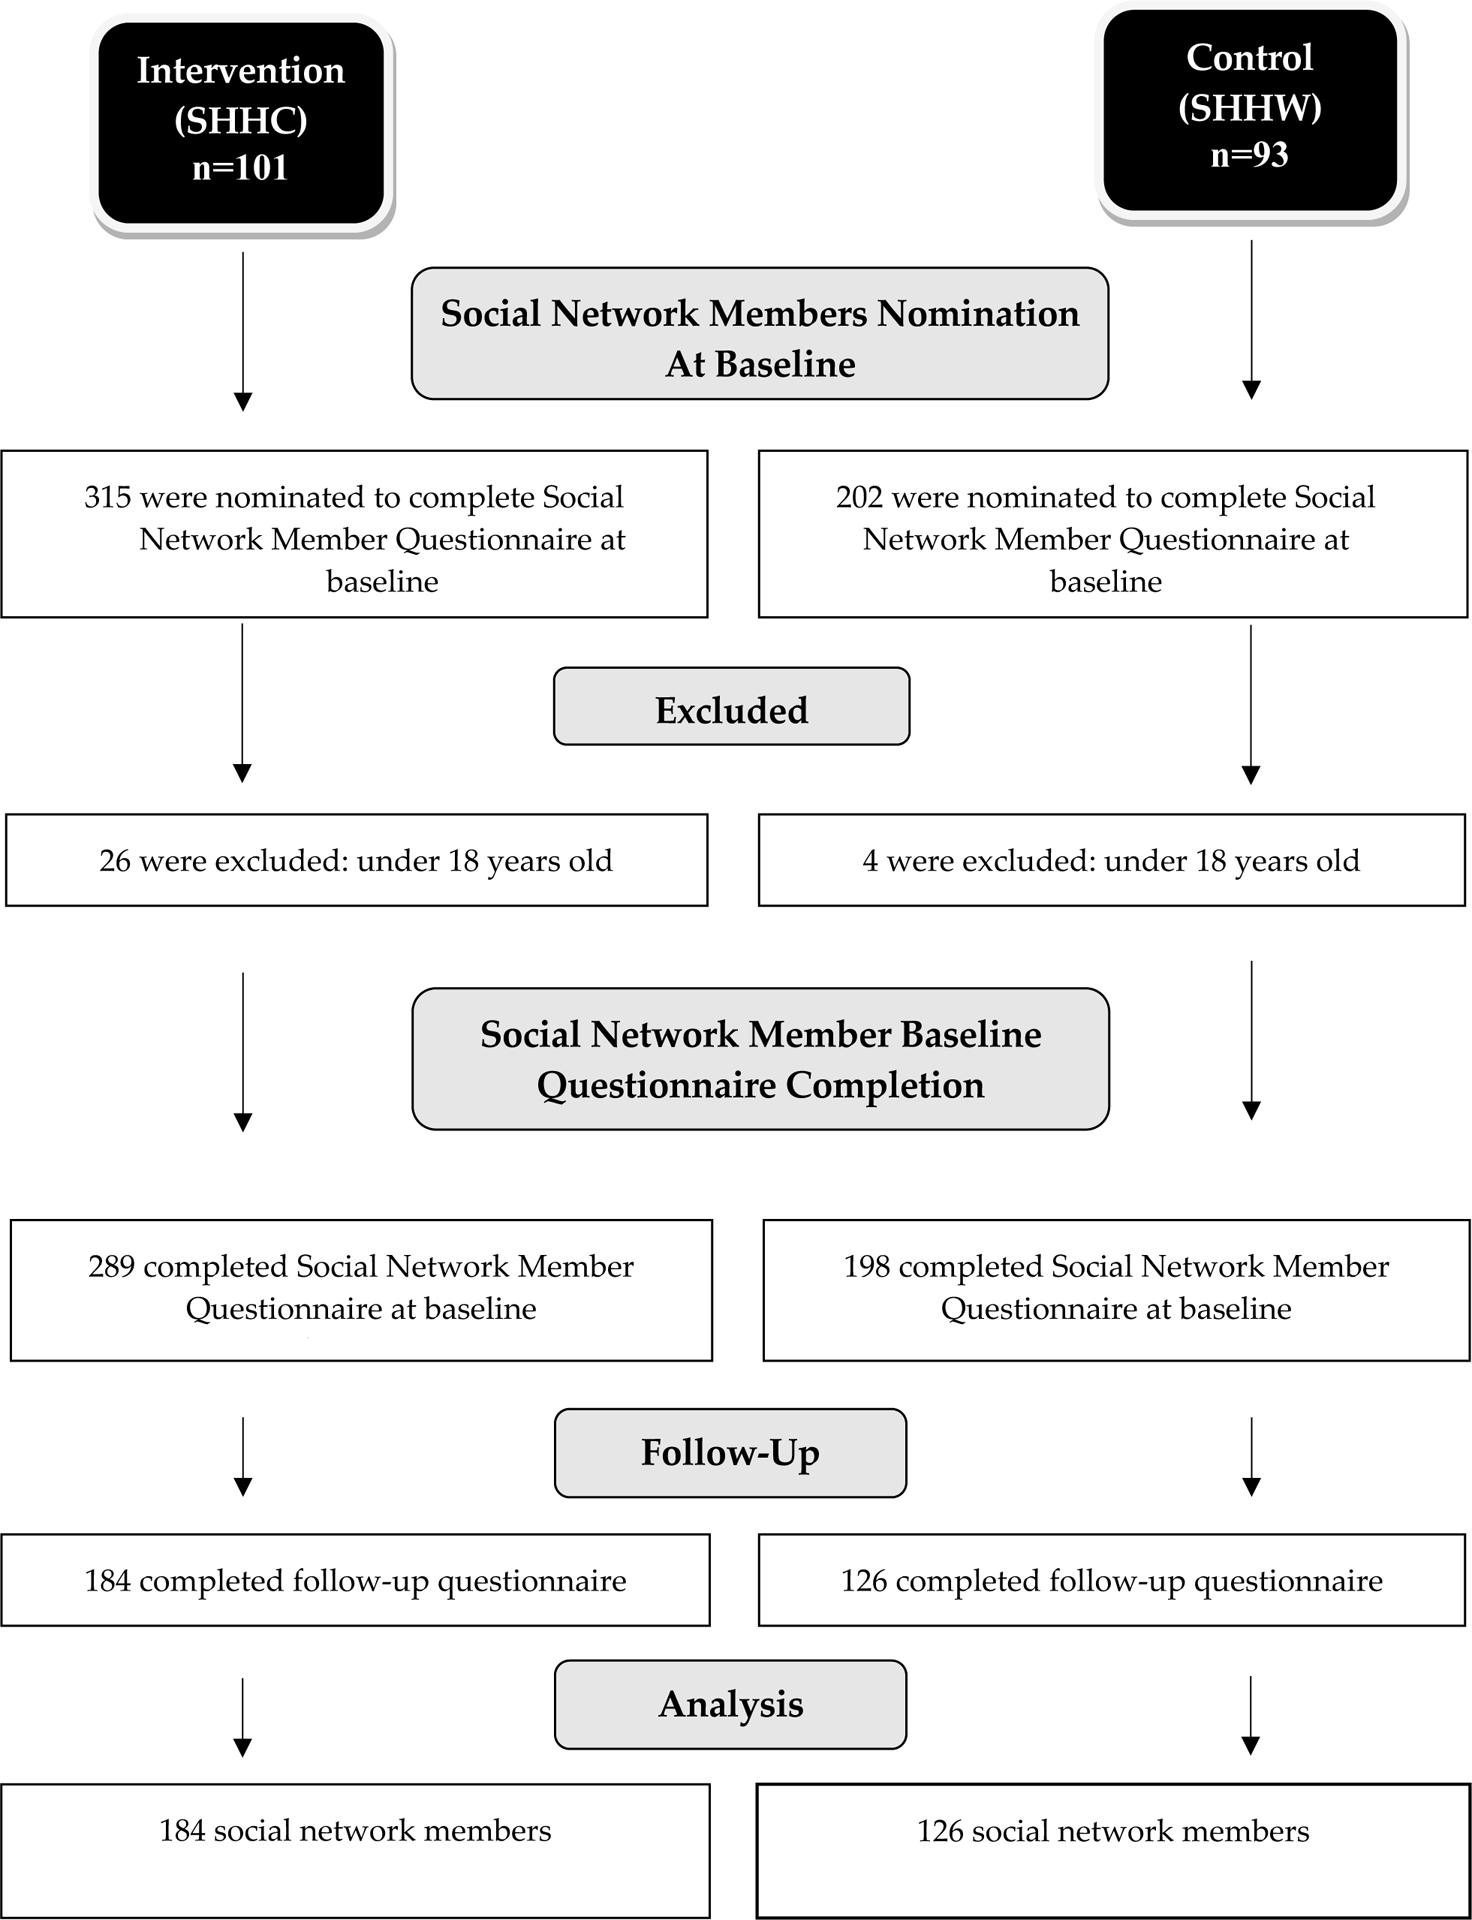
Abbreviations: SHHC, Strong Hearts, Healthy Communities; SHHW, Strong Hearts, Healthy Women
Measures
The SNM questionnaire included questions about demographics including address, weight, height, eating and exercise habits, relationship closeness to trial participant, and psychosocial factors.
To assess relationship closeness, at baseline, SNMs responded to the question “How would you describe your relationship with the Strong Hearts Study participant?,” with the response options ‘very close,’ ‘somewhat close,’ and ‘not very close.’ These three levels of relationship closeness were based on the Convoy Model of Social Relations that suggests social relationships could be divided into three layers: inner circle, middle circle, and outer circle (26). After data collection, we found that 53.9% of the SNMs selected the “very close” option, 37.2% selected the “somewhat close” option, and only 8.8% selected the ‘not very close’ option at baseline. Therefore, SNMs were dichotomized as having a relationship with trial participant that was either ‘very close’ or ‘somewhat or not very close’ to allow easier interpretation of findings.
To assess spatial closeness, we dichotomized SNMs into ‘spatially close’ and ‘not spatially close.’ Those in the spatially close category included SNMs who lived in the same household as trial participants, coworkers, and those who lived within 10-mile driving distance from trial participants. Coworkers were included as being spatially close because people spend a considerable amount of time at work and the work environment has been shown to be related to individuals’ physical activity and diet (27,28). The shortest driving distance between trial participants and their SNMs’ contact addresses was calculated using Google Maps. The 10-mile driving distance cut-off has been used by governmental and social agencies as a proxy to define reasonable travel distance to service amenities in rural communities (e.g. grocery stores, hospitals, and banks) (29–31). Such a cut-off was also the median driving distance between trial participants and their SNMs. Relationship and spatial closeness could be classified for 463 of the 487 SNMs at baseline. There was a modest, but significant (p=0.008), inverse association between the two measures of closeness: being spatially close to trial participants was somewhat less common for SNMs with a very close relationship (134/246=54.5%) than a somewhat/not close relationship (145/217=66.8%).
The International Physical Activity Questionnaire-Short Form (IPAQ-SF) was used to assess SNMs’ physical activity (32). Standard scoring protocol was used to calculate SNMs’ weekly walking MET-minutes, moderate-to-vigorous physical activity (MVPA) MET-minutes, and total MET-minutes (33).
The Rapid Eating Assessment for Patients – Shortened version (REAP-S) was used to assess SNMs’ diet quality (34). This 13-item questionnaire contains questions related to frequency of eating out, skipping breakfast, low consumption of high fiber foods, and consumption of processed foods, meats, oil, sweets, and soda. Responses for each question include 1 point = ‘usually/often,’ 2 points = ‘sometimes,’ and 3 points = ‘rarely/never.’ Food items that were skipped (or answered ‘not applicable to me’) were coded as ‘rarely’ or ‘never.’ Possible sum scores range from 13 to 39, and higher scores indicate better diet quality (35).
BMI was calculated using SNMs’ self-reported weight and baseline height. Implausible weight values were excluded for one SNM who had a baseline weight of 234.3kg (BMI=83.4) and had a weight of 101.6kg at six months (BMI=36.2). Without any medical procedure, it is unrealistic for a normal person to lose more than 100kg in six months through physical activity and diet changes only; therefore, we removed this SNM’s weight and BMI values and treated them as missing values.
Analysis
Baseline characteristics by treatment group were compared for the entire SNM sample, the very close relationship sample, and the spatially close sample. T-tests were used to examine normally distributed continuous variables and Wilcoxon rank-sum tests were used to examine non-normally distributed continuous variables. Baseline demographic differences for categorical variables were examined using Fisher’s exact tests. In case of Fisher’s exact test was not able to be ran, Monte Carlo estimates were used to examine categorical variable differences.
Linear mixed models were used to assess the change of outcomes from baseline to six months in weight, BMI, exercise, and diet between intervention (SHHC) and control groups’ (SHHW) SNMs (Δ outcome of interest = treatment group + control variables + baseline value of outcome). To test whether relationship closeness moderated the effects of the treatment on body weight and behavior outcomes, an interaction term was used between treatment group (intervention vs. control) and relationship closeness (very close vs. somewhat or not very close) (Δ outcome of interest = treatment group + treatment group*relationship closeness + relationship closeness + control variables + baseline value of outcome). Similarly, to test whether spatial closeness moderated the effects of the treatment on body weight and behavior outcomes, an interaction term was used between treatment group (intervention vs. control) and spatial closeness (spatially close vs. not spatially close) (Δ outcome of interest = treatment group + treatment group*spatial closeness + spatial closeness + control variables + baseline value of outcome).
For outcomes in which SHHC intervention group trial participants had statistically significant improvements in the original trial in comparison to the control group (i.e. weight, BMI, weekly walking MET-minutes, and diet quality), we conducted sensitivity analyses among (i) SNMs who had a very close relationship to trial participants (Δ outcome of interest = treatment group + treatment group*spatial closeness + spatial closeness + control variables + baseline value of outcome) and (ii) those who were spatially close to trial participants (Δ outcome of interest = treatment group + treatment group*relationship closeness + relationship closeness + control variables + baseline value of outcome).
All linear mixed models controlled for SNMs’ age, sex, education, relationship status, employment status, self-rated health, and baseline value of outcome of interest (see Table 1). We also controlled for trial participants’ program attendance. Trial program sites and trial participants’ unique identification number were also included in all models and were treated as random effects to control for the clustering effects of trial program sites and the possible correlation between SNMs referred by the same trial participant. Model assumptions were checked and met. Collinearity diagnostics indicated no violations among the independent variables in the present study, in which all variance inflation factors (VIFs) were under 2.
Table 1.
Baseline characteristics of trial participants’ social network members
| Characteristic | Overall | Very Close Relationship | Spatially Close | ||||||||||||||||||||||||||||
|---|---|---|---|---|---|---|---|---|---|---|---|---|---|---|---|---|---|---|---|---|---|---|---|---|---|---|---|---|---|---|---|
| Intervention | Control | p-value | Intervention | Control | p-value | Intervention | Control | p-value | |||||||||||||||||||||||
| n | Mean (SD) or % | n | Mean (SD) or % | n | Mean (SD) or % | n | Mean (SD) or % | n | Mean (SD) or % | n | Mean (SD) or % | ||||||||||||||||||||
| Age | 270 | 49.1 (16.6) | 186 | 45.1 (14.0) | 0.007a | 155 | 47.6 (17.5) | 88 | 44.7 (15.3) | 0.202a | 13 8 | 50.9 (16.4) | 12 4 | 46.7 (14.2) | 0.027a | ||||||||||||||||
| Weight (kg) | 273 | 81.0 (19.3) | 188 | 83.3 (19.1) | 0.202b | 160 | 81.3 (19.7) | 88 | 87.0 (20.7) | 0.051b | 13 9 | 82.9 (19.5) | 12 8 | 84.2 (19.3) | 0.667b | ||||||||||||||||
| BMI | 244 | 29.2 (6.6) | 155 | 29.9 (6.7) | 0.286b | 142 | 28.8 (6.3) | 76 | 30.5 (7.1) | 0.119b | 12 6 | 29.5 (6.2) | 10 6 | 30.3 (6.8) | 0.486b | ||||||||||||||||
| Sex | |||||||||||||||||||||||||||||||
| Male | 50 | 17.9 | 32 | 16.6 | 0.805c | 40 | 24.5 | 25 | 27.5 | 0.654c | 30 | 21.4 | 26 | 19.8 | 0.766c | ||||||||||||||||
| Female | 229 | 82.1 | 161 | 83.4 | 123 | 75.5 | 66 | 72.5 | 11 0 | 78.6 | 10 5 | 80.2 | |||||||||||||||||||
| Education | |||||||||||||||||||||||||||||||
| High school or less | 107 | 38.2 | 63 | 32.6 | 0.657c | 71 | 43.3 | 32 | 35.2 | 0.218c | 63 | 44.4 | 43 | 32.8 | 0.256c | ||||||||||||||||
| Associate degree | 64 | 22.9 | 47 | 24.4 | 36 | 22.0 | 17 | 18.7 | 34 | 23.9 | 36 | 37.5 | |||||||||||||||||||
| Bachelor’s degree | 63 | 22.5 | 49 | 25.4 | 36 | 22.0 | 31 | 34.1 | 25 | 17.6 | 27 | 20.6 | |||||||||||||||||||
| Postgraduate degree | 46 | 16.4 | 34 | 17.6 | 21 | 12.8 | 11 | 12.1 | 20 | 14.1 | 25 | 19.1 | |||||||||||||||||||
| Relationship Status | |||||||||||||||||||||||||||||||
| In a relationship | 204 | 72.6 | 150 | 77.7 | 0.237c | 121 | 73.8 | 73 | 80.2 | 0.285c | 10 3 | 72.5 | 10 1 | 77.1 | 0.406c | ||||||||||||||||
| Not in a relationship | 77 | 27.4 | 43 | 22.3 | 43 | 26.2 | 18 | 19.8 | 39 | 27.5 | 30 | 22.9 | |||||||||||||||||||
| Employment Status | |||||||||||||||||||||||||||||||
| Employed | 188 | 67.1 | 149 | 77.2 | 0.018c | 99 | 61.1 | 69 | 75.8 | 0.019c | 97 | 67.8 | 10 1 | 77.1 | 0.105c | ||||||||||||||||
| Not employed | 92 | 32.9 | 44 | 22.8 | 63 | 38.9 | 22 | 24.2 | 46 | 32.2 | 30 | 22.9 | |||||||||||||||||||
| Self-rated Health Status | |||||||||||||||||||||||||||||||
| Excellent or very good | 157 | 55.9 | 89 | 46.1 | 0.106c | 90 | 54.9 | 43 | 47.3 | 0.484c | 80 | 55.9 | 57 | 43.5 | 0.115c | ||||||||||||||||
| Good | 86 | 30.6 | 74 | 38.3 | 50 | 30.5 | 34 | 37.4 | 43 | 30.1 | 52 | 39.7 | |||||||||||||||||||
| Fair or poor | 38 | 13.5 | 30 | 15.5 | 24 | 14.6 | 14 | 15.4 | 20 | 14.0 | 22 | 16.8 | |||||||||||||||||||
| Walking MET-minutes per week | 277 | 702.0 (907.6) | 196 | 660.9 (928.0) | 0.171b | 159 | 708.8 (880.6) | 90 | 676.4 (910.2) | 0.391b | 14 0 | 778.6 (1023.1) | 13 2 | 631.9 (938.4) | 0.126b | ||||||||||||||||
| Moderate-to-vigorous Physical Activity MET-minutes per week | 264 | 1440.7 (2029.0) | 196 | 1142.6 (1851.9) | 0.017b | 154 | 1540.3 (1932.6) | 90 | 1478.5 (2426.2) | 0.041b | 13 3 | 1566.2 (2225.3) | 13 3 | 1114.0 (1944.0) | 0.012b | ||||||||||||||||
| Total MET-minutes per week | 260 | 2151.0 (2406.1) | 194 | 1792.1 (2305.1) | 0.026b | 150 | 2244.5 (2241.9) | 88 | 2137.9 (2921.5) | 0.057b | 13 2 | 2356.0 (2649.0) | 13 2 | 1718.0 (2385.0) | 0.015b | ||||||||||||||||
| REAP-S sum score | 289 | 30.0 (4.7) | 198 | 28.4 (5.3) | 0.001a | 170 | 29.9 (4.6) | 92 | 28.3 (5.3) | 0.010a | 14 6 | 29.4 (5.3) | 13 3 | 28.4 (5.3) | 0.095a | ||||||||||||||||
| Relationship type between trial participants and social network members | |||||||||||||||||||||||||||||||
| Spouse | 24 | 8.3 | 15 | 7.6 | 0.074d | 24 | 14.1 | 15 | 16.3 | 0880c | 19 | 13.0 | 14 | 10.5 | 0.722c | ||||||||||||||||
| Parent | 13 | 4.5 | 13 | 6.6 | 13 | 7.6 | 11 | 12.0 | 7 | 4.8 | 6 | 4.5 | |||||||||||||||||||
| Child | 48 | 16.6 | 22 | 11.1 | 45 | 26.5 | 20 | 21.7 | 17 | 11.6 | 10 | 7.5 | |||||||||||||||||||
| Other relatives | 42 | 14.5 | 19 | 9.6 | 29 | 17.1 | 14 | 15.2 | 12 | 8.2 | 8 | 6.0 | |||||||||||||||||||
| Friend | 90 | 31.1 | 65 | 32.8 | 31 | 18.2 | 15 | 16.3 | 43 | 29.5 | 40 | 30.1 | |||||||||||||||||||
| Coworker | 29 | 10.0 | 36 | 18.2 | 7 | 4.1 | 4 | 4.3 | 29 | 19.9 | 36 | 27.1 | |||||||||||||||||||
| Othere | 43 | 14.9 | 28 | 14.1 | 21 | 12.4 | 13 | 14.1 | 19 | 13.0 | 19 | 14.3 | |||||||||||||||||||
t-test;
Wilcoxon rank-sum test;
Fisher’s Exact Test;
Monte Carlo Estimate for Fisher’s Exact Test;
Included those who indicated two or more relationship types with trial participants; Significant p-values are indicated in bold; BMI: body mass index.
Examination of missing data revealed that the proportion of missing data of our dependent variables (i.e. changes in weight [kg], BMI, weekly walking MET-min, weekly MVPA MET-min, weekly total MET-min, and REAP score) ranged between 37.2% and 48.0%. This was largely due to lost to follow-up of SNMs (36.3%). This was not surprising as SNMs were not our primary target audience of the original SHHC trial. SNMs might have been less motivated to complete follow-up data collection activities.
We examined differences between SNMs who completed the follow-up survey and those who did not. We found similar demographic characteristics between them in terms of their baseline BMI, relationship status, education level, employment status, and self-rated health (all p>0.05). However, those who returned for follow-up surveys were younger than those who did not (mean age: 46.2 vs 49.8, p=0.020). It was challenging to distinguish between missing at random and missing not at random without responses from non-respondents. As we found no major demographic differences between SNMs that had available dependent variables and those who did not, we used a multiple imputation approach that assumes missing at random.
SAS (PROC MI) was used to handle missing data with an imputation model that included the variables used in the analysis, including the interaction terms, to impute SNMs’ baseline demographic variables (i.e. covariates). Thirty datasets were imputed and SAS PROC MIANALYZE was used to pool the estimates from individual datasets. We did not impute the dependent variables (i.e. changes in weight [kg], BMI, weekly walking MET-minutes, weekly MVPA MET-minutes, weekly total MET-minutes, and REAP score) because imputing dependent variables without knowing useful auxiliary variables would not provide useful information but would add uncertainties to our data which, would in turn increase the standard errors (36,37).
Analyses were conducted using SAS version 9.4 (SAS Institute Inc., Cary, NC, USA). All tests were two-sided, and p<0.05 was used as the cutoff for statistical significance.
Results
Table 1 shows SNMs’ baseline characteristics.
Of the 487 SNMs, 289 (59.3%) were referred by intervention group trial participants and 198 (40.7%) by control group trial participants; 135 (27.7%) were family members (child, spouse, or parent), and 352 (72.3%) were friends and others.
There were differences between groups at baseline in the entire social network sample as well as within the two sensitivity tests sub-samples. Among the entire social network sample, while the intervention group’s SNMs were older (49.1 vs. 45.1, p=0.007), a higher proportion of the control group’s SNMs were employed than those related to the intervention group (77.2% vs. 67.1%, p=0.018). For baseline physical activity and diet, intervention group SNMs had higher levels of weekly MVPA MET-minutes (1440.7 vs. 1142.6, p=0.017), weekly total MET-minutes (2151.0 vs. 1792.1, p=0.026), and REAP-S sum score (30.0 vs. 28.4, p=0.001). For those in the very close relationship sample, a greater proportion of the control group’s SNMs were employed (75.8% vs. 61.1%, p=0.019); the intervention group’s SNMs had higher baseline weekly MVPA MET-minutes (1540.3 vs. 1478.5, p=0.041) and REAP-S sum score (29.9 vs. 28.3, p=0.010) than those related to the control group. For those in the spatially close sample, the intervention group’s SNMs were older (50.9 vs. 46.7, p=0.027) and had higher baseline levels of weekly MVPA MET-minutes (1566.2 vs. 1114.0, p=0.012) and total MET-minutes (2356.0 vs. 1718.0, p=0.015).
Weight, BMI, physical activity, and dietary changes among social network members
Overall, we did not observe any difference between intervention and control groups’ SNMs in weight (between-group difference [kg]: Δ=−0.96; 95% CI=−2.34, +0.42; p=0.172), BMI (between-group difference: Δ=−0.40; 95% CI=−0.99, +0.19; p=0.184), walking MET-minutes (between-group difference: Δ=+88.26, 95% CI=−155.49, +332.02; p=0.478), MVPA MET-minutes (between-group difference: Δ=−173.74; 95% CI=−690.6, +343.14 p=0.510), total MET-minutes (between-group difference: Δ=−242.13, 95% CI=−878.74, +394.48; p=0.456), or REAP-S score (between-group difference: Δ=+0.15; 95% CI=−1.16, +1.47; p=0.821).
Interaction terms testing
Table 2 summarizes findings of the interaction terms testing.
Table 2.
Summary of interaction testing findings
| Interaction terms | Outcomes of interest | |||||
|---|---|---|---|---|---|---|
| Δ Weight (kg) | Δ BMI | Δ Weekly walking MET-minutes | Δ Weekly moderate-to-vigorous activity MET-minutes | Δ Weekly total MET-minutes | Δ REAP-S sum score | |
| Among all social network members (n ranged from 253 to 306) | ||||||
| Relationship closeness*treatment group |
✓ (p=0.030) |
✗ (p=0.050) |
✗ (p=0.975) |
✗ (p=0.429) |
✗ (p=0.551) |
✓ (p=0.007) |
| Spatial closeness*treatment group | ✗ (p=0.132) |
✗ (p=0.208) |
✗ (p=0.401) |
✗ (p=0.771) |
✗ (p=0.507) |
✗ (p=0.291) |
| Social network members who had a very close relationship with trial participants (n ranged from 143 to 173) | ||||||
| Spatial closeness*treatment group |
✓ (p=0.046) |
✗ (p=0.097) |
✓ (p=0.027) |
n/a | n/a | ✗ (p=0.151) |
| Social network members who were spatially close to trial participants (n ranged from 155 to 185) | ||||||
| Relationship closeness*treatment group | ✗ (p=0.473) |
✗ (p=0.292) |
✗ (p=0.132) |
n/a | n/a |
✓ (p=0.012) |
Significant p-values are indicated in bold. ✓ indicates statistically significant interaction terms. ✗ indicates statistically insignificant interaction terms. All models controlled for social network members’ age, sex, education, relationship status, employment status, self-rated health, trial participants’ program attendance, and baseline value of outcome of interest as fixed effects. Trial program sites and trial participants’ identification number were treated as random effects in all models.
Weight and BMI
Among the entire SNM sample, the interaction between relationship closeness and treatment group was statistically significant for weight change (kg) (p=0.030) and marginally statistically significant for BMI change (p=0.050); the interaction between spatial closeness and treatment group was not statistically significant for either weight change (kg) (p=0.132) nor BMI change (p=0.208) (Table 2). Between-group comparisons revealed that among those who had a very close relationship with trial participants, the intervention group’s SNMs lost more weight and decreased BMI more than those associated with control group trial participants (weight [kg] between-group difference: Δ=−1.68; 95% CI=−3.10, −0.25; p=0.021; BMI between-group difference: Δ=−0.60; 95% CI=−1.16, −0.04; p=0.034) (Table 3).
Table 3.
Adjusted least square means for between-group comparisons: weight and BMI changes
| Within-group change (intervention) | Within-group change (control) | Between-group difference (intervention - control) | ||
|---|---|---|---|---|
| Mean Change (95% CI) | Mean Change (95% CI) | Mean Change (95% CI) | p-value | |
| Among all social network members | ||||
| Weight (kg) | ||||
| Very close relationship (intervention n=102; control n=60) | −1.52 (−2.61, −0.44) | +0.15 (−1.17, +1.48) | −1.68 (−3.10, −0.25) | 0.021 |
| Somewhat or not very close relationship (intervention n=68; control n=55) | +0.27 (−1.09, +1.62) | −0.14 (−1.61, +1.32) | +0.41 (−1.26, +2.08) | 0.630 |
| Spatially close (intervention n=94, control n=77) | −0.70 (−1.86, +0.46) | −0.38 (−1.64, +0.89) | −0.32 (−1.74, +1.10) | 0.658 |
| Not spatially close (intervention n=76, control n=38) | −1.39 (−2.63, −0.14) | +0.48 (−1.09, +2.06) | −1.87 (−3.59, −0.14) | 0.034 |
| BMI | ||||
| Very close relationship (intervention n=94; control n=49) | −0.47 (−0.87, −0.06) | +0.14 (−0.37, +0.64) | −0.60 (−1.16, −0.04) | 0.034 |
| Somewhat or not very close relationship (intervention n=63; control n=47) | +0.14 (−0.38, +0.65) | −0.004 (−0.56, +0.55) | +0.14 (−0.50, +0.78) | 0.670 |
| Spatially close (intervention n=90, control n=67) | −0.18 (−0.64, +0.27) | −0.02 (−0.53, +0.49) | −0.17 (−0.76, +0.42) | 0.579 |
| Not spatially close (intervention n=67, control n=29) | −0.50 (−1.00, −0.01) | +0.20 (−0.46, +0.85) | −0.70 (−1.44, +0.04) | 0.063 |
| Among social network members who had a very close relationship with trial participants | ||||
| Weight (kg) | ||||
| Spatially close (intervention n=56, control n=37) | −1.43 (−2.96, +0.11) | −0.91 (−2.71, +0.90) | −0.52 (−2.57, +1.52) | 0.617 |
| Not spatially close (intervention n=46, control n=23) | −2.07 (−3.69, −0.45) | +1.21 (−0.94, +3.35) | −3.28 (−5.57, −0.99) | 0.005 |
| BMI | ||||
| Spatially close (intervention n=52, control n=32) | −0.33 (−0.91, +0.24) | −0.11 (−0.80, +0.59) | −0.23 (−1.03, +0.57) | 0.574 |
| Not spatially close (intervention n=42, control n=17) | −0.66 (−1.27, −0.04) | +0.52 (−0.35, +1.40) | −1.18 (−2.12, −0.24) | 0.014 |
| Social network members who were spatially close to trial participants | ||||
| Weight (kg) | ||||
| Very close relationship (intervention n=53, control n=37) | −0.89 (−2.09, +0.31) | −0.50 (−1.90, +0.89) | −0.39 (−1.93, +1.15) | 0.619 |
| Somewhat or not very close relationship (intervention n=40, control n=42) | +0.37 (−1.13, +1.87) | −0.02 (−1.50, +1.47) | +0.39 (−1.21, +1.99) | 0.631 |
| BMI | ||||
| Very close relationship (intervention n=49, control n=32) | −0.21 (−0.64, +0.21) | −0.07 (−0.59, +0.44) | −0.14 (−0.71, +0.44) | 0.635 |
| Somewhat or not very close relationship (intervention n=38, control n=36) | +0.21 (−0.33, +0.75) | −0.08 (−0.63, +0.46) | +0.30 (−0.29, +0.88) | 0.321 |
Significant p-values are indicated in bold. All models controlled for social network members’ age, sex, education, relationship status, employment status, self-rated health, trial participants’ program attendance, and baseline value of outcome of interest as fixed effects. Trial program sites and trial participants’ identification number were treated as random effects in all models.
The interaction between spatial closeness and treatment group was only marginally statistically significant within the very close relationship sample for weight change (kg) (p=0.046), but not BMI change (p=0.097) (Table 2). Among those who were not spatially close but had a very close relationship with trial participants, the intervention group’s SNMs lost weight and decreased BMI while weight and BMI increased for those associated with the control group trial participants (weight [kg] between-group difference: Δ=−3.28; 95% CI=−5.57, −0.99; p=0.005; BMI between-group difference: Δ=−1.18; 95% CI=−2.12, −0.24; p=0.014) (Table 3).
Exercise
For exercise, only the interaction between spatial closeness and treatment group for change in weekly walking MET-minutes within the very close relationship sample was found to be statistically significant (p=0.027) (Table 2). Among those who had a very close relationship with trial participants but were not spatially close, the intervention group’s SNMs increased their weekly walking MET-minutes, while those associated with control group trial participants decreased their walking (between-group difference: Δ=+557.98; 95% CI=+76.22, +1039.75; p=0.023) (Table 4).
Table 4.
Adjusted least square means for between-group comparisons: physical activity changes
| Within-group change (intervention) | Within-group change (control) | Between-group difference (intervention - control) | ||
|---|---|---|---|---|
| Mean Change (95% CI) | Mean Change (95% CI) | Mean Change (95% CI) | p-value | |
| Among all social network members | ||||
| Weekly walking MET-minutes | ||||
| Very close relationship (intervention n=103; control n=61) | +87.58 (−149.18, +324.34) | −10.39 (−303.47, +282.68) | +97.98 (−210.95, +406.90) | 0.534 |
| Somewhat or not very close relationship (intervention n=70; control n=63) | +161.30 (−140.88, +463.48) | +70.51 (−238.93, +379.96) | +90.79 (−255.55, +437.13) | 0.607 |
| Spatially close (intervention n=98, control n=83) | +104.70 (−153.51, +362.91) | +86.48 (−180.48, +353.43) | +18.22 (−274.93, +311.38) | 0.903 |
| Not spatially close (intervention n=75, control n=41) | +105.51 (−167.52, +378.54) | −116.10 (−457.93, +225.73) | +221.61 (−150.68, +593.90) | 0.243 |
| Weekly moderate-to-vigorous MET-minutes | ||||
| Very close relationship (intervention n=98, control n=60) | +613.62 (+105.30, +1121.94) | +612.83 (−9.65, +1235.31) | +0.787 (−659.44, +661.02) | 0.998 |
| Somewhat or not very close relationship (intervention n=66, control n=58) | +502.31 (−145.53, +1150.15) | +895.30 (+223.83, +1566.77) | −392.99 (−1145.77, +359.78) | 0.306 |
| Spatially close (intervention n=93, control n=79) | +693.39 (+149.44, +1237.33) | +890.44 (+311.81, +1469.08) | −197.06 (−830.53, +436.42) | 0.542 |
| Not spatially close (intervention n=71, control n=39) | +408.30 (−176.88, +993.49) | +456.95 (−281.02, +1194.93) | −48.65 (−851.73, +754.43) | 0.906 |
| Weekly total MET-minutes | ||||
| Very close relationship (intervention n=95, control n=59) | +742.85 (+120.00, +1365.69) | +819.90 (+59.60, +1580.21) | −77.06 (−886.77, +732.65) | 0.852 |
| Somewhat or not very close relationship (intervention n=65, control n=58) | +761.89 (−32.52, +1556.30) | +1200.55 (+375.86, +2025.24) | −438.66 (−1365.53, +488.21) | 0.354 |
| Spatially close (intervention n=92, control n=78) | +867.70 (+201.69, +1533.71) | +1227.93 (+519.20, +1936.65) | −360.23 (−1133.44, +412.99) | 0.361 |
| Not spatially close (intervention n=68, control n=39) | +572.59 (−145.03, +1290.21) | +518.89 (−371.78, +1409.57) | +53.69 (−927.03, +1034.42) | 0.915 |
| Social network members who had a very close relationship with trial participants | ||||
| Weekly walking MET-minutes | ||||
| Spatially close (intervention n=52, control n=36) | −89.19 (−418.04, +239.67) | +87.23 (−298.02, +472.49) | −176.42 (−607.91, +255.07) | 0.423 |
| Not spatially close (intervention n=51, control n=25) | +14.99 (−334.83, +364.80) | −543.00 (−1005.85, −80.15) | +557.98 (+76.22, +1039.75) | 0.023 |
| Social network members who were spatially close to trial participants | ||||
| Weekly walking MET-minutes | ||||
| Very close relationship (intervention n=52, control n=36) | −101.30 (−425.58, +222.98) | +124.12 (−255.75, +503.99) | −225.43 (−654.48, +203.63) | 0.303 |
| Somewhat or not very close relationship (intervention n=46, control n=46) | +63.03 (−332.27, +458.33) | −160.66 (−540.42, +219.09) | +223.69 (−184.25, +631.64) | 0.283 |
Significant p-values are indicated in bold. All models controlled for social network members’ age, sex, education, relationship status, employment status, self-rated health, trial participants’ program attendance, and baseline value of outcome of interest as fixed effects. Trial program sites and trial participants’ identification number were treated as random effects in all models.
Diet
Although we observed a statistically significant interaction between relationship closeness and treatment group on diet changes within the entire SNM sample (p=0.007) and among those who were spatially close (p=0.012) (Table 2), post-hoc between-group comparisons did not observe any meaningful dietary change differences (Table 5).
Table 5.
Adjusted least square means for between-group comparisons: diet changes
| Within-group change (intervention) | Within-group change (control) | Between-group difference (intervention - control) | ||
|---|---|---|---|---|
| Mean Change (95% CI) | Mean Change (95% CI) | Mean Change (95% CI) | p-value | |
| Among all social network members | ||||
| REAP-S sum score | ||||
| Very close relationship (intervention n=111, control n=62) | −0.23 (−1.33, +0.86) | +0.62 (−0.70, +1.93) | −0.85 (−2.34, +0.64) | 0.264 |
| Somewhat or not very close relationship (intervention n=72, control n=61) | +0.66 (−0.72, +2.03) | −0.97 (−2.42, +0.48) | +1.63 (−0.08, +3.34) | 0.063 |
| Spatially close (intervention n=106, control n=82) | −0.06 (−1.19, +1.08) | +0.18 (−1.06, +1.42) | −0.24 (−1.67, +1.19) | 0.746 |
| Not spatially close (intervention n=77, control n=41) | +0.14 (−1.09, +1.36) | −0.69 (−2.18, +0.81) | +0.82 (−0.90, +2.54) | 0.348 |
| Social network members who had a very close relationship with trial participants | ||||
| REAP-S sum score | ||||
| Spatially close (intervention n=60, control ln=37) | −0.05 (−1.47, +1.38) | +1.81 (+0.08, +3.55) | −1.86 (−3.85, +0.13) | 0.066 |
| Not spatially close (intervention n=51, control n=25) | +0.13 (−1.45, +1.71) | +0.10 (−1.90, +2.10) | +0.10 (−2.11, +2.30) | 0.932 |
| Social network members who were spatially close to trial participants | ||||
| REAP-S sum score | ||||
| Very close relationship (intervention n=57, control n=37) | −0.36 (−1.76, +1.03) | +1.37 (−0.28, +3.02) | −1.73 (−3.64, +0.17) | 0.075 |
| Somewhat or not very close relationship (intervention n=46, control n=45) | +0.51 (−1.26, +2.28) | −0.78 (−2.50, +0.95) | +1.29 (−0.72, +3.29) | 0.208 |
Significant p-values are indicated in bold. All models controlled for social network members’ age, sex, education, relationship status, employment status, self-rated health, trial participants’ program attendance, and baseline value of outcome of interest as fixed effects. Trial program sites and trial participants’ identification number were treated as random effects in all models.
Discussion
When comparing outcome changes between intervention and control group trial participants’ SNMs, we did not find any statistically significant ripple effect on weight, BMI, exercise, or diet changes. These findings are in contrast with some prior studies (12–17). This could be due to different study designs and participant selection. In particular, while prior studies only focused on the ripple effect among spouses and partners, our SNM sample also included trial participants’ parents, children, friends, coworkers, and others.
We also examined whether there was effect modification by relationship closeness and/or the spatial closeness between trial participants and their SNMs. We found that SNMs who had a very close relationship with intervention group trial participants lost weight and reduced their BMI in comparison to those that had a very close relationship with control group trial participants. These findings also apply to a sub-sample of SNMs who were either overweight or obese at baseline. Weight and BMI improvements among the intervention group’s SNMs may have resulted from their increased weekly walking MET-minutes. We found that SNMs’ weight and BMI changes were negatively associated with their weekly walking MET-minute changes (p<0.05). These findings mirror intervention group trial participants’ improvements in weight, BMI, and self-reported weekly walking MET-minutes (24,25). When intervention group trial participants experienced positive changes, they might have been more likely to share information with their close SNMs, be role models, and provide encouragement for behavior changes. Such an observation is similar to a few studies that suggested relationship closeness might play a bigger role in influencing SNMs’ weight and behaviors than SNMs’ spatial proximity (19–21). In addition, a reciprocal relationship may have existed between trial participants and SNMs’ walking behaviors: while the number of trial participants’ SNM referrals was positively associated with trial participants’ walking minute improvements (β=+13.01, 95%CI=+2.62, +23.41; p=0.015), SNMs’ improved walking minutes were also positively associated with trial participants’ walking improvements, although the magnitude was small (β=+0.07, 95%CI=+0.01, +0.14; p=0.022).
In contrast to our hypothesis, our sensitivity analyses did not find any ripple effects among SNMs who were both socially and spatially close to trial participants (mainly trial participants’ spouses). This could be due to the different health goals and activity preferences between trial participants and their spouses. For example, rural women in some studies commented that their husband did not perceive walking as exercise and did not like to socialize (38). In addition, rural men in our formative work expressed that for physical activity, they preferred team sports and outdoor activities in the countryside, such as hunting and fishing (4). In other words, trial participants’ increased engagement in walking might not be of interest to their spouses in these rural communities.
Interestingly, SNMs who had a very close relationship with trial participants but were not spatially close, mirrored trial participants’ weight loss and improved walking patterns. These SNMs were mainly female and were trial participants’ adult children or other relatives. In comparison to trial participants’ spouses, these SNMs might have similar health goals and exercise preferences; therefore, trial participants might be able to influence them to make positive behavioral changes.
The present study did not find any meaningful dietary improvements among trial participants’ SNMs. This is similar to the dietary outcomes in the trial participants as well, where only a slight increase of the intervention group’s fruit and vegetables combined intake was observed in comparison to the control group (between-group difference [cups daily]: Δ=+0.60; 95% CI=+0.1, +1.1; p=0.026) (25). In fact, within-group analyses of the original trial found that the intervention group’s fruit and vegetables combined intake did not change significantly after the intervention (within-group difference [cups daily]: Δ=+0.1; 95% CI=−0.2, +0.5; p=0.529) (25). When intervention group trial participants did not make significant dietary improvements, it is very unlikely to generate a ripple effect to SNMs. Our process evaluation found that intervention group trial participants found it challenging to eat healthfully while needing to accommodate family members’ food preferences (39).
This study has limitations to be noted. First, SNMs self-reported their height, weight, exercise, and diet, and may have been subject to measurement error. Second, the SNM sample was referred by trial participants; therefore, our SNM sample might have been biased towards certain types of relationships, such as spouses, children, friends, and coworkers. Although the SNM sample was collected prior to randomization, future studies should include purposeful variation in relationship types to help further understand the association between SNM characteristics and intervention outcomes. Third, since our SNM sample might have known about the study, social desirability bias might exist in self-reporting data. Fourth, the majority of the SNMs were female, white, and were with excess weight and obesity. Findings might not be generalizable to other populations. Fifth, although this study provides important insights into factors that influence an intervention’s ripple effects, mechanisms that contributed to SNMs’ weight loss and behavior changes are still unclear. Future studies should examine how social dynamics contribute to weight loss and behavior change, particularly among individuals who are spatially distant but have a very close relationship. Findings will inform how to best utilize social networks to generate bigger intervention impacts. Finally, because this was an exploratory secondary analysis of the original SHHC study, we did not adjust p-values for multiple testing; this might have increased type I error rate (40). Further hypotheses testing is needed in future studies.
Conclusion
Our study contributes new understanding related to ripple effects, demonstrating that relationship closeness, rather than spatial closeness, plays an important role in influencing SNMs’ weight and health behaviors. Exploring ways to engage SNMs who are in close relationships with intervention participants, independent of spatial proximity, could improve reach, impact, and cost-effectiveness of programs.
What is already known about this subject?
People can influence their social network members’ weight and health behaviors.
No prior study has examined the ripple effects of rural behavior change interventions nor how relationship closeness and/or spatial closeness influence interventions’ ripple effects.
What does this study add?
Within the context of a rural community-based behavior change intervention, relationship closeness, rather than spatial closeness, played an important role in promoting weight loss and exercise among trial participants’ social network members.
How might your results change the direction of research or the focus of clinical practice?
Exploring ways to engage social network members who are in close relationships with intervention participants might help improve reach and cost-effectiveness of these programs.
Acknowledgements
We are grateful to the rural women and their SNMs who participated in our study and the extension agents from Montana and New York who recruited them, as well as Judy Ward, Kristin Pullyblank, Urshila Sriram, Isabel Lu, Shuling Liu, and Gail Rogers for their work and contributions to this research. Researchers who want to access trial data and other accompanying documents (e.g. informed consent form, statistical analysis plan, etc.) should contact the principal investigator (RAS; r.seguin-fowler@ag.tamu.edu) with a methodologically sound proposal for further analyses. The original trial protocol has previously been published in BMC Public Health (23).
FUNDING:
This research was funded by grant R01 HL120702 from the National Institutes of Health and the National Heart, Lung and Blood Institute (NHLBI) and the United States Department of Agriculture, National Institute of Food and Agriculture, Hatch/Multi State (1013938). The funders/sponsors had no role in the design and conduct of the study; collection, management, analysis, and interpretation of the data; preparation, review, or approval of the manuscript; or decision to submit the manuscript for publication.
Footnotes
CLINICAL TRIAL REGISTRATION:
This study is registered at www.clinicaltrials.gov (NCT02499731).
DISCLOSURE:
The authors declared no conflict of interest.
References
- 1.Lundeen E, Park S, Pan L, O’Toole T, Matthews K, Blanck H. Obesity Prevalence Among Adults Living in Metropolitan and Nonmetropolitan Counties — United States, 2016. https://www.cdc.gov/nchs/data_access/urban_rural.htm. Updated June 1, 2017. Accessed September 9, 2019. [DOI] [PMC free article] [PubMed] [Google Scholar]
- 2.Bove CF, Olson CM. Obesity in low-income rural women: qualitative insights about physical activity and eating patterns. Women Health 2006;44:57–78. [DOI] [PubMed] [Google Scholar]
- 3.Dye CJ, Cason KL. Perceptions of older, low-income women about increasing intake of fruits and vegetables. J Nutr Elder 2006;25:21–41. [DOI] [PubMed] [Google Scholar]
- 4.Morgan EH, Graham ML, Folta SC, Seguin RA. A qualitative study of factors related to cardiometabolic risk in rural men. BMC Public Health 2016;16:305. [DOI] [PMC free article] [PubMed] [Google Scholar]
- 5.Wilcox S, Castro C, King AC, Housemann R, Brownson RC. Determinants of leisure time physical activity in rural compared with urban older and ethnically diverse women in the United States. J Epidemiol Community Health 2000;54:667–672. [DOI] [PMC free article] [PubMed] [Google Scholar]
- 6.Vilaro MJ, Barnett TE, Mathews A, Pomeranz J, Curbow B. Income differences in social control of eating behaviors and food choice priorities among southern rural women in the US: a qualitative study. Appetite 2016;107:604–612. [DOI] [PubMed] [Google Scholar]
- 7.Gustafson A, McGladrey M, Liu E, et al. Examining key stakeholder and community residents’ understanding of environmental influences to inform place-based interventions to reduce obesity in rural communities, Kentucky 2015. J Rural Health 2018;34:388–395. [DOI] [PubMed] [Google Scholar]
- 8.McGannon K, Busanich R, Witcher C, Schinke R. A social ecological exploration of physical activity influences among rural men and women across life stages. Qual Res Sport Exerc Health 2014;6:517–536. [Google Scholar]
- 9.Peterson J, Schmer C, Ward-Smith P. Perceptions of midwest rural women related to their physical activity and eating behaviors. J Community Health Nurs 2013;30:72–82. [DOI] [PubMed] [Google Scholar]
- 10.Meyler D, Stimpson JP, Peek MK. Health concordance within couples: a systematic review. Soc Sci Med 2007;64:2297–2310. [DOI] [PubMed] [Google Scholar]
- 11.Cunningham SA, Vaquera E, Maturo CC, Venkat Narayan KM. Is there evidence that friends influence body weight? A systematic review of empirical research. Soc Sci Med 2012;75:1175–1183. [DOI] [PMC free article] [PubMed] [Google Scholar]
- 12.Aarts F, Radhakishun NN, van Vliet M, et al. Gastric bypass may promote weight loss in overweight partners. J Am Board Fam Med 2015;28:90–96. [DOI] [PubMed] [Google Scholar]
- 13.Woodard GA, Encarnacion B, Peraza J, Hernandez-Boussard T, Morton J. Halo effect for bariatric surgery collateral weight loss in patients’ family members. Arch Surg 2011;146:1185–1190. [DOI] [PubMed] [Google Scholar]
- 14.Willmer M, Berglind D, Thorell A, et al. Changes in BMI and psychosocial functioning in partners of women who undergo gastric bypass surgery for obesity. Obes Surg 2015;25:319–324. [DOI] [PubMed] [Google Scholar]
- 15.Golan R, Schwarzfuchs D, Stampfer MJ, Shai I, DIRECT group. Halo effect of a weight-loss trial on spouses: the DIRECT-Spouse study. Public Health Nutr 2010;13:544–549. [DOI] [PubMed] [Google Scholar]
- 16.Gorin AA, Lenz EM, Cornelius T, Huedo-Medina T, Wojtanowski AC, Foster GD. Randomized controlled trial examining the ripple effect of a nationally available weight management program on untreated spouses. Obesity 2018;26:499–504. [DOI] [PMC free article] [PubMed] [Google Scholar]
- 17.Schierberl Scherr AE, McClure Brenchley KJ, Gorin AA. Examining a ripple effect: do spouses’ behavior changes predict each other’s weight loss? J Obes 2013;2013:297268. [DOI] [PMC free article] [PubMed] [Google Scholar]
- 18.Pachucki MA, Jacques PF, Christakis NA. Social network concordance in food choice among spouses, friends, and siblings. Am J Public Health 2011;101:2170–2177. [DOI] [PMC free article] [PubMed] [Google Scholar]
- 19.Leahey TM, Larose JG, Fava JL, Wing RR. Social influences are associated with BMI and weight loss intentions in young adults. Obesity 2011;19:1157–1162. [DOI] [PMC free article] [PubMed] [Google Scholar]
- 20.Christakis NA, Fowler JH. The spread of obesity in a large social network over 32 years. N Engl J Med 2007;357:370–379. [DOI] [PubMed] [Google Scholar]
- 21.Auld MC. Effect of large-scale social interactions on body weight. J Health Econ 2011;30:303–316. [DOI] [PubMed] [Google Scholar]
- 22.Henning-Smith C, Moscovice I, Kozhimannil K. Differences in social isolation and its relationship to health by rurality. J Rural Health 2019; doi: 10.1111/jrh.12344. [DOI] [PubMed] [Google Scholar]
- 23.Seguin RA, Eldridge G, Graham ML, Folta SC, Nelson ME, Strogatz D. Strong Hearts, Healthy Communities: a rural community-based cardiovascular disease prevention program. BMC Public Health 2016;16:86. [DOI] [PMC free article] [PubMed] [Google Scholar]
- 24.Seguin RA, Paul L, Folta SC, et al. Strong Hearts, Healthy Communities: a community-based randomized trial for rural women. Obesity 2018;26:845–853. [DOI] [PMC free article] [PubMed] [Google Scholar]
- 25.Folta SC, Paul L, Nelson ME, Strogatz D, et al. Changes in diet and physical activity resulting from the Strong Hearts, Healthy Communities randomized cardiovascular disease risk reduction multilevel intervention trial. Int J Behav Nutr Phys Act 2019;16:91. [DOI] [PMC free article] [PubMed] [Google Scholar]
- 26.Antonucci T, Akiyama H. Social networks in adult life and a preliminary examination of the convoy model. J Gerontol 1987;42:519–527. [DOI] [PubMed] [Google Scholar]
- 27.Burke TJ, Dailey SL, Zhu Y. Let’s work out: communication in workplace wellness programs. Int J Workplace Health Manag 2017;10:101–115. [Google Scholar]
- 28.Tabak RG, Hipp JA, Marx CM, Brownson RC. Workplace social and organizational environments and healthy-weight behaviors. PLoS One 2015;10:e0125424. [DOI] [PMC free article] [PubMed] [Google Scholar]
- 29.The Food Trust. The Grocery Gap. http://thefoodtrust.org/what-we-do/administrative/hffi-impacts/the-grocery-gap. Updated 2012. Accessed July 15, 2019. [Google Scholar]
- 30.Lam O, Broderick B, Toor S. How far Americans live from the closest hospital differs by community type. https://www.pewresearch.org/fact-tank/2018/12/12/how-far-americans-live-from-the-closest-hospital-differs-by-community-type/. Updated December 12, 2018. Accessed July 15, 2019. [Google Scholar]
- 31.Joint Economic Committee Democrats, US Senator Martin Heinrich. Investing in rural America: bringing progress and economic opportunity to rural communities. https://www.jec.senate.gov/public/_cache/files/ed5bf0b5-dd14-473f-acdc-fd86ba98a6e1/investing-in-rural-america.pdf. Accessed July 15, 2019. [Google Scholar]
- 32.Craig CL, Marshall AL, Sjöström M, et al. International physical activity questionnaire: 12-country reliability and validity. Med Sci Sports Exerc 2003;25:1381–1395. [DOI] [PubMed] [Google Scholar]
- 33.International Physical Activity Questionnaire. Guidelines for data processing and analysis of the International Physical Activity Questionnaire (IPAQ)-Short and Long Forms. www.ipaq.ki.se. Accessed July 19, 2019. [Google Scholar]
- 34.Gans KM, Risica PM, Wylie-Rosett J, et al. Development and evaluation of the Nutrition Component of the Rapid Eating and Activity Assessment for Patients (REAP): a new tool for primary care providers. J Nutr Educ Behav 2006;38:286–292. [DOI] [PubMed] [Google Scholar]
- 35.Segal-Isaacson CJ, Wylie-Rosett J, Gans KM. Validation of a short dietary assessment questionnaire: the Rapid Eating and Activity Assessment for Participants Short Version (REAP-S). Diabetes Educ 2004;30:774–781. [DOI] [PubMed] [Google Scholar]
- 36.Jakobsen JC, Gluud C, Wetterslev J, Winkel P. When and how should multiple imputation be used for handling missing data in randomised clinical trials - a practical guide with flowcharts. BMC Med Res Methodol 2017;17:162. [DOI] [PMC free article] [PubMed] [Google Scholar]
- 37.Garson G Missing Values Analysis and Data Imputation. North Carolina: Statistical Associates Publishers; 2015. [Google Scholar]
- 38.Hess JM, Davis SM. Increasing community-level social support for physical activity in the rural Southwestern United States. J Public Health. 2019; DOI: 10.1007/s10389-019-01085-1. [DOI] [Google Scholar]
- 39.Sriram U, Sandreuter K, Graham M, et al. Process evaluation of Strong Hearts, Healthy Communities: a rural community-based cardiovascular disease prevention program. J Nutr Educ Behav 2019;51:138–249. [DOI] [PMC free article] [PubMed] [Google Scholar]
- 40.Bender R, Lange S. Adjusting for multiple testing—when and how? J Clin Epidemiol 2001;54:343–349. [DOI] [PubMed] [Google Scholar]